Article

Phenotypic Diversity of Litsea cubeba in Jiangxi China and the Identification of Germplasms with Desirable Characteristics

1
Jiangxi Key Laboratory of Silviculture, College of Forestry, Jiangxi Agricultural University, Nanchang 330045, China
2
East China Woody Fragrance and Flavor Engineering Research Center of NFGA, Nanchang 330045, China
3
Zhejiang Academy of Forestry, Hangzhou 310023, China
*
Authors to whom correspondence should be addressed.
These authors contributed equally to this work.
Forests 2023, 14(12), 2283; https://doi.org/10.3390/f14122283
Submission received: 16 October 2023 / Revised: 8 November 2023 / Accepted: 13 November 2023 / Published: 22 November 2023

Abstract

:
Litsea cubeba (Lour.) Pers. is an important economic tree. We aimed to explore the phenotypic diversity of wild L. cubeba provenances from Jiangxi province and identify the germplasms with desirable characteristics. Nest variance analysis, multiple comparisons, correlation analysis, path analysis, redundancy analysis, and cluster analysis were conducted to compare the phenotypes of 526 wild L. cubeba trees from 27 provenances. We detected significant differences in the growth traits, fruit traits, and essential oil (EO) content of L. cubeba provenances, as well as significant differences in tree height, thousand seed dry weight, and the proportion of five essential oil components (citral, neral, geranial, D-limonene, and citronellal) within the provenances. The fresh fruit yield (FFY) was mainly determined by the ground diameter and the annual average minimum temperature. The EO content was mainly affected by the water content, annual average temperature, longitude, and latitude. The proportion of citral (CitrP) was negatively affected by extreme low temperatures. Four individual L. cubeba trees had a high FFY of over 10.00 kg·tree−1. Two trees had a high EO content exceeding 5%, with their CitrP over 80%. The provenances with high FFY were Guixi and Yushan (2.65 kg·tree−1; 2.89 kg·tree−1). The provenances with a high EO content of about 4.00% were Dayu, Yudu, Ji’an, Xinfeng, and Yushan. The provenance with the highest CitrP level (80.61%) was Ningdu.

1. Introduction

Litsea cubeba (Lour.) Pers., commonly known as mountain pepper, is a dioecious deciduous small tree or shrub in the Lauraceae family, an important woody spice and energy tree species worldwide, as are other members of this family. The fruit of L. cubeba is turquoise during growth between April and July, and it changes from light red to reddish-brown during maturation in August, ultimately appearing atropurpureus and falling away from the tree when it is fully ripened in August or September [1] (Figure 1). Each part of the tree contains essential oil (EO), and the pericarp of fresh fruit contains the most EO. L. cubeba has a wide range of uses, with its fresh fruits and EO being natural seasonings [2]. It has a long history of consumption in Yunnan, Guizhou province, and other parts of China. All parts of the tree have medicinal value and have been demonstrated to have anti-tumor, antibacterial, anti-inflammatory, antioxidant, and sedative properties [3,4,5]. Its EO consists of bioactive substances with broad-spectrum antibacterial properties, which can be used as antibacterial agents or preservatives in the chemical and food industries and as functional compounds in skincare products [6,7,8,9]. The remaining residue after removing EO can be used as feed and food, as well as for extracting kernel oil, which is a promising oil resource [10,11,12]. L. cubeba also has strong drought resistance and adaptability and is a useful pioneer tree species for ecological restoration [13].
L. cubeba is mainly distributed in China, Myanmar, Vietnam, Laos, Cambodia, Thailand, India, and Indonesia. In China, it generally grows in tropical and subtropical areas south of the Yangtze River [14,15]. Most L. cubeba in China grows wild, with scattered source areas, significant regional differences, and rich genetic variations. Jiangxi province is one of the main distribution areas of L. cubeba, with more than 733.33 hm2 of wild L. cubeba forests [16]. However, due to the scattered distribution of forest land, the complex varieties of L. cubeba, their uneven quality, and the exploitation of resources by local industries, the wild L. cubeba germplasm resources in Jiangxi province have been damaged and urgently need to be protected and better utilized.
Previous research on L. cubeba has focused on the extraction of EO [17,18,19], the components of EO [20,21,22,23], and on phenotypic variations with a focus on regional differences in EO yield, EO content, and EO composition [24,25,26]. Prior studies have analyzed the diversity of leaf and fruit traits in L. cubeba and detected extremely rich diversity among and within provenances [27]; explored the changes in the morphology and composition during fruit development [28]; analyzed the changes in EO content and EO components in L. cubeba in Fujian province [29]; and explored the relationship between the fresh fruit yield (FFY) and EO characteristics of wild L. cubeba [30]. The terrain of China is complex and diverse, and there is rich variation among wild L. cubeba provenances. However, the reasons for the diversity of L. cubeba among local areas are not yet clear. In this study, we analyzed 526 individual wild L. cubeba trees from 27 provenances in Jiangxi province, which is a suitable area for L. cubeba growth. We explored the diversity of growth traits, fruit traits, and EO characteristics of wild L. cubeba trees growing in different terrains, analyzed the correlations between phenotypes and narrow-range geographical and climatic factors, and identified excellent provenances and single trees. The aforementioned information holds significance for the collection and conservation of L. cubeba germplasm resources in Jiangxi and provides an important theoretical basis for subsequent cultivation and genetic breeding of L. cubeba.

2. Materials and Methods

2.1. Sampling Sites

Jiangxi province is situated south of the Yangtze River (between 113°34′18″ E and 118°28′56″ E; between 24°29′14″ N and 30°04′43″ N), with a land area of 166,900 km2 (https://www.gov.cn/guoqing/2013-04/02/content_2583729.htm, accessed on 1 January 2023). This province is relatively flat in the north and surrounded by mountains on the other three sides, with rolling hills in the middle and widespread basins and valleys. The whole province is a huge basin that opens to the north and feeds into Poyang Lake. As a typical subtropical monsoon climate region, Jiangxi province is ideal for the development of L. cubeba due to the warm and humid climate conditions. Moreover, due to the special climate conditions formed by particular geomorphic features, wild L. cubeba populations growing in Jiangxi province show rich variation. The geographical location diagram of 27 provenances for sampling in Jiangxi province is shown in Figure 2, and the code of each provenance, its geographical location, and the climatic conditions at each sampling site are listed in Table S1. We located single trees using Two-step Outdoor Assistant (https://www.2bulu.com/, accessed on 1 July 2021) to obtain geographical data and downloaded meteorological data (1991–2020) from the China Meteorological Network (http://www.cma.gov.cn, accessed on 7 October 2021). Among the sampling sites of the 27 provenances, YD had the highest annual average temperature (AAT, °C) and annual average minimum temperature (AAMinT, °C) (20.1 °C, −5.0 °C), LC had the highest annual average maximum temperature (AAMaxT, °C) at 42.2 °C, and LS had the lowest AAT, AAMaxT, and AAMinT (12.2 °C, 31.9 °C, −16.7 °C). Otherwise, the annual average rainfall (AAR, mm) ranged from 208.2 mm (in YX) to 386.8 mm (in ND), and the annual average relative humidity (AARH, %) ranged from 75% (in YD) to 82% (in FZ).

2.2. Materials

In August 2021, we sampled 526 healthy wild female trees of L. cubeba from 27 provenances in Jiangxi province. At each sampling site, at least 15 individual trees were investigated and sampled to detect tree growth and fruit traits. Because we actually needed to randomly find them in a lot of unknown mountains for each provenance, combined with the restriction of environmental factors and fruit characteristics, while each individual tree does not have adequate and mature fruits to extract EO, so that it has been extracted successfully only in 21 provenances, at least three trees of each provenance and approximately 1 kg of fresh mature fruit from each tree (for three EO samples) were randomly selected, as shown in Table S1. The ripe fruit was packed in polyethylene bags and transported to the lab for the subsequent experiments as soon as possible. The distances between individual trees were not shorter than 100 m.

2.3. Methods

2.3.1. Tree Growth

The growth traits of L. cubeba, including tree height (TH, m), trunk diameter at ground level (GD, mm), and crown width (CW, m2) were measured using a box staff, vernier caliper, and meter ruler, respectively.

2.3.2. Fruit Traits

The collected fruit was weighed using an electronic scale, and then the FFY (kg·tree−1) was estimated. The thousand seed fresh weight (TSFW, g) was determined using an electronic scale, and then the seeds (Figure 1) were dried in a DHG-9015A electric constant temperature blast oven (Yiheng, Shanghai, China) to obtain the thousand seed dry weight (TSDW, g), water content (WC, %), pericarp ratio (PR, %), and percarp:kernel (P:K) using the methods described by Munir et al. (2021) [31] and Kattmah et al. (2019) [32]. Each index was determined with three replicates for each tree.

2.3.3. EO Characteristics

The EO was extracted by steam distillation. Briefly, 100 g of fruit and 800 mL of water were added to a round-bottom flask. After boiling, the water was distilled for 150 min. Following distillation, the liquid was accurately separated, and the EO from the fresh fruit was transferred into a brown glass bottle and stored at 4 °C. The chemical components of EO were determined as soon as possible because citral, the main component in the EO of fruit peel, decomposes readily when exposed to light and heat. The chemical components of the EO extracted from the pericarp were determined by 6890B-5977A gas chromatography–mass spectrometry (GC-MS) equipped with an MSD workstation (Agilent, Palo Alto, CA, USA) as described by Fan et al. (2023) [30]. The EO content and components were determined with three replicates for each tree.

2.4. Statistical Analysis

Multiple calculations were used to characterize the phenotypic diversity. Provenance clustering was conducted by hierarchical clustering analyses, aimed at separating the typical provenances with high FFY and EO content and the proportion of citral (CitrP). The heat map of Pearson’s correlation analysis was used to find the relationships between the environmental factors and the phenotypic traits by Origin Pro 2023 (Learning Edition; Origin Lab, Northampton, MA, USA). Multiple stepwise regression path analyses can be used to select the important factors by the direct and indirect path coefficients. Redundancy analysis (RDA) describes the proportion of dependent variable variation in the total dependent variable variation caused by the linear relationships between the dependent and independent variables, which analyzed the reasons for the variation of the dependent variable. When all values of the axis lengths in the detrended correspondence analysis (DCA) were less than 3, RDA could be selected. On the contrary, canonical correlation analysis should have been chosen [33]. The contribution and explanation values can directly reflect the relationship between environmental factors and the phenotypic traits of L. cubeba displayed through Canoco 5.0 (Microcomputer Power, Ithaca, NY, USA). The Shannon–Wiener index (H’) was used to represent the genetic diversity index of each phenotypic trait, calculated by the method of Hamil et al. (2021) [34]. The D-value is the comprehensive score of phenotypic traits obtained through principal component analysis (PCA), the important basis for selecting excellent individual trees, calculated by the formula: D = i = 1 7 ( W i × S i ) , Wi and Si are the weights and scores of each principal component [35].

3. Results

3.1. Phenotypic Variation Characteristics

In this study, three growth traits (TH, GD, and CW) and six fruit traits (FFY, TSFW, TSDW, WC, PR, and P:K) were investigated, and the EO content and the proportion of eight dominant components of EO were determined (Figure 3). The eight EO components were citral (C10H16O), 4-methyl-3-pentenal (C6H10O), 1-(cyclopane carbonyl)piperidin-4-one (C9H13NO2), sabinene (C10H16), D-limonene (C10H16), linalool (C10H18O), citronellal (C10H18O), and 3,7-dimethyl-3,6-octadienal (C10H16O). The proportions of these eight components (out of the total EO) are referred to as CitrP, 4M3PP, 1CCP4OP, SabP, D-LP, LinalP, CitroP, and 3,7-DP, respectively. The proportions of neral (C10H16O) and geranial (C10H16O), two isomeric forms of citral, were included in the statistical analyses.
The coefficient of variation (CV) was the highest for FFY (190.84%), followed by 1CCP4OP (126.91%) and 4M3PP (124.19%), and the lowest for CitrP (4.61%) (Table S2). The character with the highest Shannon–Wiener index (H’) was WC (2.872), and the character with the lowest H’ was FFY (0.002) (Table S2). The remaining 18 phenotypic traits were ranked, from high H’ to low, as follows: PR (2.847) > TSDW (2.810) > TSFW (2.787) > TH (2.652) > P:K (2.578) > GD (2.030) > CW (1.968) > GeranialP (1.569) > EO content (1.568) > CitrP (1.553) > D-LP (1.552) > NeralP (1.549) > LinalP (1.506) > SabP (1.464) > CitroP (1.374) > 3,7-DP (1.270) > 4M3PP (1.270) > 1CCP4OP (1.270). The H’ of fruit traits was slightly greater than the H’ of growth traits, and the H’ of growth traits was also slightly greater than that of EO content and components, indicating that there was greater diversity in the fruit traits of L. cubeba than in its growth traits. The nested variance analysis results (Table S3) show that there are notable differences among provenances in 19 phenotypic traits (p ≤ 0.01), except for GeranialP. Among these traits of L. cubeba, only nine (TH, TSDW, EO content, CitrP, NeralP, GeranialP, D-LP, CitroP, and 3,7-DP) exhibited significant differences within the provenances.

3.1.1. Tree and Fruit Phenotypic Traits

The CVs for the three growth traits of L. cubeba within provenances are shown in Table S4. The CV of CW ranged from 39.54% (ND) to 102.51% (PX), that of GD ranged from 14.03% (TH) to 73.89% (PX), and that of TH ranged from 12.96% (TH) to 56.72% (RJ). For the six fruit traits (Table S5), the CV of FFY ranged from 37.27% (XG) to 268.32% (PX), that of TSFW ranged from 10.38% (SC) to 22.84% (WN), that of TSDW ranged from 14.43% (RJ) to 26.96% (YX), that of WC ranged from 4.95% (SC) to 11.78% (WA), that of PR ranged from 2.56% (SC) to 6.60% (XG), and that of P:K ranged from 13.89% (SC) to 36.28% (LS). The phenotypic variation was relatively small for five fruit traits within the SC provenance, except for FFY.
The variation analysis and multiple comparison of growth traits revealed those showing significant differences among provenances (Tables S2 and S7). The average TH was 4.90 m across all provenances, ranging from 3.06 m (FZ) to 7.07 m (YD). The average GD was 53.90 mm, ranging from 28.04 mm (LH) to 109.80 mm (YS), and the average GD was significantly higher in the YS provenance (109.80 mm) than in the other provenances (28.04–85.83 mm). The average CW was 23.92 m2, ranging from 9.98 m2 (XG) to 40.82 m2 (YS). Overall, the GD and CW were highest in YS and lower in LH. Similarly, the average FFY across all the provenances was 2.40 kg·tree−1, ranging from 0.24 kg·tree−1 in XG to 2.89 kg·tree−1 in YS. Four provenances, namely LP, LC, GX, and YS, had FFYs greater than 2 kg·tree−1, which were much higher than those of the other provenances. The average TSFW was 129.51 g, ranging from 103.14 g (YD) to 153.55 g (LP). The average TSDW was 47.93 g, ranging from 43.28 g (YD) to 157.44 g (WA). The average WC was 62.73%, ranging from 57.75% (YD) to 67.99% (SY). The PR ranged from 74.93% in YD to 84.38% in (SY), with an average across all provenances of 79.36%. The average P:K was 4.06, ranging from 3.09 (YD) to 5.65 in (SY). Among all 27 provenances, SY had the highest values for WC, PR, and P:K, whereas YD had the lowest values for the six fruit traits (Tables S2 and S8).

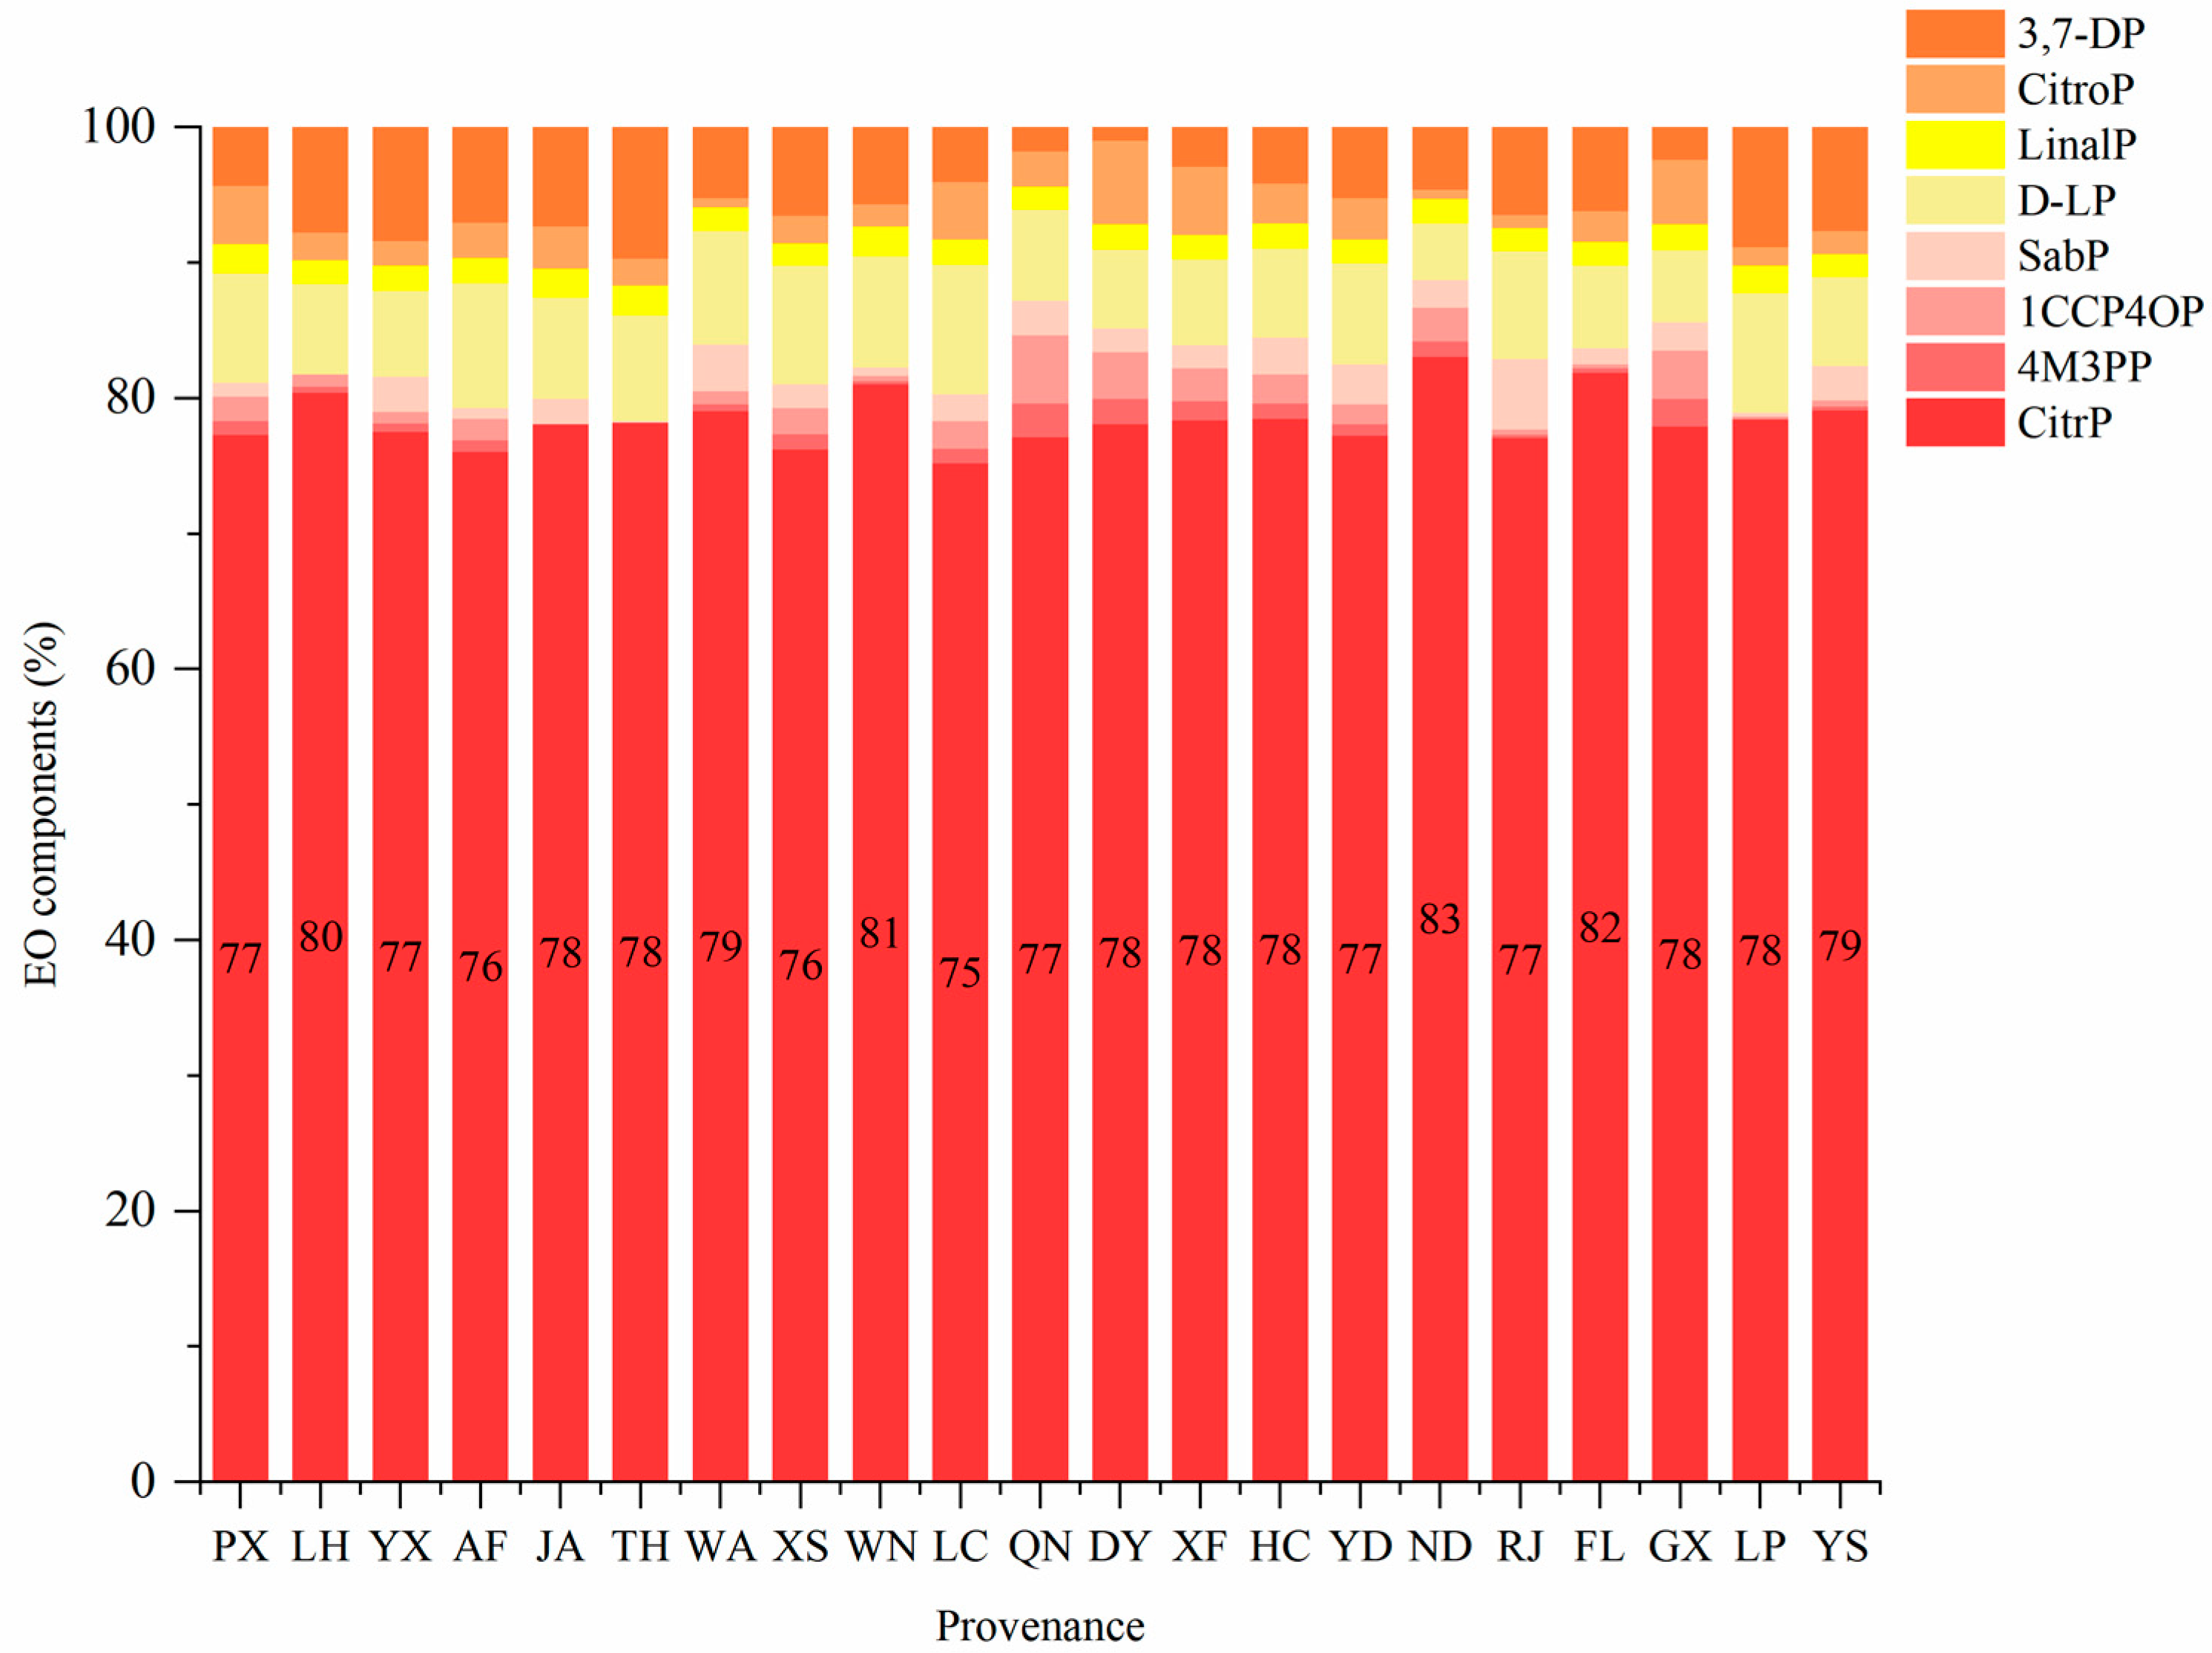
3.1.2. EO Characteristics

The CVs for EO content and components within provenances are shown in Table S6. The LP provenance had the highest CVs of CitrP (6.55%), 4M3PP (264.57%), and 1CCP4OP (264.58%). The ND provenance had the highest CVs of EO content (42.56%), D-LP (93.74%), and LinalP (18.84%). The QN, WA, and TH provenances had the highest CVs of CitroP (110.88%), GeranialP (7.39%), and SabP (245.00%), respectively. The DY provenance had the highest CV of 3,7-DP (264.58%) and the lowest CV of 4M3PP (52.75%). The JA provenance had the lowest CVs of EO content (5.37%), CitrP (0.73%), NeralP (0.48%), and D-LP (8.84%); the YS provenance had the lowest CVs of SabP (6.58%), CitroP (11.76%), and 3,7-DP (5.24%); and the XS provenance had the lowest CV of LinalP (1.76%).
The average EO content across all provenances was 3.55%, ranging from 2.56% (LH) to 4.19% (YS). Nine provenances, including LC, ND, and FL, had EO content values higher than the mean. Among the eight EO components, CitrP had the highest average proportion (75.23%) and ranged from 72.57% (WN) to 80.61% (ND). The average NeralP was 39.01%, ranging from 37.65% (LC) to 41.05% (ND). The average GeranialP was 36.22%, ranging from 32.67% (WN) to 39.57% (ND). Neither 4M3PP nor 1CCP4OP were detected in TH and JA, but their highest values were in QN (2.43% and 4.88%, respectively). The average SabP across all provenances was 1.75%, ranging from 0.00% (LH) to 9.27% (LC). The average D-LP was 6.93%, ranging from 4.09% (ND) to 9.27% (LC). The average LinalP was 1.80%, ranging from 1.58% (XS) to 2.13% (JA). The average CitroP was 2.99%, ranging from 0.66% (WA) to 6.04% (DY). The average 3,7-DP was 4.96%, ranging from 0.98% in DY to 9.29% in TH (Tables S2 and S9).

3.2. Correlation Analysis of Phenotypes and Geographical and Climatic Factors

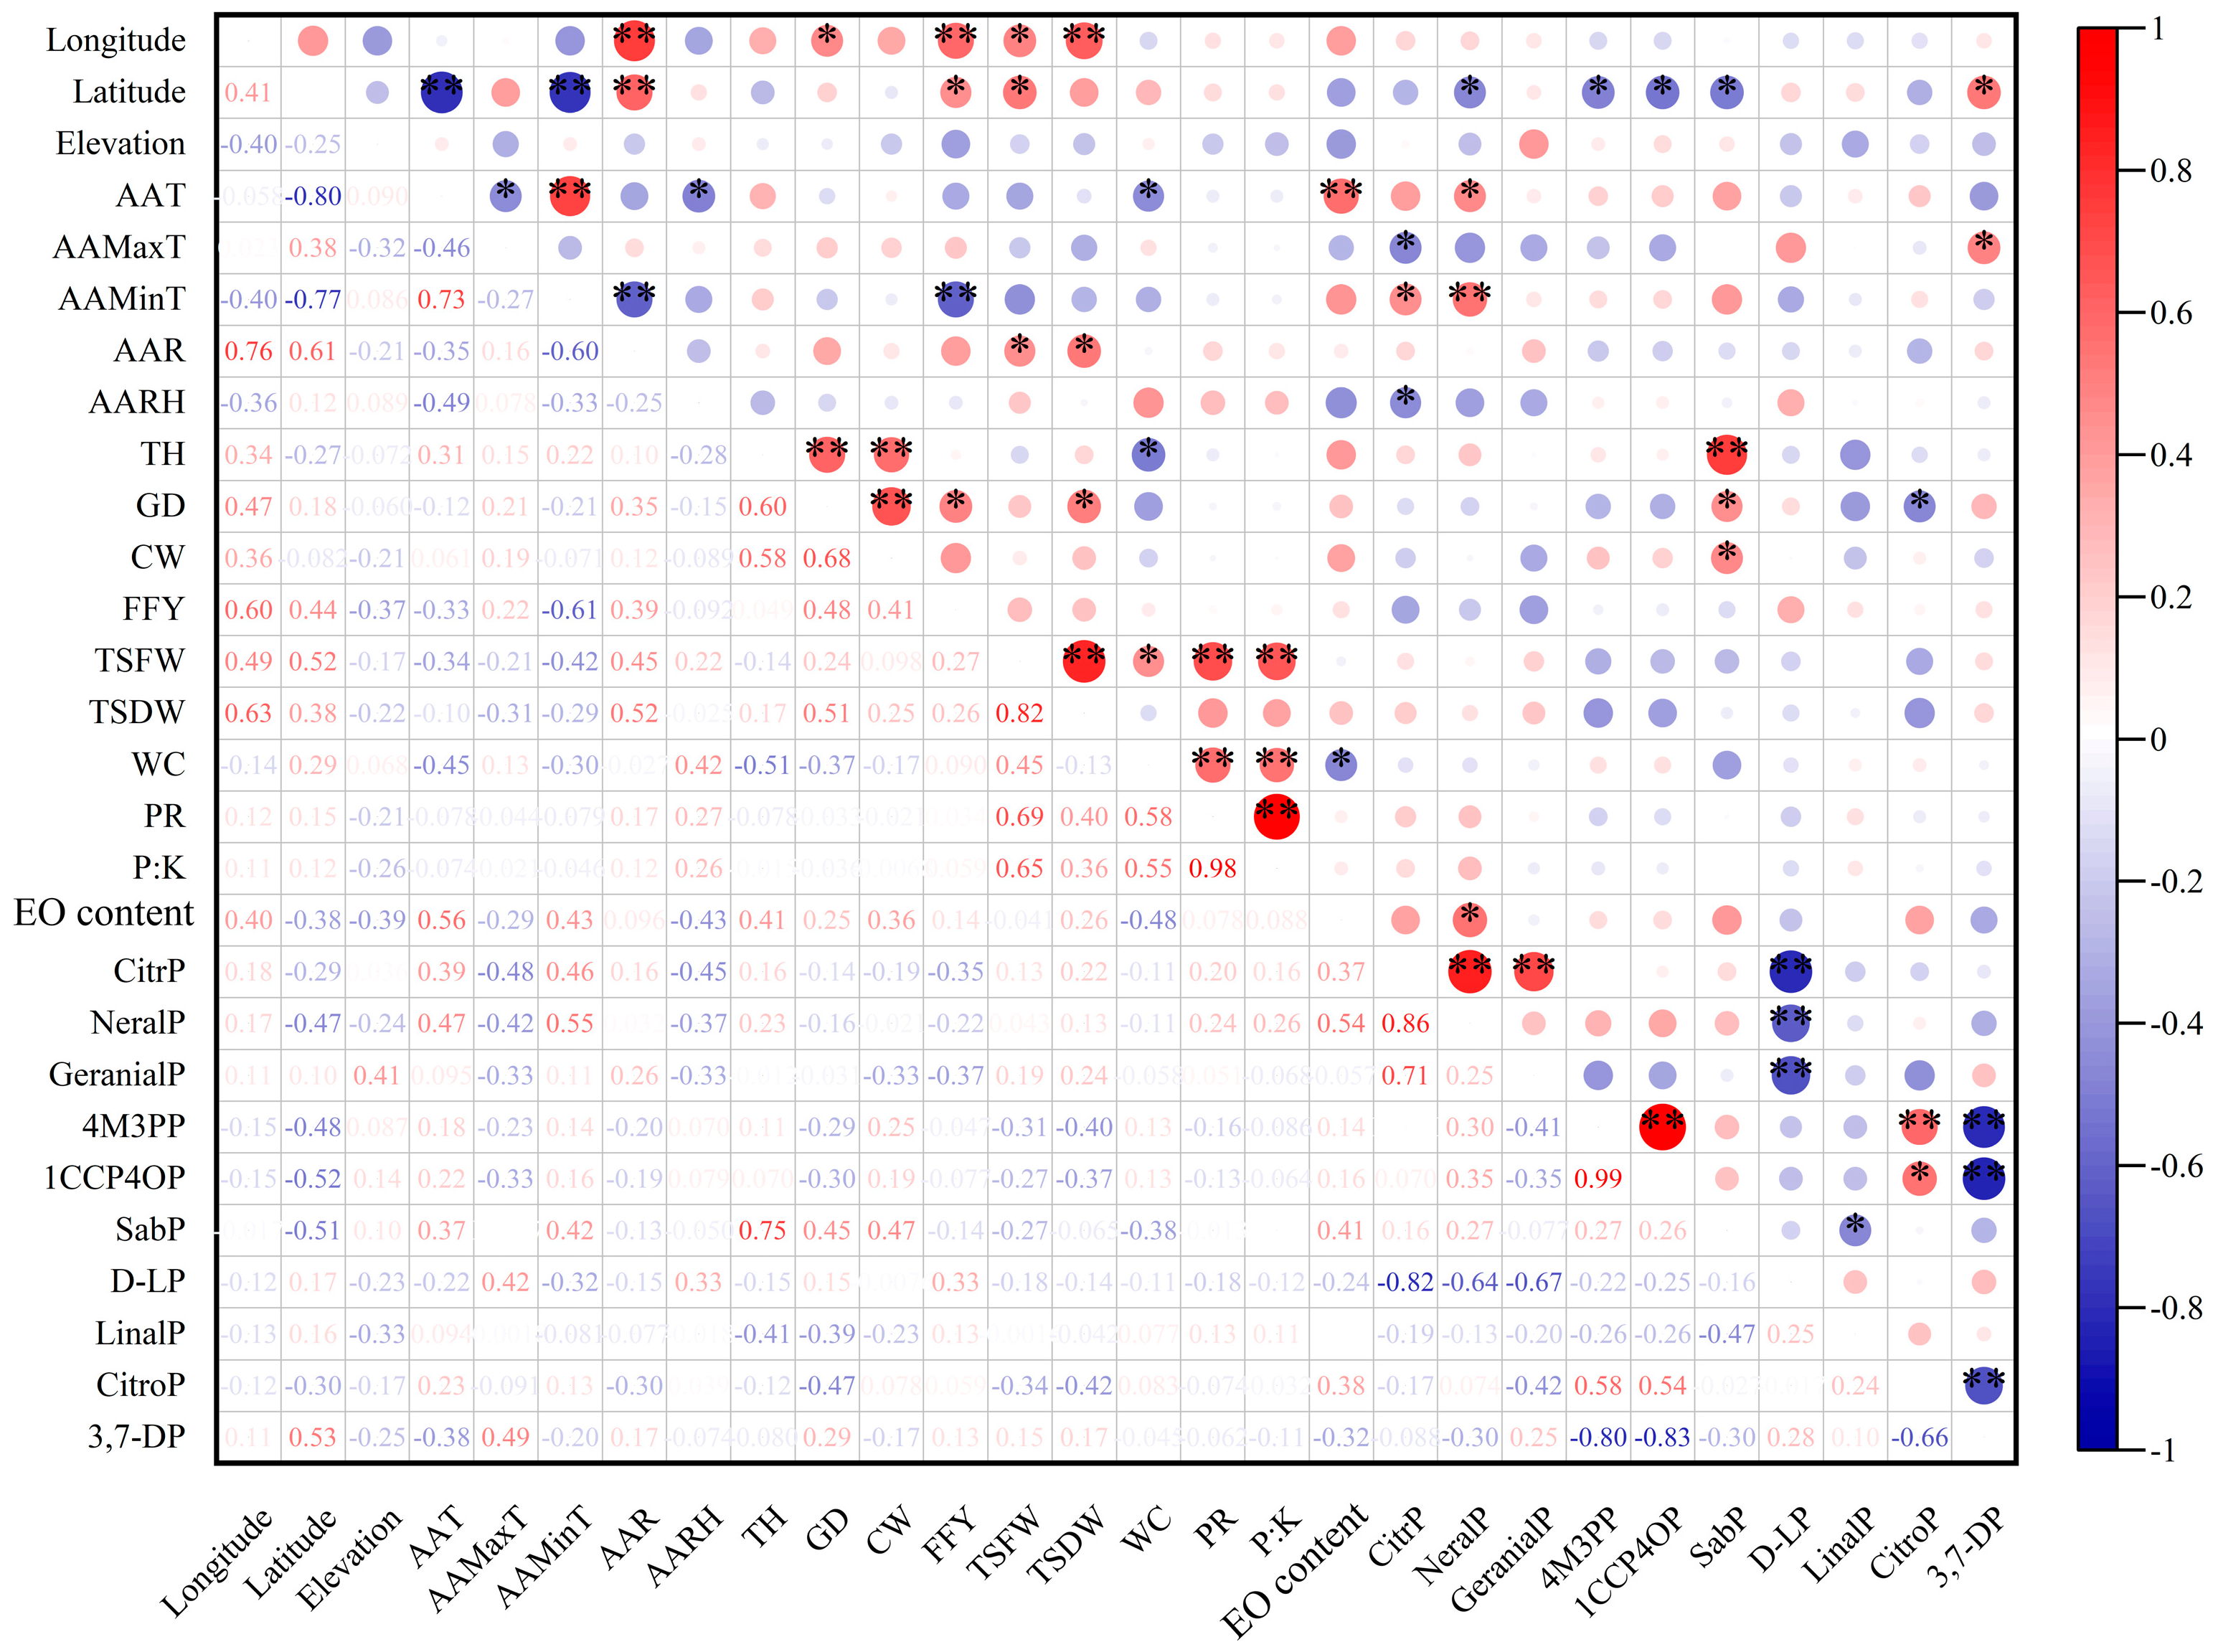
3.2.1. Correlation Analyses between Phenotypic Characteristics

The relationships among the 20 phenotypic characteristics of L. cubeba were conducted by correlation analyses (Figure 4). There was a significant positive correlation between TSFW and TSDW (r = 0.82 **), and with PR (r = 0.69 **), P:K (r = 0.65 **), and WC (r = 0.45 *), and a significant positive correlation between TSDW and GD (r = 0.51 **). The FFY was significantly positively correlated with GD (r = 0.48 *). The EO content was significantly negatively correlated with WC (r = −0.48 *). The NeralP was significantly positively correlated with CitrP (r = 0.86 **) and significantly positively correlated with EO content (r = 0.54 *). There was a highly significant positive correlation between GeranialP and CitrP (r = 0.71 **). In addition, we detected significant correlations between growth traits and fruit traits and other components in EOs. There was a highly significant positive correlation between TH and SabP (r = 0.75 **), a negative correlation between GD and CitroP (r = −0.47 *), and a positive correlation between CW and SabP (r = 0.47 *). There was no significant correlation between FFY, TSFW, TSDW, and P:K and all the EO traits, nor between WC and all the EO components.

3.2.2. Correlation Analysis between Geographical and Climatic Factors and Phenotypes

Next, we conducted correlation analyses between environmental factors and the phenotypes of L. cubeba (Figure 4). There were highly significant positive correlations between longitude and FFY (r = 0.60 **), TSDW (r = 0.63 **), and significant correlations between longitude and GD (r = 0.47 *) and TSFW (r = 0.49 *). Latitude was significantly positively correlated with FFY (r = 0.44 *), TSFW (r = 0.52 *), and 3,7-DP (r = 0.53 *), but negatively correlated with CitrP (r = −0.29 *), 4M3PP (r = −0.48 *), 1CCP4OP (r = −0.52 *), and SabP (r = −0.51 *). The AAT was significantly positively correlated with EO content (r = 0.56 **), positively correlated with NeralP (r = 0.47 *) and negatively correlated with WC (r = −0.45 *). The AAMaxT was significantly positively correlated with 3,7-DP (r = 0.49 *) and negatively correlated with CitrP (r = −0.48 *). The AAMinT was significantly positively correlated with the NeralP (r = 0.55 **) and CitrP (r = 0.46 **), and negatively correlated with FFY (r = −0.61 **). The AAR was positively correlated with TSFW (r = 0.45 *) and TSDW (r = 0.52 *). The AARH was only negatively correlated with CitrP (r = −0.45 *). There were no significant correlations between altitude and all phenotypes.

3.3. Path Analyses of FFY, EO Content and CitrP

We conducted a path analysis with multiple stepwise regression using geographic and climatic factors as the independent variables and FFY as the dependent variable (Table S10), selecting independent variables with significant regression coefficients to construct multiple stepwise regression equations. The multiple stepwise regression equation for FFY was y = −95.506 − 0.351X6 + 0.849X1 − 0.014X7, where X6, X1, and X7 are AAMinT, longitude, and AAR, respectively. The ranking of factors based on their direct path coefficient was as follows: AAMinT (0.960) > AAR (0.712) > longitude (0.674) > latitude (0.505) > AARH (0.484) > AAT (0.452) > elevation (0.206) > AAMaxT (0.021). The multiple stepwise regression equation and path analysis indicated that AAMinT, longitude, and AAR played an important part in FFY. While their indirect path coefficient was as follows: AAMinT (1.288) > AARH (1.019) > latitude (0.775) > AAT (0.591) > elevation (0.247) > AAR (0.089) > AAMaxT (0.024) > longitude (0.020).
Next, we conducted a path analysis with EO content as the dependent variable and geographic and climatic factors as independent variables (Table S11). The multiple stepwise regression equation for EO content was y = −2.503 + 0.339X4 − 0.001X3, where X4 and X3 are AAT and elevation. The ranking of factors based on their direct path coefficient was as follows: longitude (0.409) > AAMinT (0.401) > latitude (0.388) > elevation (0.377) > AAR (0.219) > AAMaxT (0.200) > AAT (0.002) > AARH (0.002). Their indirect path coefficient was as follows: latitude (0.580) > AAMinT (0.538) > elevation (0.495) > AAMaxT (0.231) > AAR (0.027) > longitude (0.012) > AARH (0.004) > AAT (0.003).
Similarly, CitrP was used as the dependent variable to conduct path analysis with multiple stepwise regression (Table S12). The multiple stepwise regression equation for CitrP was y = 149.802 − 1.018X5 − 0.419X8, where X5 and X8 are AAMaxT and AARH, respectively. The ranking of factors based on their direct path coefficient was as follows: AAMinT (0.885) > AAR (0.663) > AAT (0.507) > AAMaxT (0.493) > latitude (0.237) > AARH (0.154) > longitude (0.043) > elevation (0.043). While their indirect path coefficient was as follows: AAMinT (1.188) > AAT (0.663) > AAMaxT (0.569) > latitude (0.355) > AARH (0.324) > AAR (0.083) > elevation (0.056) > longitude (0.001). The direct and indirect path coefficients were higher for AAMinT than for the other environmental factors, indicating that AAMinT strongly affected CitrP. The results of the multiple stepwise regression equation and path analysis showed that extreme temperatures significantly affected CitrP.

3.4. Redundancy Analysis

The raw phenotypic data of L. cubeba were used for DCA. As shown in Table S13, all of the axis lengths were less than 3 (DCA 1 = 0.34, DCA 2 = 0.27, DCA 3 = 0.24, and DCA 4 = 0.22), indicating that these data should be used for redundancy analysis (RDA). The results showed that after RDA model correction, 52.6% of the phenotypic variation in L. cubeba could be explained by three geographical factors and five climate factors. RDA 1 explained 16.99% of phenotypic variation (typical correlation coefficient 0.91), and RDA 2 explained 11.74% (typical correlation coefficient 0.78) (Table S14). The first two axes explained a total of 28.73% of phenotypic variation, indicating a strong effect of environmental factors on the phenotypes of L. cubeba.
Next, RDAs between environmental factors and the phenotypes of L. cubeba were conducted to identify the environmental factor with the strongest effect on phenotypic variation (Figure 5). RDA 1 was positively correlated with AAT and AAMinT and strongly negatively correlated with latitude and AAMaxT. RDA 2 was highly positively correlated with longitude and AAR. When the environmental factors were ranked on the basis of their contribution values and the proportion of phenotypic variation they explained (Table S15), latitude and longitude together explained 22.9% of phenotypic variation in L. cubeba, and the p values of latitude (p value = 0.004) and longitude (p value = 0.010) were both lower than 0.05, which was at a significant level. These results show that they had the greatest impact on phenotypes.

3.5. Identify Individual Trees and Provenances with Desirable Characteristic

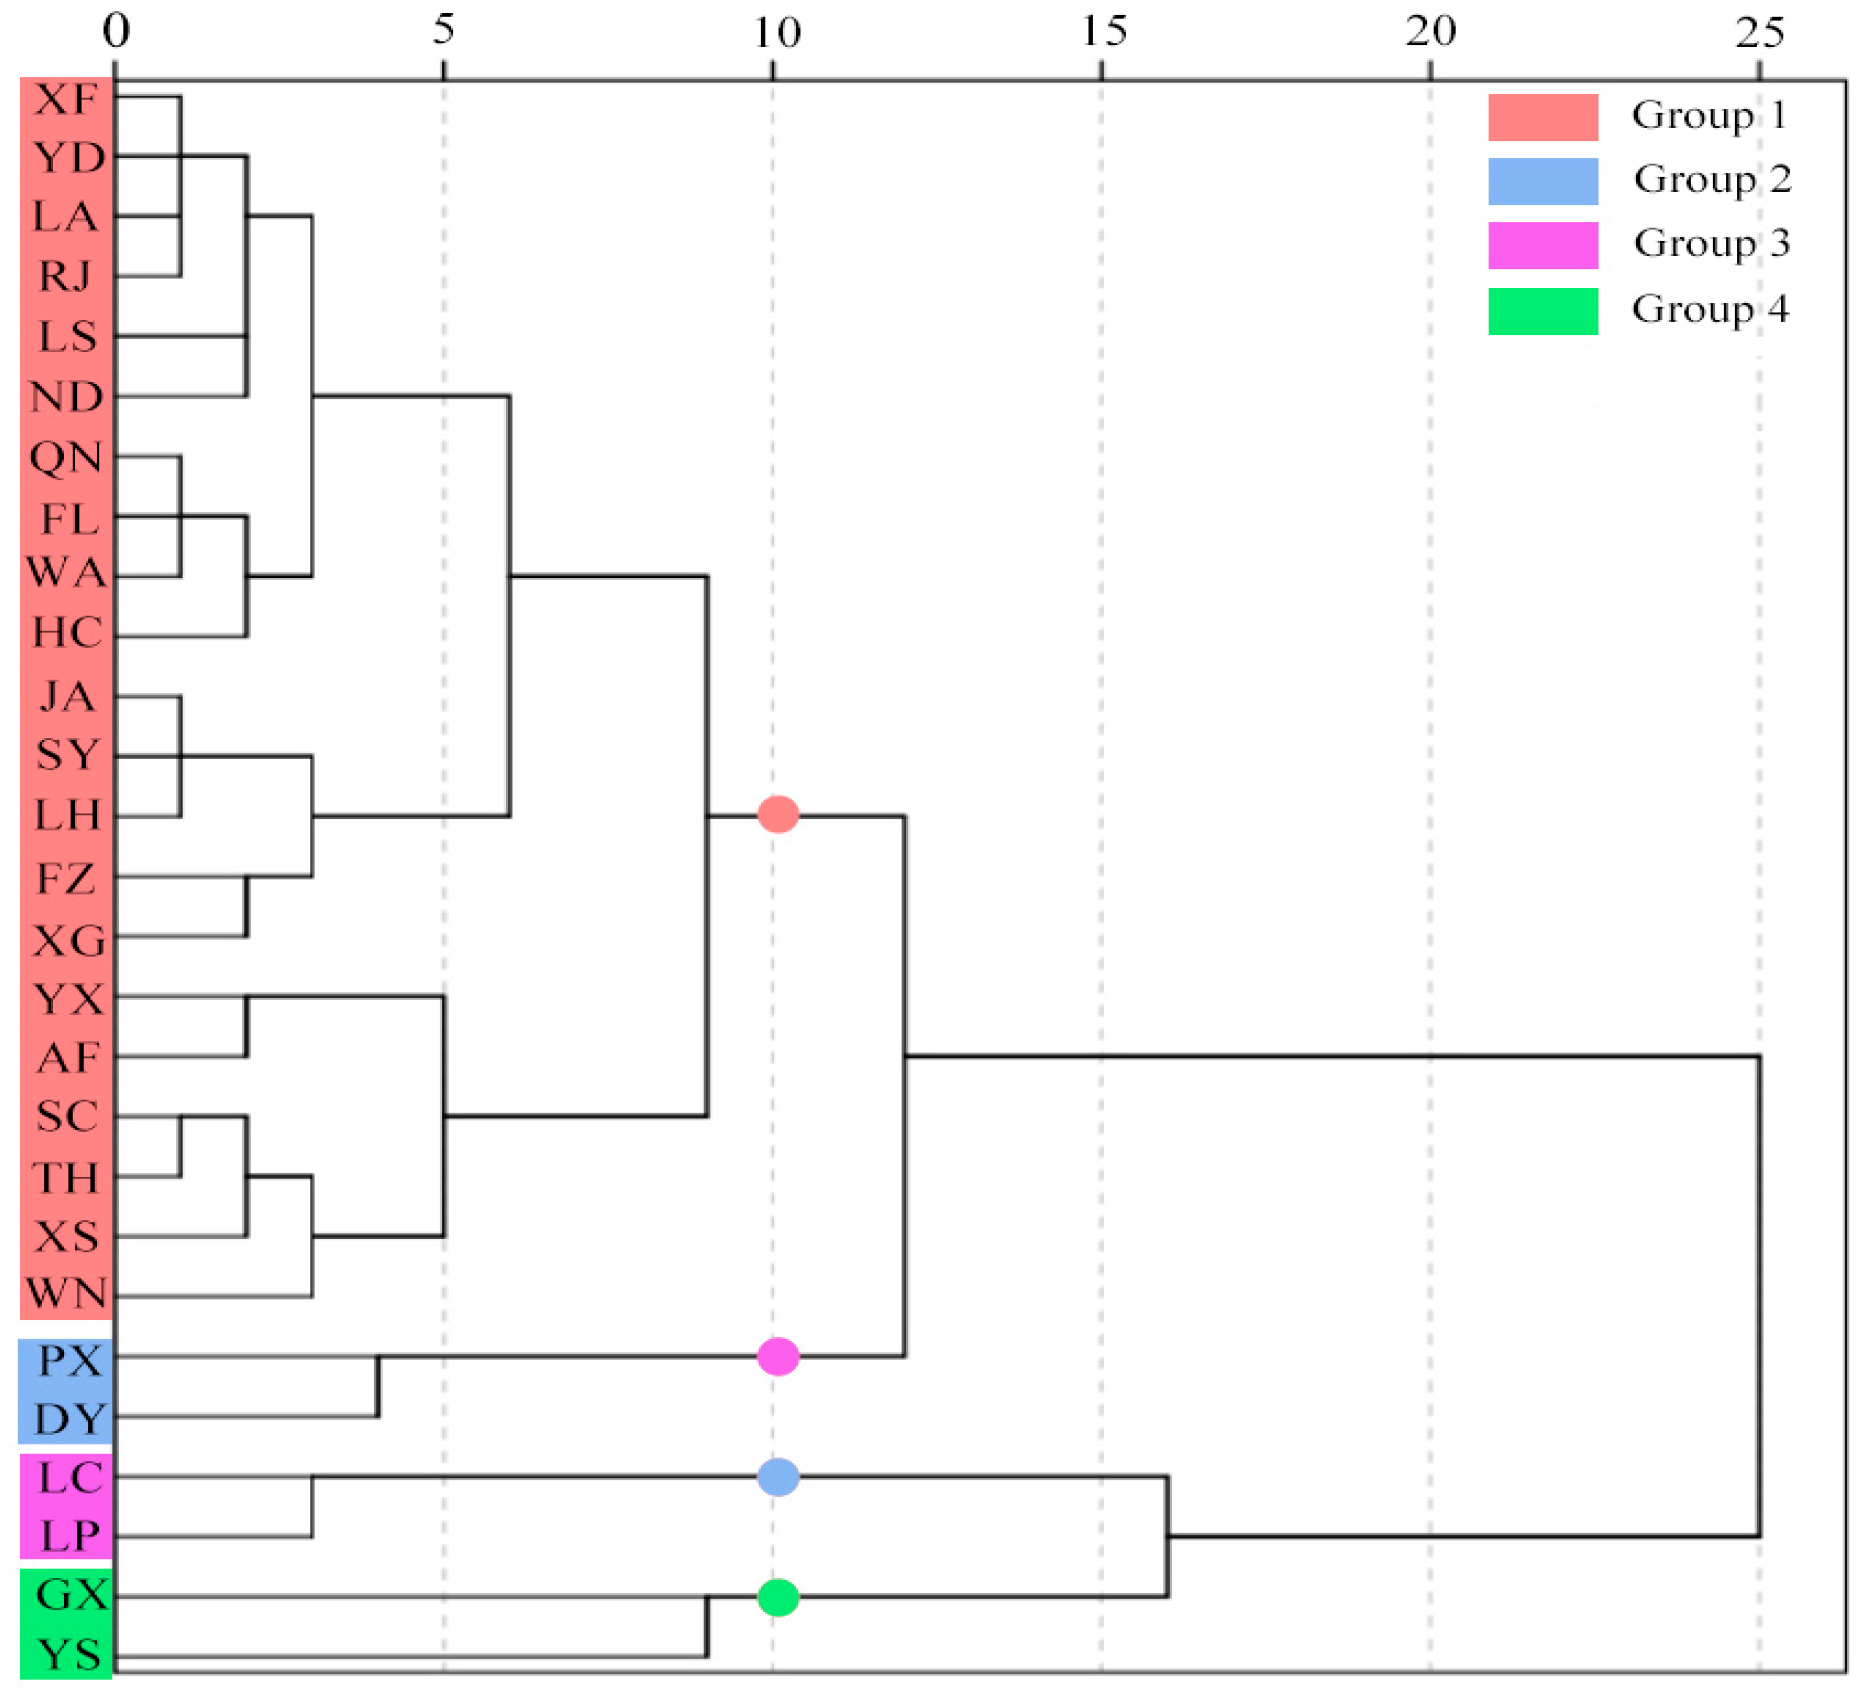
3.5.1. Identification of L. cubeba Trees

A PCA was conducted based on the twenty phenotypic traits of L. cubeba (Table S16), and seven principal components were extracted. The values of the first to seventh principal components were 3.787, 3.447, 2.774, 2.422, 1.519, 1.323, and 1.167. The cumulative contribution rate of the seven principal components was 82.192%, which represents most of the traits, and the contribution rate of the seven principal components was 18.933%, 17.236%, 13.869%, 12.110%, 7.596%, 6.613%, and 5.834%.
In the PCA (Table S16), the weight coefficients of the seven principal components were calculated (0.23, 0.21, 0.17, 0.15, 0.09, 0.08, and 0.07), and the D-values were calculated for 141 individuals of L. cubeba based on the membership function values of twenty phenotypic traits (Table S17). The top ten individual trees with the highest D values were YS-825 (1.21), XF-1467 (1.11), QN-1394 (1.03), ND-1187 (1.03), WA-1094 (0.99), LP-820 (0.99), LP-813 (0.92), XF-1468 (0.84), FL-808 (0.84), and PX-1008 (0.80).

3.5.2. Identification of Individual Trees with Desirable Characteristics

There were four individual trees with FFYs greater than 10.00 kg·tree−1 (Figure 6), namely PX-1010 (19.00 kg·tree−1), GX-835 (17.00 kg·tree−1), LP-814 (16.20 kg·tree−1), and YS-825 (10.80 kg·tree−1). The range of the other 137 individual trees was 0.19 kg·tree−1 to 7.90 kg·tree−1. There were eight individual trees with an EO content higher than 5.0% (Figure 7a), namely XF-1223 (5.77%), LC-1062b (5.54%), XF-1468 (5.26%), YD-1193 (5.15%), YD-1194b (5.14%), PX-1111 (5.10%), HC-1391 (5.03%), and ND-1185 (5.01%). These were identified as individuals with the desirable trait of high EO content. The CitrP was higher than 80.00% in 11 individual trees (Figure 7b), namely ND-1187 (85.62%), XF-1468 (84.82%), FL-808 (84.09%), LP-820 (82.55%), XF-1462 (81.30%), GX-1149 (80.95%), ND-1185 (80.71%), QN-1393 (80.45%), QN-1238 (80.43%), HC-1371 (80.38%), and PX-1114 (80.05%). These 11 trees were identified as individuals with the desirable trait of high CitrP.

3.5.3. Identification of Provenances with Desirable Traits

The 27 provenances of L. cubeba in Jiangxi province formed four groups in the hierarchical clustering based on FFY (Figure 8). A total of 21 provenances belonged to group 1, including XF, YD, and LA, with the lowest FFY (between 0.24 and 0.99 kg·tree−1). Group 2 consisted of PX (1.38 kg·tree−1) and DY (1.47 kg·tree−1), which was just higher than group 1. Group 3 consisted of LC (2.21 kg·tree−1) and LP (2.14 kg·tree−1). Only GX (2.65 kg·tree−1) and YS (2.89 kg·tree−1) belonged to group 4, which were desirable provenances with the highest FFY.
The twenty-one provenances were clustered into five groups according to EO content (Figure 9a). Group 1 consisted of 10 provenances, including RJ, LP, and QN, with the EO content ranging from 3.39% (TH) to 3.67% (GX). Group 2 consisted of PX (3.15%), YX (3.21%), and AF (3.33%); group 3 consisted of XS (2.95%) and WN (2.85%); and group 4 had only one member, LH (2.56%). Group 5 consisted of five provenances with a high EO content: DY (3.98%), YD (3.99%), JA (3.95%), XF (4.09%), and YS (4.19%). The provenances in group 5 were identified as high-EO content provenances.
The 21 provenances were also clustered into 5 groups according to CitrP (Figure 9b). Group 1 consisted of 10 provenances, including QN, YD, and YX, and their CitrP ranged from 74.62% (WA) to 75.76% (LH). Group 2 consisted of AF (73.97%) and XS (74.61%). Group 3 consisted of XF (76.22%), HC (76.63%), DY (76.31%), RJ (74.50%), and FL (77.45%), and group 4 had only one member, ND (80.61%). The CitrP of ND was much higher than that of the other four groups, so ND was identified as having a high CitrP provenance. Group 5 consisted of three provenances: WN (72.57%), LC (72.64%), and PX (73.98%), with lower CitrP than those of the other four groups.

4. Discussion

4.1. Phenotypic Diversity

Phenotypes were affected by the interaction between genetic diversity and environmental factors, and as such, they have great significance for breeding new varieties and lines with superior traits [36,37]. In this study, we analyzed the diversity of phenotypic traits of wild L. cubeba from 27 provenances in Jiangxi province, and we detected significant differences in growth traits, fruit traits, EO content, and EO components among provenances, which was consistent with the results reported by Fan et al. (2023) [30]. We detected significant variations in TH, TSDW, CitrP, GeranalP, NeralP, D-LP, CitroP, and 3,7-DP within the provenances. Similar results have been reported in a previous study, which focused on the phenotypic traits of 10 provenances of L. cubeba and detected significant differences in fruit and leaf traits within and among provenances [27]. In this study, we found that the CVs were larger for FFY, 4M3PP, and 1CCPOP of L. cubeba than for other phenotypic characters, which is consistent with the results of another study [30]. Similar studies have shown that the variation in FFY was greater than the variations in other traits, mainly due to the significant effects of tree structure, fruit bearing stage, climatic factors, and interspecific relationships [38,39,40]. And proper fertilization can effectively increase the FFY of Litsea cubeba [41].
In this study, FFY was significantly positively correlated with GD (r = 0.48 *), indicating that GD is an important growth trait that affects FFY. The GD reflects the growth of the tree; trees with thick trunks have strong growth potential. Thus, GD can be used as an indicator for selecting excellent trees [42]. In previous studies, the FFY of L. cubeba was positively correlated with diameter at breast height [43], similar to the results of this study. In addition, L. cubeba has a high light requirement. In dense forests, the TH often increases to compete for light, and the trees have a sturdy and straight trunk, smaller CW, fewer branches, and lower FFY. When L. cubeba is shaded, it hardly bears fruit, and the quality of the leaves is poor. In contrast, in open areas, it often grows in clusters and has higher CW and FFY. The correlation between FFY and GD has important guiding significance for further research and for the cultivation of L. cubeba. The significant negative correlation between EO content and WC indicated that WC is an important factor affecting EO content. Previous studies have shown that the WC rapidly decreases in the early and middle stages of fruit development. The WC decreases slowly at the slow stage of fruit development and remains unchanged during the rapid development stage, whereas the EO content shows the opposite trend [28], The decrease in WC during fruit development and the increase in EO content may be due to the transformation of substances in the fruit [44]. At the molecular level, cell wall recombination induced by oxidants may mediate cell wall hydration. The contraction of the cell wall caused by oxidative cross-linking of wall-bound phenolic acids leads to cell wall dehydration. Wall tightening is the molecular basis for the decrease in wall hydration and subsequent decrease in fruit WC commonly observed in mature fruits [45].
Tang (2015) detected a strong correlation between CitrP and EO content [29], and Lan et al. (2020) detected significant positive correlations between TSDW and NeralP, as well as between TSDW and geranial [28]. In the present study, we did not detect significant correlations between CitrP and growth traits or fruit traits, but the proportion of other EO components such as sabinene was positively correlated with TH, GD, and CW, while GeranialP was negatively correlated with GD. These differences may be due to the different site conditions and genetic differences among L. cubeba populations [46,47].

4.2. Geographic and Climate Factors Affecting the Phenotypes

Environmental factors can cause phenotypic variations [48,49]. Trees are influenced by the combined effects of their genetic make-up and environmental factors, and then their phenotypes exhibit certain variations [50]. The phenotypic traits of L.cubeba regularly presented differences, which may be due to the difference in the climate conditions that were affected by the variation of geographical locations [51,52]. The longitude was significantly positively correlated with FFY (r = 0.60 **). The direct impact coefficient of longitude was relatively high (0.674), indicating that longitude had a significant impact on FFY. The AAMinT was negatively correlated with FFY (r = −0.61 **). The direct path coefficient (0.960) and indirect path coefficient (1.288) of AAMinT were significantly higher than those other environmental factors (0.021–0.712; 0.020–1.019). Therefore, we inferred that longitude and AAMinT were crucial environmental factors affecting FFY. A higher FFY was often accompanied by a higher longitude and a lower AAMinT. A previous study found that the yield per tree was higher from L. cubeba trees growing at a lower longitude [30].
In this study, we detected a positive correlation between EO content and AAT (r = 0.56 **). The results of multiple regression path analysis with the EO content as the dependent variable showed that the factor with the highest direct path coefficient was longitude (0.409), and the factor with the highest indirect path coefficient was latitude (0.580). This result indicated that L. cubeba trees growing in areas with high AAT, longitude, and low latitude have higher EO contents. The significant negative correlation between CitrP and AAMinT (r = −0.48 *) was consistent with the results reported by Tian et al. (2012) [27]. In the path analysis, AAMinT had the highest direct and indirect path coefficients (0.885; 1.188), showing that extreme temperature played a decisive role in CitrP, as reported in other studies [53,54,55].
The eight environmental factors evaluated in this study collectively explained more than half of the phenotypic variation in wild L. cubeba in Jiangxi province, with longitude and latitude accounting for 22.9% of the phenotypic variation. Longitude and latitude are strongly correlated with AAR and temperature, which are known to affect phenotype [56,57], and have been identified as important factors explaining the phenotypic variation in L. cubeba in another recent study [30]. A previous study showed that altitude can also affect the EO content and CitrP of L. cubeba [29]. However, we did not detect any significant relationships between fruit characters and altitude, which may be due to genetic exchange among different L. cubeba sources in Jiangxi province and the unclear altitude gradient of the sampling sites in this study.

4.3. Individual Trees and Provenances with Desirable Characteristics

The PCA generated seven principal components with characteristic values greater than 1. These seven principal components had a cumulative contribution rate of 82.192% to phenotypic variation, and included most of the phenotypic trait data. These findings indicated that the chemical component of EOs and fruit traits had the greatest impact on the diversity of phenotypic traits of L. cubeba in Jiangxi province. Four single trees, namely PX-1010, GX-835, LP-814, and YS-825, had high FFY (10.80 kg·tree−1–19.00 kg·tree−1), but only two individual trees, XF-1468 and ND-1185, had both high EO content and high CitrP. YS-825 had the highest comprehensive score (1.21), followed by XF-1467 (1.11), whereas JA-1042 and DY-1455 had the lowest scores (0.00). The trees with desirable traits, as selected based on comprehensive score values, can be used as parents for breeding hybrids and as superior germplasm in breeding programs [58].
Previous studies analyzed the genetic variation in the seedling height and GD of L. cubeba and then selected two excellent provenances, namely Fuyang in Zhejiang and Jianyang in Fujian [59]; 10 fast-growing source regions were selected based on the growth status of L. cubeba in Hunan province, and then three excellent regions were identified based on economic indicators [24]. Through clustering the important economic traits of L. cubeba, we found that the FFYs of two provenances, GX and YS (2.65 kg·tree−1, 2.89 kg·tree−1), were much higher than those of the other 25 provenances. Thus, these provenances were identified as excellent materials for high FFY. The FFYs of LC and LP (2.21 kg·tree−1, 2.14 kg·tree−1) were smaller than those of GX and YS but were higher than those of the other provenances, so they were also identified as high-FFY provenances. The EO content was higher than 3.95% in five provenances: DY, YD, JA, XF, and YS. The EO content of YS was 4.19%, indicating that it has a high EO content. The CitrP in ND (80.61%) was much higher than those in the other 20 provenances, identifying it as a high-CitrP provenance. We compared the geographical distances between various provenances in different clusters and found that the distance among L. cubeba populations clustered based on FFY, EO content, and CitrP was about 70 km. Therefore, we speculated that when the distance between wild L. cubeba provenances in Jiangxi province is greater than 70 km, there will be significant variations in FFY, EO content, and CitrP among individual trees.
In this study, we did not explore the impact of other environmental factors, such as soil physicochemical properties and illumination, on the phenotypic diversity of L. cubeba in Jiangxi province. Another study analyzed the physical and chemical properties of soil in areas where L. cubeba was distributed and found that soil properties significantly affected the FFY and EO content [30]. Other studies have shown that light conditions play an important role in shaping tree phenotypes [60,61]. In further research, it will be interesting to further investigate the effects of soil characteristics and light conditions on the phenotypes of L. cubeba.

5. Conclusions

This study analyzed the phenotypic diversity and the relationships between phenotypic variation and environmental factors, and the trends in the phenotypic variation of L. cubeba under particular topographic conditions in Jiangxi province were explored. On the basis of these analyses, individual trees and provenances with desirable traits were identified. The main conclusions are as follows: There was significant variation in the phenotypic traits of wild L. cubeba among provenances, and there were also significant variations in TH, TSDW, CitrP, GeranialP, NeralP, and D-LP within provenances. A higher FFY was often accompanied by a higher longitude and a lower AAMinT. L. cubeba trees growing in areas with higher longitude, higher AAT, and lower latitude always have higher EO content. Furthermore, lower AAMinT was not conducive to the generation and accumulation of citral proportions. We identified four single trees with FFY (PX-1010, GX-835, LP-814, and YS-825) and two single trees with EO content and CitrP (XF-1468 and ND-1185). The individual tree with the highest comprehensive score was YS-825. The cluster analyses identified two high-FFY provenances, GX and YS, five provenances with high-EO content, DY, YD, JA, XF, and YS, and one high CitrP provenance, ND. This study might greatly promote the core collection, construction, and preservation of wild L. cubeba germplasm resources in Jiangxi province and provide important experimental materials and a theoretical basis for the subsequent cultivation and genetic breeding of L. cubeba.

Supplementary Materials

The following supporting information can be downloaded at: https://www.mdpi.com/article/10.3390/f14122283/s1, Table S1: Geographical locations and climatic conditions of 27 provenances in Jiangxi province; Table S2: Variation analysis on phenotypic traits of L. cubeba among provenances; Table S3: Nested variance analysis of phenotype traits in L. cubeba; Table S4: CV of growth traits of L. cubeba within provenances; Table S5: CV of fruit phenotypic traits of L. cubeba within provenances; Table S6: CV of EO content and components of L. cubeba within provenances; Table S7: Multiple comparison on growth traits of L. cubeba between provenances; Table S8: Multiple comparison on fruit phenotypic traits of L. cubeba between provenances; Table S9: Multiple comparison on EO content and components of L. cubeba between provenances; Table S10: Path analysis of environmental factors for FFY of L. cubeba; Table S11: Path analysis of environmental factors for EO content of L. cubeba; Table S12: Path analysis of environmental factors for CitrP of L. cubeba; Table S13: Results on detrended correspondence analysis of environmental factors; Table S14: The summary results of interactive-forward-selection of redundancy analysis; Table S15: The results of forward selection in redundancy analysis; Table S16: Principal component analysis of phenotypic diversity of L. cubeba; Table S17: Statistics of D value of comprehensive score of single trees.

Author Contributions

Conceptualization, J.W. and S.C.; methodology, J.W., X.W. and X.N.; software, X.W., X.N., G.L. and X.S.; validation, J.W., X.N. and D.F.; formal analysis, X.W., X.N., G.L. and X.S.; investigation, J.W., S.C., G.F., G.L., Z.W. and X.W.; resources, J.W., S.C. and G.F.; data curation, X.W., X.N., G.L., D.F. and X.S.; writing—original draft preparation, X.W., X.N. and J.W.; writing—review and editing, J.W. and X.W.; visualization, X.N., X.W., J.W. and D.F.; supervision, S.C. and Z.W.; project administration, S.C. and Z.W.; funding acquisition, J.W., S.C. and Z.W. All authors have read and agreed to the published version of the manuscript.

Funding

This research was funded by the Major Science and Technology Research and Development Special Project of Jiangxi Province (20203ABC28W016), the Project of Key Research Project on Camphor Tree (KRPCT) of Jiangxi Forestry Department (2020CXZX07), and the Thousand Talent Project of Jiangxi Province (JXSQ2019201016).

Data Availability Statement

The data presented in this study are openly available in the document of Supplementary Materials (Tables S1–S17).

Acknowledgments

We are very grateful to all the reviewers for their valuable advice and suggestions to improve the manuscript. We also thank Jennifer Smith for editing a draft of this manuscript.

Conflicts of Interest

The authors declare that they have no known competing financial interests or personal relationships that could have appeared to influence the work reported in this paper.

Abbreviations

TH, tree height; GD, trunk diameter at ground level; CW, crown width; FFY, fresh fruit yield; TSFW, thousand seed fresh weight; TSDW, thousand seed dry weight; WC, water content; PR; pericarp ratio; P:K, pericarp:kernel; EO, essential oil; CitrP, proportion of citral; NeralP, proportion of neral; GeranialP, proportion of geranial; 4M3PP, proportion of 4-methyl-3-pentenal; 1CCP4OP, proportion of 1-(cyclopanecarbonyl)piperidin-4-one; SabP, proportion of sabinene; D-LP, proportion of D-limonene; LinaP, proportion of linalool; CitroP, proportion of citronellal; 3,7-DP, proportion of 3,7-dimethyl-3,6-octadienal; AAT, annual average temperature; AAMaxT, annual average maximum temperature; AAMinT, annual average minimum temperature; AARH, annual average relative humidity; AAR, annual average rainfall; CV, coefficient of variation.

References

  1. Chen, W.J. A Study on the relationship between the change of outer color of Litsea cubeba fruit and its oil yield and quality. J. Henan Fores. Sci. Technol. 2001, 21, 33–34. [Google Scholar]
  2. Zhao, Y.; Chen, Y.; Gao, M.; Wu, L.; Wang, Y. Comparative investigation of key aroma terpenoids of Litsea cubeba essential oil by sensory, chromatographic, spectral and molecular studies. LWT-Food Sci. Technol. 2023, 176, 114519. [Google Scholar] [CrossRef]
  3. Pante, G.C.; Castro, J.C.; Lini, R.S.; Romoli, J.C.Z.; Almeida, R.T.R.; Garcia, F.P.; Nakamura, C.V.; Pilau, E.J.; Abreu Filho, B.A.; Machinski, M. Litsea cubeba essential oil: Chemical profile, antioxidant activity, cytotoxicity, effect against Fusarium verticillioides and fumonisins production. J. Environ. Sci. Health B 2021, 56, 387–395. [Google Scholar] [CrossRef] [PubMed]
  4. Sattayakhom, A.; Songsamoe, S.; Yusakul, G.; Kalarat, K.; Matan, N.; Koomhin, P. Effects of Thai local ingredient odorants, Litsea cubeba and garlic essential oils, on brainwaves and moods. Molecules 2021, 26, 2939. [Google Scholar] [CrossRef] [PubMed]
  5. Chen, H.C.; Chang, W.T.; Hsen, Y.C.; Chen, H.Y.; Chuang, C.H.; Lin, C.C.; Lee, M.S.; Lin, M.K. Immunosuppressive effect of Litsea cubeba L. essential oil on dendritic cell and contact hypersensitivity responses. Int. J. Mol. Sci. 2016, 17, 1319. [Google Scholar] [CrossRef]
  6. Lv, H.; Huo, S.; Zhao, L.; Zhang, H.; Liu, Y.; Liu, S.; Tani, A.; Wang, R. Preparation and application of cinnamon-Litsea cubeba compound essential oil microcapsules for peanut kernel postharvest storage. Food Chem. 2023, 415, 135734. [Google Scholar] [CrossRef]
  7. Xia, S.; Lin, H.; Zhu, P.; Wang, P.; Liao, S.; Chen, S.; Wang, Z.; Fan, G. Inhibitory effects of Litsea cubeba oil and its active components on aspergillus flavus. J. Food Qual. 2020, 2020, 8843251. [Google Scholar] [CrossRef]
  8. Li, X.; Li, G.; Shan, Y.; Zhu, X. Preparation, characterization, and antifungal property of the inclusion complex of Litsea cubeba essential oil/hydroxypropyl-β-cyclodextrin and its application in preservation of Shatang mandarin. J. Food Sci. 2022, 87, 4714–4724. [Google Scholar] [CrossRef]
  9. Dai, J.; Li, C.; Cui, H.; Lin, L. Unraveling the anti-bacterial mechanism of Litsea cubeba essential oil against E. coli O157:H7 and its application in vegetable juices. Int. J. Food Microbiol. 2021, 338, 108989. [Google Scholar] [CrossRef]
  10. Yang, Z.; Wang, F.; Yin, Y.; Huang, P.; Jiang, Q.; Liu, Z.; Yin, Y.; Chen, J. Dietary Litsea cubeba essential oil supplementation improves growth performance and intestinal health of weaned piglets. Anim. Nutr. 2022, 13, 9–18. [Google Scholar] [CrossRef]
  11. Bampidis, V.; Azimonti, G.; Bastos, M.d.L.; Christensen, H.; Fašmon Durjava, M.; Kouba, M.; López, A.M.; López Puente, S.; Marcon, F.; Mayo, B.; et al. Safety and efficacy of a feed additive consisting of an essential oil from the fruits of Litsea cubeba (Lour.) Pers. (litsea berry oil) for use in all animal species (FEFANA asbl). EFSA J. 2021, 19, e06623. [Google Scholar] [CrossRef] [PubMed]
  12. Li, Y.; Zhuang, X.; Wu, X.; Qiu, C.; Wang, Y. Sustainable valorization of Litsea cubeba (Lour.) Pers. residue as the new lauric oil source using alternative green extraction and refining methods. Foods 2022, 11, 2047. [Google Scholar] [CrossRef] [PubMed]
  13. Li, C.N.; Wang, Y.; Chen, S.X.; Wu, L.F.; Wang, Z.H. Comprehensive evaluation of drought resistance of 9 pioneer plants in western Guangdong mining area. J. Weat China Fores. Sci. 2022, 51, 97–105. (In Chinese) [Google Scholar] [CrossRef]
  14. Qiu, Y.; Yu, Y.; Lan, P.; Wang, Y.; Li, Y. An overview on total valorization of Litsea cubeba as a new woody oil plant resource toward a zero-waste biorefinery. Molecules 2021, 26, 3948. [Google Scholar] [CrossRef] [PubMed]
  15. Chen, Y.; Wang, Y.; Han, X.; Si, L.; Wu, Q.; Lin, L. Biology and chemistry of Litsea cubeba, a promising industrial tree in China. J. Essent. Oil Res. 2013, 25, 103–111. [Google Scholar] [CrossRef]
  16. Zheng, Y.T.; Cai, Q.S.; Xv, L.C.; Li, C.Y. Present situation and development trend of exploitation for Litsea cubeba in Jiangxi Province. Jiangxi Fores. Sci. Tech. 2010, 2, 33–35. (In Chinese) [Google Scholar] [CrossRef]
  17. Zhuang, X.; Zhang, Z.; Wang, Y.; Li, Y. The effect of alternative solvents to n-hexane on the green extraction of Litsea cubeba kernel oils as new oil sources. Ind. Crops Prod. 2018, 126, 340–346. [Google Scholar] [CrossRef]
  18. Guo, Y.; Li, Y.; Li, Z.; Jiang, L.; Cao, X.; Gao, W.; Wang, J.; Luo, D.; Chen, F. Deep eutectic solvent-homogenate based microwave-assisted hydrodistillation of essential oil from Litsea cubeba (Lour.) Pers. fruits and its chemical composition and biological activity. J. Chromatogr. A 2021, 1646, 462089. [Google Scholar] [CrossRef]
  19. Qiu, Y.; Wang, Y.; Li, Y. Solvent-free microwave extraction of essential oils from Litsea cubeba (Lour.) Pers. at different harvesting times and their skin-whitening cosmetic potential. Antioxidants 2022, 11, 2398. [Google Scholar] [CrossRef]
  20. Hung, T.T.; Ngan, L.T.M.; Viet, H.; Hoang, N.V.M.; Hieu, T.T. Chemical composition and anti-Helicobacter pylori activity of essential oil from fresh fruits of Litsea cubeba (Lour.) Pers. J. Essent. Oil Res. 2023, 35, 207–219. [Google Scholar] [CrossRef]
  21. Si, L.; Chen, Y.; Han, X.; Zhan, Z.; Tian, S.; Cui, Q.; Wang, Y. Chemical composition of essential oils of Litsea cubeba harvested from its distribution areas in China. Molecules 2012, 17, 7057–7066. [Google Scholar] [CrossRef] [PubMed]
  22. Thielmann, J.; Murányi, P. Review on the chemical composition of Litsea cubeba essential oils and the bioactivity of its major constituents citral and limonene. J. Essent. Oil Res. 2019, 31, 361–378. [Google Scholar] [CrossRef]
  23. Dalimunthe, A.; Muhammad, M.; Rafi, M.; Syafma, V.M.; Hulwani, F.; Aprilliawati, I.; Satria, D. Antioxidant activity of N-hexane, Dichloromethane, Ethyl acetate, and Methanol extracts of Litsea cubeba Lour. barks. Rasayan J. Chem. 2023, 16, 642–647. [Google Scholar] [CrossRef]
  24. Gu, Z.Y.; Yang, L.; Chen, H.; Ran, M.H.; Yang, R.N. Analysis of essential oil in pericarp from 6 wild Litsea cubeba populations in Hunan Province. J. Chin. Cereals Oils Assoc. 2019, 34, 87–91. (In Chinese) [Google Scholar]
  25. Gao, M.; Chen, Y.; Wang, Y. Evaluation of the yields and chemical compositions of the essential oils of different Litsea cubeba varieties. J. Essent. Oil Bear. Plants. 2016, 19, 1888–1902. [Google Scholar] [CrossRef]
  26. Suwandhi, I.; Kusmana, C.; Suryani, A.; Tiryana, T. Litsea cubeba essential oil yield harvested from different habitat types on Mt. Papandayan, west Java, Indonesia. J. Math. Fundam. Sci. 2014, 46, 269–277. [Google Scholar] [CrossRef]
  27. Tian, S.P.; Wang, Y.D.; Chen, Y.C.; Han, X.J.; Zhan, Z.Y. Phenotypic diversity ofnatural Litsea cubeba population’s leaf and fruit traits. Chin. J. Ecol. 2012, 31, 1665–1672. (In Chinese) [Google Scholar] [CrossRef]
  28. Lan, G.Y.; Chen, J.Z.; Ma, Y.Z.; Liu, X.; Zhou, S.Y. Regulations of fruit development in Litsea cubeba and changes of its inclusions and essential oil. Non-Wood Forest Res. 2020, 38, 201–208. (In Chinese) [Google Scholar] [CrossRef]
  29. Tang, X.H. Provenance variation of fruit essential oil of Litsea cubeba and content of citral. Protec. Forest Sci. Technol. 2015, 35–37. Available online: https://www.en.cnki.com.cn/Article_en/CJFDTOTAL-FHLK201510011.htm (accessed on 6 December 2022). (In Chinese).
  30. Fan, G.; Ning, X.; Chen, S.; Zhong, L.; Guo, C.; Yang, Y.; Liu, J.; Tang, M.; Liao, G.; Wang, X.; et al. Differences in fruit yields and essential oil contents and composition among natural provenances of Litsea cubeba in China and their relationships with main habitat factors. Ind. Crops Prod. 2023, 194, 116285. [Google Scholar] [CrossRef]
  31. Munir, M.; Alhajhoj, M.R.; Sallam, A.-K.M.; Ghazzawy, H.S.; Al-Bahigan, A.M. Impact of pollination time of the day on the fruit, yield, and quality traits of date palm cultivar Khalas. J. Appl. Hortic. 2021, 23, 348–352. [Google Scholar] [CrossRef]
  32. Kattmah, G.; Mahdi Al-kalaby, J.E.; Al-Ibrahem, A.; Al-Rasheed, M.M. Evolution and characterization of olive genetic resources in Palmyra-Central Syria. Kufa J. Agric. Sci. 2019, 11, 77–89. Available online: https://search.emarefa.net/detail/BIM-895767. (accessed on 2 January 2023).
  33. Šmilauer, P.; Lepš, J. Multivariate Analysis of Ecological Data Using CANOCO 5, 2nd ed.; Cambridge University Press: Cambridge, UK, 2014; ISBN 978-11-3962-706-1. [Google Scholar]
  34. Hamil, S.; Bouchelouche, D.; Arab, S.; Alili, M.; Baha, M.; Arab, A. The relationship between zooplankton community and environmental factors of Ghrib Dam in Algeria. Environ. Sci. Pollut. R 2021, 28, 46592–46602. [Google Scholar] [CrossRef] [PubMed]
  35. Li, H.; Li, Y.; Si, Y.; Du, C.; Zhou, X.; Liu, M.; Ning, H.; Ye, P. Principal component analysis and comprehensive evaluation of saline-alkaline tolerance related traits of northern japonica rice. J. Nucl. Agric. Sci. 2020, 34, 1862–1871. (In Chinese) [Google Scholar] [CrossRef]
  36. Liu, D.L.; Wang, X.Q.; Li, W.S.; Li, J.J.; Tan, W.B.; Xing, W. Genetic diversity analysis of the phenotypic traits of 215 sugar beet germplasm resources. Sugar Tech. 2022, 24, 1790–1800. [Google Scholar] [CrossRef]
  37. Chikh-Rouhou, H.; Mezghani, N.; Mnasri, S.; Mezghani, N.; Garcés-Claver, A. Assessing the genetic diversity and population structure of a tunisian melon (Cucumis melo L.) collection using phenotypic traits and SSR molecular markers. Agronomy 2021, 11, 1121. [Google Scholar] [CrossRef]
  38. Lodolini, E.M.; Polverigiani, S.; Giorgi, V.; Famiani, F.; Neri, D. Time and type of pruning affect tree growth and yield in high-density olive orchards. Sci. Hortic. 2023, 311, 111831. [Google Scholar] [CrossRef]
  39. Plavcová, L.; Mészáros, M.; Šilhán, K.; Jupa, R. Relationships between trunk radial growth and fruit yield in apple and pear trees on size-controlling rootstocks. Ann. Bot. 2022, 130, 477–489. [Google Scholar] [CrossRef]
  40. Song, Q.N.; Xiao, Z.Y.; Xu, J.W.; Song, S.L.; Luan, F.G.; Liu, J.; Yang, Q.P. Influence of neighbor competition and tree attributes on the fruit production of Sinomanglietia glauca, an endangered tree species endemic to China. Plant Ecol. 2021, 222, 561–573. [Google Scholar] [CrossRef]
  41. Gao, M.; Chen, Y.C.; Wu, L.W.; Wang, Y.D. Changes in the profiles of yield, yield component, oil content, and citral content in Litsea cubeba (Lour.) Persoon following foliar fertilization with zinc and boron. Forests 2019, 10, 59. [Google Scholar] [CrossRef]
  42. Li, H.S.; Wang, Y.D.; Xv, G.B.; Chen, Y.C.; Wu, L.W.; Yu, M.Y.; Gao, M. Analysis of the genetic variation and stability of growth traits of Litsea cubeba young plantation. For. Res. 2018, 31, 168–175. (In Chinese) [Google Scholar] [CrossRef]
  43. Li, H.S.; Wang, Y.D.; Chen, Y.C.; Gao, M.; Wu, L.W.; Xv, G.B. Genetic variation analysis of growth and economic characteristics and superior family selection in Litsea cubeba. Non-Wood Forest Res. 2017, 35, 64–71. (In Chinese) [Google Scholar] [CrossRef]
  44. Yang, Y.-N.; Zheng, F.-P.; Yu, A.-N.; Sun, B.-G. Changes of the free and bound volatile compounds in Rubus corchorifolius L. f. fruit during ripening. Food Chem. 2019, 287, 232–240. [Google Scholar] [CrossRef] [PubMed]
  45. Frenkel, C.; Hartman, T.G. Decrease in fruit moisture content heralds and might launch the onset of ripening processes. J. Food Sci. 2012, 77, S365–S376. [Google Scholar] [CrossRef] [PubMed]
  46. Zhang, T.; Zheng, Y.; Fu, C.; Yang, H.; Liu, X.; Qiu, F.; Wang, X.; Wang, Z. Chemical variation and environmental influence on essential oil of Cinnamomum camphora. Molecules 2023, 28, 973. [Google Scholar] [CrossRef]
  47. Karami, A.; Khoushbakht, T.; Esmaeili, H.; Maggi, F. Essential oil chemical variability in Oliveria decumbens (Apiaceae) from different regions of iran and its relationship with environmental factors. Plants 2020, 9, 680. [Google Scholar] [CrossRef]
  48. Tripp, E.A.; Zhuang, Y.; Schreiber, M.; Stone, H.; Berardi, A.E. Evolutionary and ecological drivers of plant flavonoids across a large latitudinal gradient. Mol. Phylogenet. Evol. 2018, 128, 147–161. [Google Scholar] [CrossRef]
  49. Rahimmalek, M.; Heidari, E.F.; Ehtemam, M.H.; Mohammadi, S. Essential oil variation in Iranian Ajowan (Trachyspermum ammi (L.) Sprague) populations collected from different geographical regions in relation to climatic factors. Ind. Crops Prod. 2017, 95, 591–598. [Google Scholar] [CrossRef]
  50. Félix, M.-A. Phenotypic evolution with and beyond genome evolution. Curr. Top. Dev. Biol. 2016, 119, 291–347. [Google Scholar] [CrossRef]
  51. Halbritter, A.H.; Fior, S.; Keller, I.; Billeter, R.; Edwards, P.J.; Holderegger, R.; Karrenberg, S.; Pluess, A.R.; Widmer, A.; Alexander, J.M. Trait differentiation and adaptation of plants along elevation gradients. J. Evol. Biol. 2018, 31, 784–800. [Google Scholar] [CrossRef]
  52. Huang, C.S.; Xu, Y.; Zang, R.G. Variation patterns of functional trait moments along geographical gradients and their environmental determinants in the subtropical evergreen broadleaved forests. Front. Plant Sci. 2021, 12, 686965. [Google Scholar] [CrossRef] [PubMed]
  53. Ma, Y.; Wang, S.; Liu, X.; Yu, H.; Yu, D.; Li, G.; Wang, L. Oil content, fatty acid composition and biodiesel properties among natural provenances of Siberian apricot (Prunus sibirica L.) from China. GCB Bioenergy 2021, 13, 112–132. [Google Scholar] [CrossRef]
  54. Guo, J.; Zhou, X.; Wang, T.L.; Wang, G.B.; Cao, F.L. Regulation of flavonoid metabolism in ginkgo leaves in response to different day-night temperature combinations. Plant. Physiol. Bioch. 2020, 147, 133–140. [Google Scholar] [CrossRef] [PubMed]
  55. Marčetić, M.; Kovačević, N.; Lakušić, D.; Lakušić, B. Habitat-related variation in composition of the essential oil of Seseli rigidum Waldst. & Kit. (Apiaceae). Phytochemistry 2017, 135, 80–92. [Google Scholar] [CrossRef]
  56. Feng, X.; Zhang, W.; Wu, W.; Bai, R.; Kuang, S.; Shi, B.; Li, D. Chemical composition and diversity of the essential oils of Juniperus rigida along the elevations in Helan and Changbai Mountains and correlation with the soil characteristics. Ind. Crop. Prod. 2021, 159, 113032. [Google Scholar] [CrossRef]
  57. Melito, S.; Petretto, G.L.; Podani, J.; Foddai, M.; Maldini, M.; Chessa, M.; Pintore, G. Altitude and climate influence Helichrysum italicum subsp. microphyllum essential oils composition. Ind. Crop. Prod. 2016, 80, 242–250. [Google Scholar] [CrossRef]
  58. Dong, L.; Li, T.; Huang, W.Y.; Wang, B.; Xv, L.C.; Xv, L.A.; Wen, Q. Selection and comprehensive evaluation of superior individual plant in Camellia chekiangoleosa. J. Cent. South Univ. For. Technol. 2021, 41, 35–45. (In Chinese) [Google Scholar] [CrossRef]
  59. Gao, M.; Chen, Y.C.; Wu, L.W.; Wang, Y.D. Genetic variation of seedling growth of Litsea cubeba from different provenances/families. J. Tropi. Subtrop. Plants 2018, 26, 47–55. (In Chinese) [Google Scholar] [CrossRef]
  60. Wang, H.; Li, Y.; Li, Z.; Ma, R.; Bai, X.; Zhan, X.; Luo, K.; Su, R.; Li, X.; Xia, X.; et al. Inhibition of Cronobacter sakazakii by Litsea cubeba essential oil and the antibacterial mechanism. Foods 2022, 11, 3900. [Google Scholar] [CrossRef]
  61. Lin, B.; Liu, Q. Plasticity responses of 4 tree species in subalpine-coniferous-forest to different light regimes. J. Ecol. 2008, 28, 4665–4675. [Google Scholar] [CrossRef]
Figure 1. The schematic diagram of the fruit and seed traits of L. cubeba.
Forests 14 02283 g001
Figure 2. Geographical location diagram of 27 provenances for sampling in Jiangxi province, China. (a) the location of Jiangxi province; (b) topographic overview of Jiangxi province.
Forests 14 02283 g002
Figure 3. Diversity of EO components of L. cubeba of 21 provenances. Proportions of eight main components of EOs in the 21 provenances. Values are the average of three replicates of a single tree of L. cubeba.
Forests 14 02283 g003
Figure 4. Correlations between environmental factors and phenotypes among provenances. The symbol indicated that there is a significant difference * in 0.05 level and ** in 0.01 level. The strength of correlation was represented by the circle size (the higher the correlation coefficient, the larger the circle). Red and blue of the circles indicate positive and negative correlations, respectively.
Forests 14 02283 g004
Figure 5. Redundancy analysis to detect relationships between environmental factors and phenotypic traits. Data for eight environmental variables and twenty phenotypic traits were included. RDA1 explained 16.99% of phenotypic diversity, and RDA2 explained 11.74%.
Forests 14 02283 g005
Figure 6. Scatter plot of FFY of individual L. cubeba trees. All small squares are single trees, with red indicating excellent trees and blue indicating other trees.
Forests 14 02283 g006
Figure 7. Scatter plots of EO content and CitrP in individual L. cubeba trees. (a) EO content (in fresh fruit); (b) the proportion of citral (in EOs). All small squares are single trees, with red indicating excellent trees and blue indicating other trees.
Forests 14 02283 g007
Figure 8. Hierarchical clustering analysis of 27 provenances on the basis of FFY. Different groups are shown in different colors.
Forests 14 02283 g008
Figure 9. Hierarchical clustering analysis of 21 provenances based on EO content and CitrP in EO. (a) EO content (in fresh fruit); (b) the proportion of citral (in EOs); different groups are shown in different colors.
Forests 14 02283 g009
Disclaimer/Publisher’s Note: The statements, opinions and data contained in all publications are solely those of the individual author(s) and contributor(s) and not of MDPI and/or the editor(s). MDPI and/or the editor(s) disclaim responsibility for any injury to people or property resulting from any ideas, methods, instructions or products referred to in the content.

