Article

Utilizing SIFT-MS and GC-MS for Phytoncide Assessment in Phytotron: Implications for Indoor Forest Healing Programs

Forest Human Service Division, Future Forest Strategy Department, National Institute of Forest Science, Seoul 02455, Republic of Korea
*
Author to whom correspondence should be addressed.
Forests 2023, 14(11), 2235; https://doi.org/10.3390/f14112235
Submission received: 17 October 2023 / Revised: 2 November 2023 / Accepted: 10 November 2023 / Published: 13 November 2023
(This article belongs to the Special Issue Forest, Trees, Human Health and Wellbeing)

Abstract

:
This study addresses the growing need for phytoncide studies, driven by the demand to design indoor forest healing programs, including virtual reality experiences, for patients unable to visit actual forests. Previous studies have struggled to establish consistent phytoncide emission patterns in outdoor forest environments owing to varying microclimates and abiotic factors. In addition, the traditional gas chromatography–mass spectroscopy (GC-MS) method presents field measurement challenges, whereas the selected ion flow tube (SIFT)-MS method offers improved efficiency. This study concentrated on a controlled phytotron environment and compared the GC-MS and SIFT-MS findings, revealing similar emission trends with slightly higher SIFT-MS concentrations. Daily phytoncide emissions fluctuated with light intensity and abiotic stressors. Both methods consistently detected pinenes, primarily emitted by Pinus strobus L. seedlings, in the phytotron. Statistical analysis confirmed the compatibility between GC-MS and SIFT-MS results, supporting the use of SIFT-MS for forest phytoncide assessment. In the second phase, the phytoncide emissions were assessed indoors, outdoors, and in the phytotron, highlighting the superiority of the phytotron under controlled conditions. Despite certain limitations, this study underscores the value of phytotron-based measurements for indoor forest healing programs and the potential adoption of SIFT-MS in future field-based phytoncide research.

1. Introduction

In recent years, the therapeutic benefits of exposure to natural environments, particularly forests, have garnered significant attention in the field of healthcare [1,2,3]. These “forest healing” experiences have shown remarkable potential for alleviating stress, improving mental well-being, and promoting overall health [4,5,6]. However, as the demand for these healing programs continues to grow, researchers face the challenge of designing indoor forest healing experiences, including virtual reality simulations, to cater to individuals who are unable to access actual forests. Pivotal to this endeavor is the understanding of phytoncides, which are natural volatile organic compounds (NVOCs) emitted by trees and plants that have been identified as key contributors to the beneficial effects of forest environments on human health [7,8,9].
Phytoncides, natural aromatic compounds released by trees and plants, have emerged as subjects of profound scientific interest because of their multifaceted roles in ecological interactions, human health, and well-being. These organic volatiles constitute essential components of the chemical communication system utilized by the plant kingdom, playing pivotal roles in both plant defense mechanisms and interspecies communication [10,11]. Beyond their ecological significance, phytoncides have garnered attention for their potential therapeutic properties in humans, with growing research indicating their positive effects on mental and physical health, such as the enhancement of immune function, anti-inflammatory effects, and alleviation of depression [7,8,9]. In the face of global urbanization and growing disconnection from natural environments, understanding the complex chemistry and myriad functions of phytoncides has become pivotal not only for advancing ecological science but also for promoting human health in an increasingly urbanized and technologically driven global landscape.
Although the concept of phytoncides and their potential health benefits has gained attention, previous research in this field has encountered substantial hurdles. One primary obstacle is the difficulty of establishing consistent phytoncide emission patterns in outdoor forest environments. The variability in microclimates and abiotic factors across different forest ecosystems has posed a significant challenge in identifying universal emission profiles. To address these challenges and advance our understanding of phytoncides, this study focused on controlled environments, particularly phytotrons, as reliable settings for phytoncide assessment. In the pursuit of advancing our understanding of plant growth, environmental interactions, and the dynamic complexities of the botanical world, researchers have increasingly utilized controlled environments that mimic natural conditions, with one of the most notable being phytotrons [12,13,14,15]. Phytotrons, which are specialized facilities designed to create tailored ecosystems under precisely controlled conditions, have become indispensable tools in botanical research, ecological studies, and agricultural advancement. Their capacity to manipulate environmental variables such as temperature, humidity, light, and carbon dioxide levels enables unparalleled experimentation and observation, offering valuable insights into plant physiology, adaptation, and responses to environmental stressors [12,13,14,15,16,17].
In addition, conventional gas chromatography–mass spectrometry (GC-MS), which is commonly used to measure phytoncide concentrations, presents field measurement challenges owing to its complexity and time-consuming nature. To address these challenges, this study aims to compare the efficacy of two analytical methods, GC-MS and selected ion flow tube–MS (SIFT-MS), for measuring phytoncide emissions in a controlled phytotron environment. GC-MS and SIFT-MS are two distinct analytical methodologies that have been instrumental in elucidating volatile organic compounds, including phytoncides. These methods offer unique advantages and challenges, rendering them valuable tools in various research contexts. GC-MS is a well-established and widely used technique that provides exceptional separation and quantification capabilities, enabling the precise identification of compounds in complex mixtures [18]. However, its utility in field measurements is often hampered by labor-intensive and time-consuming sample preparation processes that limit its applicability to dynamic environments. In contrast, SIFT-MS, a relatively new entrant, excels in real-time analysis and high-throughput sampling, enabling rapid data acquisition and simplified sample handling [18,19]. This attribute renders SIFT-MS particularly well suited for studies that demand continuous monitoring or measurements in remote or challenging settings. In this study, we performed a comprehensive comparative analysis of these two analytical techniques in the context of phytoncide research.
These findings not only shed light on the compatibility of these techniques but also provide valuable insights into the emission trends of phytoncides, their fluctuations in response to light intensity and abiotic stressors, and their presence in specific plant species. This highlights the significance of using phytotron-based measurements to contribute to the development of indoor forest healing programs, particularly for individuals who cannot access natural forests or virtual reality environments. Furthermore, the research findings indicate the potential adoption of SIFT-MS as a more efficient alternative to GC-MS for future field-based studies of phytoncides. Moreover, this study extended the investigation to include phytoncide emission assessments in indoor and outdoor settings, enabling a comprehensive comparison of emission patterns across different environments.

2. Materials and Methods

2.1. Study Site

This study was conducted at an experimental facility for plant environmental control within the Hongneung Experimental Forest, located at the National Institute of Forest Science (NIFoS) in Seoul, Republic of Korea. Known as the Hongneung Forest and Hongneung Arboretum, this site has significant historical, cultural, and academic significance. It holds the distinction of being the first arboretum in Korea, established in 1922, and has served as the initial research location for modern forestry practices. Situated in the eastern part of Seoul, at the southwest base of Cheonjangsan Mountain, it is situated at an elevation of 141 m above sea level. The exact coordinates for the survey site are 37°35′45″ N latitude and 127°02′37″ E longitude. The Hongneung Experimental Forest covers an area of approximately 41.2 ha. The area harbors 2035 plant species and includes eight distinct gardens featuring both natural and cultivated forest sections.

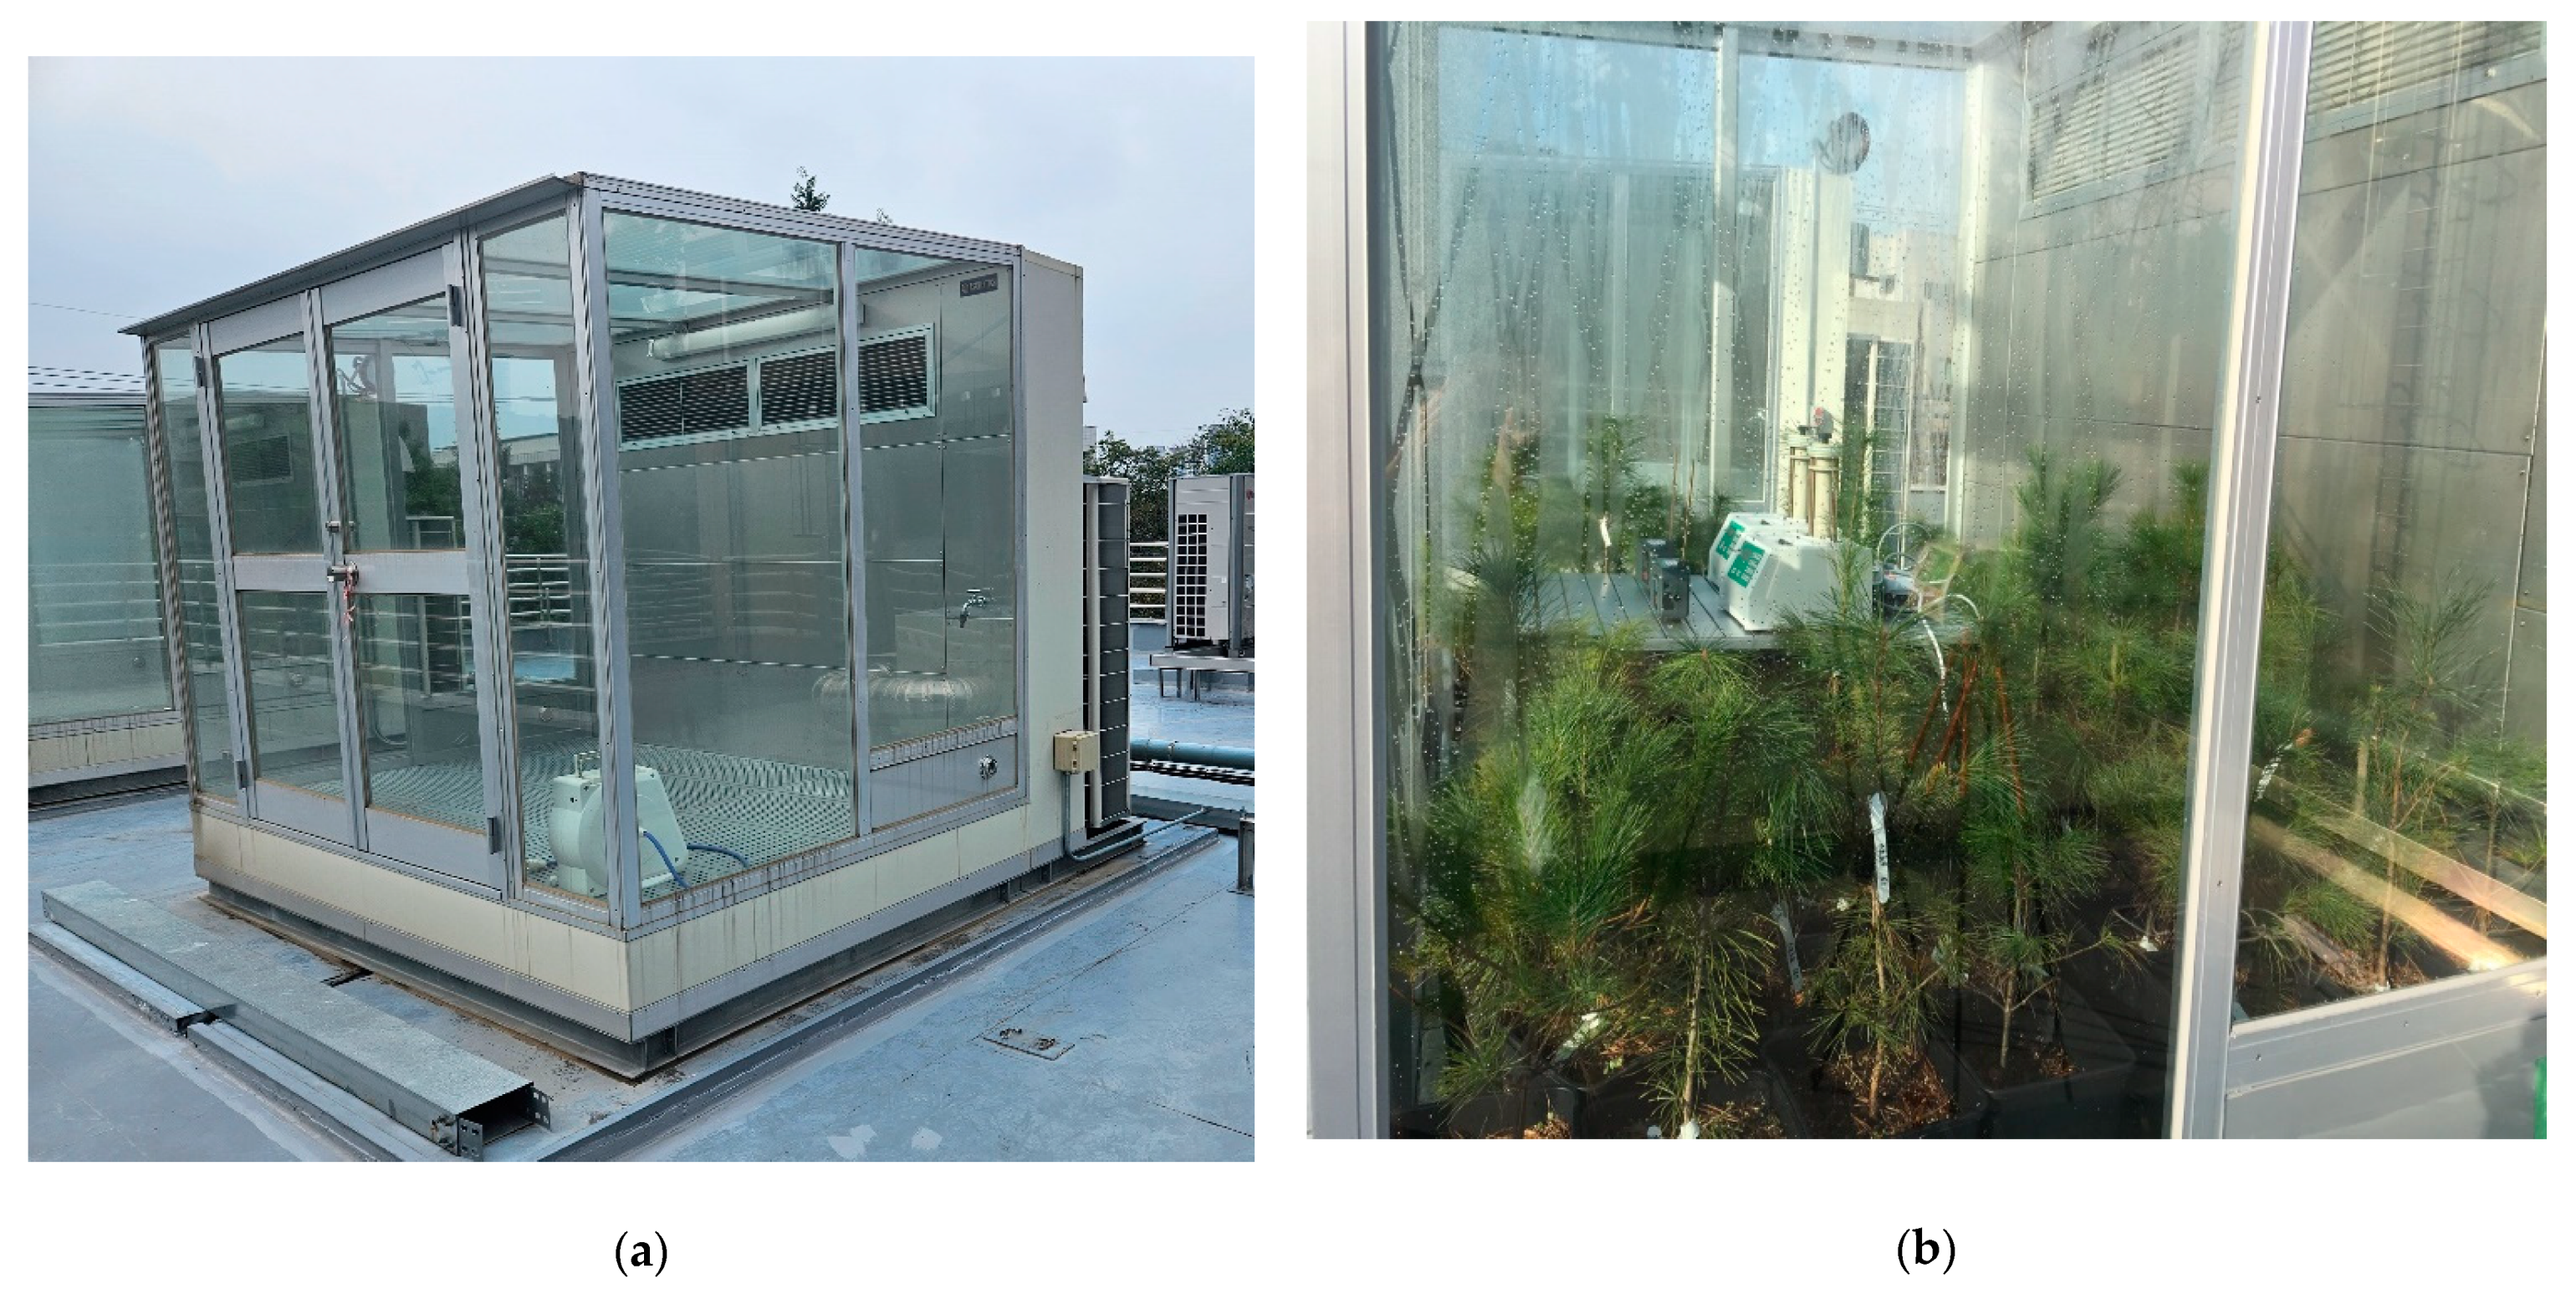
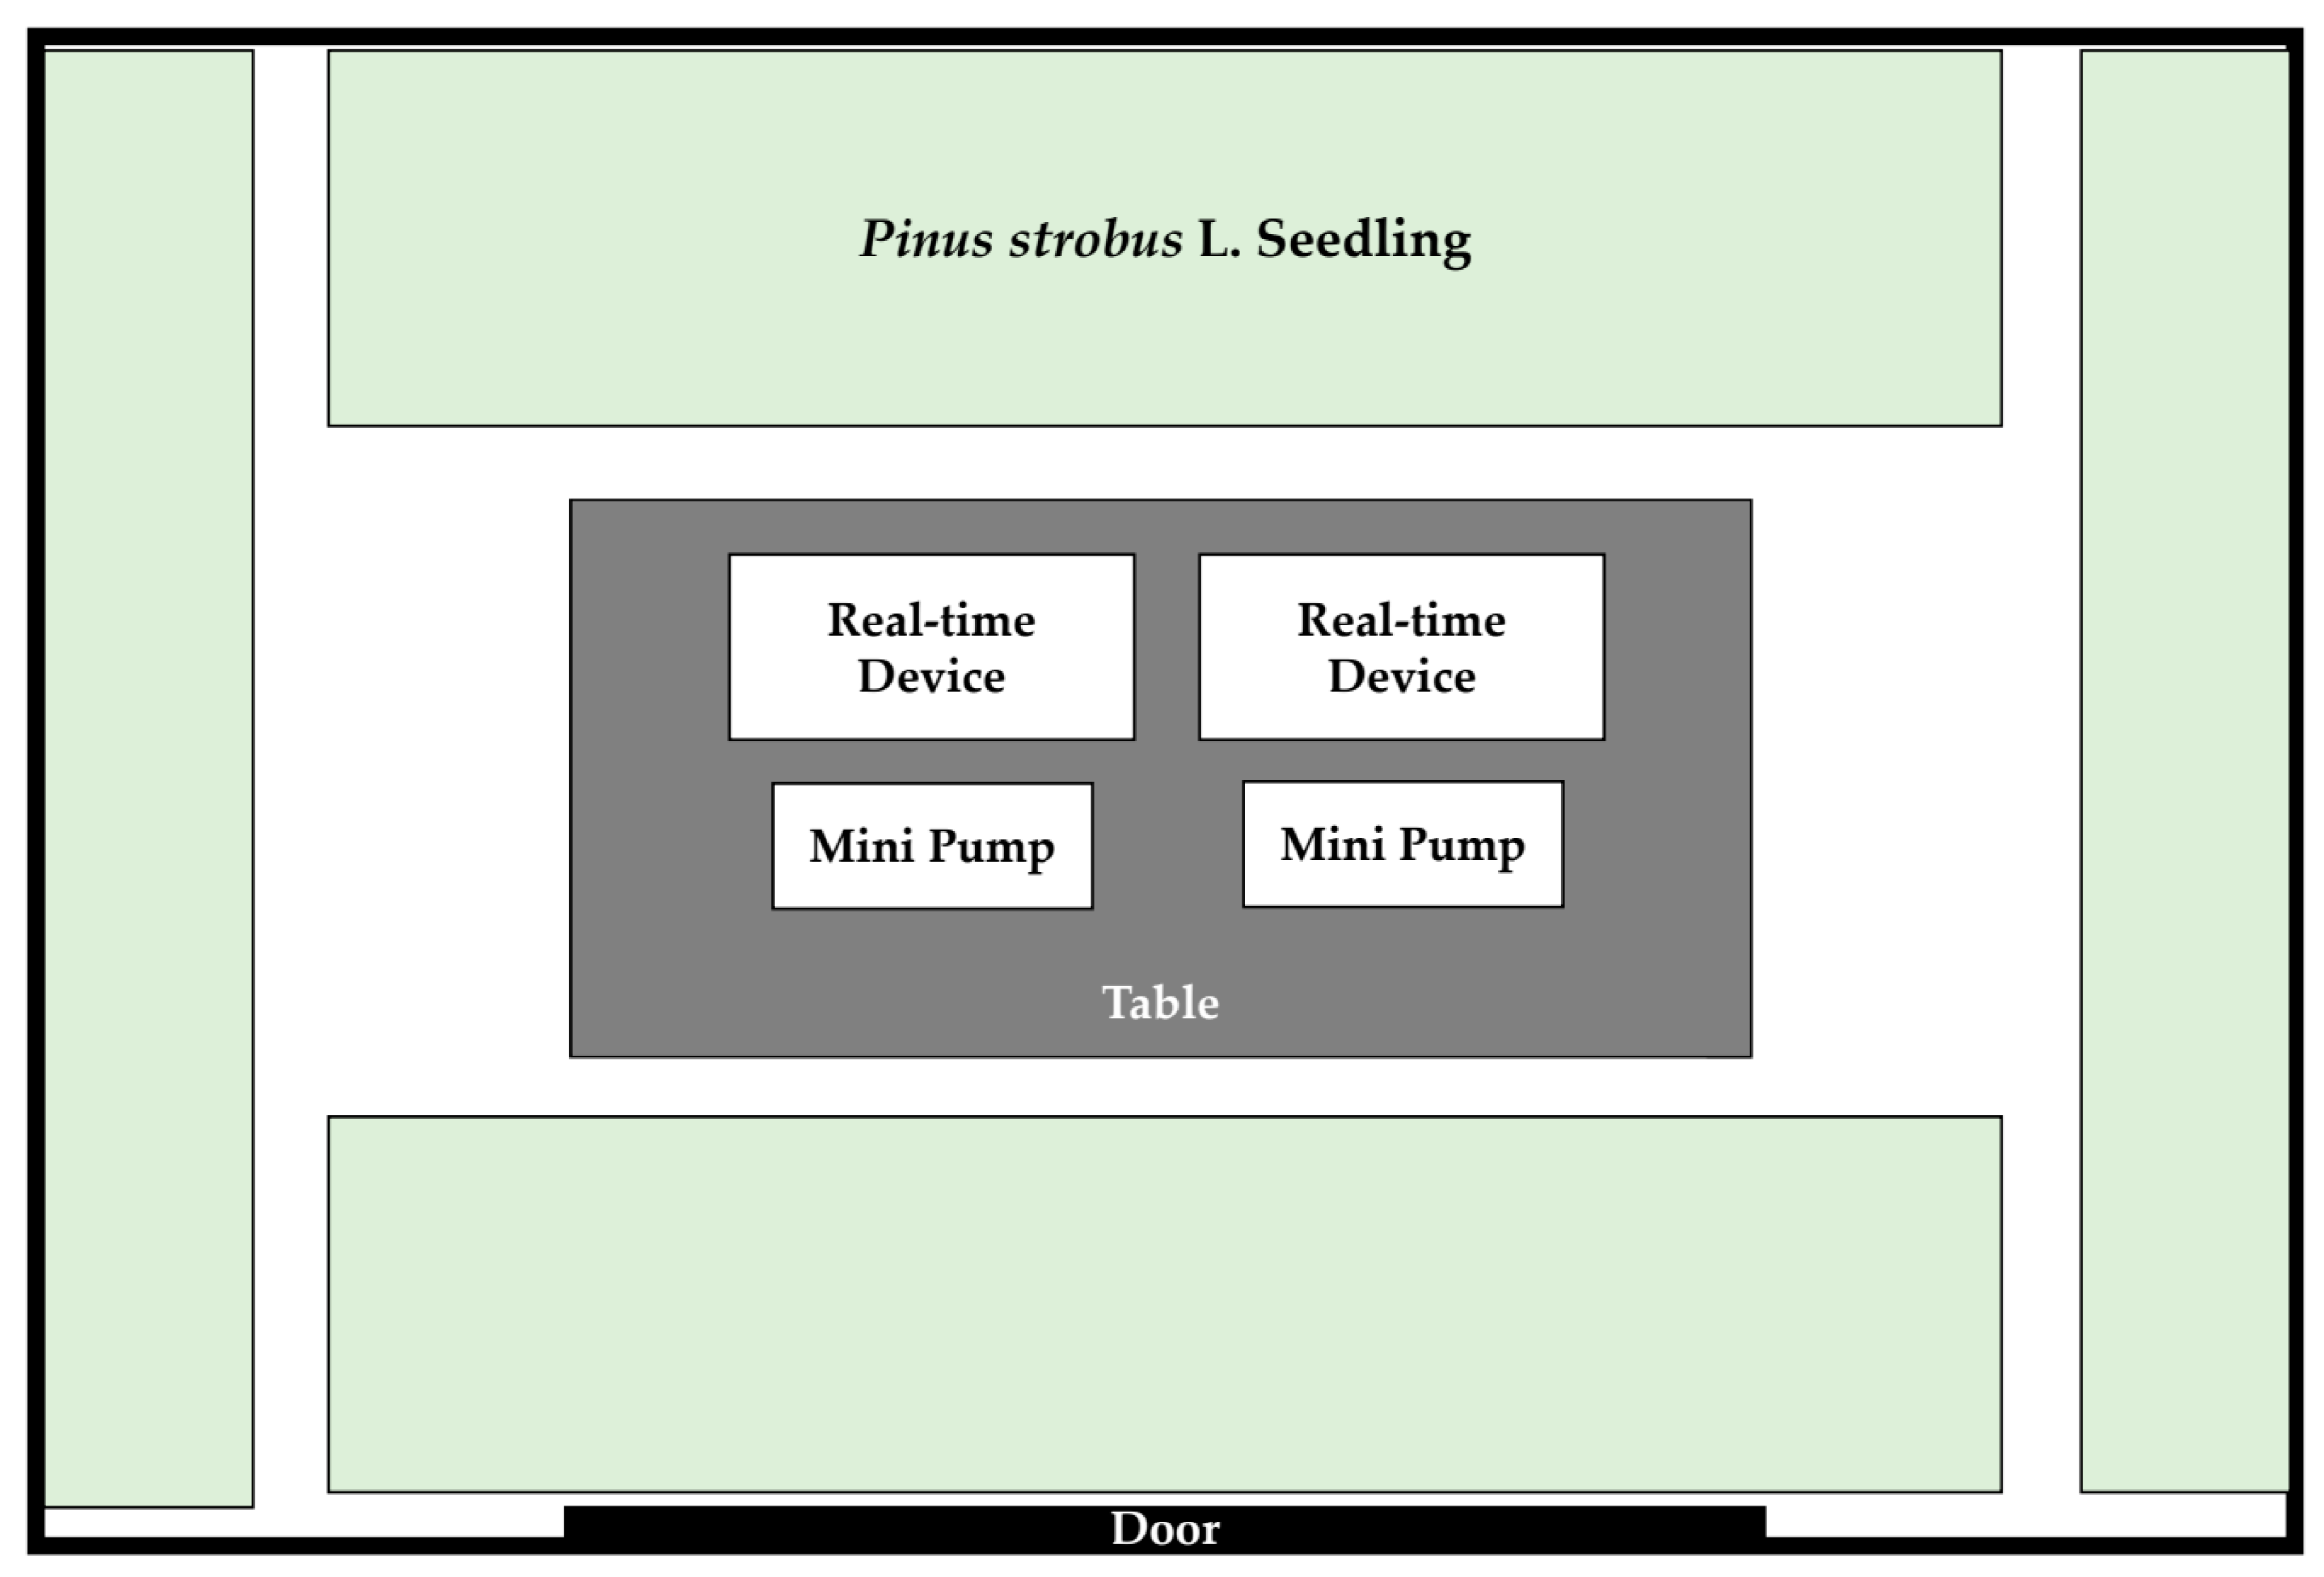
2.1.1. NIFoS Phytotron

The phytotron used in this study was a structure surrounded by transparent glass located on the roof of the plant environment control experimental building, as shown in Figure 1a,b. It is a standard type phytotron, which is a structure that enhances energy efficiency by utilizing infrared cut filter glass. Owing to the structural characteristics, the temperature, humidity, and airflow could be controlled, whereas the light environment could not be controlled. The study was conducted on a clear day, the temperature in the phytotron was 25.0 °C (±1.0 °C), and the relative humidity was 60.0% (±7.0%), which remained constant throughout the experiment. The wind velocity was meticulously regulated to not exceed 0.5 m/s, and the area underwent controlled ventilation, achieving an hourly frequency of four air exchanges. The phytotron was 2.7 m in width, 1.8 m in length, and had a height of 1.8 m. Two real-time measuring devices and two mini pumps were installed inside the phytotron, and 52 Pinus strobus L. seedling pots were placed around them (Figure 2). Pinus strobus L. seedlings were three years of age, approximately 1 m in height, including a pot. The layout of the phytotron interior is shown in Figure 2.

2.1.2. NIFoS Indoor Study

An indoor study was conducted in a general laboratory in the building on which the phytotron was installed. Similar to the phytotron, two real-time measuring instruments and two mini pumps were installed on a table, and 52 Pinus strobus L. seedling pots were placed around them in the same manner as they were installed in the phytotron (Figure 2). The windows and doors were closed during the experiment, and the inside of the laboratory was primarily shaded without sunlight, even during the daytime.

2.1.3. NIFoS Outdoor Study

Outdoor measurements were conducted on the roof of the building on which the phytotron was installed. Next to the phytotron structure, the overall phytoncide concentration in the Hongneung Experimental Forest was measured using a real-time meter and a mini pump. An illustration of this installation is shown in Figure 3.

2.2. Data Collection Methods

This study was conducted on 22 and 27 November 2019. On 22 November, the phytoncide concentrations in the indoor laboratory were measured using real-time measuring devices and mini pumps. In addition, on 27 November, the phytoncide concentrations inside and outside the phytotron were measured using a real-time measuring device and a mini pump. Details of the NVOC and microclimate environmental data indicators measured in this study are shown in Table 1.

2.2.1. NVOCs Measured Using the Mini Pump

NVOCs were collected every two hours from the morning (10:00) to the afternoon (16:00) over the course of a two-day research period, specifically targeting peak forest visitation times. The collection process involved the use of adsorption tubes containing 150 mg of Tenax TA (Markes International Inc., Sacramento, CA, USA). The levels of NVOCs were quantified in micrograms per cubic meter (μg/m3), where “m3” denotes the volume of the surrounding environment at the measurement sites. The total air volume of nine liters collected within one hour was converted into cubic meters, as explained below.
For the sample collection system, a mini pump (MP-30KN; Sibata Scientific Technology Ltd., Saitama, Japan) was employed. Calibration of the flow meter preceded its usage, involving the measurement of adsorption errors. The NVOCs (nine liters total) were collected at a flow rate of 150 mL/min. A previous study aimed at improving the precision and efficiency of NVOC measurements in forests examined various sampling volumes and determined that 9 L provided the most efficient results compared to volumes of 1, 3, 6, 9, 12, 24, and 48 L [20]. Consequently, this study also adopted a nine-liter air volume. The sampling equipment was positioned on a tripod at a height of 1.5 m above the ground, and this process was repeated at each location to calculate the average value. Disposable polyethylene gloves and antibacterial masks were used to prevent potential contamination of tubes. The sampled tubes were stored at a temperature below 4 °C for 48 h after collection and prior to analysis (Table 2). To minimize the possibility of errors, data from tubes collected without the Tenax TA were also considered.
The samples were subjected to qualitative and quantitative analyses using a gas chromatograph–mass spectrometer (model 7890N-5975; Agilent, Santa Clara, CA, USA) equipped with a thermal desorption device (GC-MSD; Gerstel TDS, Gerstel, Germany). In this system, the substances adsorbed onto the tube were concentrated in a low-temperature cryofocusing system. This system used high-purity helium gas from a thermal desorption device at a flow rate of 1 mL/min. The gas was desorbed for 3 min at 210 °C, with the cryofocusing maintaining a temperature of −30 °C. Subsequently, the compounds underwent a three-minute heating process at 220 °C before being injected into a GC spectrometer and detected through mass spectrometry.
Various measures were employed to validate the analytical instruments and procedures. One such measure involved creating a calibration curve using 20 different standard chemical compounds, including α-pinene and β-pinene. Using this calibration curve to determine the mass number of each element and the square of its dilution rate with standard materials, most materials displayed a high degree of linearity, exceeding 0.997. Examples of substances with notably high linearity included α-pinene (R2 = 0.997), β-pinene (R2 = 0.998), and d-limonene (R2 = 0.999). The experiments involving these substances demonstrated remarkable consistency in terms of the linear correlation coefficient, rendering them suitable for research purposes.

2.2.2. Quantifying NVOCs Using Real-Time VOC Measuring Equipment

The real-time assessment of phytoncide concentrations indoors and within the phytotron environment was conducted using a SYFT Voice200 ULTRA Advanced SIFT Mass Spectrometer (Syft Technologies, Christchurch, New Zealand). This instrumentation, recognized as a SIFT-MS device, possesses the unique capability to perform both qualitative and quantitative analyses directly at the parts per trillion by volume level without necessitating preliminary sample treatment. Furthermore, this analysis is executed in real time, effectively circumventing the time-intensive nature associated with GC-MS, as noted in the literature [21]. The operational modality of SIFT-MS is delineated as follows:
  • SIFT-MS generates three distinct reagent ions (H3O+, NO+, and O2+) using microwave plasma energy facilitated by the presence of nitrogen, oxygen, and moisture within the ambient atmosphere. The generated reagent ions are filtered through an initial quadrupole mass filter before sequentially entering the flow tube.
  • Subsequently, the generated reagent ions are introduced sequentially into the flow tube, where they undergo stabilization through collisions with the cooling gas. Once stabilized, these reagent ions encounter the sample and initiate ionization reactions. The flow tube maintains a consistent flow rate, temperature, and pressure while transferring the energy of the reagent ions to the sample, thereby generating product ions.
  • Surplus reagent ions that did not react with the generated product ions are filtered through a secondary quadrupole mass filter. The concentration of the sample can be promptly ascertained by utilizing the data stored in the comprehensive compound library of Syft, which encompasses pertinent parameters, such as collision constants, reaction rate constants, and reaction rates [21,22,23].
In contrast to conventional GC-MS, this approach enables the unique ability to introduce an analyte without the need for a separate standard substance, facilitating the continuous monitoring of concentration variations via an online system in real time. Moreover, notably, this technology is designed to be user friendly and accommodate individuals lacking extensive expertise, with automatic validation and self-calibration functionalities.

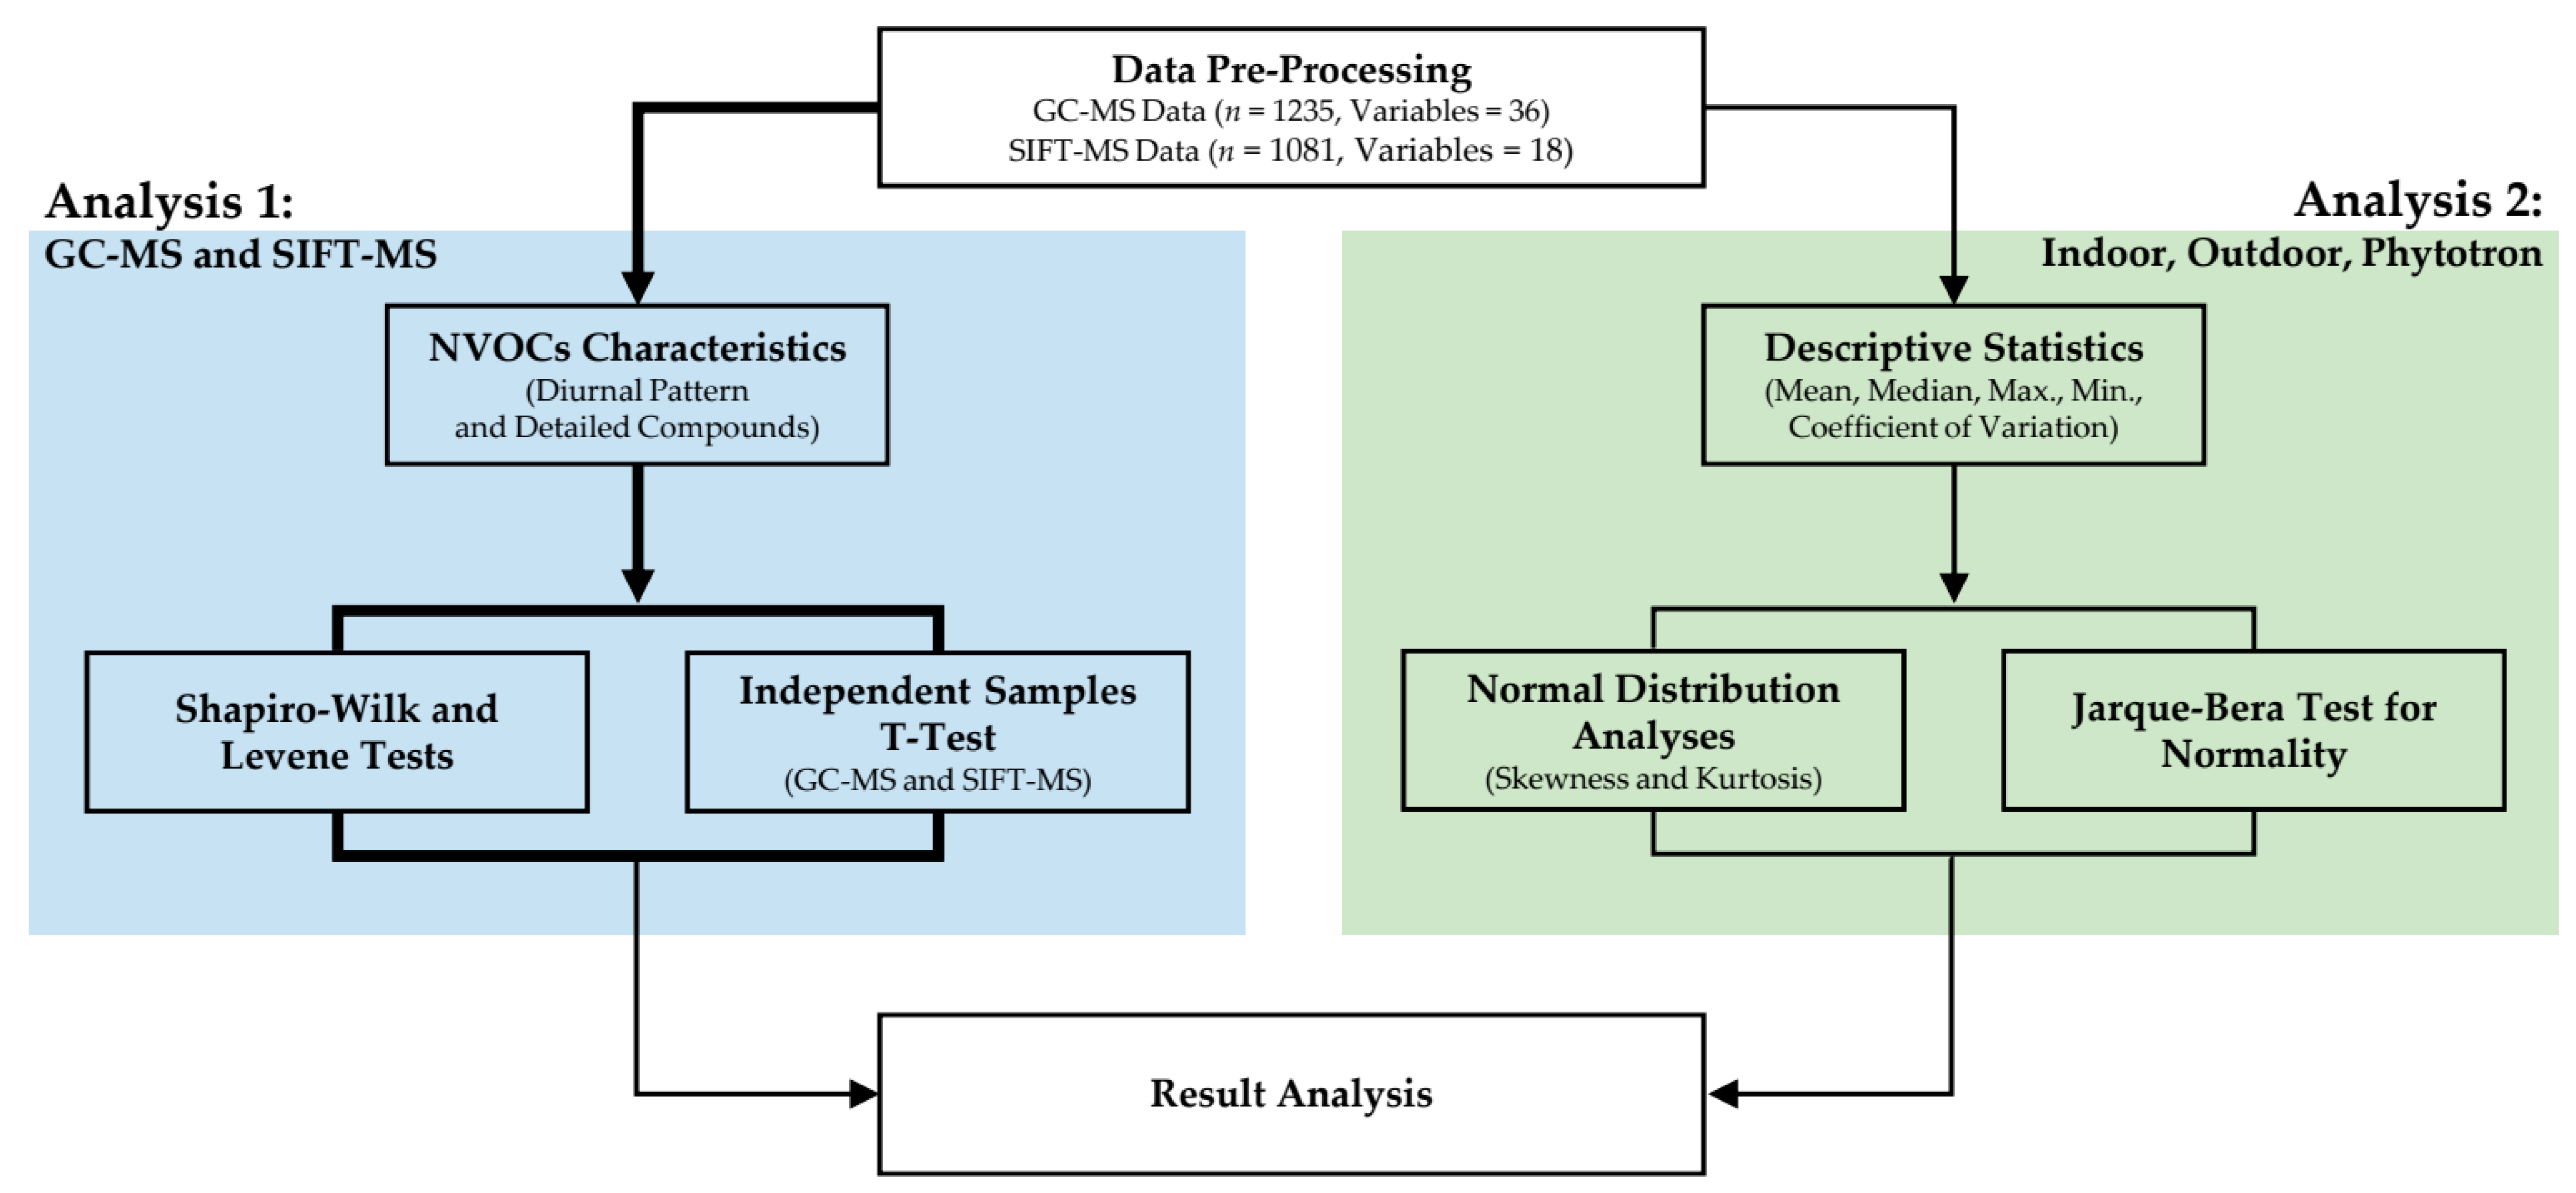
2.3. Data Analysis Methods

First, the diurnal pattern of NVOC concentrations and the ratios of detailed components were compared based on GC-MS and SIFT-MS datasets. Next, to determine the statistical difference between the results of the two measurement methods, an independent samples t-test was conducted after the Shapiro–Wilk and Levene tests were performed. For the second analysis, descriptive statistics were used to determine the characteristics of the phytoncide emissions measured indoors, outdoors, and in the phytotrons. The skewness and kurtosis of the dataset obtained at each measurement site were investigated, and the Jarque–Bera test for normality was performed (Figure 4).

3. Results

3.1. Characteristics of NVOCs at the NIFoS Phytotron by SIFT-MS and GC-MS

3.1.1. Diurnal Characteristics of NVOC Emissions

The NVOC concentrations analyzed by SIFT-MS and GC-MS are shown in Figure 5. Overall, the concentration detected by the SIFT-MS method was comparatively high, and both analysis methods showed similar increasing and decreasing trends. In particular, in the case of NVOCs, it was confirmed that they were discharged at a constant emission of approximately 30 μg/m3 during nighttime in the phytotron. When comparing the average concentrations from morning (10:00) to afternoon (14:00), when the two devices were measured at the same time, NVOC concentrations were 41.8 μg/m3 in the SIFT-MS method and 36.2 μg/m3 in the GC-MS method.

3.1.2. NVOC Detailed Compound Ratio Analysis

The detailed components of the NVOC concentrations measured using SIFT-MS and GC-MS are shown in Figure 6. Owing to the classification of detection items in real-time measuring instruments, alpha-pinene, beta-pinene, and 3-carene were detected integrally, while alpha-terpinene and gamma-terpinene were also detected integrally. According to the SIFT-MS analysis results, 14 compounds were detected in the following order: pinene (63.0%), myrcene (14.2%), benzaldehyde (3.5%), limonene (3.1%), and terpinene (3.1%). In the GC-MS analysis, 11 compounds were detected, including pinene (72.7%) and myrcene (18.1%), as in SIFT-MS. Subsequently, elevated concentrations were observed in the order of camphene (2.4%), limonene (1.7%), and eucalyptol (1.6%).

3.1.3. Independent Samples t-Test for NVOC Measurement Results

An independent samples t-test was conducted to ascertain the presence of a notable distinction between the NVOC concentrations obtained from the mini pump and those obtained from the real-time measuring device. Prior to conducting the independent samples t-test, both the Shapiro–Wilk normality test and Levene’s test for homogeneity of variance were applied. The normality test yielded p-values greater than 0.05 for both the mini pump and the real-time measuring instrument, thereby confirming the assumption of normality for both groups. In the homogeneity of variance test, the p-value was 0.197, indicating uniform variance between the two groups. Consequently, an independent samples t-test was performed on the two groups, and the detailed results are shown in Table 3. The obtained p-value of 0.144 confirmed that there was no statistically significant difference in the mean values between the two groups. This indicates that the NVOC concentration measurements in the two groups did not exhibit a statistically significant disparity.

3.2. Characteristics of NVOCs: Indoors, Outdoors, and in the Phytotron

3.2.1. Diurnal Characteristics of NVOC Emissions

After examining the diurnal pattern of phytoncide emission according to the measurement location, the average phytoncide concentration was elevated in the order of the phytotron (38.1 μg/m3), indoors (21.6 μg/m3), and outdoors (0.6 μg/m3). Outdoor phytoncide emissions over time were highest in the morning, decreased during midday hours when solar radiation was high, and showed an increasing trend in the late afternoon (Figure 7). In the case of the phytotron, they were lowest in the morning, peaked during midday hours, slightly decreased, and then increased again. Meanwhile, in the case of indoor environments, it was confirmed that phytoncide concentration increased over time. Indoor phytoncide concentrations were measured on 22 November 2019, whereas outdoor and phytotron phytoncide concentrations were measured on 27 November 2019.

3.2.2. Descriptive Statistics of NVOC Emissions

Table 4 presents the descriptive statistics of the NVOC emission results according to the measurement location. The coefficient of variation was the lowest in the phytotron results and the highest in the outdoor results. With regard to skewness, all three variables were right-skewed, and the degree of skewness was highest in the outdoor measurements. From the results of the kurtosis analysis, the distribution of results indoors and in the phytotron was relatively wider than that outdoors. Finally, we determined whether the skewness and kurtosis of the data matched the normal distribution using the Jarque–Bera test for normality. The Jarque–Bera statistics confirmed that the outdoor dataset does not show a normal distribution because its value was greater than 5.99. In addition, the p-value of the results of the Jarque–Bera test for the outdoor data was less than 0.05, confirming that the data were not normally distributed.

4. Discussion

As the health-promoting effects of the phytoncides emitted by plants are acknowledged, the demand for research on phytoncides is increasing. Several prior studies have been conducted to detect the phytoncide concentration emitted by forests and to investigate the effect of forest healing [4,5,6,24,25,26]. However, concerning forests, due to the nature of the outdoor environment, changes in phytoncide emissions are affected by various microclimate environments and abiotic factors [20,24,27]. Therefore, it is difficult to determine the average phytoncide emissions of certain forest species, and we believe that it is necessary to study the consistent volume of phytoncide emissions by species or forests that can be applied to the development of forest healing programs for groups that have difficulty visiting forests in person and programs through virtual reality. In addition, the conventional GC-MS method has difficulty with field measurements because researchers must undertake prolonged stays in the forest and require specialized skills. However, SIFT-MS has the advantage of significantly reducing the required research personnel and time by enabling real-time measurements and data analysis. Therefore, in this study, a phytotron, which can control the microclimate environment and abiotic factors, was set as the primary research site, and the GC-MS and SIFT-MS methods were compared during the first experimental phase. In the second phase, the phytoncide results measured indoors, outdoors, and in the phytotron were analyzed to determine the effect of abiotic factors on phytoncide emissions.
After analyzing VOC emissions from the phytotron using GC-MS and SIFT-MS, both GC-MS and SIFT-MS methods showed similar emission trends and SIFT-MS showed slightly higher detection amounts. This is assumed to be because the SIFT-MS method is less affected by humidity and detects and tests the concentrations in real time [27]. When examining the hourly emission characteristics of phytoncides, it was confirmed that the phytoncides were discharged at a constant concentration from midnight to approximately 10:00. This study was conducted on a clear day. Concerning the phytotron, where the study was conducted, the temperature and humidity were constantly controlled, but light was not controllable and was affected by outdoor weather. Trees synthesize phytoncides as a secondary metabolite of photosynthesis, and abiotic stress factors, such as pathogen attack, UV irradiation, strong light, wounding, temperature, nutrient deficiencies, and herbicide treatment, increase the secondary metabolites of trees [28,29]. Therefore, although a certain phytoncide concentration was detected in the phytotron from night to morning, a change in phytoncide emissions occurred when the influence of sunlight began. As the light intensity increased, the seedlings in the phytotron began to photosynthesize, and the amount of phytoncides increased under the influence of light, which is an abiotic stress factor. Moreover, from midday, when solar radiation was strengthened, phytoncides decreased because of photochemical reactions with light [30,31]. Subsequently, phytoncide emissions increased slightly at approximately 15:00, when the effects of sunlight decreased again.
Next, the detailed components of the phytoncides analyzed by the GC-MS and SIFT-MS methods were examined. Accordingly, both methods detected pinenes at the highest concentration, followed by myrcene in both methods. As the seedlings planted inside the phytotron were Pinus strobus L., which is a pine species, it was confirmed that the pinenes primarily discharged from the seedlings were detected at the highest levels [32,33,34]. Myrcene, the second most detected compound, has also been frequently detected in previous studies on Pinus strobus L. trees [34]. Therefore, there are similarities and variations in the phytoncide concentrations examined via both GC-MS and SIFT-MS methods. Consequently, an independent samples t-test was conducted to ascertain whether the distinction between the two analytical approaches was statistically significant. Consequently, both groups demonstrated conformity with the assumptions of normality and variance homogeneity, enabling the execution of an independent samples t-test. Based on the test outcomes, there were no statistically significant differences in the mean values between the two groups. This indicates that there was no substantial divergence between the findings obtained using the GC-MS and SIFT-MS methods. Therefore, when gathering and assessing phytoncides in a forest setting, it is feasible to employ SIFT-MS instead of GC-MS.
In the second experimental phase, phytoncide emissions were measured indoors, outdoors, and in the phytotron to determine the characteristics of the phytoncide emissions according to the measurement location and environment. Concerning measurements indoors and in the phytotron, research was conducted on Pinus strobus L. seedlings. Concerning the outdoor measurement, the overall phytoncide concentration in the Hongneung Experimental Forest was measured on the roof of the building where the phytotron was located. Accordingly, in the outdoor measurements, it was possible to confirm phytoncide emission characteristics of similar concentrations and trends as those of previous studies [24,26]. In the phytotron, where temperature and humidity were controlled at 25 °C and 60%, respectively, the highest average concentration of phytoncide among the three measurement sites was detected. In particular, phytoncides were detected at a concentration 58.6-fold higher than those in the outdoor average. This can likely be attributed to the dilution effect caused by outdoor elements such as wind and other environmental factors. As explained in the results of the first phase of the study, the temperature, humidity, and wind speed inside the phytotron were controlled at a certain level; therefore, only natural light was affected. Therefore, when the external microclimate environment was controlled, the concentration of phytoncides increased during the daytime due to photosynthesis by plants, and in the afternoon, when the light intensity increased, NVOCs decreased due to photochemical reactions and then increased again in the late afternoon when sunlight weakened. However, concerning indoor phytoncide concentration values, it was confirmed that the concentration increased over time. This might be because the indoor temperature in the building increased over time, and the phytoncide concentration, which is positively correlated with temperature, continued to increase. In addition, it was presumed that the measurement environment inside the room was generally shaded during the measurement period, resulting in less photosynthesis and fewer photochemical reactions caused by light.
Next, a descriptive statistical analysis was performed to explain the trend at each measurement site, confirmed by the analysis of phytoncide emission characteristics over time. The coefficient of variation of the phytotron was the smallest, statistically confirming the steadiest phytoncide emission among the three research sites. More consistent phytoncide concentrations might be obtained using light-controlled phytotron experiments. In contrast, the results of the Jarque–Bera test for normality analysis statistically confirmed the normality of the indoor and phytotron measurement results; however, it was confirmed that the outdoor measurement results did not follow a normal distribution. Therefore, in outdoor measurement experiments, it is difficult for the average value to represent the overall measurement value, and it is also difficult to present the average phytoncide concentration of a specific species. Thus, in future studies measuring NVOC concentrations in forests, it would be desirable to present the average phytoncide concentration measured by the corresponding tree species in the phytotron that is statistically the most stable.
We conducted a comparative study of the phytoncide analysis method and measurement sites using various analyses. However, this study has several limitations that must be addressed in future studies. First, the study dates differed. Although both occurred on clear days at intervals of less than one week, external factors might have affected emissions, as the days of indoor phytoncide measurements differed from those of the outdoor and phytotron measurements. In addition, the measurement times for the GC-MS and SIFT-MS methods vary. For a more meaningful comparison, the phytoncide concentrations should be measured using both GC-MS and SIFT-MS for 24 h in subsequent studies. In the case of the phytotron, a great limitation remains in that it cannot control light. As previous studies have shown that light significantly affects phytoncide emissions, it is necessary to control light at a certain level by proceeding with indoor phytotrons in subsequent studies. In addition, the outdoor measurement, which was performed on the roof of a general building, remains a limitation. Fortunately, the building was surrounded by trees, as it was located in a large experimental forest, and the detected concentration did not differ significantly from that in previous studies. However, in subsequent studies, it would be desirable to conduct research after creating identical indoor and phytotron environments. Nonetheless, this study extended the investigation to include phytoncide emission assessments in indoor and outdoor settings, thereby enabling a comprehensive comparison of emission patterns across different environments. In this process, it became evident that the phytotron, with its controlled conditions, offered superior consistency in phytoncide emissions compared with that of outdoor environments. Although this study has certain limitations, it underscores the significance of phytotron-based measurements in informing the development of indoor forest healing programs, particularly for patients who cannot access natural forests or virtual reality environments. These patient groups include those suffering from long-term illnesses such as cancer, as well as individuals with limited mobility, especially the disabled and elderly. Furthermore, the findings of this study suggest the potential adoption of SIFT-MS as an efficient alternative to GC-MS for future field research on phytoncides.

5. Conclusions

This study was driven by the increasing demand for phytoncide studies to design indoor forest healing programs using virtual reality or programs for patients who are unable to visit forests directly. This study focused on a controlled phytotron environment and compared GC-MS and SIFT-MS results, revealing similar emission trends with slightly higher SIFT-MS detection concentrations. This study also identified the daily fluctuations in phytoncide emissions influenced by light intensity and abiotic stress factors. A detailed analysis showed that both methods consistently detected pinenes, which are primarily emitted by Pinus strobus L. seedlings in the phytotron. Statistical analysis confirmed no significant divergence between the GC-MS and SIFT-MS results, indicating the feasibility of using SIFT-MS for forest phytoncide assessment. In the second experimental phase, the phytoncide emissions were assessed indoors, outdoors, and in the phytotron to understand their location and environmental effects. Notably, the phytotron demonstrates the most consistent phytoncide emissions under controlled conditions. In the pursuit of promoting health and well-being through indoor forest experiences, this study represents a crucial step toward understanding the role of phytoncides and their measurements in controlled environments.

Author Contributions

Conceptualization, Y.C. and G.K.; methodology, Y.C.; software, Y.C.; validation, G.K. and S.P.; formal analysis, Y.C.; investigation, G.K.; resources, S.P.; data curation, Y.C.; writing—original draft preparation, Y.C.; writing—review and editing, Y.C.; visualization, S.K.; supervision, J.H.C.; project administration, S.P. All authors have read and agreed to the published version of the manuscript.

Funding

This study was conducted with the support of the “R&D Program for Forest Science Technology (Project No. 2021394C10-2323-0103)” provided by the Korea Forest Service (Korea Forestry Promotion Institute).

Data Availability Statement

The data presented in this study are available upon request from the corresponding author. These data are not publicly available because they were collected for internal research purposes at the National Institute of Forest Science, Republic of Korea.

Conflicts of Interest

The authors declare no conflict of interest.

References

  1. Oh, B.; Lee, K.J.; Zaslawski, C.; Yeung, A.; Rosenthal, D.; Larkey, L.; Back, M. Health and well-being benefits of spending time in forests: Systematic review. Environ. Health Prev. Med. 2017, 22, 71. [Google Scholar] [CrossRef] [PubMed]
  2. Grilli, G.; Sacchelli, S. Health benefits derived from forest: A review. Int. J. Environ. Res. Public Health 2020, 17, 6125. [Google Scholar] [CrossRef] [PubMed]
  3. Cheng, X.; Liu, J.; Liu, H.; Lu, S. A systematic review of evidence of additional health benefits from forest exposure. Landsc. Urban Plan. 2021, 212, 104123. [Google Scholar] [CrossRef]
  4. Lee, J.; Tsunetsugu, Y.; Takayama, N.; Park, B.-J.; Li, Q.; Song, C.; Komatsu, M.; Ikei, H.; Tyrväinen, L.; Kagawa, T. Influence of forest therapy on cardiovascular relaxation in young adults. Evid.-Based Complement. Altern. Med. 2014, 2014, e834360. [Google Scholar] [CrossRef]
  5. Rajoo, K.S.; Karam, D.S.; Abdullah, M.Z. The physiological and psychosocial effects of forest therapy: A systematic review. Urban For. Urban Green. 2020, 54, 126744. [Google Scholar] [CrossRef]
  6. Yu, C.-P.S.; Hsieh, H. Beyond restorative benefits: Evaluating the effect of forest therapy on creativity. Urban For. Urban Green. 2020, 51, 126670. [Google Scholar] [CrossRef]
  7. Li, Q.; Kobayashi, M.; Wakayama, Y.; Inagaki, H.; Katsumata, M.; Hirata, Y.; Hirata, K.; Shimizu, T.; Kawada, T.; Park, B.J.; et al. Effect of phytoncide from trees on human natural killer cell function. Int. J. Immunopathol. Pharmacol. 2009, 22, 951–959. [Google Scholar] [CrossRef]
  8. Li, Q.; Nakadai, A.; Matsushima, H.; Miyazaki, Y.; Krensky, A.M.; Kawada, T.; Morimoto, K. Phytoncides (wood essential oils) induce human natural killer cell activity. Immunopharmacol. Immunotoxicol. 2006, 28, 319–333. [Google Scholar] [CrossRef]
  9. Antonelli, M.; Donelli, D.; Barbieri, G.; Valussi, M.; Maggini, V.; Firenzuoli, F. Forest volatile organic compounds and their effects on human health: A state-of-the-art review. Int. J. Environ. Res. Public Health 2020, 17, 6506. [Google Scholar] [CrossRef]
  10. Kang, S.; Lee, J.S.; Lee, H.C.; Petriello, M.C.; Kim, B.Y.; Do, J.T.; Lim, D.S.; Lee, H.G.; Han, S.G. Phytoncide extracted from pinecone decreases LPS-induced inflammatory responses in bovine mammary epithelial cells. J. Microbiol. Biotechnol. 2016, 26, 579–587. [Google Scholar] [CrossRef]
  11. Altındal, D.; Altındal, N. Plant volatile compounds in growth. In Volatiles and Food Security—Role of Volatiles in Agro-Ecosystems; Springer: Singapore, 2017; pp. 1–13. [Google Scholar]
  12. Thiel, S.; Döhring, T.; Köfferlein, M.; Kosak, A.; Martin, P.; Seidlitz, H.K. A phytotron for plant stress research: How far can artificial lighting compare to natural sunlight? J. Plant Physiol. 1996, 148, 456–463. [Google Scholar] [CrossRef]
  13. Koike, T.; Kitao, M.; Hikosaka, K.; Agathokleous, E.; Watanabe, Y.; Watanabe, M.; Eguchi, N.; Funada, R. Photosynthetic and photosynthesis-related responses of Japanese native trees to CO2: Results from phytotrons, open-top chambers, natural CO2 springs, and Free-Air CO2 enrichment. In The Leaf: A Platform for Performing Photosynthesis; Springer: Cham, Switzerland, 2018; pp. 425–449. [Google Scholar]
  14. Meena, S.; Nagar, S. Phytotron-an enclosed research facility for study interactions between plants and the environment. Agrosci. Today 2021, 2, 38–42. [Google Scholar]
  15. Matić, S.; Garibaldi, A.; Gullino, M.L. Combined and single effects of elevated CO2 and temperatures on rice bakanae disease under controlled conditions in phytotrons. Plant Pathol. 2021, 70, 815–826. [Google Scholar] [CrossRef]
  16. Chiang, C.; Bånkestad, D.; Hoch, G. Reaching natural growth: The significance of light and temperature fluctuations in plant performance in indoor growth facilities. Plants 2020, 9, 1312. [Google Scholar] [CrossRef] [PubMed]
  17. Abdelouhahid, R.A.; Debauche, O.; Mahmoudi, S.; Marzak, A.; Manneback, P.; Lebeau, F. Open phytotron: A new iot device for home gardening. In Proceedings of the 5th International Conference on Cloud Computing and Artificial Intelligence: Technologies and Applications (CloudTech), Marrakesh, Morocco, 24–26 November 2020; IEEE Publications: Piscataway, NJ, USA, 2020; Volume 2020, pp. 1–8. [Google Scholar] [CrossRef]
  18. Hastie, C.; Thompson, A.; Perkins, M.; Langford, V.S.; Eddleston, M.; Homer, N.Z. Selected Ion Flow Tube-Mass Spectrometry (SIFT-MS) as an alternative to gas chromatography/mass spectrometry (GC/MS) for the analysis of cyclohexanone and cyclohexanol in plasma. ACS Omega 2021, 6, 32818–32822. [Google Scholar] [CrossRef]
  19. Langford, V.; McEwan, M.J.; Perkins, M. High-throughput analysis of volatile compounds in air, water, and soil using SIFT-MS. LCGC Suppl. 2018, 37, 24–29. [Google Scholar]
  20. Kim, G.; Park, B.-J.; Joung, D.; Yeom, D.-G.; Koga, S. Primary concentration measurements of natural volatile organic compounds in atmosphere using the headspace solid–phase microextraction method within the forest. J. Fac. Agric. Kyushu Univ. 2015, 60, 471–476. [Google Scholar] [CrossRef]
  21. Smith, D.; Španěl, P.; Demarais, N.; Langford, V.S.; McEwan, M.J. Recent developments and applications of selected ion flow tube mass spectrometry (SIFT-MS). Mass Spectrom. Rev. 2023, e21835. [Google Scholar] [CrossRef]
  22. La Nasa, J.; Modugno, F.; Colombini, M.P.; Degano, I. Validation study of Selected Ion Flow Tube-Mass Spectrometry (SIFT-MS) in heritage science: Characterization of natural and synthetic paint varnishes by portable mass spectrometry. J. Am. Soc. Mass. Spectrom. 2019, 30, 2250–2258. [Google Scholar] [CrossRef]
  23. Langford, V.S.; Sift, M.S. Quantifying the volatiles you smell… and the toxics you don’t. Chemosensors 2023, 11, 111. [Google Scholar] [CrossRef]
  24. Choi, Y.; Kim, G.; Park, S.; Kim, E.; Kim, S. Prediction of natural volatile organic compounds emitted by bamboo Groves in urban forests. Forests 2021, 12, 543. [Google Scholar] [CrossRef]
  25. Cheng, W.-W.; Lin, C.-T.; Chu, F.-H.; Chang, S.-T.; Wang, S.-Y. Neuropharmacological activities of phytoncide released from Cryptomeria japonica. J. Wood Sci. 2009, 55, 27–31. [Google Scholar] [CrossRef]
  26. Kim, G.; Park, S.; Kwak, D. Is it possible to predict the concentration of natural volatile organic compounds in forest atmosphere? Int. J. Environ. Res. Public Health 2020, 17, 7875. [Google Scholar] [CrossRef] [PubMed]
  27. Lehnert, A.-S.; Behrendt, T.; Ruecker, A.; Pohnert, G.; Trumbore, S.E.; Sift, M.S. SIFT-MS Optimization for atmospheric trace gas measurements at varying humidity. Atmos. Meas. Tech. 2020, 13, 3507–3520. [Google Scholar] [CrossRef]
  28. Ramakrishna, A.; Ravishankar, G.A. Influence of abiotic stress signals on secondary metabolites in plants. Plant Signal Behav. 2011, 6, 1720–1731. [Google Scholar] [CrossRef]
  29. Li, H.L.; Zhao, P.Y.; Lei, Y.; Hossain, M.M.; Kang, J.; Kim, I.H. Dietary phytoncide supplementation improved growth performance and meat quality of finishing pigs. Asian-Australas. J. Anim. Sci. 2016, 29, 1314–1321. [Google Scholar] [CrossRef]
  30. Pinto, D.M.; Blande, J.D.; Souza, S.R.; Nerg, A.M.; Holopainen, J.K. Plant volatile organic compounds (VOCs) in ozone (O3) polluted atmospheres: The ecological effects. J. Chem. Ecol. 2010, 36, 22–34. [Google Scholar] [CrossRef]
  31. Wang, Z.; Shi, Z.; Wang, F.; Liang, W.; Shi, G.; Wang, W.; Chen, D.; Liang, D.; Feng, Y.; Russell, A.G. Implications for ozone control by understanding the survivor bias in observed ozone-volatile organic compounds system. NPJ Clim. Atmos. Sci. 2022, 5, 39. [Google Scholar] [CrossRef]
  32. Yang, H.; Woo, J.; Pae, A.N.; Um, M.Y.; Cho, N.C.; Park, K.D.; Yoon, M.; Kim, J.; Lee, C.J.; Cho, S. α-Pinene, a Major Constituent of Pine Tree Oils, Enhances non-rapid Eye Movement Sleep in Mice through GABAA-benzodiazepine Receptors. Mol. Pharmacol. 2016, 90, 530–539. [Google Scholar] [CrossRef]
  33. Silva, C.M.; Filho, C.A.; Quadri, M.B.; Macedo, E.A. Binary diffusion coefficients of α-pinene and β-pinene in supercritical carbon dioxide. J. Supercrit. Fluids 2004, 32, 167–175. [Google Scholar] [CrossRef]
  34. Chang, H.; Son, J.; Kim, J.; Kim, J.; Kim, Y.; Choi, W.-S.; Lee, Y.-K. Emission rates of biogenic volatile organic compounds from various tree species in Korea (II): Major Species in Urban Forests. J. Korean Soc. For. Sci. 2022, 111, 490–501. [Google Scholar] [CrossRef]
Figure 1. Phytotron experimental site view. (a) Phytotron installed on the roof of a building; (b) Phytoncide measurement in the phytotron.
Forests 14 02235 g001
Figure 2. Layout of the phytotron interior.
Forests 14 02235 g002
Figure 3. Outdoor phytoncide measuring photo.
Forests 14 02235 g003
Figure 4. Flow diagram of the analysis processes. GC-MS: Gas chromatography–mass spectroscopy; SIFT-MS: Selected ion flow tube–mass spectroscopy.
Forests 14 02235 g004
Figure 5. Temporal profile of NVOC emissions recorded by measurement equipment.
Forests 14 02235 g005
Figure 6. Detailed components of NVOC concentration. (a) Percentage of detailed components of NVOC emissions recorded through SIFT-MS analysis; (b) Percentage of detailed components of NVOC emissions recorded through GC-MS analysis.
Forests 14 02235 g006
Figure 7. Temporal profile of NVOC emissions recorded by measurement site.
Forests 14 02235 g007
Table 1. Indicators for natural volatile organic compounds (NVOCs) measured in the study.
NVOCs
α-pinene, β-pinene, camphene, limonene, benzaldehyde, myrcene, phellandrene, sabinene, camphor, α-terpinene, γ-terpinene, terpinolene, 3-carene, terpineol, bornyl acetate, sabina ketone, cineole, longifolene, pinocarvone, sabinene hydrate, cymene, valencene, α-bisabolol, farnesene, caryophyllene, nerol, nerolidol, pulegone, borneol, menthol, geraniol, and D-fenchone
Table 2. Operating parameter conditions for NVOC detection.
ParametersConditions
ColumnHP-INNOWAX (60 m × 0.25 mmL D × 0.25 μm, film thickness)
Carrier gas flowHe at 1 mL/min
Injection modePulsed splitless
Injection port temp.210 °C
Transfer line temp.210 °C
Over temp. programInitialRateFinal
3 min40 °C8 °C/min220 °C3 min40 °C
Post run220 °C, 5 min
Table 3. Results of an independent samples t-test undertaken on the data measured using a mini pump (GC-MS) and a real-time measuring instrument (SIFT-MS).
Independent Samples t-Test
Shapiro–Wilk
Normality Test
Levene’s Test for
Homogeneity of
Variance
t-Test for Equality of Mean (Equal Variance Assumed)
p-ValueFp-ValuetDfp-ValueMean
Difference
SE
Difference
95% Confidence
Interval of the
Difference
SIFF-MSGC-MSLowerUpper
0.9140.7940.1200.1973.565260.1448.1530.2035.57020.737
Df: degrees of freedom. SE: standard error.
Table 4. Descriptive statistics of NVOC emissions by measurement site.
Measurement SiteNMeanMedianMax.Min.CVSkewnessKurtosisJ–Bp-Value 1
Indoor3925.3120.6143.2013.520.410.62−1.083.300.193
Outdoor260.650.491.590.380.612.345.6758.560.000 ***
Phytotron2838.0937.2060.3320.710.330.40−0.050.780.675
1 p-value of the Jarque–Bera test for normality. N: population size. Max.: maximum value. Min.: minimum value. CV: coefficient of variation. J–B: Jarque–Bera test for normality. *** p < 0.001.
Disclaimer/Publisher’s Note: The statements, opinions and data contained in all publications are solely those of the individual author(s) and contributor(s) and not of MDPI and/or the editor(s). MDPI and/or the editor(s) disclaim responsibility for any injury to people or property resulting from any ideas, methods, instructions or products referred to in the content.

