Article

Changes in Leaf Functional Traits Driven by Environmental Filtration in Different Monsoon Tropical Forest Types

1
College of Resources, Environment and Earth Science, Yunnan University, Kunming 650091, China
2
Institute of International Rivers and Eco-Security, Yunnan University, Kunming 650091, China
3
Ecology and Nature Conservation, Chinese Academy of Forestry, Key Laboratory of Forest Ecology and Environment of National Forestry and Grassland Administration, Beijing 100091, China
4
Co-Innovation Center for Sustainable Forestry in Southern China, Nanjing Forestry University, Nanjing 210037, China
*
Author to whom correspondence should be addressed.
These authors contributed equally to this work and share first authorship.
Forests 2023, 14(10), 2101; https://doi.org/10.3390/f14102101
Submission received: 27 September 2023 / Revised: 14 October 2023 / Accepted: 16 October 2023 / Published: 20 October 2023
(This article belongs to the Special Issue Ecosystem Degradation and Restoration: From Assessment to Practice)

Abstract

:
Disturbances have created heterogeneous habitats for secondary and old-growth forests. Under the assumption that ecologically similar species have similar functional traits, numerous studies have attempted to use trait-based approaches to infer the abiotic and biotic factors that drive variations in community composition across different forests. However, the relative importance of these drivers in monsoon forests remains poorly understood. In this study, we randomly selected 86 plots and classified them into three forest types according to environmental factors: 1—secondary forests: secondary forest habitats at high elevation; 2—ecotone forests: general recovery and elevation; and 3—old growth forests: old growth at low elevations. We then compared the species and six leaf functional trait variations across the three forests and assessed their relationships with 15 environmental factors. The results showed that secondary and ecotone forests with a conservative strategy, exhibiting high dry matter content and leaf carbon content, tended to persist in stressful habitats, such as nutrient-poor soil, whereas old growth forests invested in trait values related to rapid resource acquisition with high specific leaf area, leaf nitrogen content, leaf phosphorous content, and leaf potassium content. Species with functional trait values between the secondary, ecotone, and old growth forests had clear signatures of their different strategies to persist in assemblages under distinct and opposite environmental filters. These plots were classified into three forest types according to environmental factors: (1) secondary forest at high elevation; (2) ecotone forests at general elevation; and (3) old growth forests at low elevation. Recovery time and elevation, followed by soil nutrients and light capture, were the most important factors shaping species and functional trait variations across forests. These results have demonstrated that environmental filters select plant species with distinct traits and ecological strategies. Acquisitive traits indicate higher competitive ability and faster resource acquisition for forest species that occur in areas with high soil fertility. Meanwhile, conservative traits promote the resistance of secondary species to environmental stressors in low soil fertility, suggesting that analyzing leaf functional-based trait variations to understand plant ecological strategies along an environmental gradient may improve understanding of forest dynamics in tropical monsoon forests.

1. Introduction

Disturbances have created heterogeneous habitats of differently recovered secondary and old-growth forests, which support highly distinctive plant communities resulting from deterministic species selection by environmental filters. Many studies have attempted to use a trait-based approach to infer the abiotic and biotic factors that drive variations in community composition. However, little is known about species and functional trait variations and the relative importance of these drivers under multiple environmental gradients during succession in tropical forests.
Plant functional traits are morphological, chemical, physiological, and phrenological characteristics that directly affect plant survival, growth, and reproduction [1]. Leaves are the main organs of photosynthesis and plant biomass and are the primary producers of energy in the ecosystem [2]. An understanding of functional trait variations, especially in leaf functional traits, is also necessary to explain the response strategies of species to environmental gradients and foster ecological predictions. These are reflected in the corresponding resource acquisition and conservation strategies [3,4,5,6]. Species with a high specific leaf area (SLA) are found in resource-rich habitats with high growth rates and short lifespans. These represent a resource acquisition strategy in the leaf economic spectrum [7,8]. Species with high leaf dry matter content (LDMC) and leaf organic carbon content (LCC) often occur in resource-poor environments, which indicate resource conservation strategies featuring slow ecological processes and strong resistance [9,10]. Meanwhile, chemical traits such as leaf nitrogen content (LNC), leaf phosphorous content (LPC), and leaf potassium content (LKC). These are important components in the ecosystem nutrient cycle and are strongly associated with plant growth rate, maximum photosynthetic rate, competitiveness, and the nutrient cycle [4,11], They generally vary in accordance with the soil N, P, and K in the environment [12], Therefore, the study of leaf functional traits has allowed ecologists to re-examine plant performance and life strategies in complex ecological processes from a new perspective [3]. This has proven to be an effective and reliable means of exploring various frontier issues in ecology, from the individual, population, and community level to the ecosystem level [2]. In this context, leaf functional traits are usually used as indicators of ecological function strategy, disturbance, restoration, water absorption, soil nutrients, and light availability [3,7,13].
Variations in leaf trait composition are related to abiotic factors, particularly recovery time during succession, topography, and soil conditions [3,13], which trees use to acquire resources, and lead to differences in species and functional trait composition [14,15,16]. Climatic factors dominate the pattern of leaf traits at a global scale [4], whereas recovery time, topography, and soil characteristics such as soil nutrients play a decisive role at the local scale [3,7,17,18], in determining the key factors supporting plant growth and shaping community assembly [19].
Recent studies on the functional regeneration of tropical dry forests (TDFs) have indicated that the light gradient during succession is less pronounced. These forests are often more water-limited, which may be a stronger factor driving changes in plant communities. Plant traits respond to a successional gradient of increasing humidity and decreasing temperature [20,21,22], in contrast with wet forests where light availability is the strongest selective force [23]. Most trees in early successional TDFs are slow-growing species. According to the leaf economic spectrum [24], they possess conservative strategies related to drought tolerance with high investments in carbon structures such as LDMC and LCC [20,25]. Meanwhile, late-successional TDF species would invest in drought avoidance and resource-acquisitive leaf traits [20,26,27], which promote rapid returns on investment in nutrients and carbon, that is, high SLA, LNC, LPC, and LKC. In general, trees growing under more xeric conditions tend to exhibit leaf traits with slow returns on resource investment and have relatively conservative strategies [28].
Tropical monsoon forests (TMFs) in Xishuangbanna, Southwest, China, harbor high biodiversity and relevant ecosystem services for human well-being. They are subject to the seasonality of rainy and dry periods and are mainly threatened by agricultural intensification such as shifting cultivation [29,30]. During early succession or under stressful environmental conditions within tropical dry climates, such as nutrient-poor soils, low levels of soil water, high levels of sun radiation, and high temperatures, plants may allocate resources for functional traits associated with the ability to tolerate drought and survive under low availability of resources such as water and nutrients [20,25]. Therefore, monsoon forest attributes can be shaped by multiple environmental factors, including recovery time after disturbance, topography [31], and environmental conditions such as soil variables. However, relatively little is known about the variations in species and leaf functional trait composition across different forests during succession in TMFs and the relative importance of these drivers in shaping species and functional trait composition.
We randomly selected 86 plots, classified them into different forest types, investigated leaf trait variations across different forests in TMFs, and assessed the relative importance of different environmental drivers. We formulated the following research questions: (1) How did the species composition and leaf functional traits change across the three forest types? (2) What were the dominant environmental factors affecting the changes in species composition and leaf functional traits? We hypothesized that the strategies of the dominant species in TMFs were similar to those observed in tropical dry forests [20,25,32,33], that species with high LDMC and LCC were dominant in high stress habitats, with influencing factors such as disturbance, low soil fertility, and water. Meanwhile, the species with high SLA, LNC, LPC, and LKC were likely to have habitats with high levels of soil fertility and water availability, and low light levels.

2. Materials and Methods

2.1. Study Area and Sample Setting

This study was conducted in the TMFs of Xishuangbanna in Southern Yunnan Province, Southwest China (21°08′ N–22°36′ N, 99°56′ E–101°50′ E). This study region experiences a tropical monsoon climate with distinct dry and wet seasons, up to 80% of the total precipitation in May–October, and a pronounced dry season extending from November to April. The average annual temperature is 21 °C, and the average annual precipitation is up to 1532 mm [29]. The mineral soil is an oxisol soil with a pH of 4–6, which originates from weathered siliceous rocks [34]. It is predominantly mountainous, with many wide valley basins, low mountains, and low hills. The elevation of the forests ranged from 640 to 1030 m, and they can extend to an elevation of approximately 1100 m along valleys on the south-facing slopes of large mountains.
A total of 86 plots, each with an area of 20 m × 20 m, were randomly established. Plots were sampled to avoid river edges and large gaps, and the distance between plots was greater than 50 m.

2.2. Data Collection

2.2.1. Vegetation Survey

Field investigations were conducted during the rainy season of 2015–2020, from May to October 2015. During the vegetation surveys, in each plot, all the woody plants encompassing trees and shrubs with a diameter at breast height (DBH) ≥ 1 cm were tagged, mapped, and identified, and their DBH was measured. Species were identified according to the nomenclature of the Brazilian Flora [35], following the Flora of China (English edition: http://www.efloras.org, accessed 9 May 2022).
TMFs are threatened mainly by agricultural intensification, such as shifting cultivation and the creation of heterogeneous habitats in different secondary and old-growth forests. The field investigation was conducted in the tropical rainforest, which had naturally recovered after slash-and-burn cultivation in three stages of succession (10–40 years old, 60 years old, old-growth forest). Secondary forests refer to the type of tropical forest with a vegetation recovery time of 10–40 years after slash-and-burn cultivation. The secondary forests were mainly 10–40 years old and were mainly distributed in the elevation range of 750–1000 m, where 50% of them are distributed at 850–950 m. Dominant species include Baccaurea ramiflora Lour., Saprosma ternatum Hook.f., and Garcinia yunnanensis Hu, which have shorter tree heights and smaller breadths. The ecotone forests were distributed under conditions of more than 60 years of secondary dominant species include Castanopsis echinocarpa Miq., Ardisia tenera Mez, and Litsea pierrei. Lec. var. szemois Liou and Syzygium polypetaloideum Merr. et Perry. Old-growth forests refer to the type of tropical forest whose native vegetation is not disturbed by human beings. Old-growth forests were mainly distributed at an elevation of 700–800 m, where 80% of them are distributed at an altitude of 700–750 m. L. pittosporifolia Yang et al., P. H. Huang, Phoebe lanceolata (Wall. ex Nees) Nees, and Parashorea chinensis Wang Hsie are the main constituent species, with tall trees and large breadths. At elevations of 750–850 m, there was a rich common species distribution in secondary and old-growth forests.

2.2.2. Collection of Environmental Factors

For each plot, 15 environmental factors were investigated and analyzed, including recovery time, canopy openness, thickness of the litter layer, three topographic factors, namely elevation, slope, and aspect, and nine soil factors, including the soil water content, soil pH, soil organic matter, total N, total P, total K, available N, available P, and available K.
The approximate recovery time for forest age was obtained through interviews with landowners and ranged from 10 years for old-growth forests with no evidence of anthropogenic disturbances. The canopy openness was obtained using the fisheye photographic method [36]. This produced a hemisphere image through fisheye photography and was analyzed using the freeware Gap Light Analyzer 2.0 (Gordon W. Frazer, Simon Fraser University, Burnaby, B.C., Canada and Dr. Charles D. Canham, Institute of Ecosystem Studies, Millbrook, NY, USA) [37]. For the three topographic factors, elevation was taken as the average elevation from each plot of the four corners. The slope was defined as the mean angular deviation from the horizontal of each of the four triangular planes formed by connecting the three corners of each quadrat. Aspect was defined as the compass direction in which the slope faces. Soil samples were collected from four points in each plot. A core from the top 20 cm of the soil was collected at each point. After removing the plant leaves, the soil samples were stored in plastic bags and brought back to the laboratory. Nine soil chemical properties were analyzed. The wet and dry weights of all soil samples were used to calculate the soil water content (SWC, %). Soil pH was determined in a 1:2.5 (w:v) suspension of soil in water using a SG2 glass-electrode potentiometer. Soil organic matter (mg/g) was determined using the K-dichromate-concentrated sulfuric acid method. The total N (mg/g) was measured using an automatic Kjeldahl N analyzer. The total P (mg/g) and available P (mg/g) were determined using the molybdenum antimony method. Available N (mg/g) was determined using the alkaline solution diffusion method, and total K (mg/kg) and available K (mg/kg) were measured using flame photometry [2].

2.2.3. Collection of Functional Traits

We followed the protocol for the standardized and easy measurement of plant functional traits described by Cornelissen et al. [38]. Six leaf functional traits were selected, including SLA (mm2 g−1), LDMC (g g−1), LNC (mg g−1), LPC (mg g−1), LKC (mg g−1), and LCC (%).
All the traits were measured during the rainy season (May–October), which represents the peak of plant growth and the period of maximum leaf expansion and maturity for the species being examined [39]. In each plot, the leaf traits of all the species sampled were collected and analyzed using at least five intact individuals of a given species. When a given species had fewer than five individuals in the plots, we sampled nearby individuals from outside the plots. For each individual, 5–10 intact, mature, open, and sun-exposed leaves were collected following a standardized protocol [40]. A total of 11,247 plants belonging to 248 species were collected. We analyzed the leaf area index with LI the LI-COR model LI-3100C (LICOR, Lincoln, NE, USA) and calculated the SLA by dividing the leaf area by the dry mass. To obtain the dry mass, we packed the leaves in paper bags and put them in an oven with forced air circulation at 65 °C until they reached a constant weight [40]. The LNC was analyzed using a Hanon K9840 Auto Kjeldahl analyzer (Jinan Hanon Instrument Co., Ltd., Jinan, China). LPC was analyzed using the molybdenum blue colorimetric method using leaves digested in a H2SO4 + H2O2 solution [41]. LKC was analyzed using inductively coupled plasma optical emission spectrometry (ICP-OES; Optima 5300 DV, Perkin Elmer, Waltham, MA, USA) [42]. The LCC was analyzed using a multi N/C2100 analyzer [41].

2.3. Statistical Analysis

In this study, using two-way indicator species analysis (TWINSPAN), according to 15 environmental factors, 86 vegetation plots were classified into three forest types, including secondary forests, ecotone forests, and old-growth forests. TWINSPAN was implemented using the cluster and labdsv packages. Secondary forests were dominant in secondary forests (10–40 years) at high elevations. Ecotone forests were distributed under conditions of more than 60 years of secondary and old-growth forests at a general elevation. Old-growth forests did not show any evidence of anthropogenic disturbances and were mainly distributed at low elevations. To identify the indicator species composition that distinguished three forest types, indicator species values [43,44] were calculated for each type. Significant associations for each type were tested using the probability of obtaining the highest indicator value. The relationships between species composition and environmental factors across forests were visualized using principal component analysis (PCA). The PCA was implemented using the ade4 and vegan packages.
We then performed ANOVAs combined with Tukey’s post-hoc comparisons to test whether these functional traits differed across the three forest types, using the stats and vegan package. Differences in the composition of functional traits across forest types were represented by functional traits at the community level using community-weighted means based on the basal area of the species in each plot [26]. Functional traits at the community level were calculated as follows: C W M = i = 1 S p i x i , where pi represents the relative basal area of species i (i = 1, 2, 3, …., S), S represents the number of species, and xi represents the trait value for species i. To improve normality, we log-transformed the values of the six functional traits. All CWM values were calculated using the R package ‘dbFD’.
Pearson correlation tests with a significance level of less than 0.05 were performed to explore the correlations among the leaf traits. To understand the relative importance of the 15 environmental factors in shaping functional traits, multiple regression models were constructed using the model selection procedure in Spatial Analysis in Macroecology (SAM 4.0) software [45]. All the data were log-transformed to improve the normality of each model. The model selection process in the SAM computes all potential combinations of environmental factors and selects the most parsimonious model with the lowest Akaike information criterion (AIC) values [46,47]. The importance of environmental factors was determined for each leaf functional trait in the selected models. Statistical analyses were performed using R version 3.6.1 [48].

3. Results

3.1. Comparisons Species Composition across Three Forest Types

Combined with indicator species analysis and PCA (Table 1 and Figure 1), we compared the species composition across different forests. The most important environmental factors shaping species composition across forest types were recovery time, elevation, soil nutrients, and particularly soil total P and pH. This was followed by canopy openness and low layer thickness. The other variables had no significant influence (Figure 1).
Secondary forests were distributed in forests with short recovery times at high elevations, characterized by low soil nutrients, litter layer thickness, high canopy openness, and the dominance of S. ternatum and B. ramiflora (Table 1 and Figure 1). Ecotone forests, which had 15 plots, were distributed in the ecotone among old-growth and secondary forests with general recovery time and elevation and were mainly composed of C. echinocarpa, L. pierrei var. szemois, A. tenera, and S. polypetaloideum (Table 1 and Figure 1). Old-growth forests (42 plots) were mainly distributed in old-growth forests with low elevations. They were characterized by rich total P, high litter layer thickness, low canopy openness, and dominant species such as P. chinensis, L. pittosporifolia, P. lanceolata, and Pittosporopsis kerrii Craib (Table 1 and Figure 1).

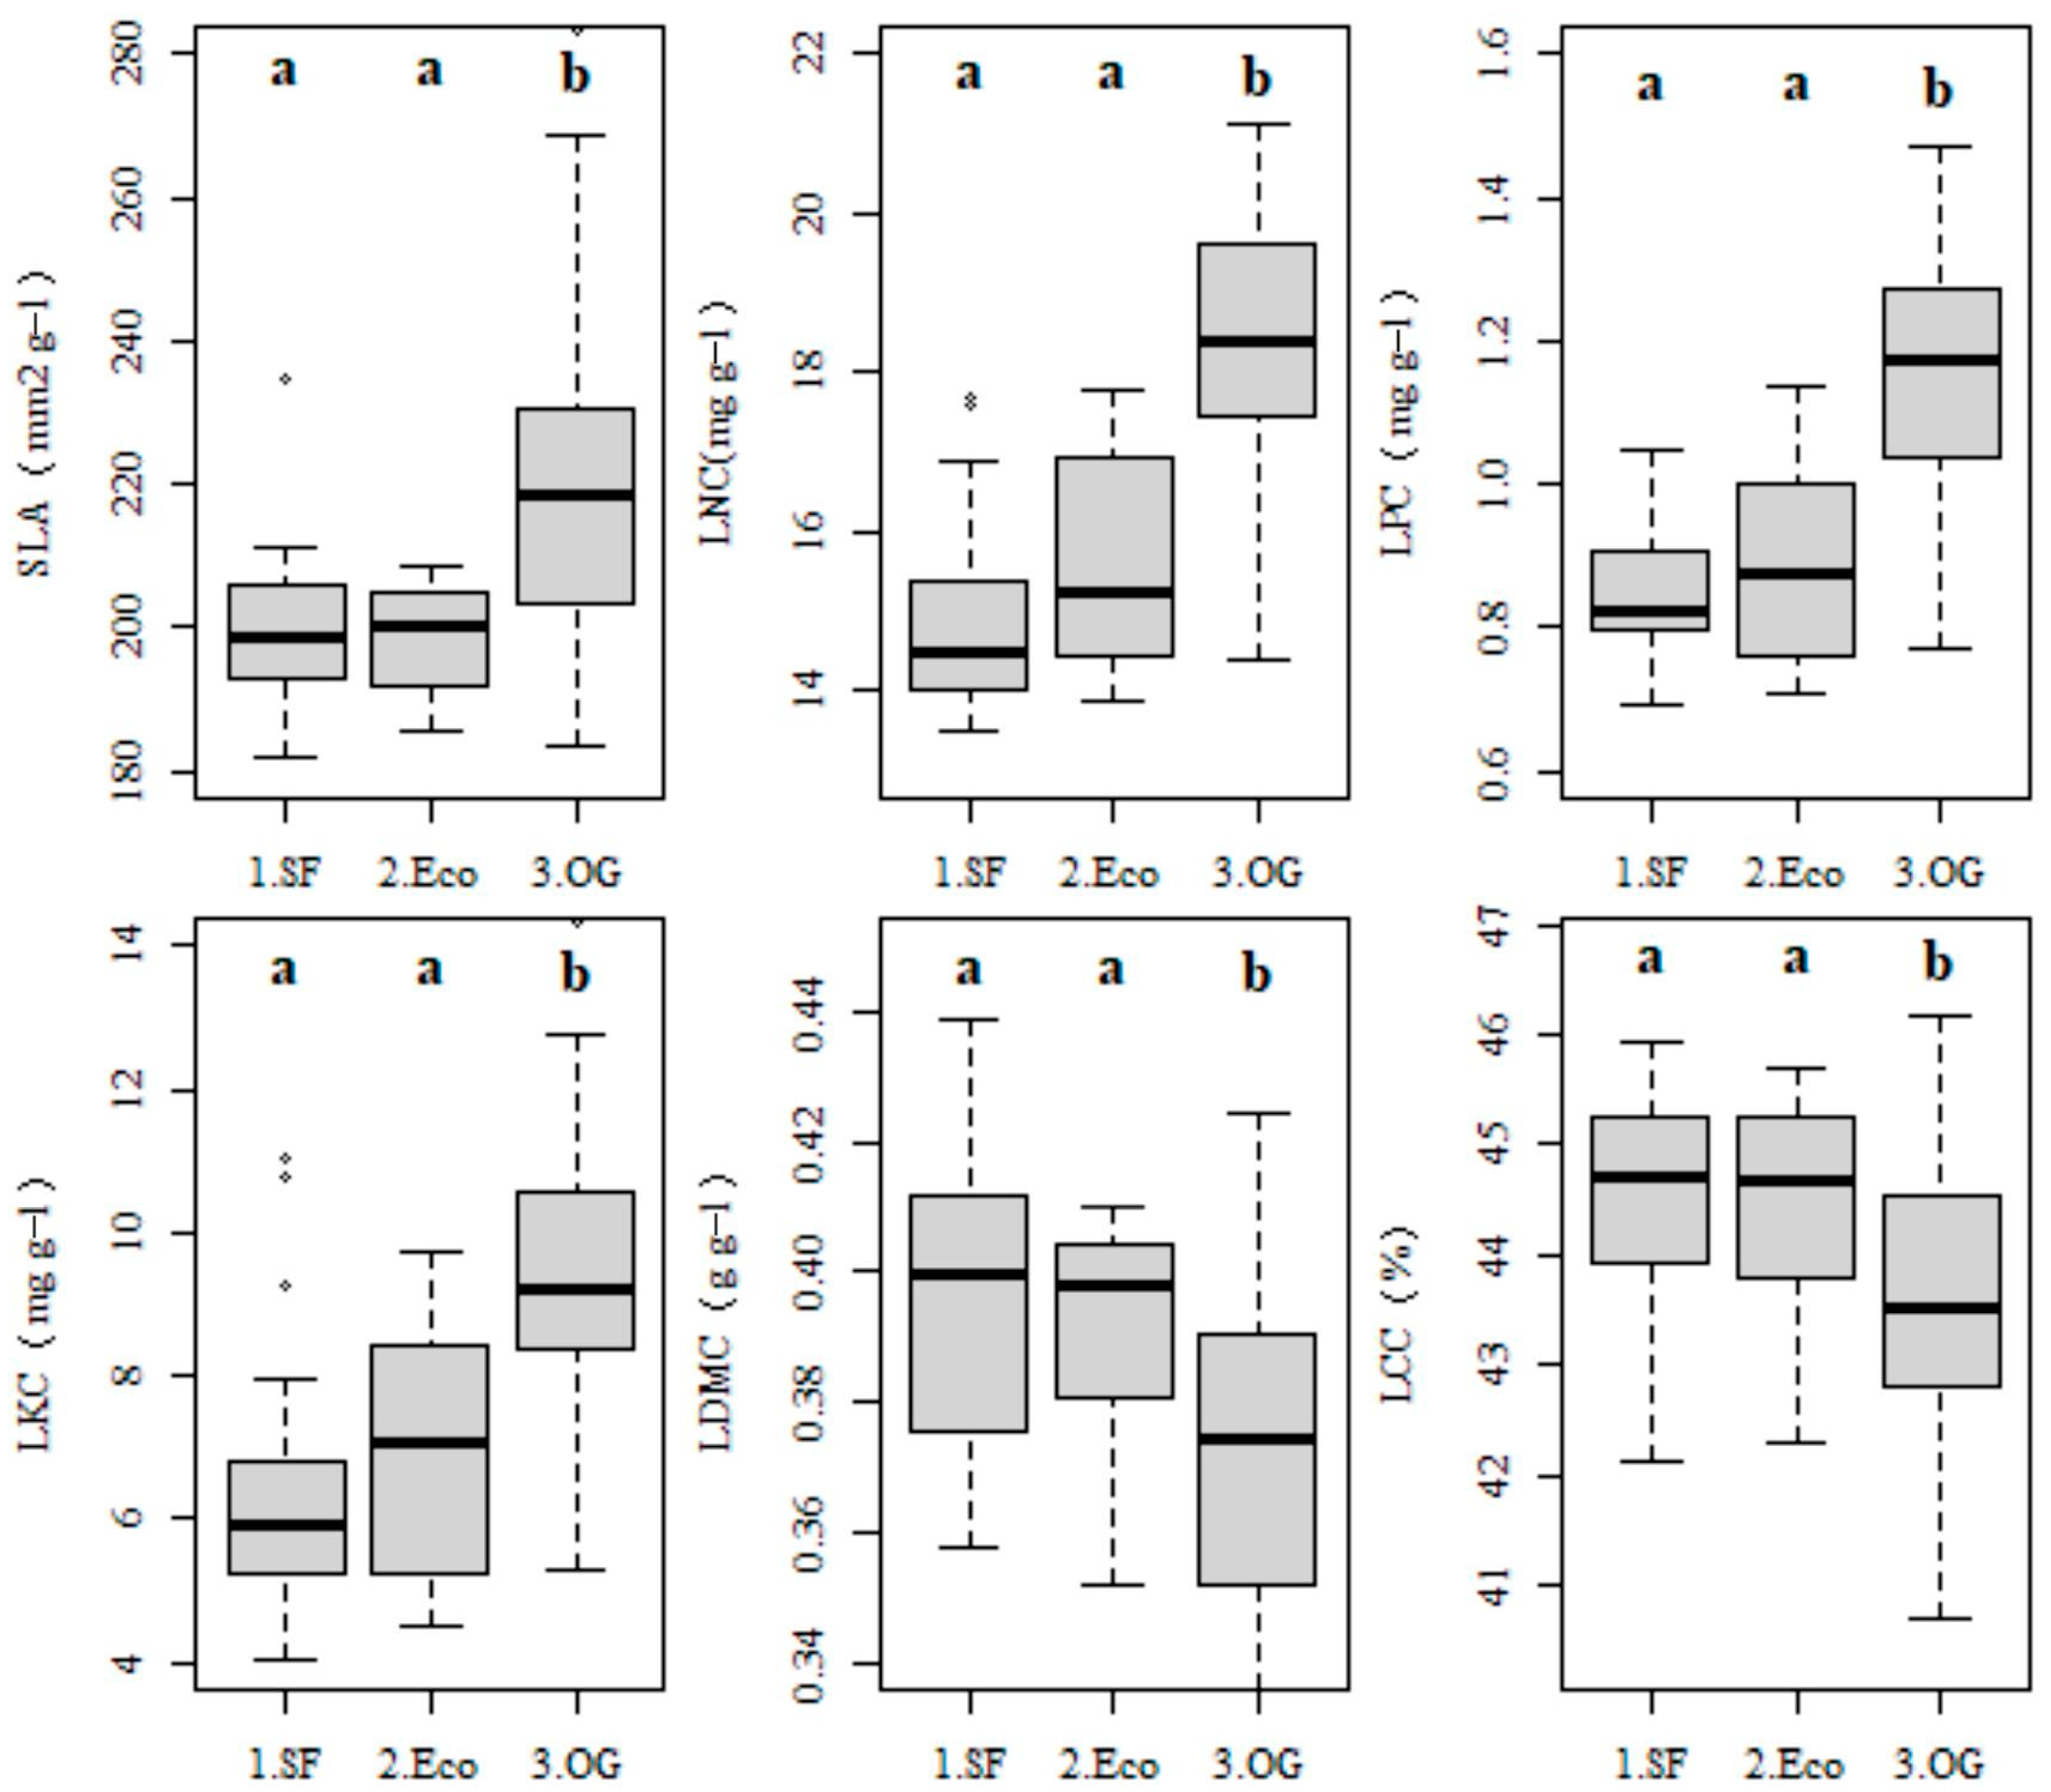
3.2. Forest Types Shaped Leaf Functional Trait Variations

The CWMs for all leaf functional traits were not significantly different between secondary and ecotone forests but were largely different from those of old-growth forests (Figure 2: SLA, F = 16.07, p < 0.0001; LNC, F = 49.97, p < 0.0001; LPC, F = 54.76, p < 0.0001; LKC, F = 23.15, p < 0.0001; LDMC, F = 10.17, p = 0.0002; LCC, F = 6.15, p = 0.0075). Leaf functional traits, including SLA, LNC, LPC, and LKC, were significantly lower in secondary and ecotone forests than in old-growth forests (p < 0.0001). Meanwhile, LDMC and LCC were higher in secondary and ecotone forests than in old-growth forests.
These results have shown that both secondary and ecotone forests used conservative strategies, with low SLA, LNC, LPC, and LKC and high LDCM and LCC. Conversely, old-growth forests used open and acquisitive strategies, with high SLA, LNC, LPC, and LKC and low LDCM and LCC. There were significant differences in the leaf functional traits and the acquisitive-conservative strategies between secondary forests, ecotone forests, and old-growth forests.

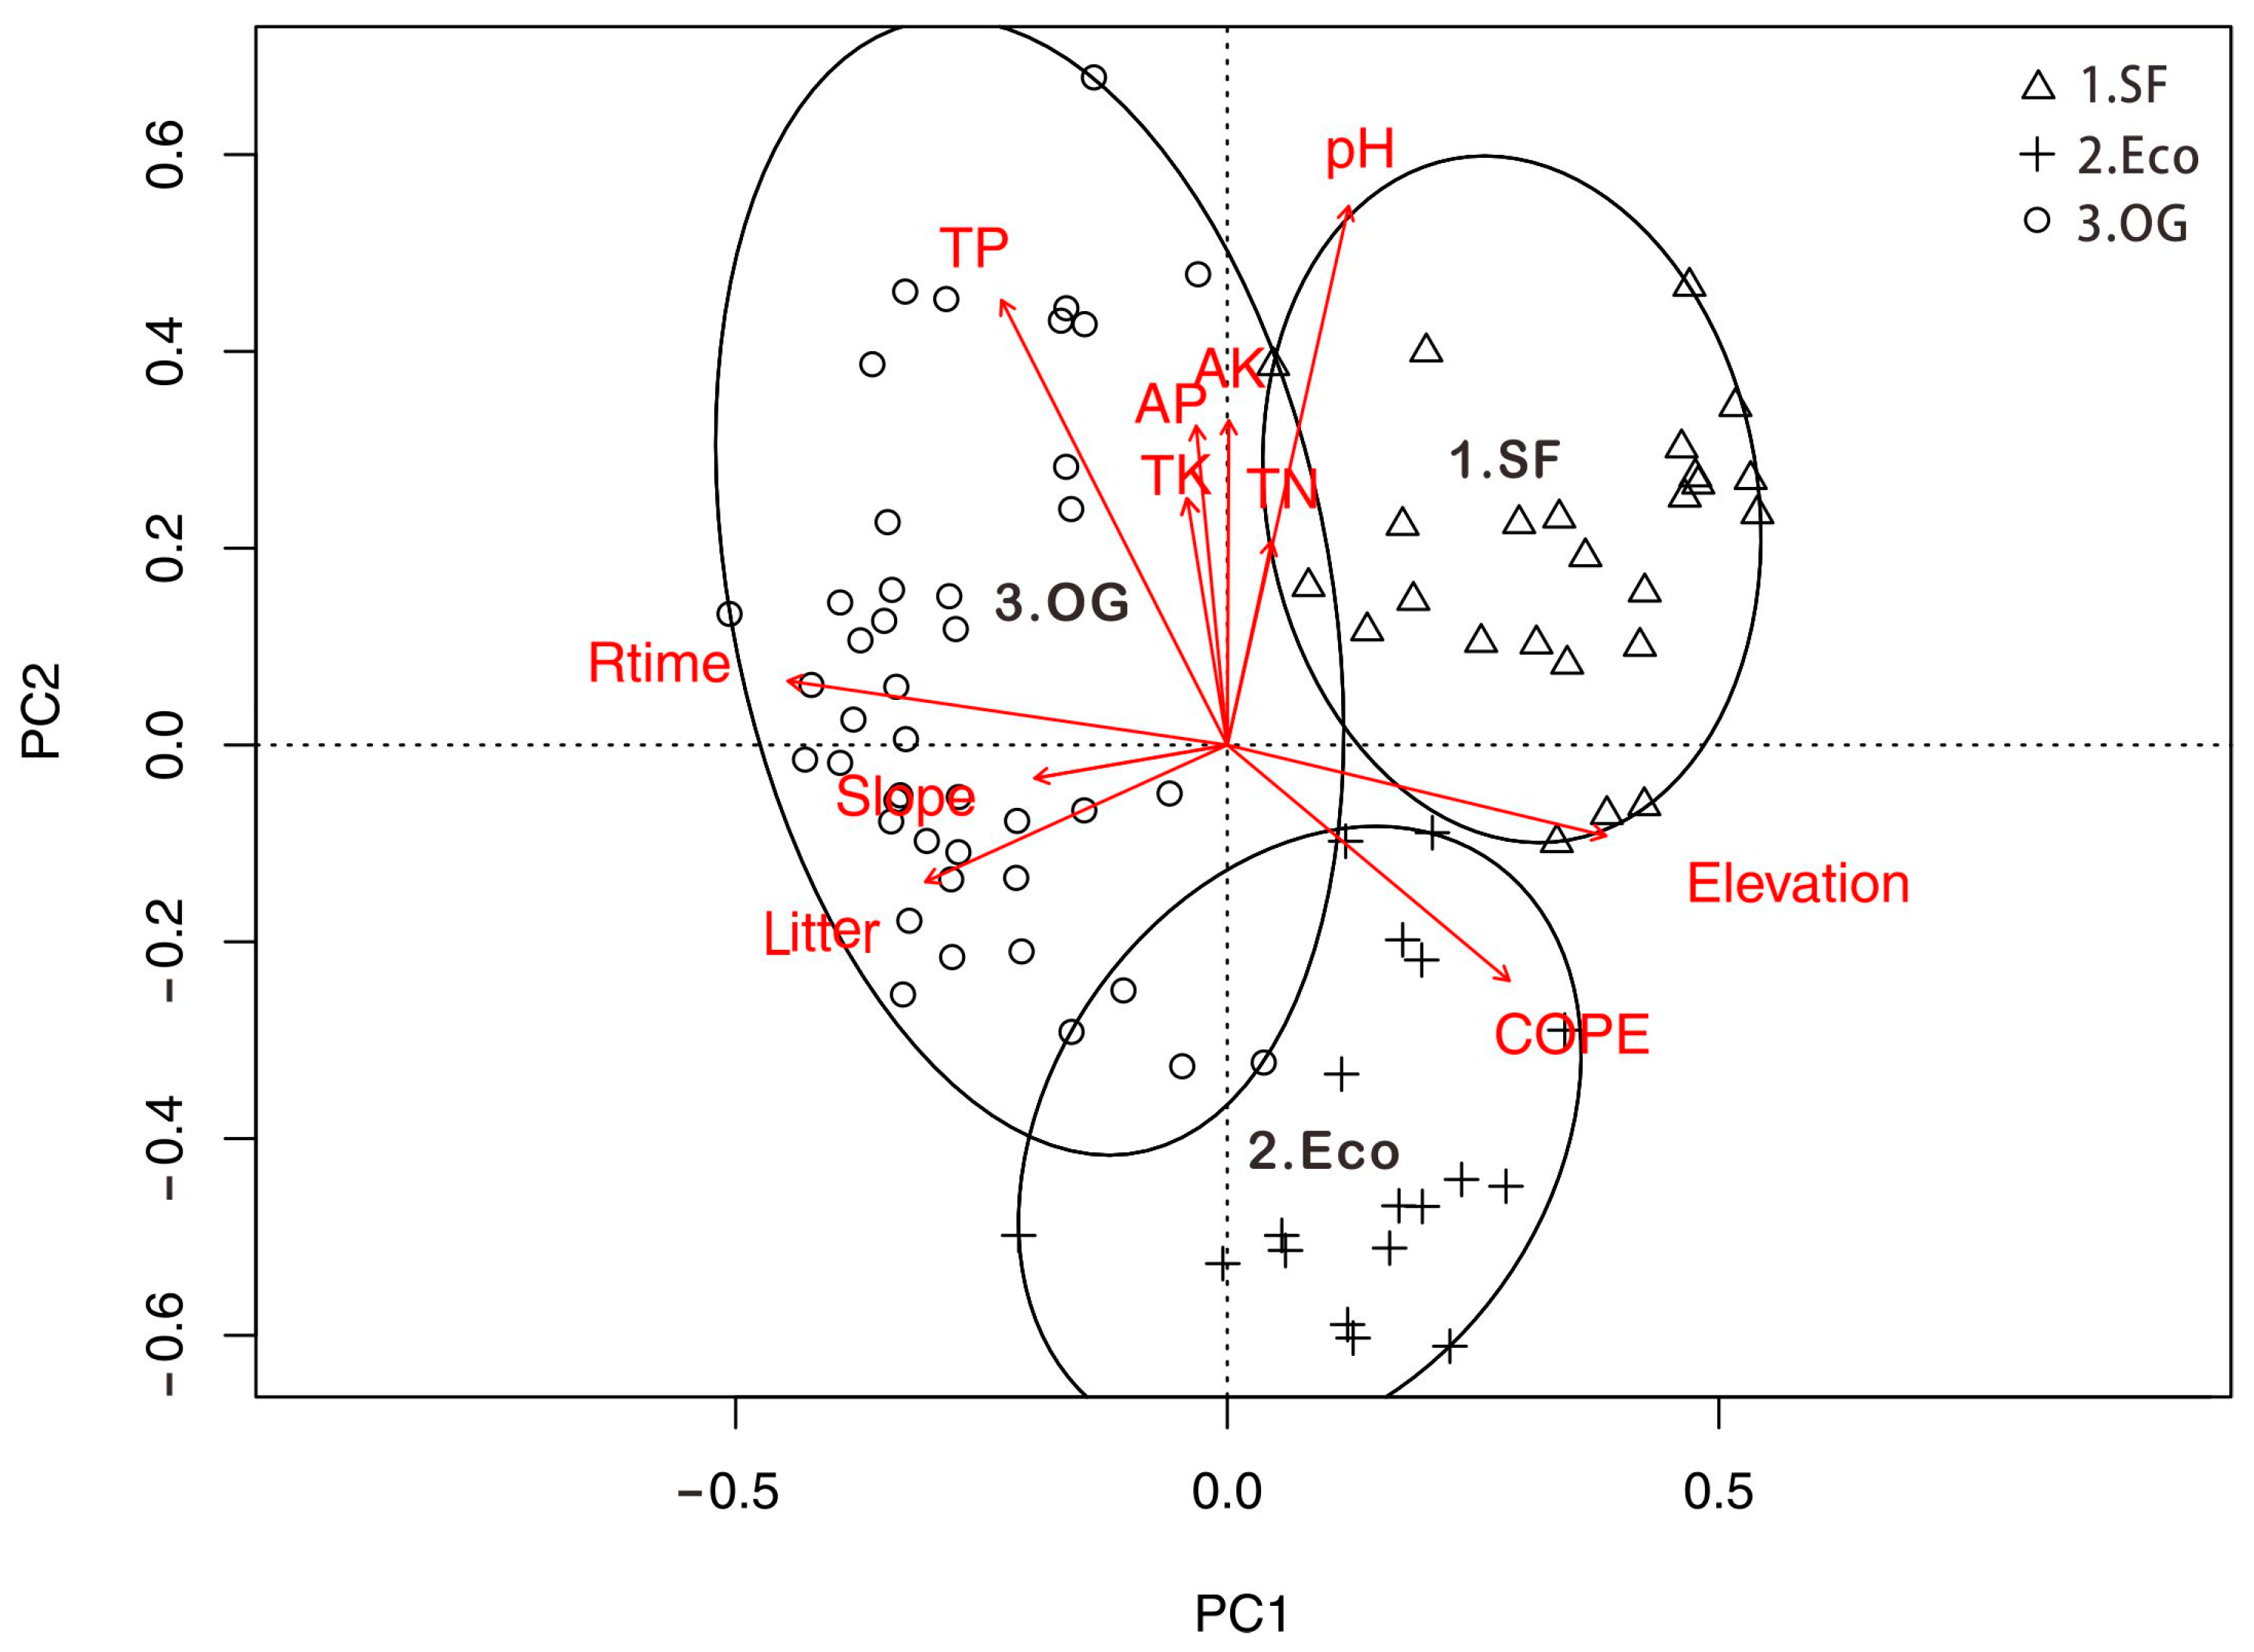
3.3. Relationship between Environmental Factors and Leaf Functional Traits

Most acquisitive leaf functional traits showed a significantly positive correlation. SLA was positively correlated with LNC and LPC, and there was a positive correlation among LNC, LPC, and LKC (Figure 3). All patients tested negative for elevation. SLA was negatively correlated with elevation and positively correlated with total soil P. Leaf nutrients, such as LNC, LPC, and LKC, were positively correlated with community recovery time and soil available N but negatively correlated with canopy openness (Table 2).
The conservative traits between LDMC and LCC were positively correlated, while they were negatively correlated with LNC, LPC, and LKC. LDMC was also negatively correlated with SLA (Figure 3). LDMC and LCC were negatively correlated with recovery time. LDMC was negatively correlated with soil available N and P and positively correlated with soil pH and soil organic matter. LCC was positively correlated with elevation and negatively correlated with soil total N (Table 2).

4. Discussion

Using a large dataset of more than 248 species, our findings corroborate the existence of distinct resource-use strategies involving major leaf functional traits in contrasting tropical forests, which supports the results of previous studies [27,49,50,51,52,53,54]. The forests of secondary ecotone specialist species with a conservative strategy, exhibiting high LDMC and LCC, tended to persist in high-stress habitats such as nutrient-poor soil. Meanwhile, old-growth specialist species invested in trait values related to rapid resource acquisition with high SLA, LNC, LPC, and LKC. The species with functional trait values between the secondary, ecotone, and old-growth forests had clear signatures of their different strategies to persist in assemblages under distinct and opposite environmental filters.
Our results have shown that secondary forests and ecotone forests were dominated by L. pierrei var. szemois, C. echinocarpa, A. tenera, S. polypetaloideum, B. ramiflora, and S. ternatum. These species have trait values related to defense against nutrient-poor soils, that is, higher LDMC, lower SLA, LNC, LPC, and LKC, and slow growth, namely higher LDMC and LCC, and low SLA, indicating strategies for biotic and abiotic stress tolerance [51,54,55]. They spend most of their lives on structural and foliar defenses against stress [33]. High LDMC and LCC indicated greater cellulose content and more fibrous and hard tissues [56], This contributed to limiting physical damage, reducing the demand for nutrients to replace browsed leaves [57] and helping with effective water use [20,33]. Therefore, the community-level patterns we observed for SLA, LNC, LPC, LKC, LDMC, and LCC supported the expectation that species with slow-resource conservation strategies are dominant among secondary forests which have lower soil nutrient availability [20,33,58,59]. Resource conservation strategies become more important when the available resources become more restricted.
Meanwhile, old-growth forests, dominated by P. lanceolata, P. chinensis, and P. kerrii, expressed traits associated with high efficiency in capturing and using resources, such as light with high SLA, nutrients with high LNC, LPC, and LKC, and high competitive vigor that resulted in taller plants. They are often adapted to survival and achieve faster growth rates. They preferentially allocate carbon for growth, including leaf, diameter, and height, and achieve high mechanical strength at low construction costs [60,61,62]. A high SLA allows species to have high photosynthetic and respiration rates [24,63,64]. Therefore, leaf metabolism accelerates, which promotes the accumulation of litter, creating a habitat with higher soil nutrients. Plants growing in nutrient-rich areas generally have higher growth potential and smaller canopy openness [4]. Meanwhile, old-growth specialist species showed an acquisition growth pattern with an open strategy of rapid growth and rapidly absorbed available resources such as soil nutrients [4,7,65,66]. This resulted in high LNC, LPC, and LKC [14]. Significant positive correlations have been reported between the maximum photosynthesis rate and SLA [67,68], LNC [68,69,70], LPC and LKC [70,71]. Species with high SLA, LNC, LPC, and LKC typically occur in nutrient rich and light-limiting habitats. Meanwhile, species with high LDMC and LCC tend to occur in nutrient-limited habitats [4,68,72].
In our study, recovery time and elevation explained much more of the species and leaf functional trait variation than other environmental factors, such as soil nutrients and light capture, which supported our prediction. As succession advanced, we found increased soil nutrient levels [73], and the increased nutrients could increase rapid plant growth of the species basal area, height, and leaves [74]. This promoted the accumulation of litter and, in turn, created a habitat with higher soil nutrients. As succession advanced, plants growing in nutrient-rich areas generally had a higher growth potential and smaller canopy openness. Soil total P was the highest among old-growth forests, which played a more important role than the other soil nutrients in our study. This may be because soil N can recover quickly through organic deposition, such as dead plant material and defecation. The increase or recovery of P is primarily through deposition atmospheric deposition, which requires more than 50 years to recover from the origin recovery [75,76,77].
Environmental filters on species and functional trait distributions are greater at higher elevations with nutrient-poor soil and strong winds, restricting species composition and the range of trait distributions [78,79]. Conversely, interspecific competition is intense at low elevations where soil nutrients are freely available, which can also affect trait variance [79]. Therefore, the decrease in leaf traits including SLA, LNC, LPC, and LKC at high elevations reflected the elevational changes in adaptive leaf traits in our study. However, no trends were found in any of the water relationship variables measured in our study, which was different from tropical dry forests, where water is a strong stress factor. The selected functional traits assigned to water stress [80] may co-vary with other factors, such as greater resistance to nutrient stress in a substrate with low nutrient availability, and may be more related to resource conservation [81,82]. Other topographic factors, such as slope and aspect, had no strong influence on species or functional trait variation across different forests. This may be because the factors observed in the present study were relatively similar.

5. Conclusions

In the present study, secondary forests and ecotone forests with a conservative strategy, exhibiting high LDMC and LCC, tended to persist in stress habitats, such as nutrient-poor soil. Meanwhile, old-growth forests invested in trait values related to rapid resource acquisition with high SLA, LNC, LPC, and LKC. Species with functional trait values between secondary, ecotone, and old-growth forests had clear signatures of their different strategies to persist in assemblages under distinct and opposite environmental filters. Recovery time and elevation, followed by soil nutrient and light capture, explained much more of the species and leaf functional trait variation, which supported our prediction. However, soil water was not a strong restriction, which was different from tropical dry forests. Our findings suggest that conducting leaf function-based trait variations to understand plant ecological strategies along environmental gradients may improve our understanding of forest dynamics in tropical monsoon forests.
Our conclusions supported previous studies [27,49,50,51,52,53,54], that conservative traits with high LDMC and LCC promoted resistance to high-stress environments. Meanwhile, acquisitive traits with high SLA, LNC, LPC, and LKC indicated higher competitive ability and faster resource acquisition in richly available resources such as soil nutrients. This had similar acquisitive-conservative strategy co-variations with environmental gradients during the succession of tropical dry forests, as shown by Lohbeck [20,25]. These results have allowed us to identify the major leaf functional traits and environmental factors involved in species composition across different forests in tropical monsoon forests and demonstrate that environmental filtering. In this case, this includes recovery time and elevation, followed by soil nutrients and available light, representing the processes that shape community composition and leaf functional traits in tropical monsoon forests.

Author Contributions

Conceptualization, F.D. and R.Z.; methodology, F.D.; software, L.X. and J.H.; validation, F.D., J.H. and H.L.; formal analysis, F.D. and L.X.; investigation, F.D., L.X., J.H. and H.L.; resources, F.D.; data curation, F.D. and J.H.; writing—original draft preparation, F.D. and L.X.; writing—review and editing, R.Z.; visualization, F.D.; supervision, R.Z.; funding acquisition, F.D. and L.X. All authors have read and agreed to the published version of the manuscript.

Funding

This research was funded by the National Natural Science Foundation of China (31460112 and 31100391), the university-level education reform project of Yunnan University “Construction of Excellent Talents Training System for Plateau Mountain Characteristic Geography under the Background of Double First-Class” (2022Y15), the university-level graduate student high-quality courses of Yunnan University “Environmental Monitoring and Ecological Security Assessment” (2022XJYZKC03), and The 14th Graduate Research and Innovation Program of Yunnan University (KC-22222965).

Data Availability Statement

The data that has been used is confidential.

Acknowledgments

We thank all the people involved in this project and the reviewers who provided constructive comments.

Conflicts of Interest

The authors declare that they have no known competing financial interests or personal relationships that could have appeared to influence the work reported in this paper.

References

  1. Violle, C.; Navas, M.L.; Vile, D.; Kazakou, E.; Fortunel, C.; Hummel, I.; Garnier, E. Let the concept of trait be functional! Oikos 2007, 116, 882–892. [Google Scholar] [CrossRef]
  2. Li, S.; Wang, H.; Gou, W.; White, J.F.; Kingsley, K.L.; Wu, G.; Su, P. Leaf functional traits of dominant desert plants in the Hexi Corridor, Northwestern China: Trade-off relationships and adversity strategies. Glob. Ecol. Conserv. 2021, 28, e01666. [Google Scholar] [CrossRef]
  3. Oktavia, D.; Jin, G. Variations in leaf morphological and chemical traits in response to life stages, plant functional types, and habitat types in an old-growth temperate forest. Basic Appl. Ecol. 2020, 49, 22–33. [Google Scholar] [CrossRef]
  4. Duan, X.; Jia, Z.; Li, J.; Wu, S. The influencing factors of leaf functional traits variation of Pinus densiflora Sieb. et Zucc. Glob. Ecol. Conserv. 2022, 38, e02177. [Google Scholar] [CrossRef]
  5. Zhang, J.; Cheng, K.; Zang, R.; Ding, Y. Environmental filtering of species with different functional traits into plant assemblages across a tropical coniferous-broadleaved forest ecotone. Plant Soil 2014, 380, 361–374. [Google Scholar] [CrossRef]
  6. Khan, A.; Yan, L.; Mahadi Hasan, M.; Wang, W.; Xu, K.; Zou, G.; Liu, X.-D.; Fang, X.-W. Leaf traits and leaf nitrogen shift photosynthesis adaptive strategies among functional groups and diverse biomes. Ecol. Indic. 2022, 141, 109098. [Google Scholar] [CrossRef]
  7. Charles, B.; Chase, M.H.; Pociask, G.; Bhattarai, R.; Matthews, J.W. Can functional leaf traits be used for monitoring wetland restoration? A comparison between commonly used monitoring metrics and functional leaf traits. Ecol. Indic. 2022, 140, 109032. [Google Scholar] [CrossRef]
  8. Wright, S.J.; Kitajima, K.; Kraft, N.J.B.; Reich, P.B.; Wright, I.J.; Bunker, D.E.; Condit, R.; Dalling, J.W.; Davies, S.J.; Díaz, S.; et al. Functional traits and the growth–mortality trade-off in tropical trees. Ecology 2010, 91, 3664–3674. [Google Scholar] [CrossRef]
  9. Mahayani, N.P.D.; Slik, F.J.W.; Webb, E.L.; Savini, T.; Gale, G.A. Changes in tree functional composition and forest functioning ten years after logging and thinning interventions in Bornean tropical forests. For. Ecol. Manag. 2022, 506, 119948. [Google Scholar] [CrossRef]
  10. Botha, M.; Greve, M. How do functional traits change during plant succession? A review. S. Afr. J. Bot. 2018, 115, 281. [Google Scholar] [CrossRef]
  11. Ling-Ling, S.; Qing, T.; Guang, L.; Zong-Xing, L.; Xiaoying, L.; Juan, G.; Yuchen, L.; Qiao, C.; Yue, Z. Variation in characteristics of leaf functional traits of alpine vegetation in the Three-River Headwaters Region, China. Ecol. Indic. 2022, 145, 109557. [Google Scholar] [CrossRef]
  12. Aerts, R.; Chapin, F.S., III. The mineral nutrition of wild plants revisited: A re-evaluation of processes and patterns. In Advances in Ecological Research; Elsevier: Amsterdam, The Netherlands, 1999; Volume 30, pp. 1–67. [Google Scholar]
  13. Li, C.; Yu, H.; Xu, Y.; Zhu, W.; Wang, P.; Huang, J. Close linkages between leaf functional traits and soil and leaf C:N:P stoichiometry under altered precipitation in a desert steppe in northwestern China. Plant Ecol. 2022, 223, 407–421. [Google Scholar] [CrossRef]
  14. Tor-ngern, P.; Chart-asa, C.; Chanthorn, W.; Rodtassana, C.; Yampum, S.; Unawong, W.; Nathalang, A.; Brockelman, W.; Srinoppawan, K.; Chen, Y.; et al. Variation of leaf-level gas exchange rates and leaf functional traits of dominant trees across three successional stages in a Southeast Asian tropical forest. For. Ecol. Manag. 2021, 489, 119101. [Google Scholar] [CrossRef]
  15. Chanthorn, W.; Hartig, F.; Brockelman, W.Y. Structure and community composition in a tropical forest suggest a change of ecological processes during stand development. For. Ecol. Manag. 2017, 404, 100–107. [Google Scholar] [CrossRef]
  16. Zhang, H.; John, R.; Peng, Z.; Yuan, J.; Chu, C.; Du, G.; Zhou, S. The Relationship between Species Richness and Evenness in Plant Communities along a Successional Gradient: A Study from Sub-Alpine Meadows of the Eastern Qinghai-Tibetan Plateau, China. PLoS ONE 2012, 7, e49024. [Google Scholar] [CrossRef]
  17. Ordoñez, J.C.; Van Bodegom, P.M.; Witte, J.-P.M.; Wright, I.J.; Reich, P.B.; Aerts, R. A global study of relationships between leaf traits, climate and soil measures of nutrient fertility. Glob. Ecol. Biogeogr. 2009, 18, 137–149. [Google Scholar] [CrossRef]
  18. De la Riva, E.; Villar, R.; Perez-Ramos, I.; Quero, J.; Matías, L.; Poorter, L.; Marañón, T. Relationships between leaf mass per area and nutrient concentrations in 98 Mediterranean woody species are determined by phylogeny, habitat and leaf habit. Trees 2018, 32, 497–510. [Google Scholar] [CrossRef]
  19. Zirbel, C.R.; Grman, E.; Bassett, T.; Brudvig, L.A. Landscape context explains ecosystem multifunctionality in restored grasslands better than plant diversity. Ecology 2019, 100, e02634. [Google Scholar] [CrossRef]
  20. Lohbeck, M.; Poorter, L.; Lebrija-Trejos, E.; Martínez-Ramos, M.; Meave, J.A.; Paz, H.; Pérez-García, E.A.; Romero-Pérez, I.E.; Tauro, A.; Bongers, F. Successional changes in functional composition contrast for dry and wet tropical forest. Ecology 2013, 94, 1211–1216. [Google Scholar] [CrossRef]
  21. Buzzard, V.; Hulshof, C.M.; Birt, T.; Violle, C.; Enquist, B.J. Re-growing a tropical dry forest: Functional plant trait composition and community assembly during succession. Funct. Ecol. 2016, 30, 1006–1013. [Google Scholar] [CrossRef]
  22. Lebrija-Trejos, E.; Pérez-García, E.A.; Meave, J.A.; Bongers, F.; Poorter, L. Functional traits and environmental filtering drive community assembly in a species-rich tropical system. Ecology 2010, 91, 386–398. [Google Scholar] [CrossRef] [PubMed]
  23. Guariguata, M.R.; Ostertag, R. Neotropical secondary forest succession: Changes in structural and functional characteristics. For. Ecol. Manag. 2001, 148, 185–206. [Google Scholar] [CrossRef]
  24. Wright, I.J.; Reich, P.B.; Westoby, M.; Ackerly, D.D.; Baruch, Z.; Bongers, F.; Cavender-Bares, J.; Chapin, T.; Cornelissen, J.H.; Diemer, M.; et al. The worldwide leaf economics spectrum. Nature 2004, 428, 821–827. [Google Scholar] [CrossRef]
  25. Lohbeck, M.; Lebrija-Trejos, E.; Martínez-Ramos, M.; Meave, J.A.; Poorter, L.; Bongers, F. Functional trait strategies of trees in dry and wet tropical forests are similar but differ in their consequences for succession. PLoS ONE 2015, 10, e0123741. [Google Scholar] [CrossRef] [PubMed]
  26. Poorter, L.; Rozendaal, D.M.A.; Bongers, F.; de Almeida-Cortez, J.S.; Almeyda Zambrano, A.M.; Álvarez, F.S.; Andrade, J.L.; Villa, L.F.A.; Balvanera, P.; Becknell, J.M.; et al. Wet and dry tropical forests show opposite successional pathways in wood density but converge over time. Nat. Ecol. Evol. 2019, 3, 928–934. [Google Scholar] [CrossRef]
  27. Faccion, G.; Alves, A.M.; do Espírito-Santo, M.M.; Silva, J.O.; Sanchez-Azofeifa, A.; Ferreira, K.F. Intra- and interspecific variations on plant functional traits along a successional gradient in a Brazilian tropical dry forest. Flora 2021, 279, 151815. [Google Scholar] [CrossRef]
  28. Vogel, A.; Manning, P.; Cadotte, M.W.; Cowles, J.; Isbell, F.; Jousset, A.L.C.; Kimmel, K.; Meyer, S.T.; Reich, P.B.; Roscher, C.; et al. Chapter Three—Lost in trait space: Species-poor communities are inflexible in properties that drive ecosystem functioning. In Advances in Ecological Research; Eisenhauer, N., Bohan, D.A., Dumbrell, A.J., Eds.; Academic Press: Cambridge, MA, USA, 2019; Volume 61, pp. 91–131. [Google Scholar]
  29. Wu, Z.Y. Vegetation of China; Science Press: Beijing, China, 1980; pp. 363–397. [Google Scholar]
  30. Peng, J.B.; Liu, T.; Chen, J.X.; Li, Z.Y.; Ling, Y.A.; De Wulf, A.; De Maeyer, P. The conflicts of agricultural water supply and demand under climate change in a typical arid land watershed of Central Asia. J. Hydrol. Reg. Stud. 2023, 47, 101384. [Google Scholar] [CrossRef]
  31. Chen, J.X.; Zhang, J.H.; Peng, J.B.; Zou, L.; Fan, Y.J.; Yang, F.R.; Hu, Z.W. Alp-valley and elevation effects on the reference evapotranspiration and the dominant climate controls in Red River Basin, China: Insights from geographical differentiation. J. Hydrol. 2023, 620, 129397. [Google Scholar] [CrossRef]
  32. Zhang, J.; Zuo, X.; Lv, P.; Zhao, S.; Zhao, X. Plant functional trait response to habitat change and grazing in a semiarid grassland: Unravelling species turnover and intraspecific variation effects. Pol. J. Ecol. 2019, 67, 62–74. [Google Scholar] [CrossRef]
  33. Lebrija-Trejos, E.; Pérez-García, E.A.; Meave, J.A.; Poorter, L.; Bongers, F. Environmental changes during secondary succession in a tropical dry forest in Mexico. J. Trop. Ecol. 2011, 27, 477–489. [Google Scholar] [CrossRef]
  34. Cao, M.; Zou, X.; Warren, M.; Zhu, H. Tropical Forests of Xishuangbanna, China1. Biotropica 2006, 38, 306–309. [Google Scholar] [CrossRef]
  35. Flora e Funga do Brasil. Jardim Botânico do Rio de Janeiro. Available online: http://floradobrasil.jbrj.gov.br/ (accessed on 9 May 2022).
  36. Chianucci, F.; Cutini, A. Estimation of canopy properties in deciduous forests with digital hemispherical and cover photography. Agric. For. Meteorol. 2013, 168, 130–139. [Google Scholar] [CrossRef]
  37. Harms, K.E.; Condit, R.; Hubbell, S.P.; Foster, R.B. Habitat associations of trees and shrubs in a 50-ha neotropical forest plot. J. Ecol. 2001, 89, 947–959. [Google Scholar] [CrossRef]
  38. Cornelissen, J.H.C.; Lavorel, S.; Garnier, E.; Díaz, S.; Buchmann, N.; Gurvich, D.E.; Reich, P.B.; Steege, H.t.; Morgan, H.D.; Heijden, M.G.A.V.D.; et al. A handbook of protocols for standardised and easy measurement of plant functional traits worldwide. Aust. J. Bot. 2003, 51, 335–380. [Google Scholar] [CrossRef]
  39. Lenza, E.; Klink, C.A. Phenological behavior of woody species in a “cerrado” sensu stricto of Brasília, DF. Braz. J. Bot. 2006, 29, 627–638. [Google Scholar] [CrossRef]
  40. Araújo, I.; Morandi, P.S.; Müller, A.O.; Mariano, L.H.; Alvarez, F.; da Silva, I.V.; Marimon Junior, B.H.; Marimon, B.S. Leaf functional traits and monodominance in Southern Amazonia tropical forests. Plant Ecol. 2022, 223, 185–200. [Google Scholar] [CrossRef]
  41. Bao, S.D. Soil Agricultural Chemical Analysis; China Agricultural Press: Beijing, China, 2000. [Google Scholar]
  42. Zhao, N.; Yu, G.; He, N.; Wang, Q.; Guo, D.; Zhang, X.; Wang, R.; Xu, Z.; Jiao, C.; Li, N.; et al. Coordinated pattern of multi-element variability in leaves and roots across Chinese forest biomes. Glob. Ecol. Biogeogr. 2016, 25, 359–367. [Google Scholar] [CrossRef]
  43. Maeshiro, R.; Kusumoto, B.; Fujii, S.; Shiono, T.; Kubota, Y. Using tree functional diversity to evaluate management impacts in a subtropical forest. Ecosphere 2013, 4, art70. [Google Scholar] [CrossRef]
  44. Dufrene, M.; Legendre, P. Species Assemblages and Indicator Species: The Need for a Flexible Asymmetrical Approach. Ecol. Monogr. 1997, 67, 345–366. [Google Scholar] [CrossRef]
  45. Rangel, T.F.; Diniz-Filho, J.A.F.; Bini, L.M. SAM: A comprehensive application for Spatial Analysis in Macroecology. Ecography 2010, 33, 46–50. [Google Scholar] [CrossRef]
  46. Ding, Y.; Zang, R.; Liu, S.; He, F.; Letcher, S.G. Recovery of woody plant diversity in tropical rain forests in southern China after logging and shifting cultivation. Biol. Conserv. 2012, 145, 225–233. [Google Scholar] [CrossRef]
  47. Slik, J.W.F.; Aiba, S.-I.; Brearley, F.Q.; Cannon, C.H.; Forshed, O.; Kitayama, K.; Nagamasu, H.; Nilus, R.; Payne, J.; Paoli, G.; et al. Environmental correlates of tree biomass, basal area, wood specific gravity and stem density gradients in Borneo’s tropical forests. Glob. Ecol. Biogeogr. 2010, 19, 50–60. [Google Scholar] [CrossRef]
  48. Team, R.C. R: A Language and Environment for Statistical Computing; R Foundation for Sattistical Computing: Vienna, Austria, 2016. [Google Scholar]
  49. Reich, P.B.; Ellsworth, D.S.; Walters, M.B. Leaf structure (specific leaf area) modulates photosynthesis-nitrogen relations: Evidence from within and across species and functional groups. Funct. Ecol. 1998, 12, 948–958. [Google Scholar] [CrossRef]
  50. Feng, Y.-L.; Fu, G.-L.; Zheng, Y.-L. Specific leaf area relates to the differences in leaf construction cost, photosynthesis, nitrogen allocation, and use efficiencies between invasive and noninvasive alien congeners. Planta 2008, 228, 383–390. [Google Scholar] [CrossRef] [PubMed]
  51. Hoffmann, W.A.; Geiger, E.L.; Gotsch, S.G.; Rossatto, D.R.; Silva, L.C.R.; Lau, O.L.; Haridasan, M.; Franco, A.C. Ecological thresholds at the savanna-forest boundary: How plant traits, resources and fire govern the distribution of tropical biomes. Ecol. Lett. 2012, 15, 759–768. [Google Scholar] [CrossRef]
  52. Díaz, S.; Hodgson, J.G.; Thompson, K.; Cabido, M.; Cornelissen, J.H.C.; Jalili, A.; Montserrat-Martí, G.; Grime, J.P.; Zarrinkamar, F.; Asri, Y.; et al. The plant traits that drive ecosystems: Evidence from three continents. J. Veg. Sci. 2004, 15, 295–304. [Google Scholar] [CrossRef]
  53. Hoffmann, W.A.; Orthen, B.; Franco, A.C. Constraints to seedling success of savanna and forest trees across the savanna-forest boundary. Oecologia 2004, 140, 252–260. [Google Scholar] [CrossRef]
  54. Pausas, J.G.; Keeley, J.E.; Schwilk, D.W. Flammability as an ecological and evolutionary driver. J. Ecol. 2017, 105, 289–297. [Google Scholar] [CrossRef]
  55. Takashima, T.; Hikosaka, K.; Hirose, T. Photosynthesis or persistence: Nitrogen allocation in leaves of evergreen and deciduous Quercus species. Plant Cell Environ. 2004, 27, 1047–1054. [Google Scholar] [CrossRef]
  56. Kitajima, K.; Llorens, A.M.; Stefanescu, C.; Timchenko, M.V.; Lucas, P.W.; Wright, S.J. How cellulose-based leaf toughness and lamina density contribute to long leaf lifespans of shade-tolerant species. New Phytol. 2012, 195, 640–652. [Google Scholar] [CrossRef]
  57. Cunningham, S.A.; Summerhayes, B.; Westoby, M. Evolutionary divergences in leaf structure and chemistry, comparing rainfall and soil nutrient gradients. Ecol. Monogr. 1999, 69, 569–588. [Google Scholar] [CrossRef]
  58. Poorter, L.; Bongers, F. Leaf traits are good predictors of plant performance across 53 rain forest species. Ecology 2006, 87, 1733–1743. [Google Scholar] [CrossRef] [PubMed]
  59. Derroire, G.; Powers, J.S.; Hulshof, C.M.; Cárdenas Varela, L.E.; Healey, J.R. Contrasting patterns of leaf trait variation among and within species during tropical dry forest succession in Costa Rica. Sci. Rep. 2018, 8, 285. [Google Scholar] [CrossRef]
  60. Larjavaara, M.; Muller-Landau, H.C. Rethinking the value of high wood density. Funct. Ecol. 2010, 24, 701–705. [Google Scholar] [CrossRef]
  61. Plourde, B.T.; Boukili, V.K.; Chazdon, R.L. Radial changes in wood specific gravity of tropical trees: Inter- and intraspecific variation during secondary succession. Funct. Ecol. 2015, 29, 111–120. [Google Scholar] [CrossRef]
  62. Chave, J.; Coomes, D.; Jansen, S.; Lewis, S.L.; Swenson, N.G.; Zanne, A.E. Towards a worldwide wood economics spectrum. Ecol. Lett. 2009, 12, 351–366. [Google Scholar] [CrossRef] [PubMed]
  63. Ellsworth, D.S.; Reich, P.B. Photosynthesis and Leaf Nitrogen in Five Amazonian Tree Species During Early Secondary Succession. Ecology 1996, 77, 581–594. [Google Scholar] [CrossRef]
  64. Raaimakers, D.; Boot, R.G.A.; Dijkstra, P.; Pot, S. Photosynthetic rates in relation to leaf phosphorus content in pioneer versus climax tropical rainforest trees. Oecologia 1995, 102, 120–125. [Google Scholar] [CrossRef]
  65. Pacala, S.W.; Rees, M.A. Models Suggesting Field Experiments to Test Two Hypotheses Explaining Successional Diversity. Am. Nat. 1998, 152, 729–737. [Google Scholar] [CrossRef]
  66. Muscarella, R.; Uriarte, M.; Aide, T.M.; Erickson, D.L.; Forero, M.; Kress, W.J.; Swenson, N.G.; Zimmerman, J.K. Functional convergence and phylogenetic divergence during secondary succession of subtropical wet forests in Puerto Rico. J. Veg. Sci. 2016, 27, 283–294. [Google Scholar] [CrossRef]
  67. Quero, J.L.; Villar, R.; Marañón, T.; Zamora, R. Interactions of drought and shade effects on seedlings of four Quercus species: Physiological and structural leaf responses. New Phytol. 2006, 170, 819–834. [Google Scholar] [CrossRef] [PubMed]
  68. Rada, F.; Sarmiento, L.; García-Varela, S. Plant functional traits along an old-field succession in the high tropical andes. Acta Oecologica 2021, 111, 103738. [Google Scholar] [CrossRef]
  69. Gulías, J.; Flexas, J.; Mus, M.; Cifre, J.; Lefi, E.; Medrano, H. Relationship between maximum leaf photosynthesis, nitrogen content and specific leaf area in Balearic endemic and non-endemic Mediterranean species. Ann. Bot. 2003, 92, 215–222. [Google Scholar] [CrossRef] [PubMed]
  70. Hölscher, D.; Leuschner, C.; Bohman, K.; Hagemeier, M.; Juhrbandt, J.; Tjitrosemito, S. Leaf gas exchange of trees in old-growth and young secondary forest stands in Sulawesi, Indonesia. Trees Struct. Funct. 2006, 20, 278–285. [Google Scholar] [CrossRef]
  71. Zhang, G.; Zhang, L.; Wen, D. Photosynthesis of subtropical forest species from different successional status in relation to foliar nutrients and phosphorus fractions. Sci. Rep. 2018, 8, 10455. [Google Scholar] [CrossRef]
  72. Asefa, M.; Cao, M.; Zhang, G.; Ci, X.; Li, J.; Yang, J. Environmental filtering structures tree functional traits combination and lineages across space in tropical tree assemblages. Sci. Rep. 2017, 7, 132. [Google Scholar] [CrossRef]
  73. Quisehuatl-Medina, A.; Averett, J.P.; Endress, B.A.; Lopez-Toledo, L. Removal of cattle accelerates tropical dry forest succession in Northwestern Mexico. Biotropica 2020, 52, 457–469. [Google Scholar] [CrossRef]
  74. Maza-Villalobos, S.; García-Ramírez, P.; Endress, B.A.; Lopez-Toledo, L. Plant functional traits under cattle grazing and fallow age scenarios in a tropical dry forest of Northwestern Mexico. Basic Appl. Ecol. 2022, 64, 30–44. [Google Scholar] [CrossRef]
  75. Ayala-Orozco, B.; Gavito, M.E.; Mora, F.; Siddique, I.; Balvanera, P.; Jaramillo, V.J.; Cotler, H.; Romero-Duque, L.P.; Martínez-Meyer, E. Resilience of Soil Properties to Land-Use Change in a Tropical Dry Forest Ecosystem. Land Degrad. Dev. 2018, 29, 315–325. [Google Scholar] [CrossRef]
  76. Gavito, M.E.; Sandoval-Pérez, A.L.; del Castillo, K.; Cohen-Salgado, D.; Colarte-Avilés, M.E.; Mora, F.; Santibáñez-Rentería, A.; Siddique, I.; Urquijo-Ramos, C. Resilience of soil nutrient availability and organic matter decomposition to hurricane impact in a tropical dry forest ecosystem. For. Ecol. Manag. 2018, 426, 81–90. [Google Scholar] [CrossRef]
  77. Campo, J.; Maass, M.; Jaramillo, V.J.; Martínez-Yrízar, A.; Sarukhán, J. Phosphorus cycling in a Mexican tropical dry forest ecosystem. Biogeochemistry 2001, 53, 161–179. [Google Scholar] [CrossRef]
  78. Niklas, K.L. Differences between Acer saccharum Leaves from Open and Wind-Protected Sites. Ann. Bot. 1996, 78, 61–66. [Google Scholar] [CrossRef]
  79. Ohdo, T.; Takahashi, K. Plantspecies richness and community assembly along gradients of elevation and soil nitrogen availability. Aob Plants 2020, 12, plaa014. [Google Scholar] [CrossRef] [PubMed]
  80. Llambí, L.D.; Fontaine, M.; Rada, F.; Saugier, B.; Sarmiento, L. Ecophysiology of Dominant Plant Species during Old-Field Succession in a High Tropical Andean Ecosystem. Arct. Antarct. Alp. Res. 2003, 35, 447–453. [Google Scholar] [CrossRef]
  81. Llambí, L.; Sarmiento, L. Biomasa microbiana y otros parámetros edáficos en una sucesión secundaria en el páramo. Ecotropicos 1998, 11, 1–14. [Google Scholar]
  82. Monasterio, M.; Sarmiento, L. Adaptive radiation of Espeletia in the cold andean tropics. Trends Ecol. Evol. 1991, 6, 387–391. [Google Scholar] [CrossRef]
Figure 1. Principal component analysis (PCA) multivariate distribution of 86 vegetation plots and 15 environmental factors across three forest types Categories included secondary forests (SF), ecotone forests (Eco), and old-growth forests (OG). In the arrows, Rtime = recovery time after the shifting cultivation of the community, Elevation = elevation, Aspect = aspect, Slope = slope, COPE = canopy openness, SWC = soil water content, pH = soil pH, SOM = soil organic matter, Litter= the thickness of the litter layer; TN = soil total N; TP = soil total P; TK = soil total K; AN = soil available N; AP = soil available P; and AK = soil available K. The longer the arrow indicates, the higher the relevance.
Forests 14 02101 g001
Figure 2. Leaf functional trait variations across three forest types. Categories included secondary forests (SF), ecotone forests (Eco), and old-growth forests (OG). Significant differences between forest preferences were shown with different letters (Tukey’s HSD test, p < 0.05). Boxplots show the median (thick horizontal line), first and third quartiles (lower and upper fences, respectively), and minimum and maximum values (lower and upper whiskers, respectively). Trait abbreviations: SLA = specific leaf area, LNC = leaf nitrogen content, LPC = leaf phosphorus content, LKC = leaf potassium content, LDMC = leaf dry matter content, and LCC = leaf organic carbon content. The rhombus in this figure represent data outliers.
Forests 14 02101 g002
Figure 3. Scatter plots of correlation analysis among six leaf functional traits. In Person’s r value, * was significantly correlated at the 0.05 level, and ** is significantly correlated at the 0.01 level.
Forests 14 02101 g003
Table 1. Composition of indicator species for three forest types. Categories included secondary forests, ecotone forests, and old-growth forests. Indicator species [44] were shown. Significant associations with each of the forests were tested using the probabilities of obtaining as great an indicator value as observed over 1000 iterations (P).
Forest TypesIndicator SpeciesIndicator Valuesp
Secondary ForestsSaprosma ternatum Hook.f.32.60.0382
Baccaurea ramiflora Lour.27.80.3955
Garcinia yunnanensis Hu23.20.0684
Ficus langkokensis Drake230.1336
Dysoxylum excelsum BI.21.70.2144
Antidesma montanum BI.20.80.0442
Dichapetalum gelonioides (Roxb.) Engl.18.80.4733
Beilschmiedia purpurascens H.W.Li18.10.4011
Polyalthia cheliensis Hu16.90.3311
Cinnamomum tenuipilum Kosterm.16.60.0234
Aidia yunnanensis (Hutchins.) Yamazaki16.30.5047
Ecotone ForestsArdisia tenera Mez38.90.0496
Litsea pierrei Lec. var. szemois Liou380.0016
Syzygium polypetaloideum Merr. et Perry37.20.0016
Castanopsis echinocarpa Miq.36.80.0188
Memecylon polyanthum H.L.Li35.80.0022
Litsea verticillata Hance35.80.0014
Garcinia cowa Roxb.35.70.0658
Canarium album (Lour.) Raeusch.35.60.0174
Machilus tenuipila H. W. Li350.1196
Old-growth ForestsLitsea pittosporifolia Yang et P. H. Huang34.40.0086
Phoebe lanceolata (Wall. ex Nees) Nees27.60.7285
Pittosporopsis kerrii Craib27.10.94
Parashorea chinensis Wang Hsie23.40.1416
Knema linifolia (Roxb.) Warb.21.40.6629
Schima crenata Korth.21.40.028
Barringtonia racemosa (L.) Spreng.18.60.4775
Knema erratica (Hook. f. et Thoms.) J. Sincl.18.50.4813
Gironniera subaequalis Planch.18.30.0882
Table 2. The models selected with delta AIC and the importance of each environment parameter for the most parsimonious leaf models, that is, the lowest AIC (p < 0.05 are in bold). The data values, including environmental factors and functional traits, were all transformed by log in this table. Trait abbreviations: SLA = specific leaf area, LNC = leaf nitrogen content, LPC = leaf phosphorus content, LKC = leaf potassium content, LDMC = leaf dry matter content, and LCC = total organic carbon content. The abbreviations of environmental factors are: Rtime = recovery time after the shifting cultivation of the community; Aspect = aspect; Slope = slope, Litter = the thickness of the litter layer, Elevation = elevation; SWC = soil water content, pH = soil pH, SOM = soil organic matter, TN = soil total N, TP = soil total P, TK = soil total K, AN = soil available N, AP = available P, AK = available K, COPE = canopy openness.
Environmental
Factors
Functional Traits
SLALNCLPCLKCLDMCLCC
Models#31,682#11,259#15,354#15,354#15,989#7044
0.2060.3640.4520.4170.2290.341
AICc−253.825−220.177−162.143−85.444−302.118−404.049
Rtime0.3540.6270.8370.644−0.458−0.799
Aspect−0.256−0.302−0.238−0.2250.275−0.808
Slope−0.3120.5150.2980.3010.229−0.378
Litter0.2480.5340.3430.586−0.248−0.293
Elevation−0.616−0.859−0.928−0.761−0.2510.964
SWC−0.2450.3520.2380.368−0.2540.232
pH0.279−0.249−0.293−0.2430.718−0.258
SOM−0.351−0.252−0.387−0.2810.7710.243
TN0.398−0.234−0.548−0.4450.392−0.696
TP0.7390.2380.3780.237−0.433−0.416
TK−0.260.340.6070.33−0.369−0.291
AN0.2770.8510.8570.789−0.488−0.307
AP0.329−0.2830.3180.253−0.515−0.231
AK0.2870.231−0.376−0.2270.4010.238
COPE0.362−0.735−0.711−0.964−0.2430.394
Disclaimer/Publisher’s Note: The statements, opinions and data contained in all publications are solely those of the individual author(s) and contributor(s) and not of MDPI and/or the editor(s). MDPI and/or the editor(s) disclaim responsibility for any injury to people or property resulting from any ideas, methods, instructions or products referred to in the content.

