Article

Resistance to Bark Beetle Outbreak in Norway Spruce: Population Structure Analysis and Comparative Genomic Assessment of Surviving (LTS) and Randomly Selected Reference Trees

1
Department of Genetics and Physiology of Forest Trees, Faculty of Forestry and Wood Sciences, Czech University of Life Sciences Prague, Kamýcká 129, 165 00 Prague, Czech Republic
2
Excellent Team for Mitigation, Faculty of Forestry and Wood Sciences, Czech University of Life Sciences Prague, Kamýcká 129, 165 00 Prague, Czech Republic
3
Institute of Forest Ecology, Slovak Academy of Sciences, Štúrova 2, 960 01 Zvolen, Slovakia
*
Author to whom correspondence should be addressed.
Forests 2023, 14(10), 2074; https://doi.org/10.3390/f14102074
Submission received: 19 September 2023 / Revised: 5 October 2023 / Accepted: 10 October 2023 / Published: 17 October 2023
(This article belongs to the Special Issue Biodiversity and Ecosystem Functioning in Forests)

Abstract

:
Norway Spruce (Picea abies (L.) H. Karst.), a timber species of significant economic and ecological importance in the Northern Hemisphere, faces increasing threats imposed by drought and bark beetle infestation intensified by ongoing climate change. Despite the extensive mortality within stands, a small proportion of mature trees remarkably survive during severe bark beetle outbreaks. Hypothesizing that bark beetle resilience is genetically determined and thus is under natural selection, we anticipated that there is a genetic variation in genome regions linked to the respective resistance in surviving trees. In the Bohemian Forest, restricted to the area of the Czech–Austrian–German border, we identified those resistant individuals, referred to as the “Last Trees Standing” (LTS). Concurrently, we collected reference samples from randomly selected individuals from natural regeneration within concerned sites (seedlings, young trees) and in adjacent unaffected stands (mature trees). Genomic data were generated on a 50K SNPs genotyping array. We conducted a population genetic study based on the Discriminant Analysis of Principal Components (DAPC) method as well as the Genome-Wide Association Study (GWAS). We identified 12 markers (SNPs) significantly associated with tree survival using this approach. Three of those SNPs are located within the genes with the known function in Arabidopsis thaliana orthologs. After further confirmation, we argue that the identified SNPs can be instrumental in identifying trees of higher resistance to bark beetle infestation.

1. Introduction

The European spruce bark beetle (Ips typographus (L.)) is an adverse species native to Europe [1] that attacks coniferous trees, primarily Norway spruce (Picea abies (L.) H. Karst.) [2,3]. It is co-evolutionarily associated with spruce, accompanying the species since the era of glacial refugia [4]. If the abundance of the bark beetle population is at average density, the resilience to pest infestations is dependent on elevation, slope, soil moisture availability, and other soil parameters [5]. In the past, interactions between topographical, climatic, and edaphic conditions led to rare beetle attacks at certain locations [6]. However, the accelerated climate change has intensified prolonged droughts and severe windstorms, resulting in frequent and large-scale bark beetle outbreaks, which have occured repeatedly since the 1990s [7]. In Sweden and Finland, extensive bark beetle attacks ensued after the devastating windstorms of 2005 and 2007 [8,9]. In Central Europe, a notable outbreak started in 2015 and caused unprecedented damage to the spruce-oriented and non-resilient monoculture forest ecosystems [10]. Hence, coniferous forests throughout the Northern Hemisphere have been subjected to unparalleled tree mortality rates, causing detrimental ecological, economic, and social consequences [11,12]. In addition to the environmental factors mentioned above, intraspecific variation in individual resistance is also observed [11,13,14]. Intraspecific variations in cell structures, such as tissue thickness or production of various substances involved in chemical defenses, especially terpenes and phenolics, might form a variance in tree resistance [15]. For example, phenolic compounds were posited to act as chemical markers of mature Norway spruce resistance to I. typographus [16,17,18]. Following inoculation with Endoconidiophora polonica, a fungus vectored by I. typographus, resistant spruce clones exhibited an increased catechin content. Conversely, more susceptible trees displayed elevated isorhapontin content prior to inoculation [17]. Catechin production in response to wounding was shown to be non-linearly and positively associated with spruce survival during bark beetle I. typographus outbreak [19]. Bioassay experiments revealed that catechin and taxifolin modify host acceptance by bark beetles, dampening the tunneling of male and female I. typographus [20]. Trees’ adaptations employ tactics to fortify tissues with polymers like lignin and suberin to bolster their resistance to bark beetles’ drilling attempts and digestion of phloem. Plants utilize chemical defense mechanisms by producing toxic or inhibitory compounds, including various specialized plant metabolites [21]. Although trees can effectively defend themselves against a finite number of simultaneous insect invasions, once this threshold is exceeded, a tree’s site-specific defenses may become insufficient, leading to successful host colonization by the insect invaders [22]. To our knowledge, there are no records for spruce species, but in pines, after an intensive bark beetle infestation, a small fraction of trees, constituting approximately 1%–2% of the total population size, managed to survive [23,24]. We have termed these trees as the “Last Trees Standing” (LTS) [25], and they generally consist of robust, mature trees with larger diameters, typically falling into the classification of trees prone to infestations by bark beetles. [24,26,27]. Understanding the genetic link to bark beetle resistance is critical for devising effective strategies to identify resistant trees and enabling forest management actions that alleviate the impact of bark beetle infestations on forest ecosystems.
Currently, the advent of genomic-based genotyping platforms [28,29,30] anchored on the sequenced Norway spruce genome [31], provides ample prospects to delve into various research questions, such as the genetic determination of drought sensitivity [32,33], wood formation [34,35], ecotypic determination of the species [36], and various phenology-related traits [37]. Although several studies addressing resistance to the insect pest have been conducted [24,38,39], none have focused their research on bark beetles (Scolytinae) colonizing mature Norway spruce. Utilizing genomic data acquired through a 50K SNP chip array [30], our study set out to address three fundamental questions: (1) What is the geographic pattern of genetic structure on a population level? (2) Are there any significant SNP associations between reference and LTS trees and if positive, (3) is it possible to annotate significant SNPs to particular genes?

2. Materials and Methods

2.1. Study Sites and Plant Samples

The study was conducted in the Bohemian Forest region, specifically within the mountainous territories bordering the Czech Republic, Austria, and Germany (Figure 1). The forest ecosystem in this region is characterized by the dominance of Norway spruce, a species that significantly influences the local forest structure. Many local disturbances further shape the structural dynamics of these forests [40] and diverse, historically changing management practices [41], contributing to their ecological complexity. Currently, a significant portion of the region’s ecosystems belongs to the jurisdictions of two reserves: the Bavarian Forest National Park in Germany and the Šumava National Park in the Czech Republic.
We sampled LTS and reference trees growing in four localities severely disturbed by a prolonged ongoing I. typographus outbreak: Modrava, Czechia (48°59′ N 13°26′ E), Smrčina, Czechia (48°44′ N 13°56′ E), Hraničník, Czechia (48°45′ N 13°55′ E), and Dreisessel, Germany (48°47′ N 13°48′ E). I. typographus is dominated bark beetle species, accompanied by Pityogenes chalcographus (L.) [42]. Out of the initially sampled 400 trees in total, the samples of 383 individuals yielded DNA genotyping of sufficient quality and were used in the analysis. Resistant trees (LTS) are mature, lone-standing living trees of the main canopy layer with a diameter at breast height (DBH) exceeding 35 cm parameters and thus belonging to the potential bark beetles’ host trees, surrounded by standing dead beetle-killed individuals or decaying wood laying on the ground. We have not found any signs of bark beetle attack on sampled resistant trees. All standing or windblown neighboring trees with a diameter larger than 35 cm were attacked by bark beetles. Reference trees are either mature trees from adjacent unaffected stands or juvenile trees (seedlings) from the natural regeneration growing near the identified LTS but not closer than 30 m to the latter to avoid sampling highly related individuals (Table 1). If a reference mature tree grew at the edge of the intact stand, we ensured that at least one mature living spruce was present between the reference tree and the corresponding forest gap, forest edge, wind-fallen, or bark beetle-attacked tree(s). See [25] for a comprehensive study area description.
For visualizing the geographical distribution and elevation, we employed the rnaturalearth R package (version 0.3.3) [43]. Subsequently, we used the ggplot2 R package (version 3.4.2) [44] to plot the elevation map with the sampled trees’ coordinates (Figure 1) using the World Geodetic System 1984 (WGS84).
For mature trees, which include all LTS trees and circa 35% of the reference trees, samples were extracted using a 15 mm diameter hole punch on the trunk. Cutouts were preserved using silica gel within airtight plastic bags and subsequently stored at a temperature of −80 °C until further processed. Conversely, 65% of the individuals from the reference population were young trees with needles that could be easily reached from the ground. In these instances, needle samples were collected.

2.2. DNA Extraction and Genotyping

For each sample, roughly 50 mg of tissue from the cambial layer and adjacent wood layers or 80 mg of needles were cut into small pieces with a scalpel and immediately frozen in liquid nitrogen. This material was subsequently homogenized for 3 min at 30 Hz using a MM400 mixer mill (Retsch, Haan, Germany). The total genomic DNA was extracted with the NucleoSpin Plant II (Macherey-Nagel, Düren, Germany) according to the manufacturer’s instructions. The DNA parameters were quantified employing a NanoDrop 2000 spectrophotometer (Thermo Fisher Scientific, Madison, WI, USA), with a subset of these measurements further validated through a Qubit assay (Thermo Fisher Scientific, Madison, WI, USA). The DNA integrity was checked on 0.8% agarose gel. Undiluted aliquots of 45 μL DNA (mean concentration 127 ng/μL, 260/280 ratio between 1.47 and 1.91) were placed into 96-well PCR plates and shipped under dry ice for analysis to the Thermo Fisher genomics facility. Data generation and genotype calling was performed on the 50K SNPchip Axiom array as described by [30]. The raw data were delivered in a CEL file format.

2.3. Data Analysis

In total, 47,445 SNPs were generated, further filtration was carried out in Axiom Analysis Suite (Thermo Fisher Scientific, Madison, WI, USA), and 73.3% (34,792 SNPs) were finally selected to enter the subsequent analysis (filtration parameters: only PolyHighResolution, NoMinorHom, MonoHighResolution categories of markers were kept, DQC: ≥0.82, QC call rate: ≥90, other threshold QC parameters kept by default setting). Statistical analyses were performed using the R software (version 4.3.0; R Core Team, 2019). The Genome-Wide Association Study (GWAS) was performed using ASReml-R (version 4.1.0.176). Firstly, we ran the preprocessing step using the function, pre.gwas, the kinship matrix was calculated via VanRaden method [45]; the minor allele frequency (MAF) was set >0.005. We targeted the tree status (resistant and reference trees) as the response variable in our GWAS model. The genotype (individual ID) was considered a random effect, and the study site was a fixed effect. The function, gwas.asreml, was used to fit the model using a binomial distribution. Our kinship matrix was given by GWAS_pre$Kinv, and our population structure matrix by GWAS pre$Q with the first five principal components used. The significance threshold for the p-value was set at 5 × 10⁻⁴. SNPs were divided into 12 linkage groups according to [30]; unassigned SNPs were grouped into category 0.

2.4. The Population–Genetic Structure

The population genetic analysis was performed via Discriminant Analysis of Principal Components (DAPC). We utilized the functions implemented in the R package adegenet (version 2.1.10). [46]. We used the optim.a.score()$best function to control the trade-off between the power of discrimination and overfitting and to estimate the optimal number of Principal Components (PCs) retained (n.pca = 47). We utilized Jost’s D as a measure of genetic differentiation among populations. To quantify Jost’s D, we created genind objects for each pairwise comparison using the R package adegenet and performed 1000 bootstrap samples. Each population was resampled according to its size using the function chao_bootstrap of the MMOD R package (version 1.3.3) [47]. Then, we obtained the observed genetic distance value and its normalized 95% confidence intervals (CI) for each set of the permuted datasets. CIs were centered on the observed value and corrected with a standard deviation across the replicates using the function, summarise_bootstrap, in the MMOD package. We considered the genetic differentiation index to be statistically significant if the lower bound of the CI was greater than zero.

2.5. Candidate Gene Mining

SNPs that displayed a significant association with survival (p-value < 5 × 10⁻⁴) underwent a further investigation using PlantGenIE web-based platform [48] (accessed on 5 May 2023) and PLAZA 5.0 [49], web-based tools capitalizing on the accessibility of the Norway spruce genome assembly [31] (accessed on 5 May 2023), and function of orthologous Arabidopsis genes were identified (TAIR, https://www.arabidopsis.org/index.jsp (accessed on 5 May 2023)) when available. Arabidopsis thaliana is an excellent model organism for plant research due to its small, easily manipulable genome, rapid life cycle, and extensive genetic resources, making it invaluable for understanding fundamental plant biology. While it differs from conifers in certain aspects, the insights gained from Arabidopsis research can be applied to broader plant studies, including conifer species [50].

3. Results

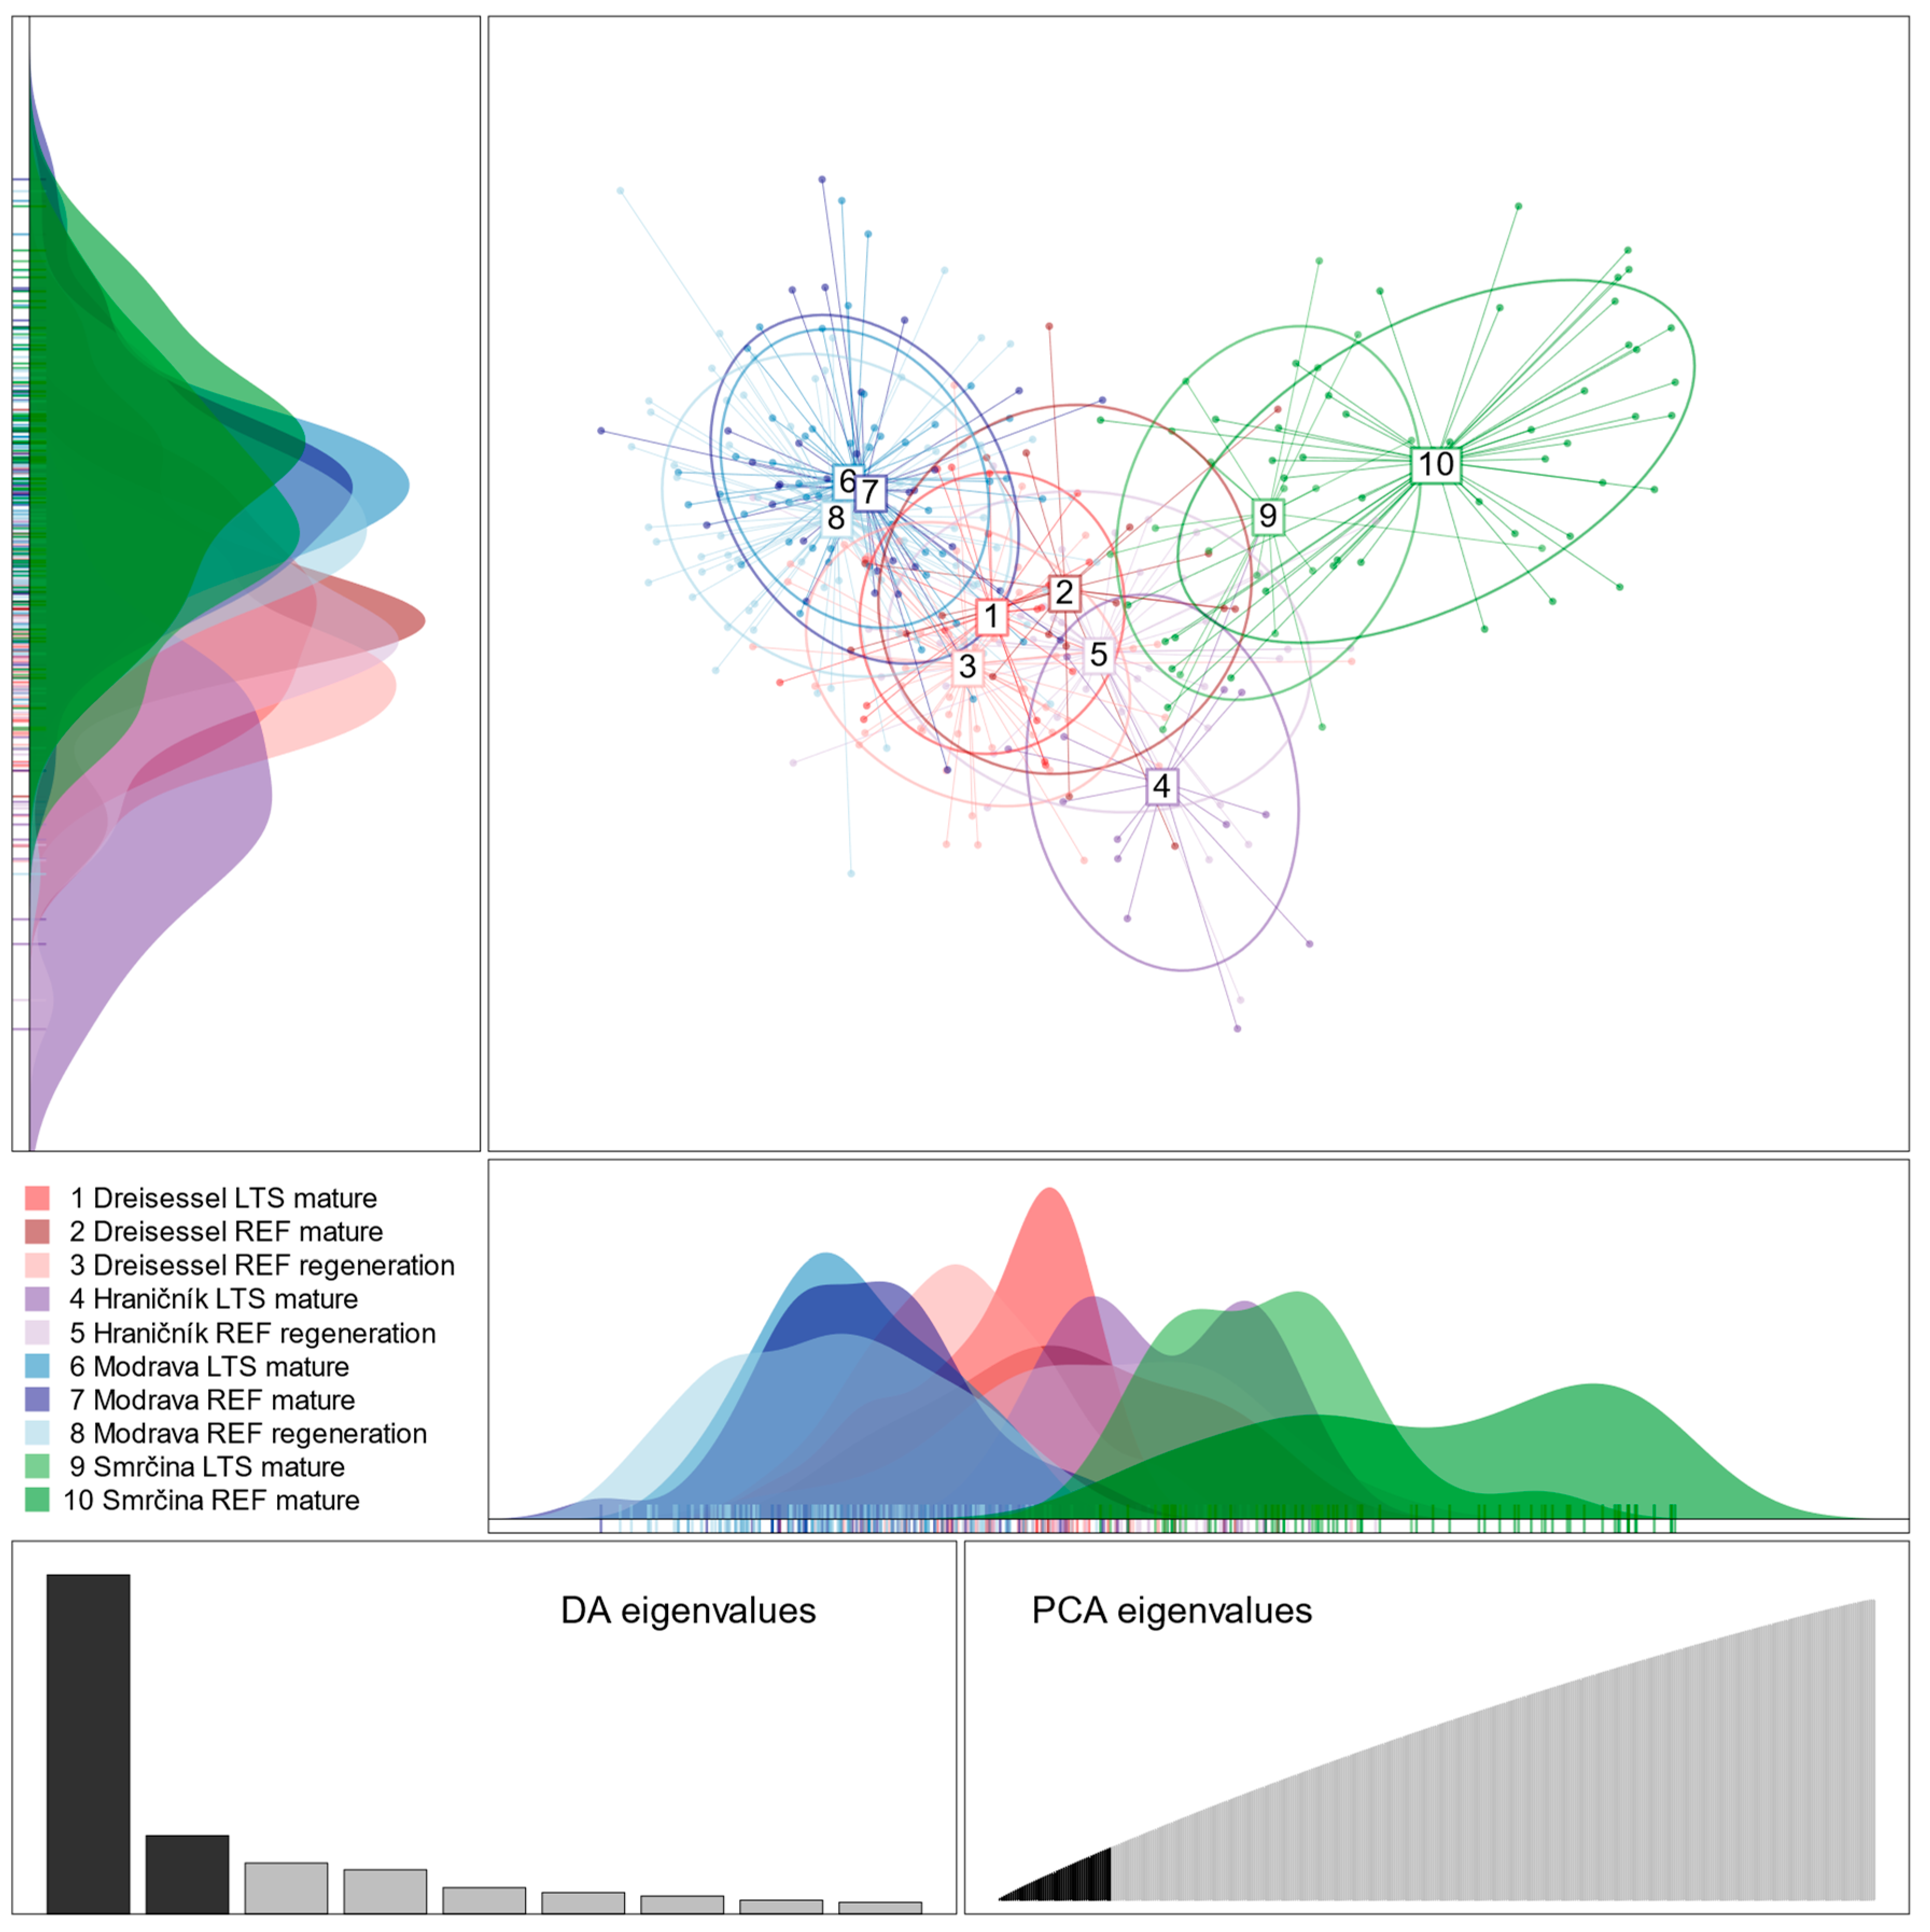
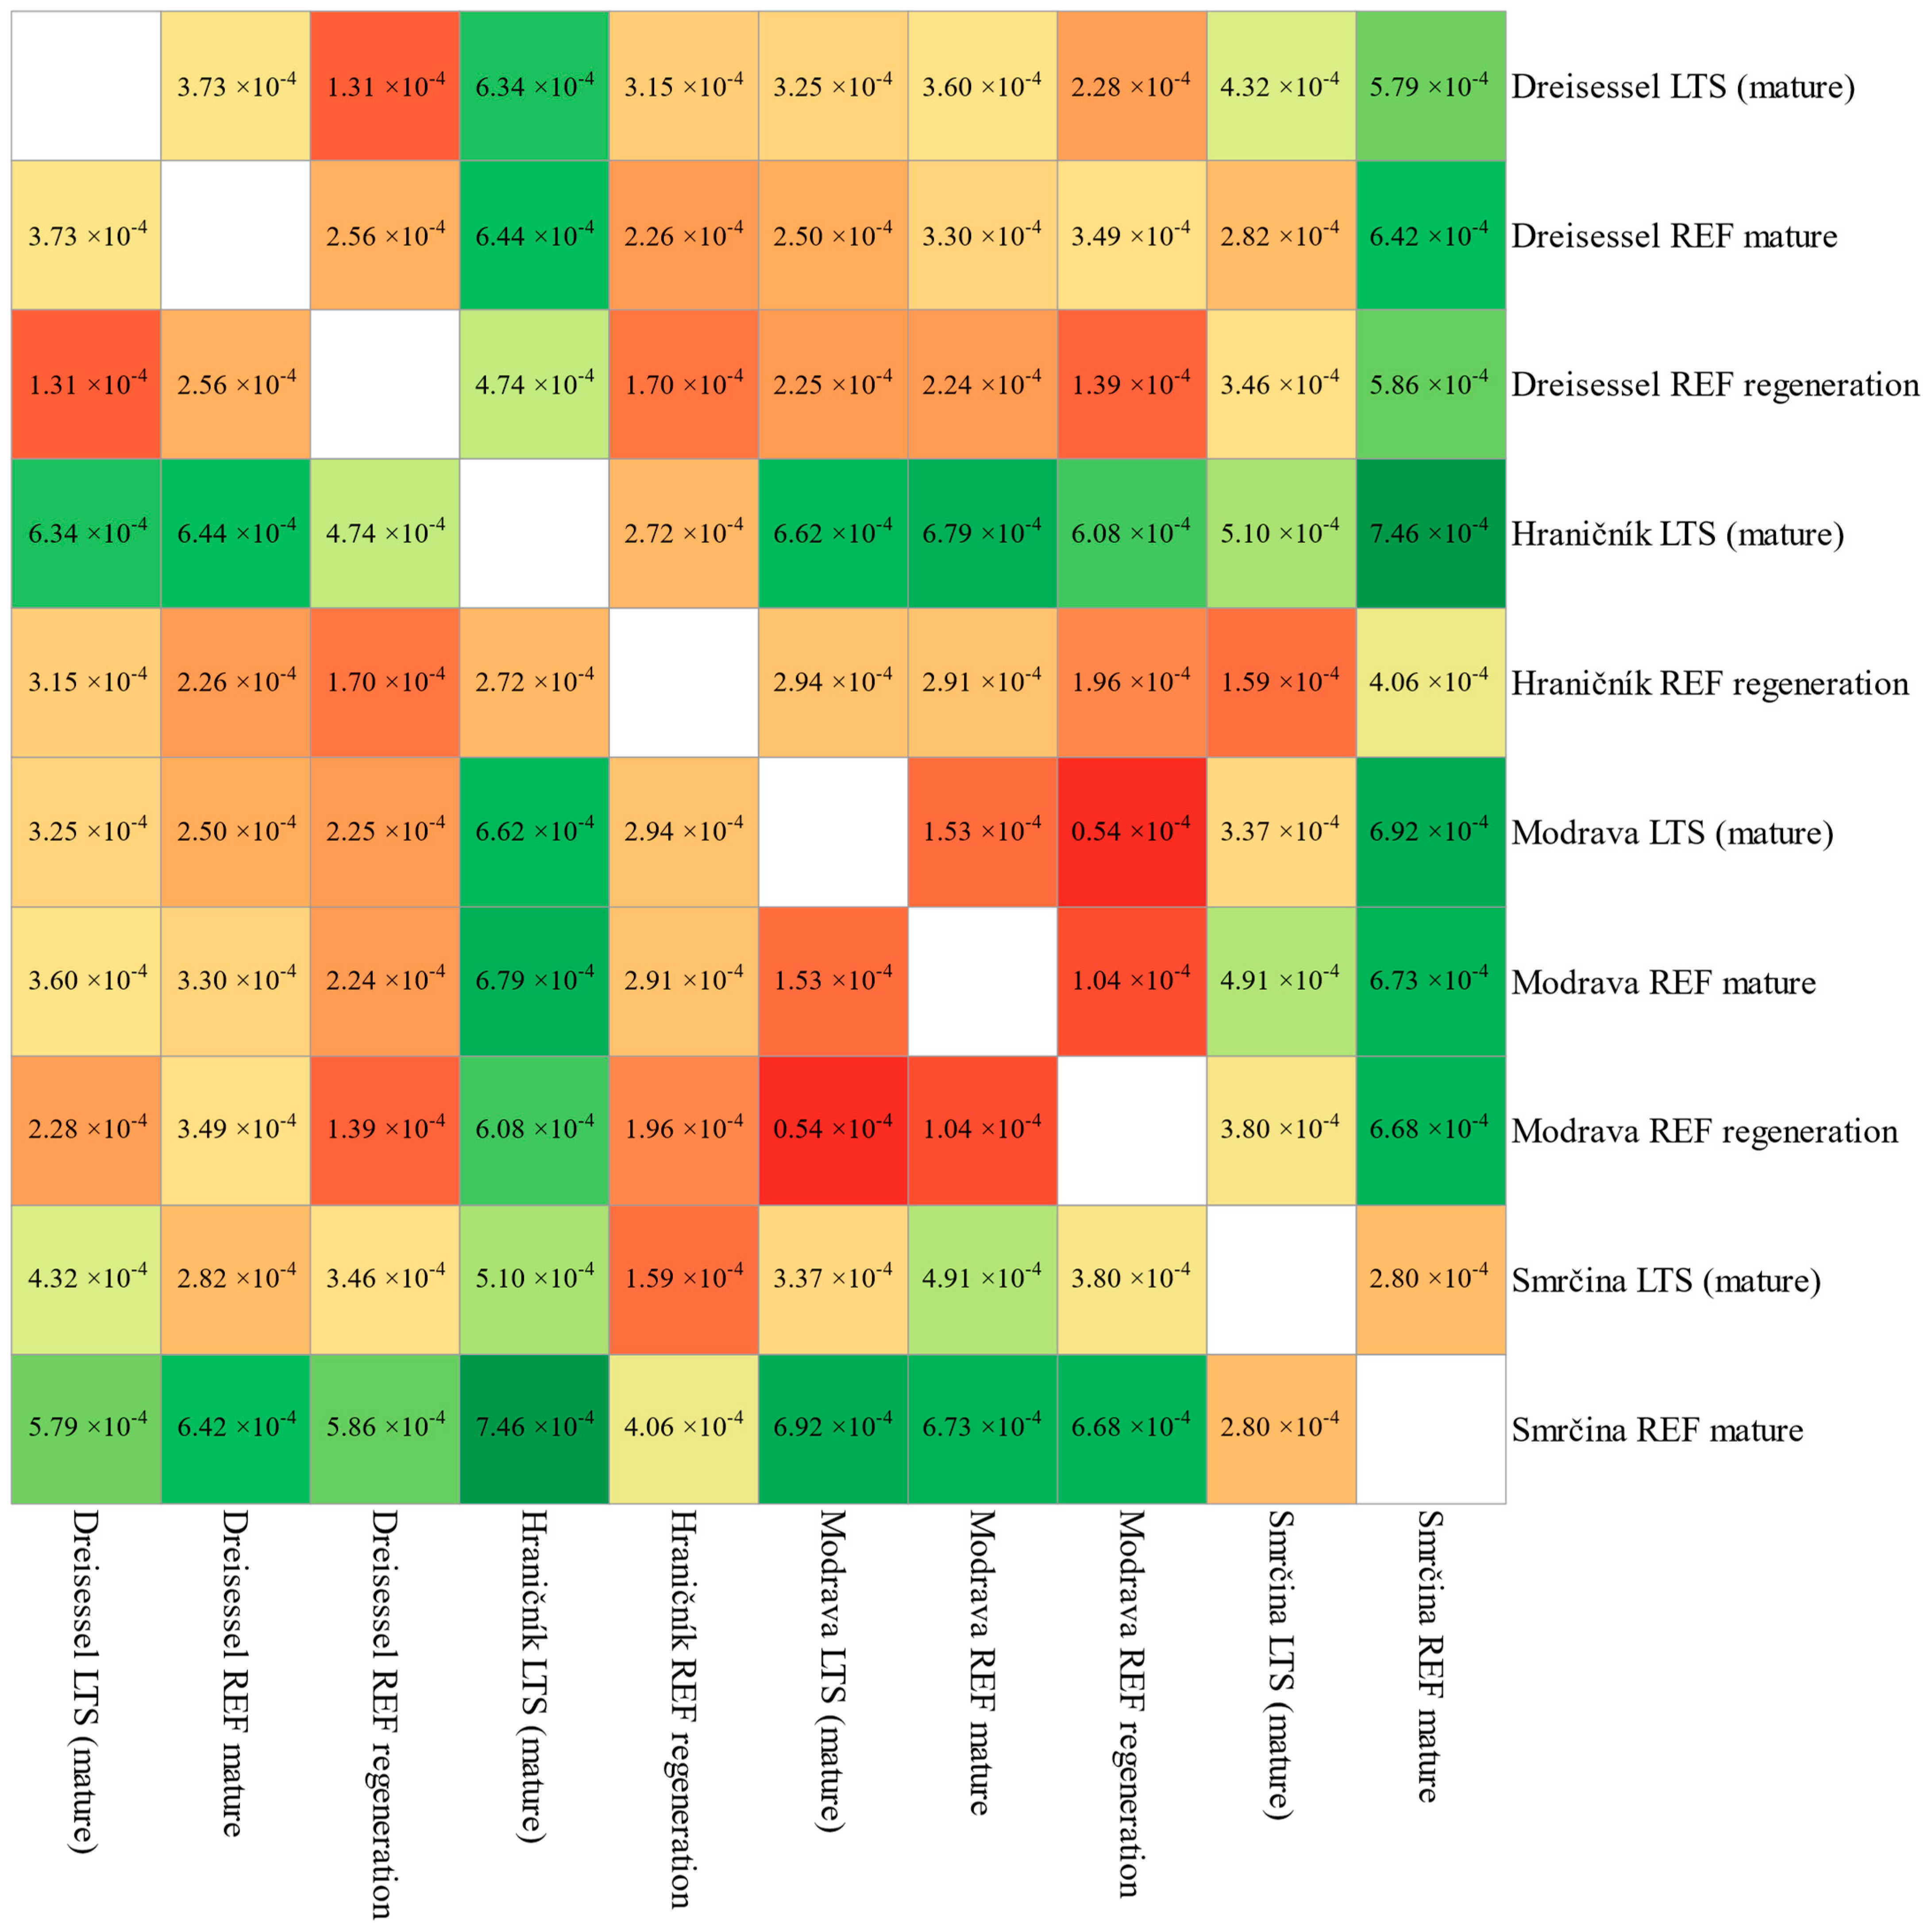
3.1. Population Structure

We inspected the population–genetic structure of all individuals subject to study via DAPC analysis (Figure 2). Subtle, yet significant differences in genetic composition were observed among all the study sites compared via Jost’s D (with a lower confidence interval value greater than zero). We did not observe any obvious pattern of geographically based differentiation among groups of reference trees, except for Smrčina (Table 2c, Supplementary Figure S1). The pattern is also visible on the DAPC chart where discriminant function 1 (dark purple) has a differentiation power to distinguish Smrčina reference trees from other groups (Figure 2). There is a noticeable differentiation between sites when comparing groups of LTS trees (Table 2b, Supplementary Figure S2), varying from 6.31 × 10⁻⁴ (Hraničník versus Dreisessel) to 3.25 × 10⁻⁴ (Modrava versus Dreisessel). The variation between LTS and reference trees on respective plots is low (Jost’s D varying between 6.4 × 10⁻⁵ and 2.8 × 10⁻⁴), indicating the genetic similarity of individuals sampled within the same area (Table 2a, Supplementary Figure S3).
The more structured differentiation of tree categories, after splitting reference trees based on their age (regeneration versus mature trees, Figure 3), elucidated that the lower level of Jost’s differentiation is identified mainly among the young grown stage (regeneration). Namely, between Dreissesel and Hraničník (1.7 × 10⁻⁴), Dreissesel and Modrava (1.39 × 10⁻⁴), and Hraničník and Modrava (1.96 × 10⁻⁴). In contrast, differentiation between groups of mature trees became more apparent.

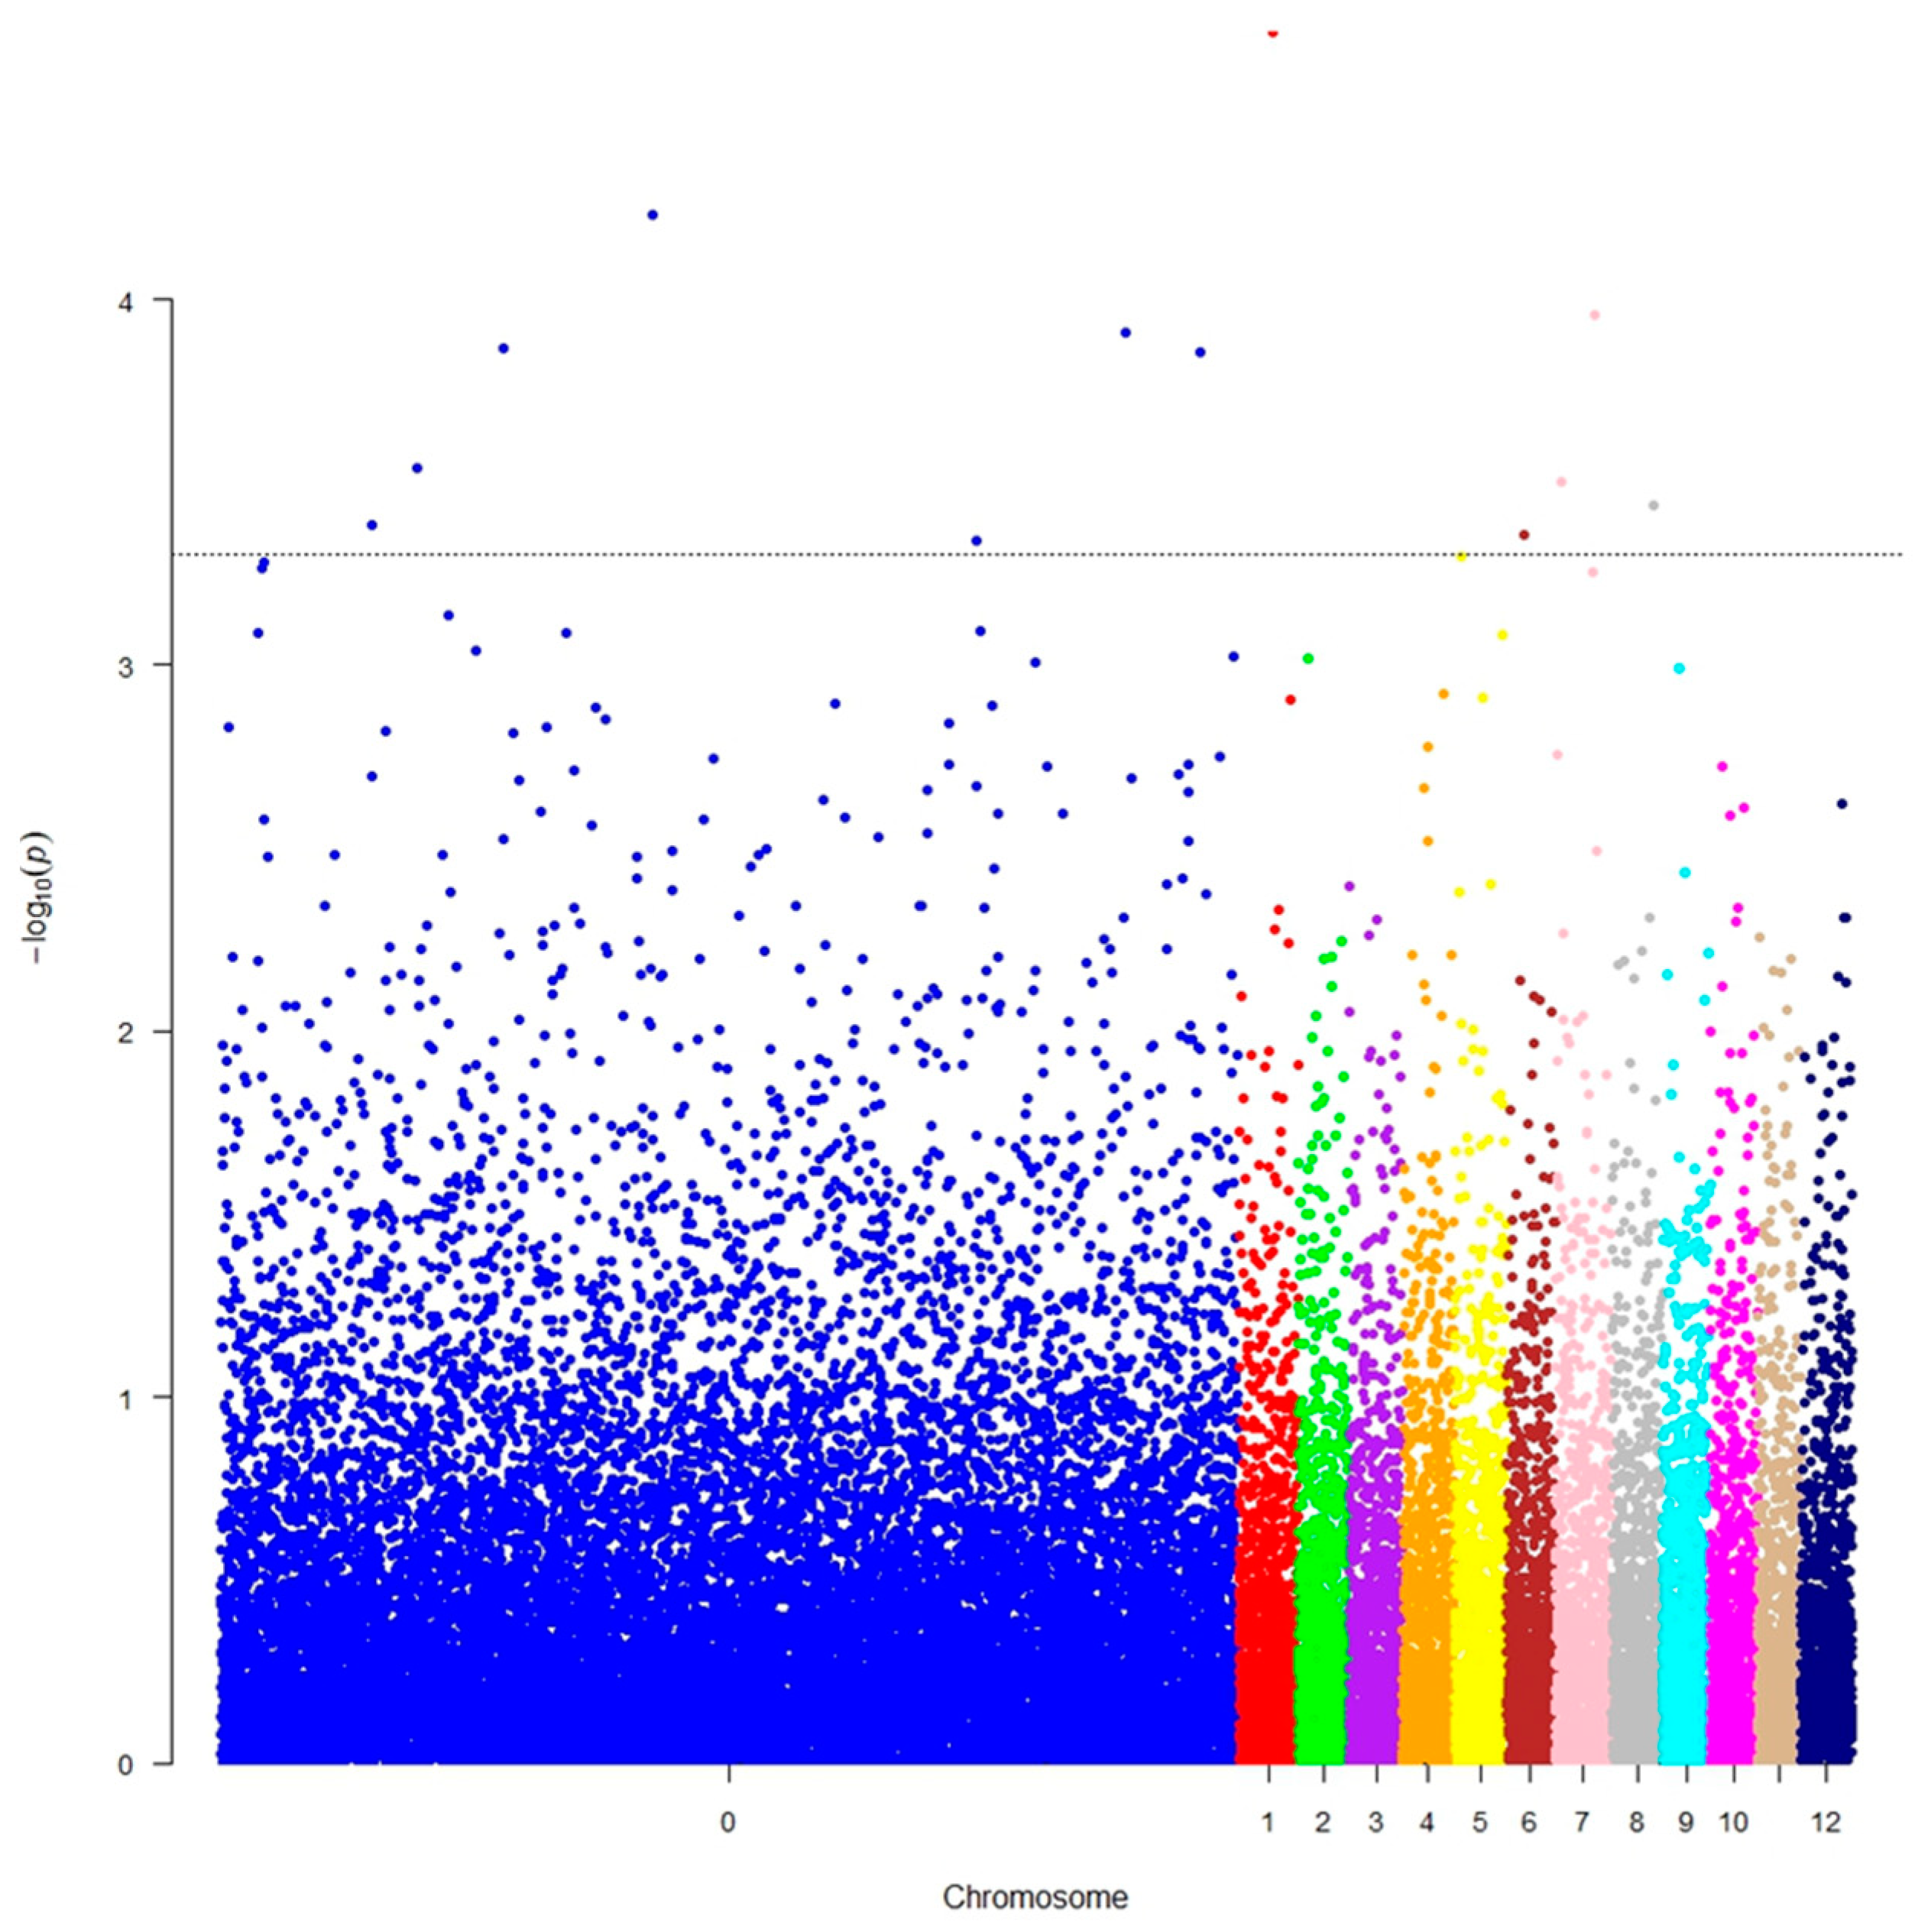
3.2. GWAS Analysis and Gene Identification

Based on GWAS analysis, we identified SNPs significantly associated with the targeted traits (Figure 4, Table 3), i.e., individual tree survival after terminated bark beetle outbreak on the stand.
Out of twelve significant SNPs (p-value < 5 × 10⁻⁴), we identified three with known functions of their gene orthologs in Arabidopsis thaliana, namely MA_35335g0010 (PAB00038352), MA_51088g0010 (PAB00045124), and MA_77097g0010 (PAB00054584). The best ortholog for the gene, MA_35335g0010, is the transcription regulation gene, AT5G13240 (Arabidopsis thaliana), influencing biological transcription regulation processes from RNA polymerase III promoter [51]. For the gene, MA_51088g0010 (PAB00045124), the best ortholog has not been identified, but there exists an orthologous gene family consisting of 84 genes found in 38 species belonging to Embryophyta [49]. The gene is involved in macromolecule biosynthetic processes and enables S-adenosylmethionine-dependent methyltransferase activity [52]. MA_77097g0010 (PAB00054584) and its best ortholog, AT3G06010 (A. thaliana), play a vital role in mediating the temporary growth interruption induced by stress perception [53]. We found no functional information reported in the literature on MA_17088g0010 (PAB00027290), an orphan gene specific to the Spermatophyta family.

4. Discussion

4.1. Population Genetic Structure

Analysis of the population genetic structure based both on DAPC and Jost’s D genetic distance methods showed a low yet significant level of differentiation among all compared subgroups (Table 2). The finding is consistent with numerous studies that reported low levels of genetic differentiation among Norway spruce subpopulations, including those based on microsatellite markers [54,55,56,57,58] and those taking advantage of SNP markers [36,59,60]. Generally, these trends in low levels of genetic differentiation are attributed to a species characteristic, such as intense gene flow [61,62]. The influence of human-facilitated regeneration [63] and an artificial species spreading outside the naturally grown area can also contribute to a substantial genetic similarity across subpopulations [64]. Over the past centuries, the Bohemian Forest region was subject to deforestation due to human activities, mainly between the second half of the 19th century and the beginning of the 1950s [41]. In the 20th century, historical logging rates were constrained and subsequently controlled through conservation efforts [65,66]. According to historical records [67], the area of Smrčina was identified as autochthonous spruce forest stands. This fact could explain the most distinct genetic differentiation of mature reference trees from the Smrčina area compared to other stands that might be affected by some level of human-facilitated regeneration. Subpopulations formed by juvenile individuals (Figure 3, REF regeneration groups) showed a lower degree of genetic differentiation among themselves (between 1.39 × 10⁻⁴ and 1.96 × 10⁻⁴). We presume that the diminished genetic differentiation is likely a result of a current elevated gene flow between subpopulations due to natural barrier removal (absence of dense tree canopies) following extensive deforestation after the bark beetle outbreak. Surprisingly, a low level of genetic similarity between LTS subgroups across the study sites has been detected. We hypothesized that the effect of significant SNPs is probably not strong enough to be manifested in the overall genetic makeup represented by Jost’s D coefficients and DAPC analysis.

4.2. GWAS Analysis and Gene Identification

In our genome-wide association analysis, we deliberately chose not to employ multiple comparison corrections, such as Bonferroni or False Discovery Rate Control. While these corrections are commonly applied, their indiscriminate use warrants consideration [68]. It is mainly due to the inherent trade-off between decreasing the probability of Type I errors and increasing that of Type II errors, potentially leading to the oversight of genuine differences [69,70]. Applying multiple-comparison correction lowers the threshold for claiming statistical significance, potentially overlooking subtle yet biologically significant connections. Moreover, Bonferroni correction treats each test as independent, which can further exacerbate the bias. However, we consider gene identification an initial selection, and we assert that the identified positive SNP signals should be further investigated and validated in subsequent studies.
The gene identified as MA_35335g0010 (PAB00038352) in Norway spruce has been found to be orthologous to the gene, AT5G13240 (Maf1), in Arabidopsis thaliana. Maf1 is a highly conserved transcription factor in yeasts, animals, and plants. Specifically, it influences the regulation of transcription initiated from RNA polymerase III promoters [51]. Thus, via orthology, it is inferred that the gene MA_35335g0010 in Norway spruce might have a similar regulatory role in transcription processes. Maf1 repressor activity is critical for plant survival during environmental stresses and is regulated by its phosphorylation/dephosphorylation through the activity of TOR and PP4/PP2A phosphatases [71]. Plants relieved of Maf1 might be more vulnerable to environmental challenges [72]. Although a significant increase in susceptibility to attacks by bacterial pathogens in sweet orange plants was found [73], enhanced vulnerability to biotic (Botrytis cinerea infection) and abiotic (drought and salinity) factors was not confirmed in A. thaliana.
We have identified the gene MA_51088g0010 as part of an orthologous gene family that significantly modulates methyltransferase activity. Despite the limited scope of the scientific literature specifically addressing trees, DNA methylation’s role has been recognized as crucial in plant stress responses, potentially impacting plant stress resilience [74,75]. Plants exhibit differential genome-wide or loci-specific DNA methylation patterns in response to adverse biotic [76,77,78,79] and abiotic conditions [80,81,82,83]. Methylation is involved in the selective activation of genes associated with defense reactions. In Arabidopsis, stress-induced epigenetic responses were shown to be heritable but disappearing in progeny during several generations without persisting external pressures [76,77,78].
In Arabidopsis thaliana, we identified AT3G06010 as the best ortholog of the Norway spruce gene, MA_77097g0010 (PAB00054584). There is strong evidence [53] that the action of this gene plays a vital role in mediating the growth response of plants in unfavorable environmental conditions, allowing flexible growth modulation in resource-limited environments. During drought or heat waves, the expression of this gene leads to growth interruption of normally active primary buds and suppression of stem growth. Growth inhibition facilitates survival, enabling plants to mobilize accumulated energy pools and reallocate scarce incoming resources from primary to secondary physiological processes to counteract stress [79].
Previous studies have shown that pine and spruce tree resistance to bark beetles is related to the periodic fluctuations in radial growth rates [22]. The existing evidence on growth rates preceding bark-beetle-induced tree mortality is controversial, with studies reporting faster [80,81], slower [6,38,39], or both faster and slower [82,83,84] growth rates in surviving coniferous trees. We argue that the divergence in the results found in the literature is attributable to the variation in climatic and local stand and environmental conditions, as well as to tree-level parameters, e.g., the age and size, of the studied individuals. The differentiation in growth rates before bark beetle disturbance agrees with the plant vigor hypothesis [85,86,87] in the bark beetle preference for slower-growing trees. The plant vigor/plant stress hypothesis contends that physiologically stressed, slower-growing plants are more susceptible to pathogens and pest insects. Concurrently, the evidence for the survival of slower-growing trees is supported by the life history trade-offs hypothesis [88], postulating that plants can reallocate available limited resources from primary to secondary metabolic functions during their lifespans to tolerate the effects of various biotic and abiotic stress agents. Quick development to reach the upper canopy is crucial during vulnerable early stages, reducing exposure to risks and aiding in monopolizing limited resources [89]. However, rapid growth might compromise defense against herbivores [88], potentially altering selection trends over time [90]. Despite the controversies in the evidence and the respective theoretical underpinnings, the association between tree growth rates, defense capacity, and bark beetle host selection choices seems to exist. Further investigation is required to provide insights into the genetic factors influencing the mechanisms of spruce resistance to bark beetles.

4.3. Tree Survival—Last Trees Standing

The presence of surviving trees, classified as Last Trees Standing (LTS) can be attributed to various factors, encompassing both chance occurrences and distinct influences of local environments. Random persistence through stochastic processes, such as evading insect attacks based on fluctuating beetle population levels, may account for some survival instances [39]. However, for Norway spruce in identical areas to that of our study, it has been shown that tree survival is a non-random process governed by multiple internal and external factors and their complex interactions [25]. External factors, such as environmental conditions (temperature, water availability, sun exposure, etc.) and stand characteristics (stand density and structure, proximity to a previous bark beetle attack, etc.), were reported to be associated with tree survival [26,91,92]. The effects of external premises can be modified through their interactions with internal factors playing a crucial role in tree survival. Trees possess induced chemical defenses, such as enhanced synthesis of phenolic and terpene compounds in response to bark beetle boring attempts, wounding, Methyl jasmonate or fungal inoculations [17,19,27,93,94], that may be under genetic control [15,19]. Several studies have claimed that conifer resistance to bark beetles is genetically determined, as certain trees exhibit enhanced survivorship due to their unique genetic makeup [24,38,39]. Apart from the influence of the factors mentioned above, identifying SNPs with a lower degree of ambiguity may be a consequence of the genetic architecture of the trait of interest, particularly its polymorphic nature, where only a few genes with an effect on tree survival were identified.

5. Conclusions

Our research utilizing Genome-Wide Association Studies (GWAS) has identified several SNPs potentially related to the Norway spruce resistance to bark beetle infestation. These SNPs should remain at the forefront of interest, and if verified in other LTS studies in different geographical areas, they can potentially serve as markers for bark beetle resistance. Their assessment can be applied in breeding programs (selective breeding of individuals of a higher resistance), forest management (identifying areas with a higher likelihood of bark beetle infestations), and monitoring (screening of individual trees for bark beetle susceptibility). Additionally, these genetic markers may have implications for conserving genetic diversity in Norway spruce populations and their adaptation to changing environmental conditions.
Identifying these SNPs in orthologous genes between Norway spruce and Arabidopsis suggests a potential similarity in their regulatory roles in transcription processes. Overall, these findings have pointed out the intricate regulatory mechanisms that might be connected to self-defense against bark beetle attacks. Namely, the Arabidopsis ortholog of the gene, MA_77097g0010, plays a vital role in mediating the growth response of plants in unfavorable environmental conditions and thus implies its biological importance in bark beetle resistance. Nevertheless, the research question remains complex and warrants further exploration. It is plausible that specific volatile organic compounds (VOCs), including terpenes and phenolics, serve as important determinants of individual resistance. Factors such as tree stand composition, sunlight exposure, climatic conditions, topography, and intricate interactions within the forest ecosystem influence this dynamic. It is essential to emphasize that the applied genotyping platform does not allow the detection of epigenetic variance that may significantly impact the identified markers. Future advancements in genome sequencing will promote assessments of DNA methylation status, and epigenotyping will become an effective decision-making tool in forest breeding programs. Thus, while our current research has contributed to revealing the genetic basis of bark beetle resistance and elucidated the population-genetic structure of targeted forest stands, it represents just a fragment of the complex and intricate puzzle.

Supplementary Materials

The following supporting information can be downloaded at: https://www.mdpi.com/article/10.3390/f14102074/s1, Figure S1: Jost’s D genetic distance among reference populations. Figure S2: Jost’s D genetic distance among LTS populations. Figure S3: Jost’s D genetic distance between LTS and reference trees.

Author Contributions

Conceptualization, J.K., J.S., N.K. and R.J.; methodology, R.J., N.K. and J.K.; formal analysis, J.Č. and J.K.; investigation, J.K. and N.K.; data curation, J.K. and J.Č.; writing—original draft preparation, J.K.; writing—review and editing, J.Č., J.S., R.J. and N.K.; visualization, J.Č.; supervision, M.T.; project administration, M.T. and R.J.; funding acquisition, M.T. All authors have read and agreed to the published version of the manuscript.

Funding

This research was funded by the National Agency of Agriculture Research, Czech Republic (NAZV), grant No. QK1910480; grant No. CZ.02.1.01/0.0/0.0/15_003/0000433, “EXTEMIT—K project,” financed by OP RDE; grants No. A_19_06 and A_21_09 funded by the Internal Grant Agency FFWS CULS in Prague.

Data Availability Statement

The data presented in this study are openly available in the repository, FigShare, at doi:10.6084/m9.figshare.23899770.

Conflicts of Interest

The authors declare no conflict of interest.

References

  1. Wermelinger, B. Ecology and Management of the Spruce Bark Beetle Ips Typographus—A Review of Recent Research. For. Ecol. Manag. 2004, 202, 67–82. [Google Scholar] [CrossRef]
  2. Vega, F.E.; Hofstetter, R.W. Bark Beetles: Biology and Ecology of Native and Invasive Species; Academic Press: Cambridge, MA, USA, 2014. [Google Scholar]
  3. Ranger, C.M. Bark Beetles: Biology and Ecology of Native and Invasive Species. Am. Entomol. 2016, 62, 196–198. [Google Scholar] [CrossRef]
  4. Stauffer, C.; Lakatos, F.; Hewitt, G.M. Phylogeography and Postglacial Colonization Routes of Ips Typographus L. (Coleoptera, Scolytidae). Mol. Ecol. 1999, 8, 763–773. [Google Scholar] [CrossRef]
  5. Nardi, D.; Jactel, H.; Pagot, E.; Samalens, J.; Marini, L. Drought and Stand Susceptibility to Attacks by the European Spruce Bark Beetle: A Remote Sensing Approach. Agric. For. Entomol. 2023, 25, 119–129. [Google Scholar] [CrossRef]
  6. Cooper, L.A.; Reed, C.C.; Ballantyne, A.P. Mountain Pine Beetle Attack Faster Growing Lodgepole Pine at Low Elevations in Western Montana, USA. For. Ecol. Manag. 2018, 427, 200–207. [Google Scholar] [CrossRef]
  7. Seidl, R.; Schelhaas, M.-J.; Rammer, W.; Verkerk, P.J. Increasing Forest Disturbances in Europe and Their Impact on Carbon Storage. Nat. Clim. Change 2014, 4, 806–810. [Google Scholar] [CrossRef]
  8. Långström, B.; Lindelöw, Å.; Schroeder, M.; Björklund, N.; Öhrn, P. The Spruce Bark Beetle Outbreak in Sweden Following the January-Storms in 2005 and 2007. 2009. Available online: https://pub.epsilon.slu.se/5076/1/langstrom_b_etal_100823.pdf (accessed on 10 April 2023).
  9. Nohrstedt, D.; Parker, C. The Public Policy Dimension of Resilience in Natural Disaster Management: Sweden’s Gudrun and Per Storms. In Disaster and Development. Environmental Hazards; Springer: Cham, Switzerland, 2014; pp. 235–253. [Google Scholar]
  10. Toth, D.; Maitah, M.; Maitah, K.; Jarolínová, V. The Impacts of Calamity Logging on the Development of Spruce Wood Prices in Czech Forestry. Forests 2020, 11, 283. [Google Scholar] [CrossRef]
  11. Raffa, K.F.; Aukema, B.H.; Bentz, B.J.; Carroll, A.L.; Hicke, J.A.; Turner, M.G.; Romme, W.H. Cross-Scale Drivers of Natural Disturbances Prone to Anthropogenic Amplification: The Dynamics of Bark Beetle Eruptions. BioScience 2008, 58, 501–517. [Google Scholar] [CrossRef]
  12. Hlásny, T.; König, L.; Krokene, P.; Lindner, M.; Montagné-Huck, C.; Müller, J.; Qin, H.; Raffa, K.F.; Schelhaas, M.-J.; Svoboda, M.; et al. Bark Beetle Outbreaks in Europe: State of Knowledge and Ways Forward for Management. Curr. For. Rep. 2021, 7, 138–165. [Google Scholar] [CrossRef]
  13. Weed, A.S.; Ayres, M.P.; Bentz, B.J. Chapter 4—Population Dynamics of Bark Beetles. In Bark Beetles; Vega, F.E., Hofstetter, R.W., Eds.; Academic Press: San Diego, CA, USA, 2015; pp. 157–176. ISBN 978-0-12-417156-5. [Google Scholar]
  14. Biedermann, P.H.W.; Müller, J.; Grégoire, J.-C.; Gruppe, A.; Hagge, J.; Hammerbacher, A.; Hofstetter, R.W.; Kandasamy, D.; Kolarik, M.; Kostovcik, M.; et al. Bark Beetle Population Dynamics in the Anthropocene: Challenges and Solutions. Trends Ecol. Evol. 2019, 34, 914–924. [Google Scholar] [CrossRef]
  15. Schiebe, C.; Hammerbacher, A.; Birgersson, G.; Witzell, J.; Brodelius, P.E.; Gershenzon, J.; Hansson, B.S.; Krokene, P.; Schlyter, F. Inducibility of Chemical Defenses in Norway Spruce Bark Is Correlated with Unsuccessful Mass Attacks by the Spruce Bark Beetle. Oecologia 2012, 170, 183–198. [Google Scholar] [CrossRef] [PubMed]
  16. Brignolas, F.; Lacroix, B.; Lieutier, F.; Sauvard, D.; Drouet, A.; Claudot, A.C.; Yart, A.; Berryman, A.A.; Christiansen, E. Induced Responses in Phenolic Metabolism in Two Norway Spruce Clones after Wounding and Inoculations with Ophiostoma Polonicum, a Bark Beetle-Associated Fungus. Plant Physiol. 1995, 109, 821–827. [Google Scholar] [CrossRef] [PubMed]
  17. Brignolas, F.; Lieutier, F.; Sauvard, D.; Christiansen, E.; Berryman, A.A. Phenolic Predictors for Norway Spruce Resistance to the Bark Beetle Ips Typographus (Coleoptera: Scolytidae) and an Associated Fungus, Ceratocystis Polonica. Can. J. For. Res. 1998, 28, 720–728. [Google Scholar] [CrossRef]
  18. Lieutier, F.; Brignolas, F.; Sauvard, D.; Yart, A.; Galet, C.; Brunet, M.; van de Sype, H. Intra- and Inter-Provenance Variability in Phloem Phenols of Picea Abies and Relationship to a Bark Beetle-Associated Fungus. Tree Physiol. 2003, 23, 247–256. [Google Scholar] [CrossRef]
  19. Korolyova, N.; Buechling, A.; Lieutier, F.; Yart, A.; Cudlín, P.; Turčáni, M.; Jakuš, R. Primary and Secondary Host Selection by Ips Typographus Depends on Norway Spruce Crown Characteristics and Phenolic-Based Defenses. Plant Sci. 2022, 321, 111319. [Google Scholar] [CrossRef]
  20. Faccoli, M.; Schlyter, F. Conifer Phenolic Resistance Markers Are Bark Beetle Antifeedant Semiochemicals. Agric. For. Entomol. 2007, 9, 237–245. [Google Scholar] [CrossRef]
  21. Franceschi, V.R.; Krokene, P.; Christiansen, E.; Krekling, T. Anatomical and Chemical Defenses of Conifer Bark against Bark Beetles and Other Pests. New Phytol. 2005, 167, 353–376. [Google Scholar] [CrossRef]
  22. Christiansen, E.; Waring, R.H.; Berryman, A.A. Resistance of Conifers to Bark Beetle Attack: Searching for General Relationships. For. Ecol. Manag. 1987, 22, 89–106. [Google Scholar] [CrossRef]
  23. Hawkins, C.D.B.; Dhar, A.; Balliet, N.A.; Runzer, K.D. Residual Mature Trees and Secondary Stand Structure after Mountain Pine Beetle Attack in Central British Columbia. For. Ecol. Manag. 2012, 277, 107–115. [Google Scholar] [CrossRef]
  24. Six, D.L.; Vergobbi, C.; Cutter, M. Are Survivors Different? Genetic-Based Selection of Trees by Mountain Pine Beetle During a Climate Change-Driven Outbreak in a High-Elevation Pine Forest. Front. Plant Sci. 2018, 9, 993. [Google Scholar] [CrossRef]
  25. Korolyova, N.; Buechling, A.; Ďuračiová, R.; Zabihi, K.; Turčáni, M.; Svoboda, M.; Bláha, J.; Swarts, K.; Poláček, M.; Hradecký, J.; et al. The Last Trees Standing: Climate Modulates Tree Survival Factors during a Prolonged Bark Beetle Outbreak in Europe. Agric. For. Meteorol. 2022, 322, 109025. [Google Scholar] [CrossRef]
  26. Jakuš, R.; Edwards-Jonášová, M.; Cudlín, P.; Blaženec, M.; Ježík, M.; Havlíček, F.; Moravec, I. Characteristics of Norway Spruce Trees (Picea Abies) Surviving a Spruce Bark Beetle (Ips Typographus L.) Outbreak. Trees 2011, 25, 965–973. [Google Scholar] [CrossRef]
  27. Erbilgin, N.; Cale, J.A.; Hussain, A.; Ishangulyyeva, G.; Klutsch, J.G.; Najar, A.; Zhao, S. Weathering the Storm: How Lodgepole Pine Trees Survive Mountain Pine Beetle Outbreaks. Oecologia 2017, 184, 469–478. [Google Scholar] [CrossRef] [PubMed]
  28. Elshire, R.J.; Glaubitz, J.C.; Sun, Q.; Poland, J.A.; Kawamoto, K.; Buckler, E.S.; Mitchell, S.E. A Robust, Simple Genotyping-by-Sequencing (GBS) Approach for High Diversity Species. PLoS ONE 2011, 6, e19379. [Google Scholar] [CrossRef] [PubMed]
  29. Azaiez, A.; Pavy, N.; Gérardi, S.; Laroche, J.; Boyle, B.; Gagnon, F.; Mottet, M.-J.; Beaulieu, J.; Bousquet, J. A Catalog of Annotated High-Confidence SNPs from Exome Capture and Sequencing Reveals Highly Polymorphic Genes in Norway Spruce (Picea Abies). BMC Genom. 2018, 19, 942. [Google Scholar] [CrossRef]
  30. Bernhardsson, C.; Zan, Y.; Chen, Z.; Ingvarsson, P.K.; Wu, H.X. Development of a Highly Efficient 50K Single Nucleotide Polymorphism Genotyping Array for the Large and Complex Genome of Norway Spruce (Picea Abies L. Karst) by Whole Genome Resequencing and Its Transferability to Other Spruce Species. Mol. Ecol. Resour. 2021, 21, 880–896. [Google Scholar] [CrossRef]
  31. Nystedt, B.; Street, N.R.; Wetterbom, A.; Zuccolo, A.; Lin, Y.-C.; Scofield, D.G.; Vezzi, F.; Delhomme, N.; Giacomello, S.; Alexeyenko, A.; et al. The Norway Spruce Genome Sequence and Conifer Genome Evolution. Nature 2013, 497, 579–584. [Google Scholar] [CrossRef]
  32. Trujillo-Moya, C.; George, J.-P.; Fluch, S.; Geburek, T.; Grabner, M.; Karanitsch-Ackerl, S.; Konrad, H.; Mayer, K.; Sehr, E.M.; Wischnitzki, E.; et al. Drought Sensitivity of Norway Spruce at the Species’ Warmest Fringe: Quantitative and Molecular Analysis Reveals High Genetic Variation Among and Within Provenances. G3 Genes Genomes Genetics 2018, 8, 1225–1245. [Google Scholar] [CrossRef]
  33. Čepl, J.; Stejskal, J.; Korecký, J.; Hejtmánek, J.; Faltinová, Z.; Lstibůrek, M.; Gezan, S. The Dehydrins Gene Expression Differs across Ecotypes in Norway Spruce and Relates to Weather Fluctuations. Sci. Rep. 2020, 10, 20789. [Google Scholar] [CrossRef]
  34. Baison, J.; Vidalis, A.; Zhou, L.; Chen, Z.; Li, Z.; Sillanpää, M.J.; Bernhardsson, C.; Scofield, D.; Forsberg, N.; Grahn, T.; et al. Genome-wide Association Study Identified Novel Candidate Loci Affecting Wood Formation in Norway Spruce. Plant J. 2019, 100, 83–100. [Google Scholar] [CrossRef]
  35. Hrivnák, M.; Krajmerová, D.; Kurjak, D.; Konôpková, A.; Magni, F.; Scaglione, D.; Ditmarová, L.; Jamnická, G.; Marešová, J.; Gömöry, D. Differential Associations between Nucleotide Polymorphisms and Physiological Traits in Norway Spruce (Picea Abies Karst.) Plants under Contrasting Water Regimes. Forestry 2022, 95, 686–697. [Google Scholar] [CrossRef]
  36. Korecký, J.; Čepl, J.; Stejskal, J.; Faltinová, Z.; Dvořák, J.; Lstibůrek, M.; El-Kassaby, Y.A. Genetic Diversity of Norway Spruce Ecotypes Assessed by GBS-Derived SNPs. Sci. Rep. 2021, 11, 23119. [Google Scholar] [CrossRef]
  37. Chen, Z.-Q.; Zan, Y.; Milesi, P.; Zhou, L.; Chen, J.; Li, L.; Cui, B.; Niu, S.; Westin, J.; Karlsson, B.; et al. Leveraging Breeding Programs and Genomic Data in Norway Spruce (Picea abies L. Karst) for GWAS Analysis. Genome Biol. 2021, 22, 179. [Google Scholar] [CrossRef]
  38. Yanchuk, A.D.; Murphy, J.C.; Wallin, K.F. Evaluation of Genetic Variation of Attack and Resistance in Lodgepole Pine in the Early Stages of a Mountain Pine Beetle Outbreak. Tree Genet. Genomes 2008, 4, 171–180. [Google Scholar] [CrossRef]
  39. de la Mata, R.; Hood, S.; Sala, A. Insect Outbreak Shifts the Direction of Selection from Fast to Slow Growth Rates in the Long-Lived Conifer Pinus ponderosa. Proc. Natl. Acad. Sci. USA 2017, 114, 7391–7396. [Google Scholar] [CrossRef]
  40. Svoboda, M.; Janda, P.; Nagel, T.A.; Fraver, S.; Rejzek, J.; Bače, R. Disturbance History of an Old-Growth Sub-Alpine Picea Abies Stand in the Bohemian Forest, Czech Republic. J. Veg. Sci. 2012, 23, 86–97. [Google Scholar] [CrossRef]
  41. Křenová, Z.; Vrba, J. Just How Many Obstacles Are There to Creating a National Park? A Case Study from the Šumava National Park. Eur. J. Environ. Sci. 2014, 4. [Google Scholar] [CrossRef]
  42. Lausch, A.; Heurich, M.; Fahse, L. Spatio-Temporal Infestation Patterns of Ips typographus (L.) in the Bavarian Forest National Park, Germany. Ecol. Indic. 2013, 31, 73–81. [Google Scholar] [CrossRef]
  43. Massicotte, P.; South, A.; Hufkens, K. Rnaturalearth: World Map Data from Natural Earth 2023. Available online: https://github.com/ropensci/rnaturalearth (accessed on 30 April 2023).
  44. Wickham, H. Ggplot2. Wiley Interdiscip. Rev. Comput. Stat. 2011, 3, 180–185. [Google Scholar] [CrossRef]
  45. VanRaden, P.M. Efficient Methods to Compute Genomic Predictions. J. Dairy Sci. 2008, 91, 4414–4423. [Google Scholar] [CrossRef]
  46. Jombart, T.; Ahmed, I. Adegenet 1.3-1: New Tools for the Analysis of Genome-Wide SNP Data. Bioinformatics 2011, 27, 3070–3071. [Google Scholar] [CrossRef] [PubMed]
  47. Winter, D.J. Mmod: An R Library for the Calculation of Population Differentiation Statistics. Mol. Ecol. Resour. 2012, 12, 1158–1160. [Google Scholar] [CrossRef] [PubMed]
  48. Sundell, D.; Mannapperuma, C.; Netotea, S.; Delhomme, N.; Lin, Y.-C.; Sjödin, A.; Van de Peer, Y.; Jansson, S.; Hvidsten, T.R.; Street, N.R. The Plant Genome Integrative Explorer Resource: PlantGenIE. Org. New Phytol. 2015, 208, 1149–1156. [Google Scholar] [CrossRef] [PubMed]
  49. Van Bel, M.; Silvestri, F.; Weitz, E.M.; Kreft, L.; Botzki, A.; Coppens, F.; Vandepoele, K. PLAZA 5.0: Extending the Scope and Power of Comparative and Functional Genomics in Plants. Nucleic Acids Res. 2022, 50, D1468–D1474. [Google Scholar] [CrossRef] [PubMed]
  50. Meinke, D.W.; Cherry, J.M.; Dean, C.; Rounsley, S.D.; Koornneef, M. Arabidopsis Thaliana: A Model Plant for Genome Analysis. Science 1998, 282, 662–682. [Google Scholar] [CrossRef]
  51. Cieśla, M.; Boguta, M. Regulation of RNA Polymerase III Transcription by Maf1 Protein. Acta Biochim. Pol. 2008, 55, 215–225. [Google Scholar] [CrossRef]
  52. Heard, W.; Sklenář, J.; Tomé, D.F.A.; Robatzek, S.; Jones, A.M.E. Identification of Regulatory and Cargo Proteins of Endosomal and Secretory Pathways in Arabidopsis Thaliana by Proteomic Dissection *[S]. Mol. Cell. Proteomics 2015, 14, 1796–1813. [Google Scholar] [CrossRef]
  53. Mlynárová, L.; Nap, J.-P.; Bisseling, T. The SWI/SNF Chromatin-Remodeling Gene AtCHR12 Mediates Temporary Growth Arrest in Arabidopsis Thaliana upon Perceiving Environmental Stress: Chromatin Remodeling in Growth Response to Stress. Plant J. 2007, 51, 874–885. [Google Scholar] [CrossRef]
  54. Maghuly, F.; Pinsker, W.; Praznik, W.; Fluch, S. Genetic Diversity in Managed Subpopulations of Norway Spruce [Picea abies (L.) Karst.]. For. Ecol. Manag. 2006, 222, 266–271. [Google Scholar] [CrossRef]
  55. Meloni, M.; Perini, D.; Binelli, G. The Distribution of Genetic Variation in Norway Spruce (Picea Abies Karst.) Populations in the Western Alps. J. Biogeogr. 2007, 34, 929–938. [Google Scholar] [CrossRef]
  56. Tollefsrud, M.M.; Sønstebø, J.H.; Brochmann, C.; Johnsen, Ø.; Skrøppa, T.; Vendramin, G.G. Combined Analysis of Nuclear and Mitochondrial Markers Provide New Insight into the Genetic Structure of North European Picea Abies. Heredity 2009, 102, 549–562. [Google Scholar] [CrossRef] [PubMed]
  57. Stojnić, S.; Avramidou, E.V.; Fussi, B.; Westergren, M.; Orlović, S.; Matović, B.; Trudić, B.; Kraigher, H.; Aravanopoulos, F.A.; Konnert, M. Assessment of Genetic Diversity and Population Genetic Structure of Norway Spruce (Picea abies (L.) Karsten) at Its Southern Lineage in Europe. Implications for Conservation of Forest Genetic Resources. Forests 2019, 10, 258. [Google Scholar] [CrossRef]
  58. Binova, Z.; Korecky, J.; Dvorak, J.; Bily, J.; Zadrapova, D.; Jansa, V.; Lstiburek, M. Genetic Structure of Norway Spruce Ecotypes Studied by SSR Markers. Forests 2020, 11, 110. [Google Scholar] [CrossRef]
  59. Chen, J.; Källman, T.; Ma, X.; Gyllenstrand, N.; Zaina, G.; Morgante, M.; Bousquet, J.; Eckert, A.; Wegrzyn, J.; Neale, D. Disentangling the Roles of History and Local Selection in Shaping Clinal Variation of Allele Frequencies and Gene Expression in Norway Spruce (Picea Abies). Genetics 2012, 191, 865–881. [Google Scholar] [CrossRef] [PubMed]
  60. Wang, X.; Bernhardsson, C.; Ingvarsson, P.K. Demography and Natural Selection Have Shaped Genetic Variation in the Widely Distributed Conifer Norway Spruce (Picea abies). Genome Biol. Evol. 2020, 12, 3803–3817. [Google Scholar] [CrossRef] [PubMed]
  61. Di-Giovanni, F.; Kevan, P.G.; Arnold, J. Lower Planetary Boundary Layer Profiles of Atmospheric Conifer Pollen above a Seed Orchard in Northern Ontario, Canada. For. Ecol. Manag. 1996, 83, 87–97. [Google Scholar] [CrossRef]
  62. Burczyk, J.; Lewandowski, A.; Chalupka, W. Local Pollen Dispersal and Distant Gene Flow in Norway Spruce (Picea abies [L.] Karst.). For. Ecol. Manag. 2004, 197, 39–48. [Google Scholar] [CrossRef]
  63. Jansen, S.; Konrad, H.; Geburek, T. The Extent of Historic Translocation of Norway Spruce Forest Reproductive Material in Europe. Ann. For. Sci. 2017, 74, 56. [Google Scholar] [CrossRef]
  64. Spiecker, H. Silvicultural Management in Maintaining Biodiversity and Resistance of Forests in Europe—Temperate Zone. J. Environ. Manag. 2003, 67, 55–65. [Google Scholar] [CrossRef]
  65. Brůna, J.; Wild, J.; Svoboda, M.; Heurich, M.; Müllerová, J. Impacts and Underlying Factors of Landscape-Scale, Historical Disturbance of Mountain Forest Identified Using Archival Documents. For. Ecol. Manag. 2013, 305, 294–306. [Google Scholar] [CrossRef]
  66. Čada, V.; Morrissey, R.C.; Michalová, Z.; Bače, R.; Janda, P.; Svoboda, M. Frequent Severe Natural Disturbances and Non-Equilibrium Landscape Dynamics Shaped the Mountain Spruce Forest in Central Europe. For. Ecol. Manag. 2016, 363, 169–178. [Google Scholar] [CrossRef]
  67. Průša, E. Die Bohmischen Und Mahrischen Urwalder-Ihre Struktur Und Okologie/The Bohmian and Mahrian Primeval Forests-Their Structure and Ecology; Tschechoslowakischen Akademie der Wissenschaften: Bratislava, Slovakia, 1985. [Google Scholar]
  68. Armstrong, R.A. When to Use the Bonferroni Correction. Ophthalmic Physiol. Opt. 2014, 34, 502–508. [Google Scholar] [CrossRef] [PubMed]
  69. Rothman, K.J. No Adjustments Are Needed for Multiple Comparisons. Epidemiology 1990, 1, 43–46. [Google Scholar] [CrossRef] [PubMed]
  70. Perneger, T.V. What’s Wrong with Bonferroni Adjustments. BMJ 1998, 316, 1236–1238. [Google Scholar] [CrossRef]
  71. Graczyk, D.; Cieśla, M.; Boguta, M. Regulation of tRNA Synthesis by the General Transcription Factors of RNA Polymerase III—TFIIIB and TFIIIC, and by the MAF1 Protein. Biochim. Biophys. Acta BBA—Gene Regul. Mech. 2018, 1861, 320–329. [Google Scholar] [CrossRef]
  72. Blayney, J.; Geary, J.; Chrisp, R.; Violet, J.; Barratt, L.; Tavukçu, L.; Paine, K.; Vaistij, F.E.; Graham, I.A.; Denby, K.J.; et al. Impact on Arabidopsis Growth and Stress Resistance of Depleting the Maf1 Repressor of RNA Polymerase III. Gene 2022, 815, 146130. [Google Scholar] [CrossRef]
  73. Soprano, A.S.; Abe, V.Y.; Smetana, J.H.C.; Benedetti, C.E. Citrus MAF1, a Repressor of RNA Polymerase III, Binds the Xanthomonas Citri Canker Elicitor PthA4 and Suppresses Citrus Canker Development. Plant Physiol. 2013, 163, 232–242. [Google Scholar] [CrossRef]
  74. Finnegan, E.J.; Kovac, K.A. Plant DNA Methyltransferases. In Plant Gene Silencing; Matzke, M.A., Matzke, A.J.M., Eds.; Springer: Dordrecht, The Netherlands, 2000; pp. 69–81. ISBN 978-94-011-4183-3. [Google Scholar]
  75. Liu, J.; He, Z. Small DNA Methylation, Big Player in Plant Abiotic Stress Responses and Memory. Front. Plant Sci. 2020, 11, 595603. [Google Scholar] [CrossRef]
  76. Jiang, C.; Mithani, A.; Belfield, E.J.; Mott, R.; Hurst, L.D.; Harberd, N.P. Environmentally Responsive Genome-Wide Accumulation of de Novo Arabidopsis Thaliana Mutations and Epimutations. Genome Res. 2014, 24, 1821–1829. [Google Scholar] [CrossRef]
  77. Sanchez, D.H.; Paszkowski, J. Heat-Induced Release of Epigenetic Silencing Reveals the Concealed Role of an Imprinted Plant Gene. PLoS Genet. 2014, 10, e1004806. [Google Scholar] [CrossRef]
  78. Wibowo, A.; Becker, C.; Marconi, G.; Durr, J.; Price, J.; Hagmann, J.; Papareddy, R.; Putra, H.; Kageyama, J.; Becker, J. Hyperosmotic Stress Memory in Arabidopsis Is Mediated by Distinct Epigenetically Labile Sites in the Genome and Is Restricted in the Male Germline by DNA Glycosylase Activity. Elife 2016, 5, e13546. [Google Scholar] [CrossRef] [PubMed]
  79. Xiong, L.; Zhu, J.-K. Molecular and Genetic Aspects of Plant Responses to Osmotic Stress. Plant Cell Environ. 2002, 25, 131–139. [Google Scholar] [CrossRef] [PubMed]
  80. Millar, C.I.; Westfall, R.D.; Delany, D.L.; Bokach, M.J.; Flint, A.L.; Flint, L.E. Forest Mortality in High-Elevation Whitebark Pine (Pinus Albicaulis) Forests of Eastern California, USA; Influence of Environmental Context, Bark Beetles, Climatic Water Deficit, and Warming. Can. J. For. Res. 2012, 42, 749–765. [Google Scholar] [CrossRef]
  81. Knapp, E.E.; Bernal, A.A.; Kane, J.M.; Fettig, C.J.; North, M.P. Variable Thinning and Prescribed Fire Influence Tree Mortality and Growth during and after a Severe Drought. For. Ecol. Manag. 2021, 479, 118595. [Google Scholar] [CrossRef]
  82. Ferrenberg, S.; Kane, J.M.; Mitton, J.B. Resin Duct Characteristics Associated with Tree Resistance to Bark Beetles across Lodgepole and Limber Pines. Oecologia 2014, 174, 1283–1292. [Google Scholar] [CrossRef]
  83. Sangüesa-Barreda, G.; Linares, J.C.; Camarero, J.J. Reduced Growth Sensitivity to Climate in Bark-Beetle Infested Aleppo Pines: Connecting Climatic and Biotic Drivers of Forest Dieback. For. Ecol. Manag. 2015, 357, 126–137. [Google Scholar] [CrossRef]
  84. Reed, C.C.; Hood, S.M. Few Generalizable Patterns of Tree-Level Mortality during Extreme Drought and Concurrent Bark Beetle Outbreaks. Sci. Total Environ. 2021, 750, 141306. [Google Scholar] [CrossRef]
  85. Rhoades, D.F. Herbivore Population Dynamics and Plant Chemistry. In Variable Plants and Herbivores in Natural and Managed Systems; Academic Press: New York, NY, USA, 1983; Volume 6, pp. 155–220. [Google Scholar]
  86. Waring, R.H.; Pitman, G.B. Modifying Lodgepole Pine Stands to Change Susceptibility to Mountain Pine Beetle Attack. Ecology 1985, 66, 889–897. [Google Scholar] [CrossRef]
  87. Mattson, W.J.; Haack, R.A. The Role of Drought in Outbreaks of Plant-Eating Insects. Bioscience 1987, 37, 110–118. [Google Scholar] [CrossRef]
  88. Herms, D.A.; Mattson, W.J. The Dilemma of Plants: To Grow or Defend. Q. Rev. Biol. 1992, 67, 283–335. [Google Scholar] [CrossRef]
  89. Landis, R.M.; Peart, D.R. Early Performance Predicts Canopy Attainment across Life Histories in Subalpine Forest Trees. Ecology 2005, 86, 63–72. [Google Scholar] [CrossRef]
  90. Petit, R.J.; Hampe, A. Some Evolutionary Consequences of Being a Tree. Annu. Rev. Ecol. Evol. Syst. 2006, 37, 187–214. [Google Scholar] [CrossRef]
  91. Reed, D.E.; Ewers, B.E.; Pendall, E.; Frank, J.; Kelly, R. Bark Beetle-Induced Tree Mortality Alters Stand Energy Budgets Due to Water Budget Changes. Theor. Appl. Climatol. 2018, 131, 153–165. [Google Scholar] [CrossRef]
  92. Koontz, M.J.; Latimer, A.M.; Mortenson, L.A.; Fettig, C.J.; North, M.P. Cross-Scale Interaction of Host Tree Size and Climatic Water Deficit Governs Bark Beetle-Induced Tree Mortality. Nat. Commun. 2021, 12, 129. [Google Scholar] [CrossRef]
  93. Huang, J.; Kautz, M.; Trowbridge, A.M.; Hammerbacher, A.; Raffa, K.F.; Adams, H.D.; Goodsman, D.W.; Xu, C.; Meddens, A.J.H.; Kandasamy, D.; et al. Tree Defence and Bark Beetles in a Drying World: Carbon Partitioning, Functioning and Modelling. New Phytol. 2020, 225, 26–36. [Google Scholar] [CrossRef]
  94. Mageroy, M.H.; Christiansen, E.; Långström, B.; Borg-Karlson, A.-K.; Solheim, H.; Björklund, N.; Zhao, T.; Schmidt, A.; Fossdal, C.G.; Krokene, P. Priming of Inducible Defenses Protects Norway Spruce against Tree-Killing Bark Beetles. Plant Cell Environ. 2020, 43, 420–430. [Google Scholar] [CrossRef] [PubMed]
Figure 1. The geographical location of targeted Norway spruce individuals. Red: Modrava, blue: Dreisessel, green: Hraničník, purple: Smrčina. Color shades of the cross signs indicate LTS and reference trees, respectively.
Forests 14 02074 g001
Figure 2. Discriminant Analysis of Principal Components (DAPC) scatter plot and individual density plots derived from the discriminant function 1 (horizontal) and discriminant function 2 (vertical), drawn across 383 individuals using the R package, adegenet. Dots represent individuals with colors denoting the sample origins. The ovals refer to the 95% inertia ellipses. The site colors correspond to the colors described in Figure 1 caption.
Forests 14 02074 g002
Figure 3. Jost’s D for all categories of trees (LTS and reference trees), as defined in Table 1. The shade undercoloring red–yellow–green indicates increasing Jost’s D coefficient values.
Forests 14 02074 g003
Figure 4. Manhattan plot. The x-axis represents the position of SNPs among the 12 linkage groups. Unassigned SNPs fall in group 0. The Y-axis shows the negative logarithm of the p-values with the significance threshold line corresponding to p-value = 5 × 10⁻⁴.
Forests 14 02074 g004
Table 1. Individual counts within categories for each study site; centered GPS coordinates of study sites.
Study SiteGPS CoordinatesTotal Number of Trees 
LTS TreesReference Trees
MatureJuvenile
Dreisessel48°47′ N 13°48′ E92201854
Hraničník48°45′ N 13°55′ E5615041
Modrava48°59′ N 13°26′ E168483387
Smrčina48°44′ N 13°56′ E6719480
Table 2. Jost’s D and its normalized 95% confidence intervals (CI). The shade undercoloring red–yellow–green indicates increasing Jost’s D coefficient values.
ComparisonSiteJost’s DConfidence Interval
LowerUpper
(a) LTS and reference treesDreisessel1.42 × 10−40.25 × 10−42.58 × 10−4
Hraničník2.72 × 10−41.09 × 10−44.35 × 10−4
Modrava0.64 × 10−40.03 × 10−41.24 × 10−4
Smrčina2.80 × 10−41.36 × 10−44.24 × 10−4
(b) LTS between sitesSmrčina × Modrava3.37 × 10−41.80 × 10−44.94 × 10−4
Smrčina × Hraničník5.10 × 10−42.43 × 10−47.77 × 10−4
Smrčina × Dreisessel4.32 × 10−42.41 × 10−46.24 × 10−4
Modrava × Hraničník6.62 × 10−44.62 × 10−48.63 × 10−4
Modrava × Dreisessel3.25 × 10−41.63 × 10−44.87 × 10−4
Hraničník × Dreisessel6.34 × 10−43.70 × 10−48.99 × 10−4
(c) Reference trees between sitesSmrčina × Modrava6.47 × 10−45.80 × 10−47.14 × 10−4
Smrčina × Hraničník4.06 × 10−43.01 × 10−45.11 × 10−4
Smrčina × Dreisessel5.48 × 10−44.72 × 10−46.25 × 10−4
Modrava × Hraničník2.01 × 10−41.35 × 10−42.67 × 10−4
Modrava × Dreisessel1.38 × 10−40.87 × 10−41.89 × 10−4
Hraničník × Dreisessel1.35 × 10−40.42 × 10−42.28 × 10−4
Table 3. Categorized information of gene identification such as contig and marker IDs, identified genes, linkage group (LG), and p-value of SNP marker.
Contig IDMarker IDGene (Plantgenie.org)Gene (PLAZA)LGp-Value
MA_139355AX-302167819------NA4.15 × 10−4
MA_17088AX-305072589MA_17088g0010PAB0002729072.85 × 10−4
MA_35335AX-305188807MA_35335g0010PAB0003835254.90 × 10−4
MA_466244AX-306784220MA_466244g0010PAB0004310711.72 × 10−5
MA_496531AX-305623507MA_496531g0010PAB0004450864.34 × 10−4
MA_51088AX-308536830MA_51088g0010PAB0004512471.13 × 10−4
MA_538811AX-306985564------NA4.62 × 10−4
MA_539AX-309072172------NA1.29 × 10−4
MA_77097AX-308569646MA_77097g0010PAB00054584NA1.16 × 10−4
MA_818649AX-308742628MA_818649g0010PAB0005659482.93 × 10−4
MA_8764366AX-303041489------NA1.38 × 10−4
MA_914090AX-304622666------NA5.76 × 10−5
Disclaimer/Publisher’s Note: The statements, opinions and data contained in all publications are solely those of the individual author(s) and contributor(s) and not of MDPI and/or the editor(s). MDPI and/or the editor(s) disclaim responsibility for any injury to people or property resulting from any ideas, methods, instructions or products referred to in the content.

