Article

Urbanization Imprint on Soil Bacterial Communities in Forests and Grasslands

College of Life Science and Technology, National Engineering Laboratory for Applied Technology in Forestry & Ecology in South China, Central South University of Forestry and Technology, Changsha 410004, China
*
Author to whom correspondence should be addressed.
These two authors contributed to the work equally and should be regarded as co-first authors.
Forests 2023, 14(1), 38; https://doi.org/10.3390/f14010038
Submission received: 28 October 2022 / Revised: 14 December 2022 / Accepted: 23 December 2022 / Published: 25 December 2022
(This article belongs to the Special Issue The Relationship between Forest Biodiversity and Ecosystem Function)

Abstract

:
Urbanization alters land uses and creates heterogeneous environmental conditions in cities and their surroundings, which may directly or indirectly impact soil microorganisms. However, how urbanization affects soil bacterial diversity and community composition, particularly in different land use types, remains largely unknown. In this study, we collected 36 soil samples (18 forest and 18 grass soils) along a rural-suburban-urban gradient in Chang-Zhu-Tan agglomeration. The bacterial diversity and community composition were investigated using 16S rRNA gene sequencing that targeted the V3-V4 region. Our results showed that urbanization induced shifts in bacterial diversity and community composition in both forestlands and grasslands. Specifically, soil bacterial diversity was higher in urban areas than in their suburban and rural counterparts in forests and grasslands, particularly in forests, where significant increases were detected. Urbanization changed the most dominated soil bacterial community from Acidobacteria to Proteobacteria in forestland. Significant decrease and increase were observed in the relative abundance of Acidobacteria (e.g., Acidobacteriales, Acidobacteriia_Subgroup2 and Solibacterales) and Proteobacteria (e.g., Betaproteobacteriales, Myxococcales and Sphingomonadales), respectively, in the forests with increasing urbanization intensity. In contrast, Proteobacteria always dominated the soil bacterial community along the rural-suburban-urban gradient in grassland, and significant decrease and increase in Nitrospirae and Latescibacteria were induced by urbanization, respectively. In addition to urbanization and total nitrogen, total organic carbon and ratio of carbon and nitrogen were the main factors that related with the bacterial community in forest soils, whereas soil water content was the main factor related with soil bacterial community in the grasslands. Together, our results indicate that the urbanization results in shifts in bacterial community composition and diversity, but the extent varied between forest and grassland, which may due to different human management intensity.

1. Introduction

With massive transition of human population from rural to urban areas, urban spaces are expanding at an unprecedented rate, resulting in physical geomorphological changes associated with urban building constructions, roads, disturbances and pollution caused by human activities [1,2].The habitat disturbance and land cover change caused by urbanization are profoundly affecting biodiversity due to the change of vegetation and increase of human activity [2,3,4], which also contributes to biodiversity homogenization [5]. Many studies have documented that urbanization induced changes in diversity and community composition of macroorganisms, such as birds, plants, and arthropods [6,7,8]. However, the response of soil microbial communities to urbanization remains controversial [1,9,10].
Soil bacteria play a crucial role in soil nutrient cycles and ecological processes [11]. Urbanization caused disturbances to soil physicochemical environment and ultimately results in changes of bacterial communities [12]. However, the extent to which soil bacterial diversity and community composition respond to urbanization remains controversial. Some studies reported that the diversity of soil bacteria was higher in urban areas than that of rural areas [13,14,15], while other studies documented little or no difference between urban and rural soils [16,17,18]. Moreover, some studies reported that urbanization could affect the composition of bacterial community in urban grassland [19] or influence activity of bacteria in urban greenspace [15]. Furthermore, land use type plays a crucial part in affecting the bacterial community composition structure and diversity [10,20,21]. Nonetheless, the extent to which bacterial communities respond to urbanization in different land cover types is not well understood.
Soil bacterial community are known to be influenced by a range of factors, such as pH, plant diversity, soil moisture, heavy metals, altitude gradients, climate change factors (e.g., CO2), temperature rise and precipitation [22,23,24,25,26,27,28]. In contrast to other ecosystems, soil bacteria in urban ecosystems can be disturbed by a lot of external factors linked to urbanization, such as city population, urban heat island effect, soil sealing, soil compaction, physical disturbance and the use of technosols [13,29,30,31]. Previous studies found that urbanization could shift the bacterial communities through affecting soil properties in grassland soils [1] or in forest soils [32]. Xu et al. [18] found that the geographic factors also played an important role in affecting bacterial communities in urban park soils. Moreover, the urban economic development levels were also important factors that impact bacterial diversity and community composition [32].
China has experienced rapid urbanization on an unprecedented scale in the past decades, in parallel with the boom of human populations and buildings [1,2]. Accompanying with increased urban buildings, more and more natural vegetation has been replaced with impervious surfaces in urban areas [33]. The impervious surfaces induced changes in bacterial community composition and decrease of bacterial diversity in different urban land cover types (concrete, permeable pavement, shrub coverage, lawns, and roadside trees) [34]. In addition, urban green space soils from different ring roads were investigated, and it is found that urban development changes the bacterial diversity and community composition [13]. However, understanding the key factors that altered soil bacterial communities in the process of urbanization, particularly in different land cover types, remains largely unexplored.
In this study, soil samples were collected from the Chang-Zhu-Tan urban agglomeration along a rural-suburban-urban gradient and the bacterial community composition and diversity were investigated by using bacterial 16S rRNA gene sequencing. We aimed to answer the following key questions: (1) Do soil bacterial diversity and community composition change along a rural-suburban-urban gradient? (2) Will bacterial communities of forestland and grassland respond to urbanization differently or not? (3) What are the main drivers of these changes? We hypothesized that urbanization would affect both the bacterial diversity and community composition, but such effects might be different between forests and grasslands.

2. Materials and Methods

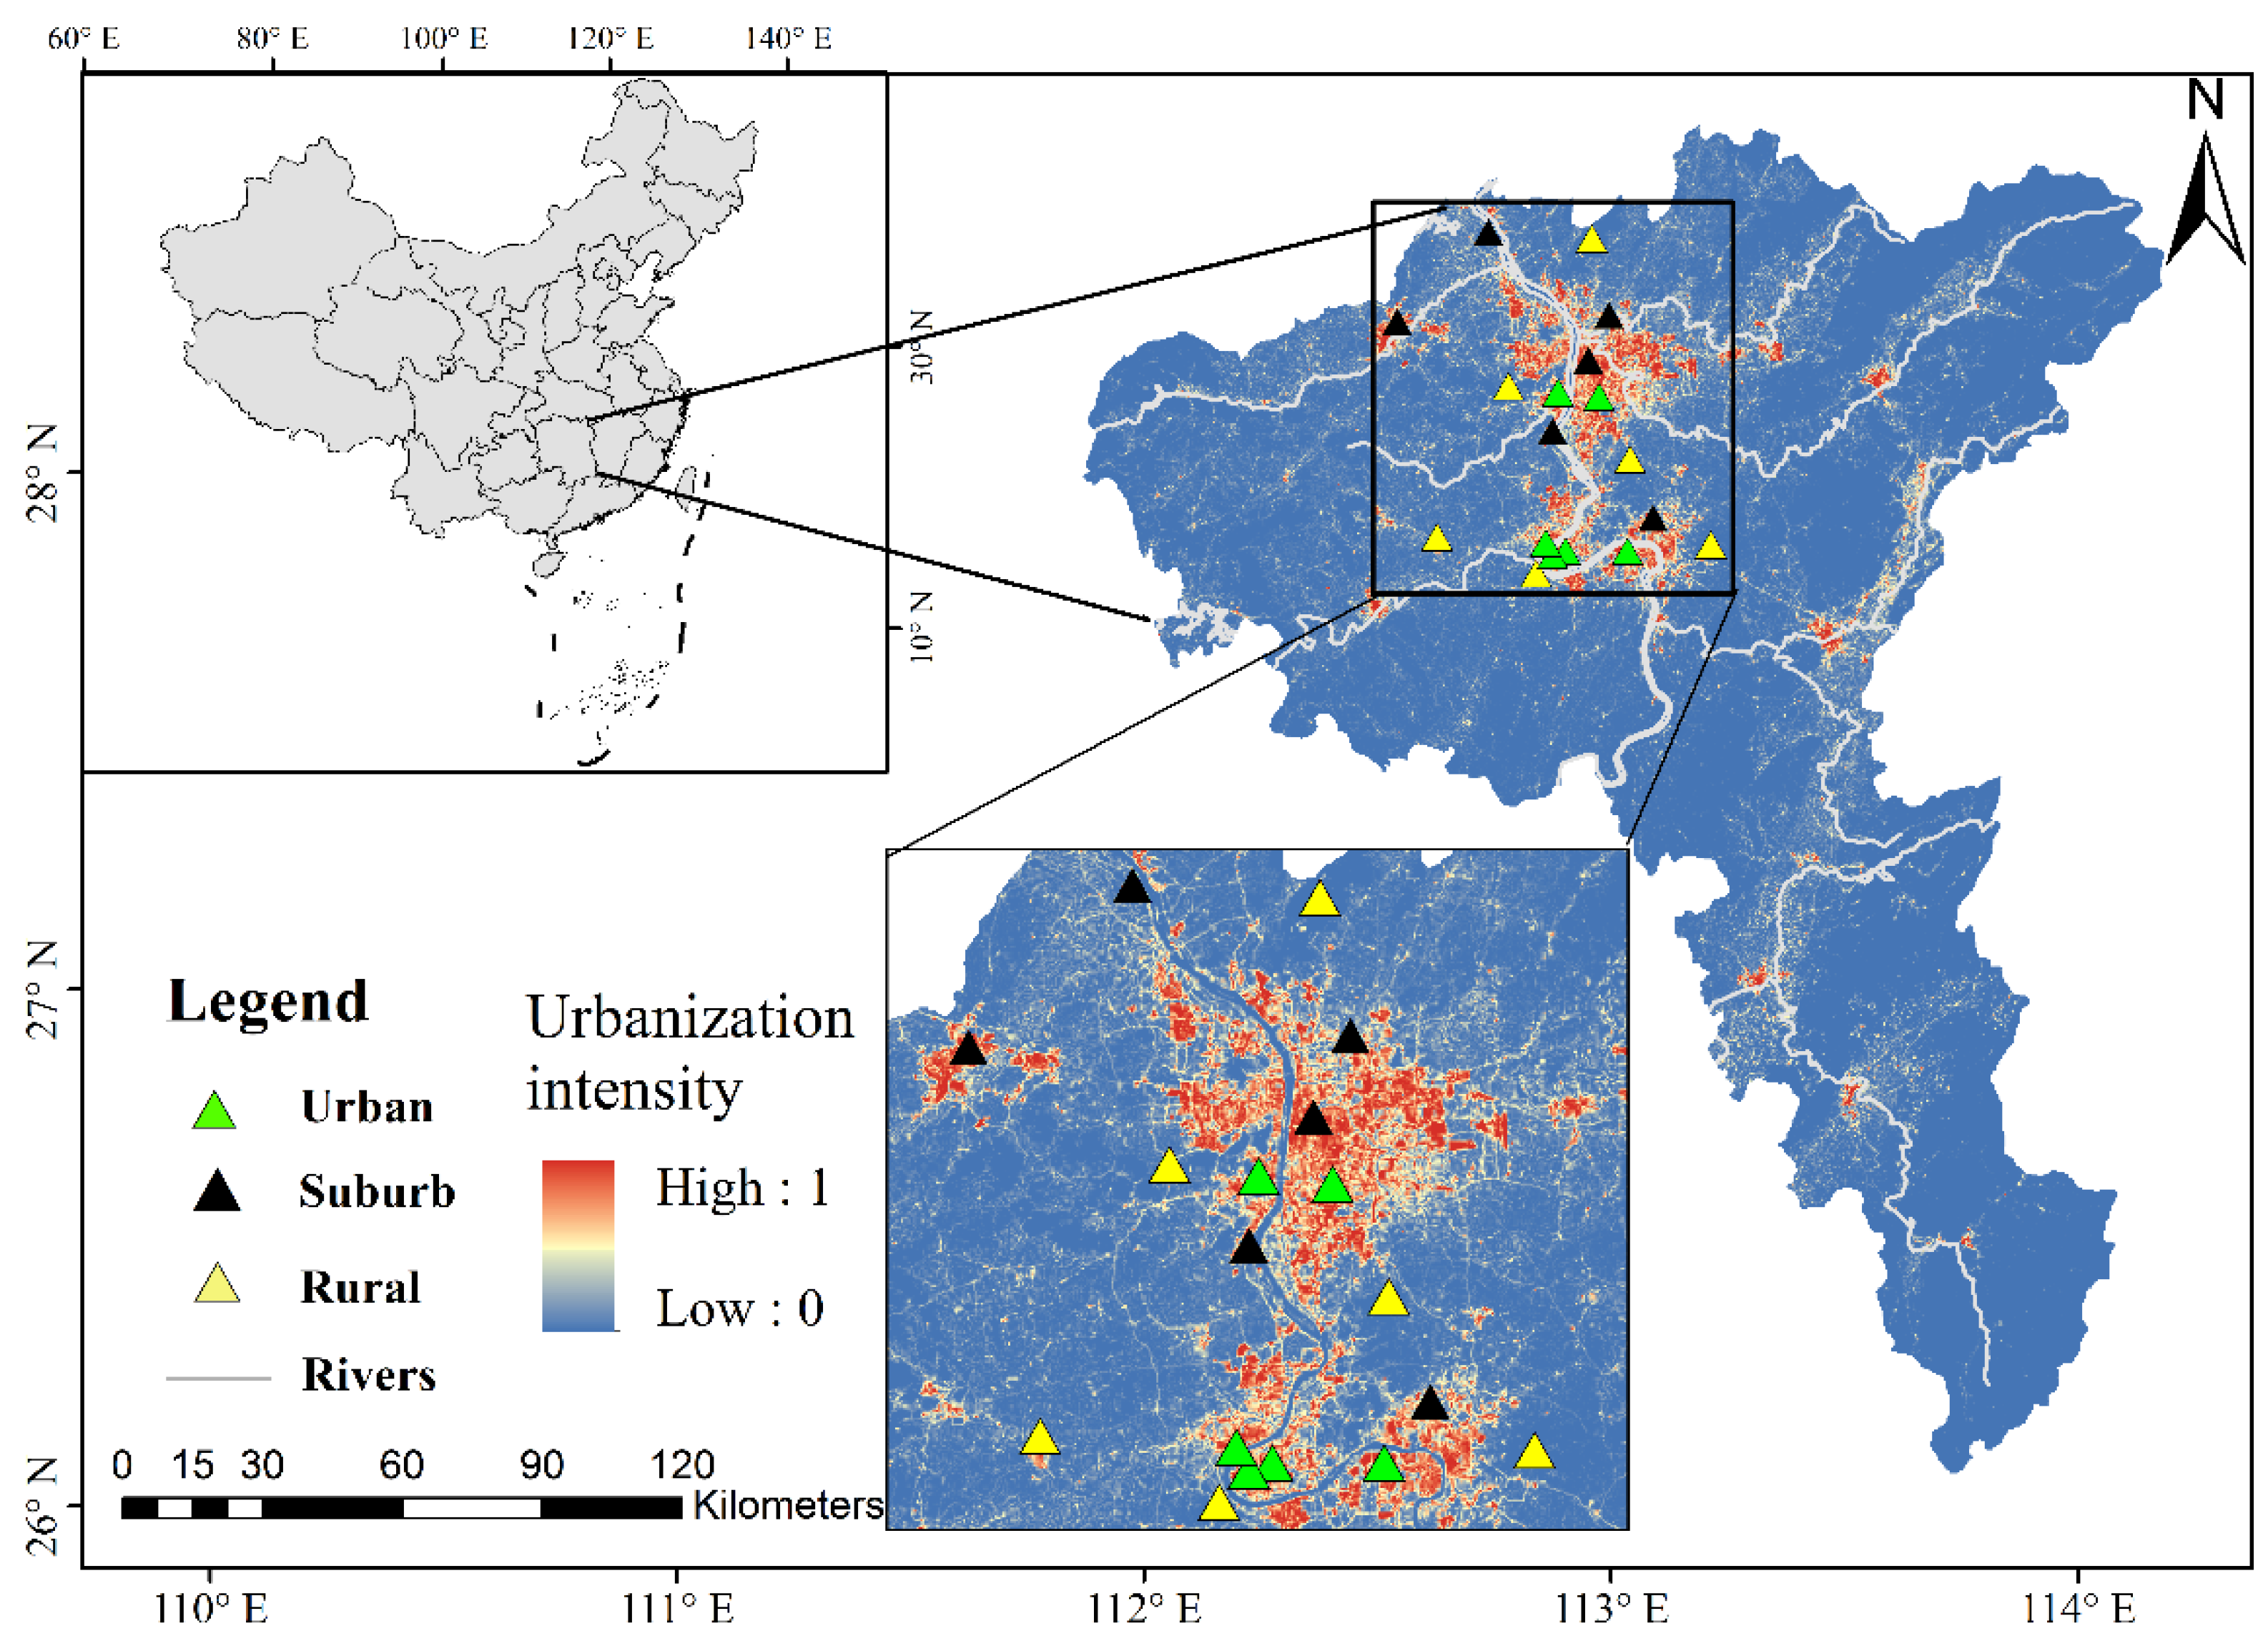
2.1. Soil Sampling and Soil Properties

The study sites were located in the Chang-Zhu-Tan agglomeration of Hunan Province, which is in the middle and lower reaches of Xiangjiang River (27°36′∼28°33′ N, 112°36′ ∼ 113°16′ E) (Figure 1). This area has a subtropical monsoon climate with average temperature of 16.5 °C and an annual precipitation of 1448 mm. As an important economic center in South China, the Chang-Zhu-Tan agglomeration has experienced rapid economic growth and urbanization. The soil type is red and the soil texture is sandy and loam.
In the present study, the urbanization intensity was calculated based on the impervious surface of the city using ArcGIS. The impervious surface dataset was obtained from the Fine Resolution Observation and Monitoring-Global Land Cover System which was released by Tsinghua University (http://data.ess.tsinghua.edu.cn/, accessed on 20 March 2019). The data set contains China’s impervious surface data from 1978 to 2017 (resolution of 30 m) and the 2017 land use cover data set (resolution of 10 m). The intensity of urbanization is determined by the proportion of pixels that fall into the impervious surface in the overlay window of 30 m × 30 m, and then resample them to 250 m, 1000 m, 2000 m and 5000 m resolution in ArcGIS 10.4 (Table S1). To better represent the impact of urbanization intensity, 4 urbanization coefficients R1, R2, R3 and R4 were used in this study which represent the urbanization intensity at 250 m, 1 km, 2 km and 5 km resolution, respectively.
We selected evergreen and deciduous mixed forests along the rural-suburban-urban gradient, which were dominated by Cinnamomum camphora (L.) J.Presl, Phoebe zhennan S.K.Lee & F.N.Wei, Cunninghamia lanceolate (Lamb.) Hook and Pinus massoniana Lamb. The grasslands along the rural-suburban-urban gradient were dominated by Poa annua Linn., Cynodon dactylon (L.) Pers., Alopecurus aequalis Sobol., Trifolium repens Linn., Viola philippica Cav., Oxalis corniculata Linn.. Soil samples were collected in April, 2019, and there were 18 sampling sites in this study (6 urban sites, 6 suburban sites, 6 rural sites) (Figure 1 and Table S1). In each sampling site, 3 soil sampling plots (5 × 5 m) of forestlands and 3 sampling plots (5 × 5 m) of grasslands were randomly established. In each plot, surface (0–20 cm) soil samples were collected at five points randomly with at least 1 m apart using a Dutch auger (5.0 cm diameter). Soil samples from the same site were homogenized and pooled into one composite sample. Thus, a total of 36 soil samples (18 forest and 18 grass soils) were collected and sealed in plastic bags immediately, transported in a cold container to the laboratory. The soil samples were sieved (2 mm) to remove roots and stones, and then were subdivided into three portions: one was air dried for the assessment of soil properties; one was stored at 4 °C for measuring soil microbial biomass (N and P); and the last portion was quickly frozen in liquid nitrogen and stored at −80 °C for molecular analysis.
Soil microbial biomass (N and P) were determined by fumigation extraction method [35,36]. Soil microbial biomass nitrogen (SMBN) was determined by microkjeldahl method [37], and soil microbial phosphorus (SMBP) was determined by ammonium molybdate stannous chloride method [38]. Soil pH was determined in 1:2.5 soil: water (w/v) suspension after 30 min of incubation using a pH meter PHS-3C (INESA instruments Inc., Shanghai, China). Soil organic carbon (SOC) was determined with K2Cr2O7 oxidation method [39]. Total nitrogen (TN) was determined by automatic flow injection after digestion in H2SO4. Total phosphorus (TP) was determined by the molybdenum antimony colorimetric method. Concentrations of heavy metal elements (As, Cd, Cr, Cu, Mn, Ni, Pb and Zn) were analyzed using a strong acid (HNO3-HClO4) pseudo-total digestion method [40], determined by Inductively Coupled Plasma-Optical Emission Spectroscopy (ICP-OES; Optima 7000 DV, PerkinElmer, Waltham, MA, USA). Soil water content (SWC, %, g of water per 100 g dry soil) was measured by oven-drying the soil for 48 h at 105 °C.

2.2. DNA Extraction, Amplification and Sequencing

Soil DNA was extracted from fresh 0.5 g soil using FastDNA™ Spin Kit for Soil (MP Biomedicals, Goddard Irvine, CA, USA) following the manufacturer’s instructions. The concentration and purity of DNA were quantified by using a NanodropND-1000 (Wilmington, DE, USA). The V3-V4 region of the bacterial 16S rRNA gene was amplified by the primer set of 338F (5′-ACTCCTACGGGAGGCAGCAG-3′) and 806R (5′-GGACTACHVGGGTWTCTAAT-3′) [41]. The Polymerase Chain Reaction (PCR) was performed in triplicate in a volume of 50 μL with 1 μL (10 μmol L−1) of forward and reverse primers, 25 μL 2×Power Taq Master Mix, 2 μL (20 ng μL−1) of template DNA, and made up to the volume with sterile water. PCR program was as follows: 94 °C for 5 min, then cycle 30 times, 94 °C for the 30 s, 52 °C for 30 s, 72 °C for 30 s, and finally expansion at 72 °C for 10 min. The resulting PCR products were mixed together, and further evaluated by 2% agarose gel electrophoresis. The targeted DNA fragments were excised and purified using second-hand E.Z.N.A. ® gel extraction kit. According to the manufacturer’s recommendations, the purified amplicons were pooled in equimolar ratios and sequenced on an Illumina Hiseq PE250 platform (Guangdong McJean Biotechnology Co., Ltd., Guangzhou, China), generating paired-end reads (2 × 250 bp). The raw reads in this study were deposited in the GenBank Sequence Read Archive (SRA) (Accession Number: SRP200598).
The raw sequences were quality trimmed using fastp v0.19.6, and merged by FLASH v1.2.11 (Fast Length Adjustment of SHort reads). The USEARCH 6.1 was used to identify and remove the chimeric sequences [42]. The remaining high-quality reads were clustered into Operational Taxonomic Units (OTUs) with 97% sequence similarity cutoff using UPARSE v7.0.1090 [43]. The OTU tables were rarefied to the sequence number corresponding to the sample with the least sequences (29,485 and 25,268 in forestland and grassland, respectively) before downstream analyses. The taxonomy of each sequence was analyzed by Ribosomal Database Project (RDP) Classifier v2.11 against the Silva 128 database using a confidence threshold of 0.7.

2.3. Statistical Analysis

Statistical analyses were carried out in R v.4.1.1 (R Core Development Team 2008) and results were considered significant when p values < 0.05. Soil properties and alpha diversity indexes including Richness, Shannon, Chao1 and Simpson were calculated in vegan with R software [44]. The differences were tested using one-way analysis of variance (ANOVA) and followed by post hoc Tukey Honestly Significant Difference (HSD) tests for significance. Data were transformed (natural log, square root, or rank) when required to meet assumptions of normality and homogeneity of variance. The non-metric multidimensional scaling (NMDS) analysis, based on the Bray–Curtis dissimilarity distance index, was conducted to analyze the variations in the bacterial community structure (sequences were rarefied and log transformed) using Canoco 5.0 (Microcomputer Power, Ithaca, NY, USA). The nonparametric multivariate analysis of variance (ADONIS) was used to evaluate the significant differences of microbial community structure along urban-suburban-rural gradient at the OTU level using vegan package in R [44]. The distance based redundancy analysis (db-RDA) was conducted to analyze the relationships between bacterial communities and environmental factors at the OTU level in forestland and grassland using Canoco 5.0 (Microcomputer Power, Ithaca, NY, USA). Structural equation model (SEM) analysis was constructed to analyze both the direct and indirect effects of urbanization on bacterial communities by using the lavaan package in R [45]. To improve normality, all data that used in SEM were standardized and transformed. We then generated a priori model, which included soil SWC, spatial (spatial variables), soil (soil nutrients), metal (soil heavy metal: As, Pb, Zn, Cu, Cd, Cr), urban (urban impervious surface values: R1, R2, R3, and R4 represent the 250 m, 1 km, 2 km, and 5 km resolutions in the calculation of urbanization intensity in ArcGIS 10.4, respectively), and bacterial community (diversity index and dominant group abundance). Spatial analysis was performed by using the dbmem function in the adespatial package in R (distance-based Moran feature vector graph analysis) [46], and the selected significant factors were used for further analysis. The regression weights, correlations and covariances were calculated using the maximum likelihood estimation method. The model was tested by the chi-square goodness-of-fit statistic and its associated p value [47]. The model fit was improved iteratively through removing or adding relationships between observed variables, minimizing the probability of spurious results because of multicollinearity, until the Chi-square test of the model is not significant (p > 0.05).

3. Results

3.1. Soil Properties along the Rural-Suburban-Urban Gradient

The variations of soil properties along the urbanization intensity gradients are shown in Table 1. The soil TOC, TN and SWC tended to decrease with the increase of urbanization intensity in both forestland and grassland (Table 1), and their lowest values were observed at the urban sites (UF and UG). The soil pH increased along the urbanization intensity gradient in both forestland and grassland (Table 1). The content of soil heavy metals (e.g., Cd, Pb, and Zn) increased along the urbanization intensity gradient in both forestland and grassland.

3.2. Impact of Urbanization on Soil Bacterial Diversity

The data in Figure 2 showed the diversity indexes along the urbanization intensity gradient in forestland and grassland. In forestland, the indexes of richness, Shannon and Chao1 were significantly higher in urban plots (UF) than that in suburban and rural plots (RF and SF) (p < 0.05, Figure 2), and the index of Simpson was significantly lower in UF than in RF and SF (p < 0.05), indicating that soil bacterial diversity was significantly affected by urbanization in forestland. Although no significant differences were detected, soil bacterial diversity showed an increasing trend along the rural-suburban-urban gradient in grassland (p > 0.05). Additionally, grassland persistently showed a higher bacterial diversity than forestland under each urbanization intensity level (Figure 2).

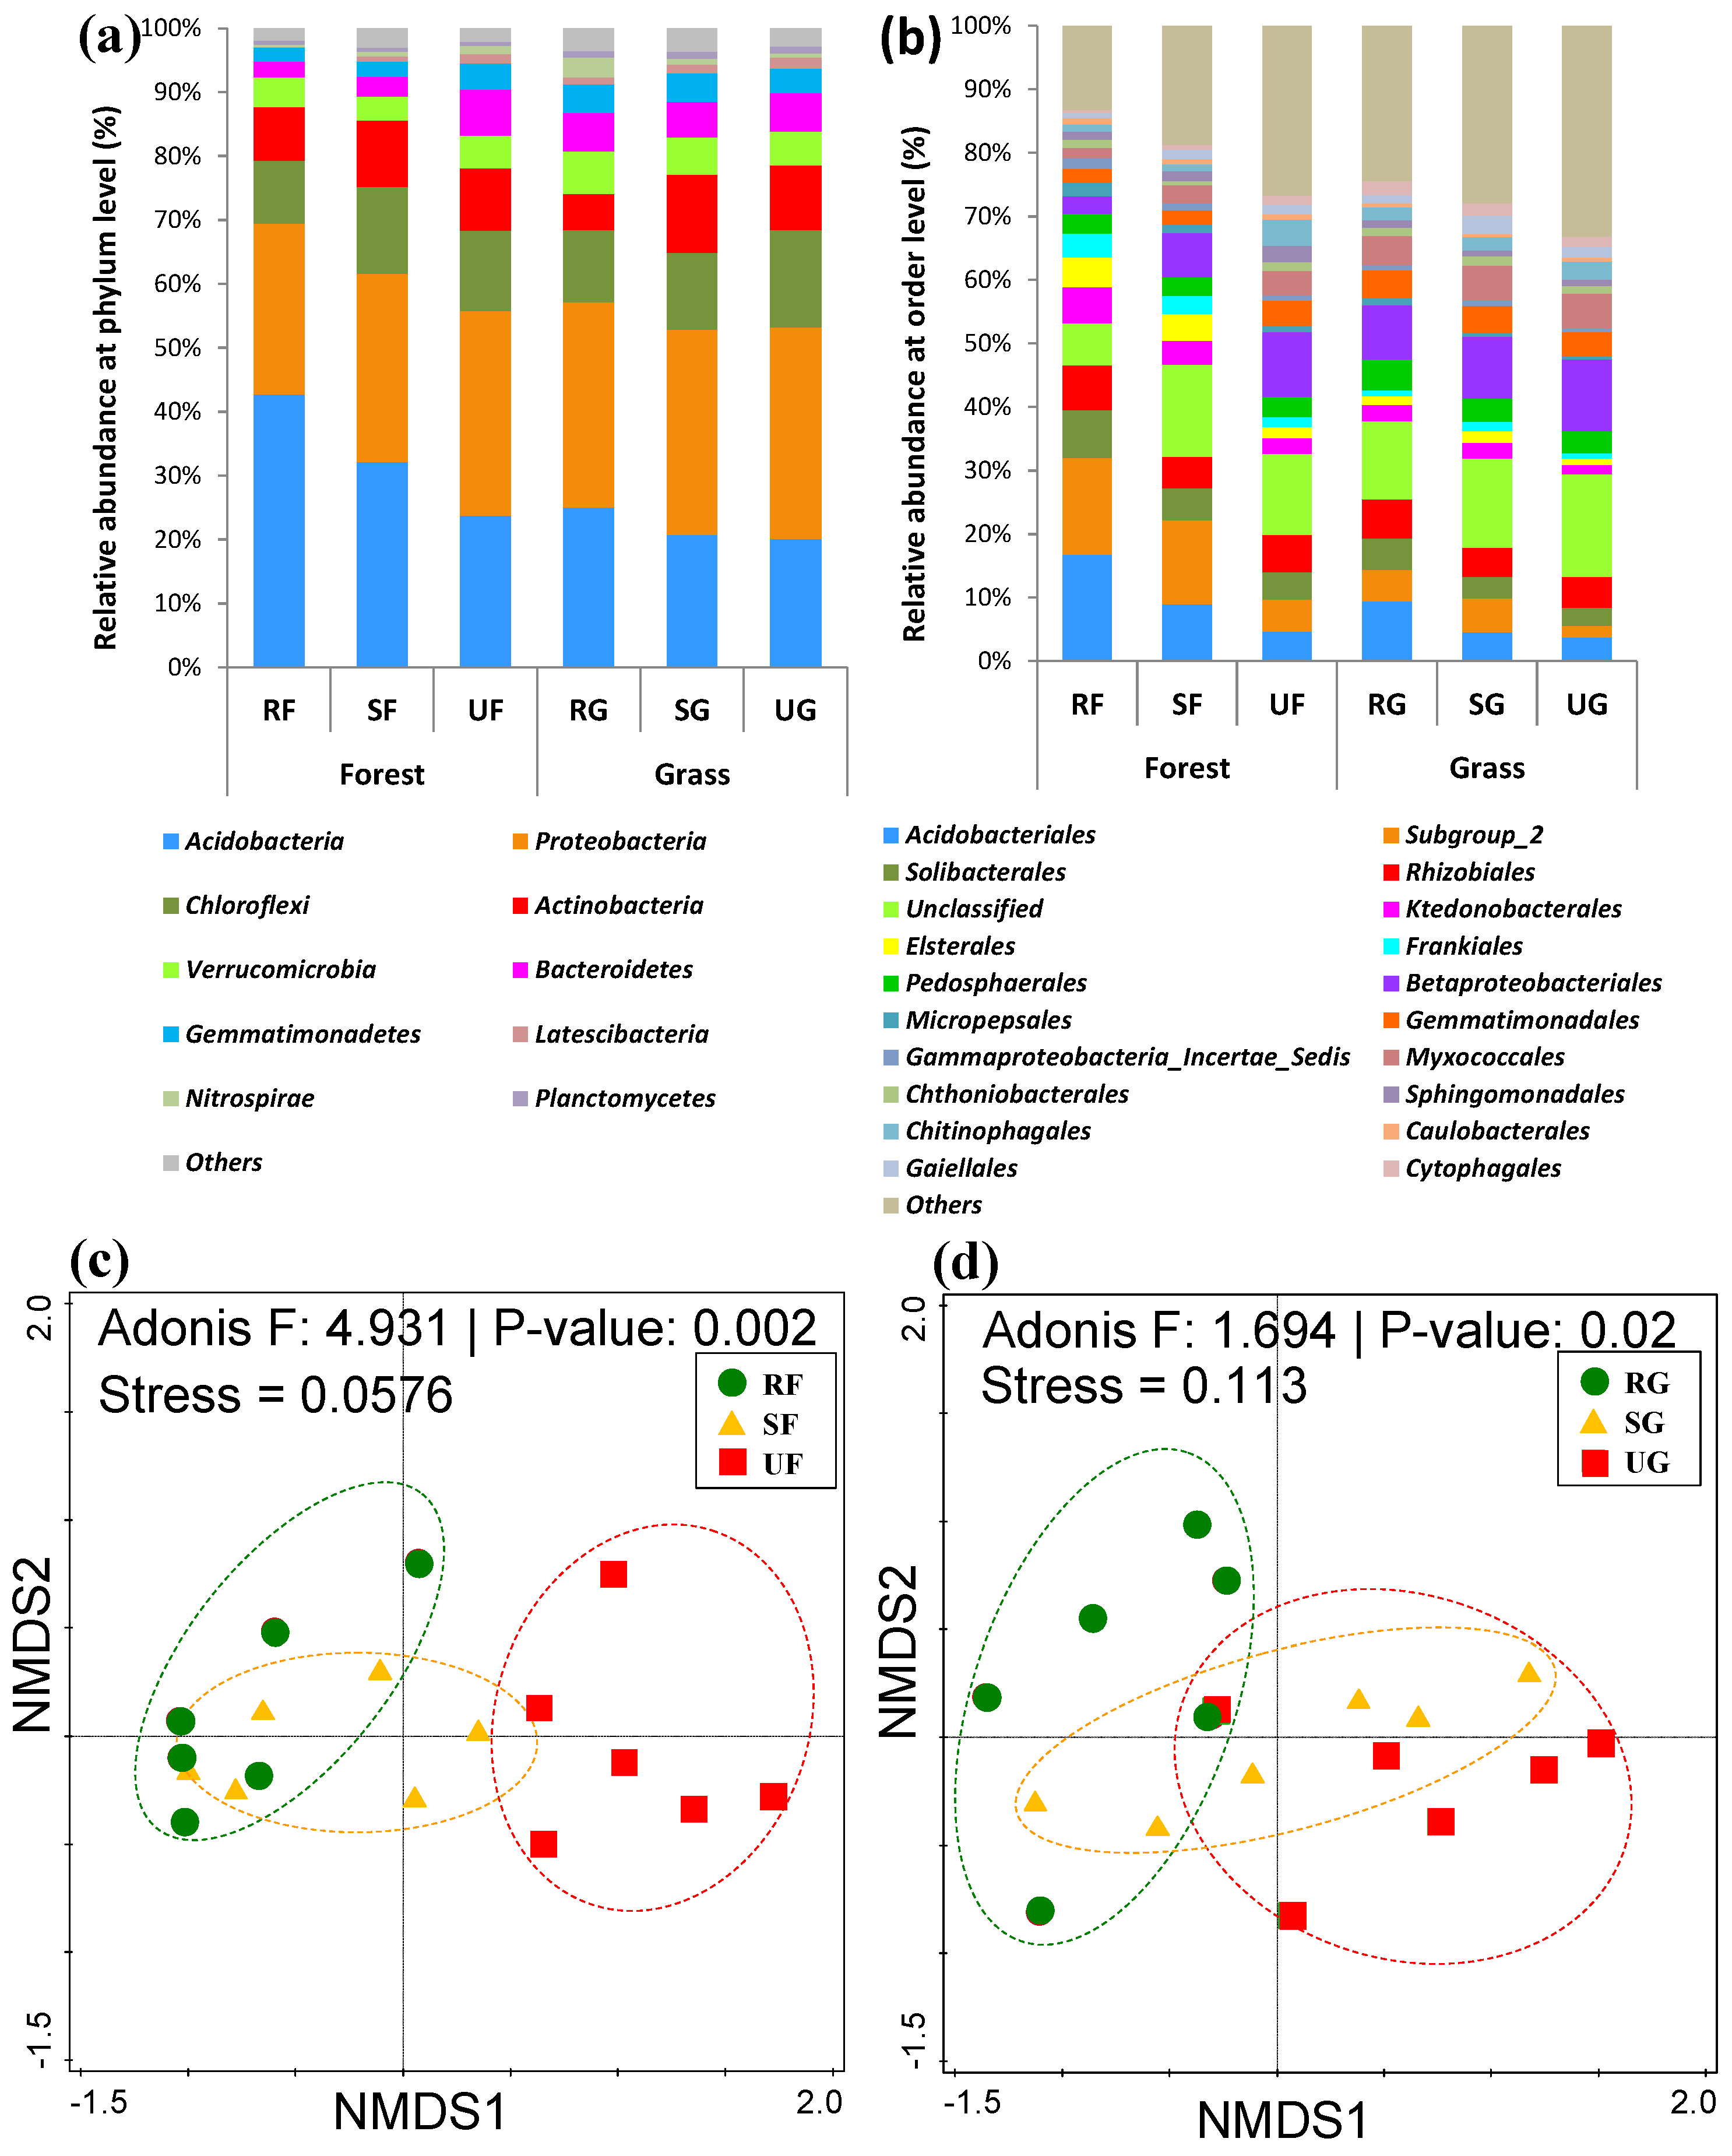
3.3. The Responses of Soil Bacterial Community Compositions to Urbanization

After all the bioinformatics steps, the remaining 5,548,698 (46,239 in average) and 5,239,946 (43,666 in average) high-quality sequences were grouped into 242,617 and 296,924 OTUs at 97% identity threshold in forestland and grassland, respectively. All OTUs were assigned into ten phyla and twenty orders, respectively, except for the group of ‘others’ (Figure 3a,b).
Urbanization was related with shifts in the bacterial relative abundance in forests and grasslands (Figure 3 and Table S2). In comparison with rural areas, the most dominated soil bacterial community changed from Acidobacteria (42.8%) to Proteobacteria (32.0%) in urban forestland (Figure 3a and Table S2). In contrast, Proteobacteria (32.1%–33.1%) always dominated the soil bacterial community along the three urbanization levels in grassland (Figure 3a and Table S2). The relative abundance of Acidobacteria decreased significantly from rural forests to urban forests (p < 0.05), while the relative abundances of Bacteroidetes, Nitrospirae and Latescibacteria increased significantly by urbanization in forestland (p < 0.05, Figure 3a and Table S2). In grassland, urbanization caused significant decrease in the relative abundances of Nitrospirae, but significant increase in Latescibacteria (p < 0.05, Figure 3a and Table S2). In addition, Urbanization induced significant decrease in the relative abundance of Acidobacteriales, Acidobacteriia_Subgroup_2 and Solibacterales (which all belong to Acidobacteria), and increased the relative abundance of Betaproteobacteriales, Myxococcales and Sphingomonadales (which all belong to Proteobacteria) in forestland (p < 0.05, Figure 3b and Table S2).
The NMDS analysis further showed the variations in the bacterial community structure in the three land use categories of forestland and grassland (Figure 3c,d). The ADONIS analysis revealed significant variability in bacterial community structure across different urbanization intensity gradients in forestland (F = 4.931, p < 0.01, Figure 3c). Moreover, significant difference in the bacterial communities was also detected among three urbanization levels in grassland (F = 1.694, p < 0.05, Figure 3d).

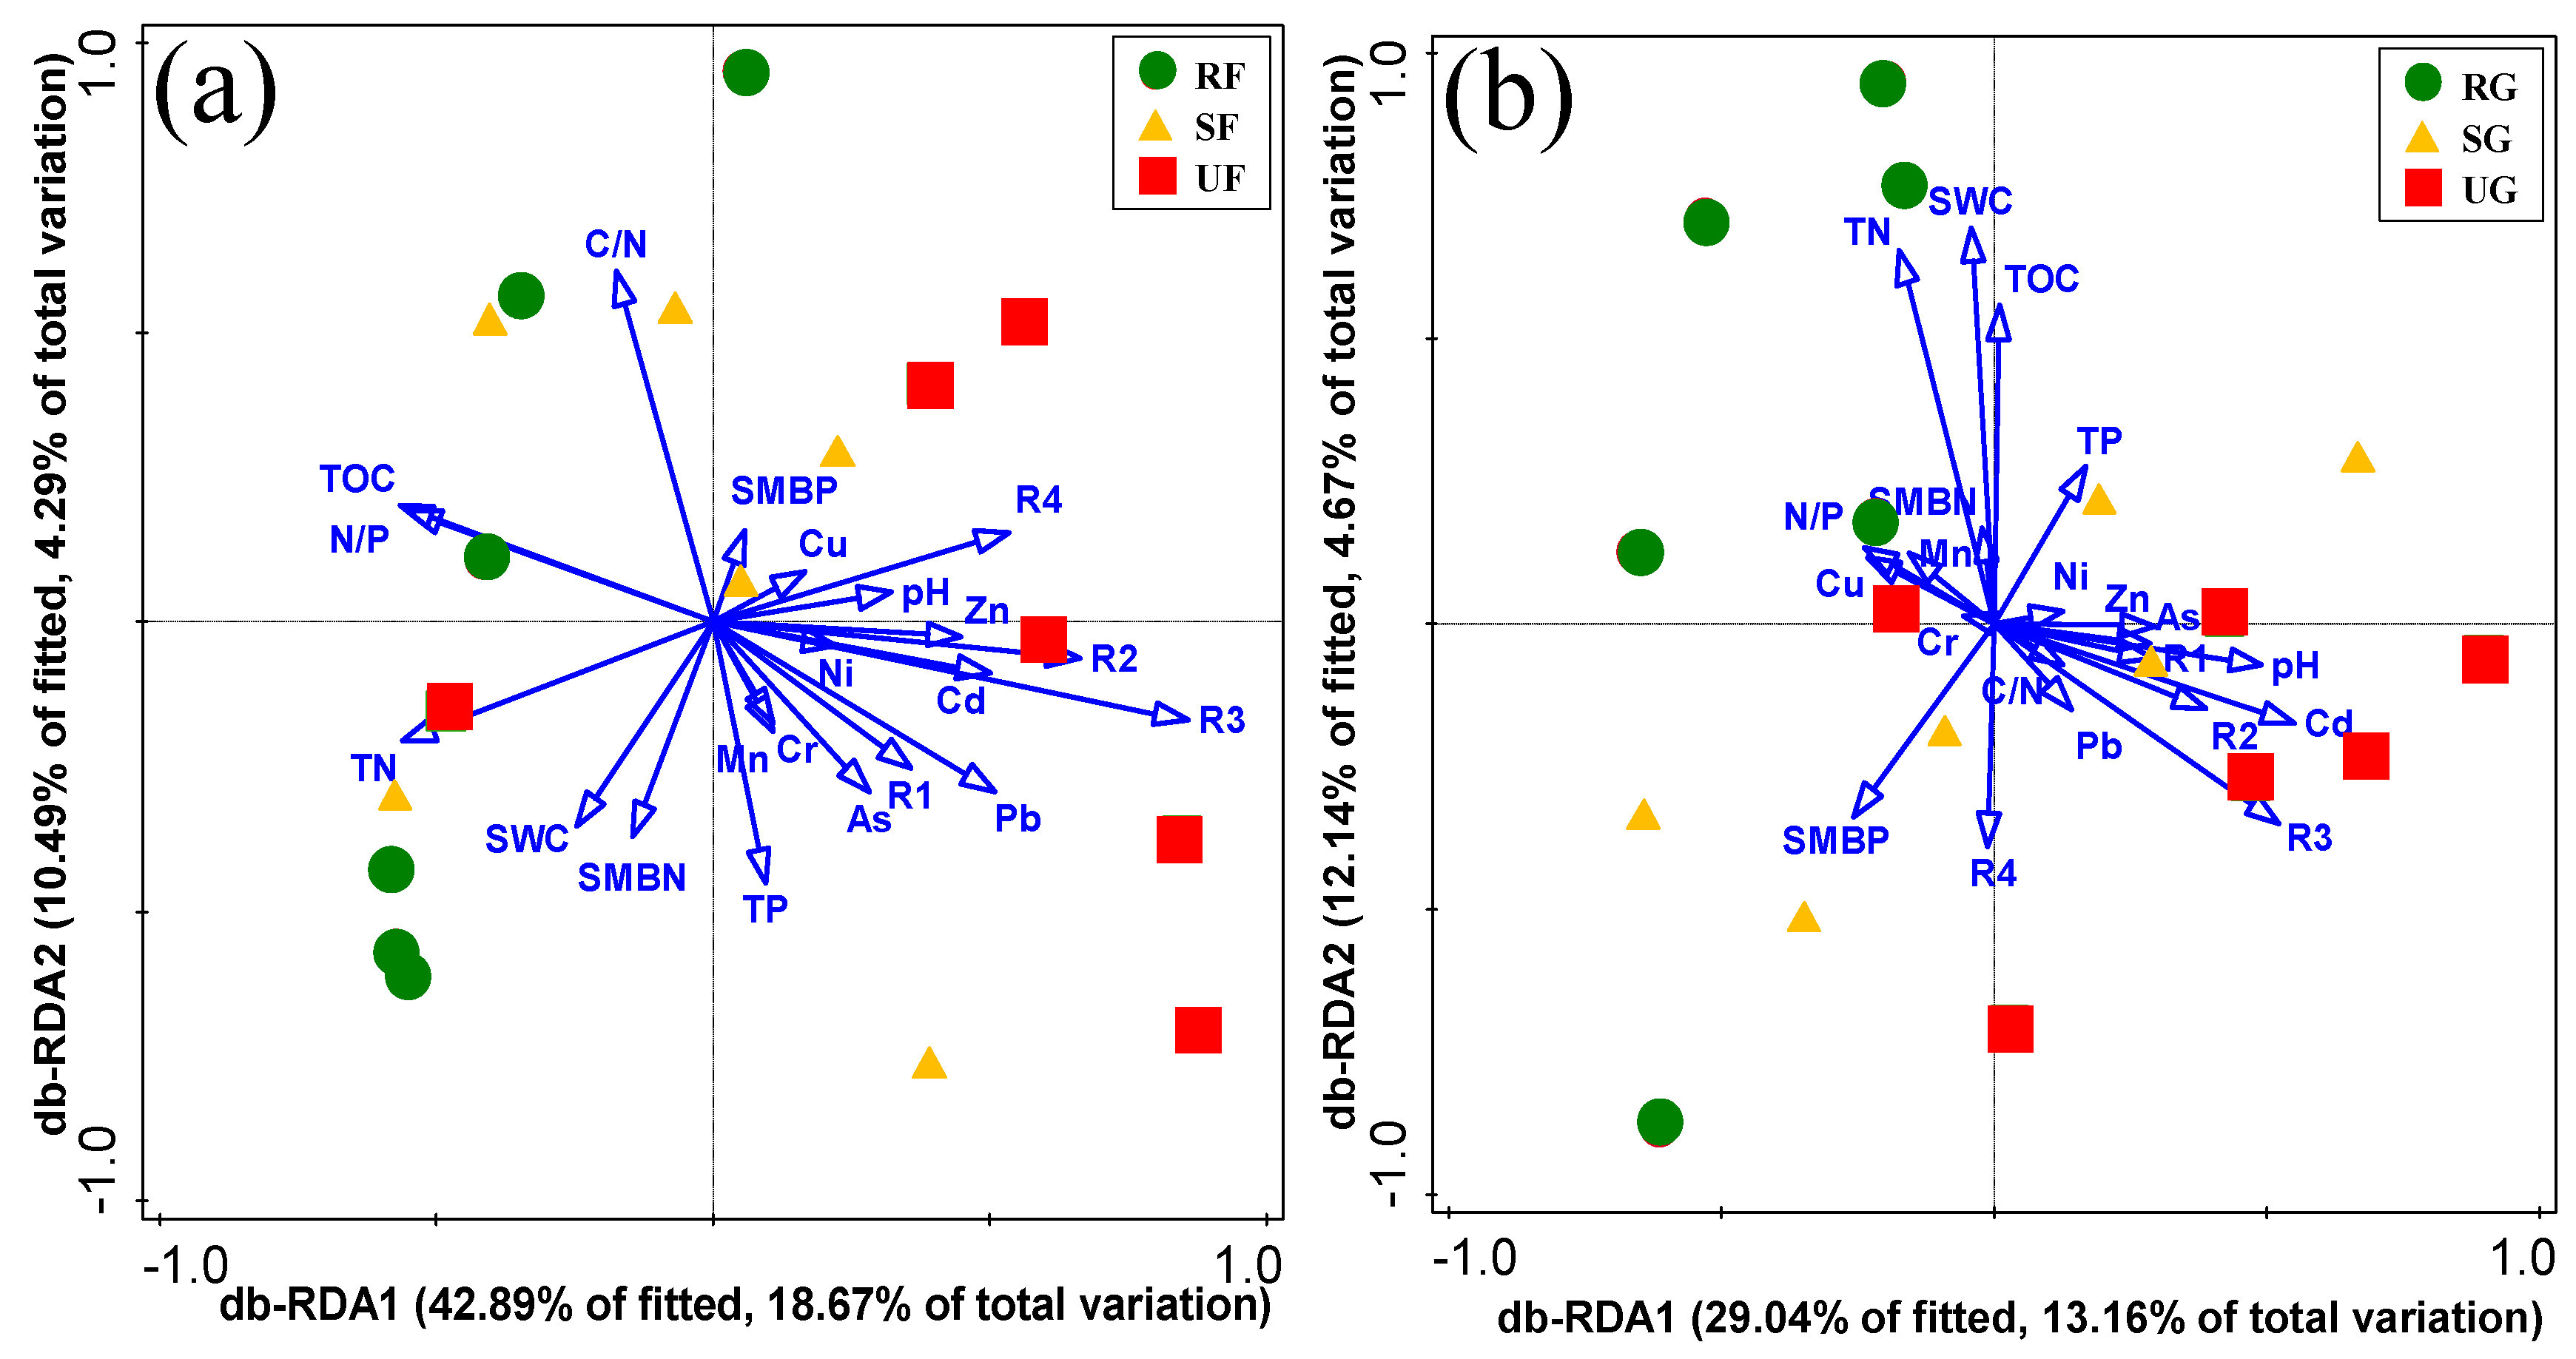
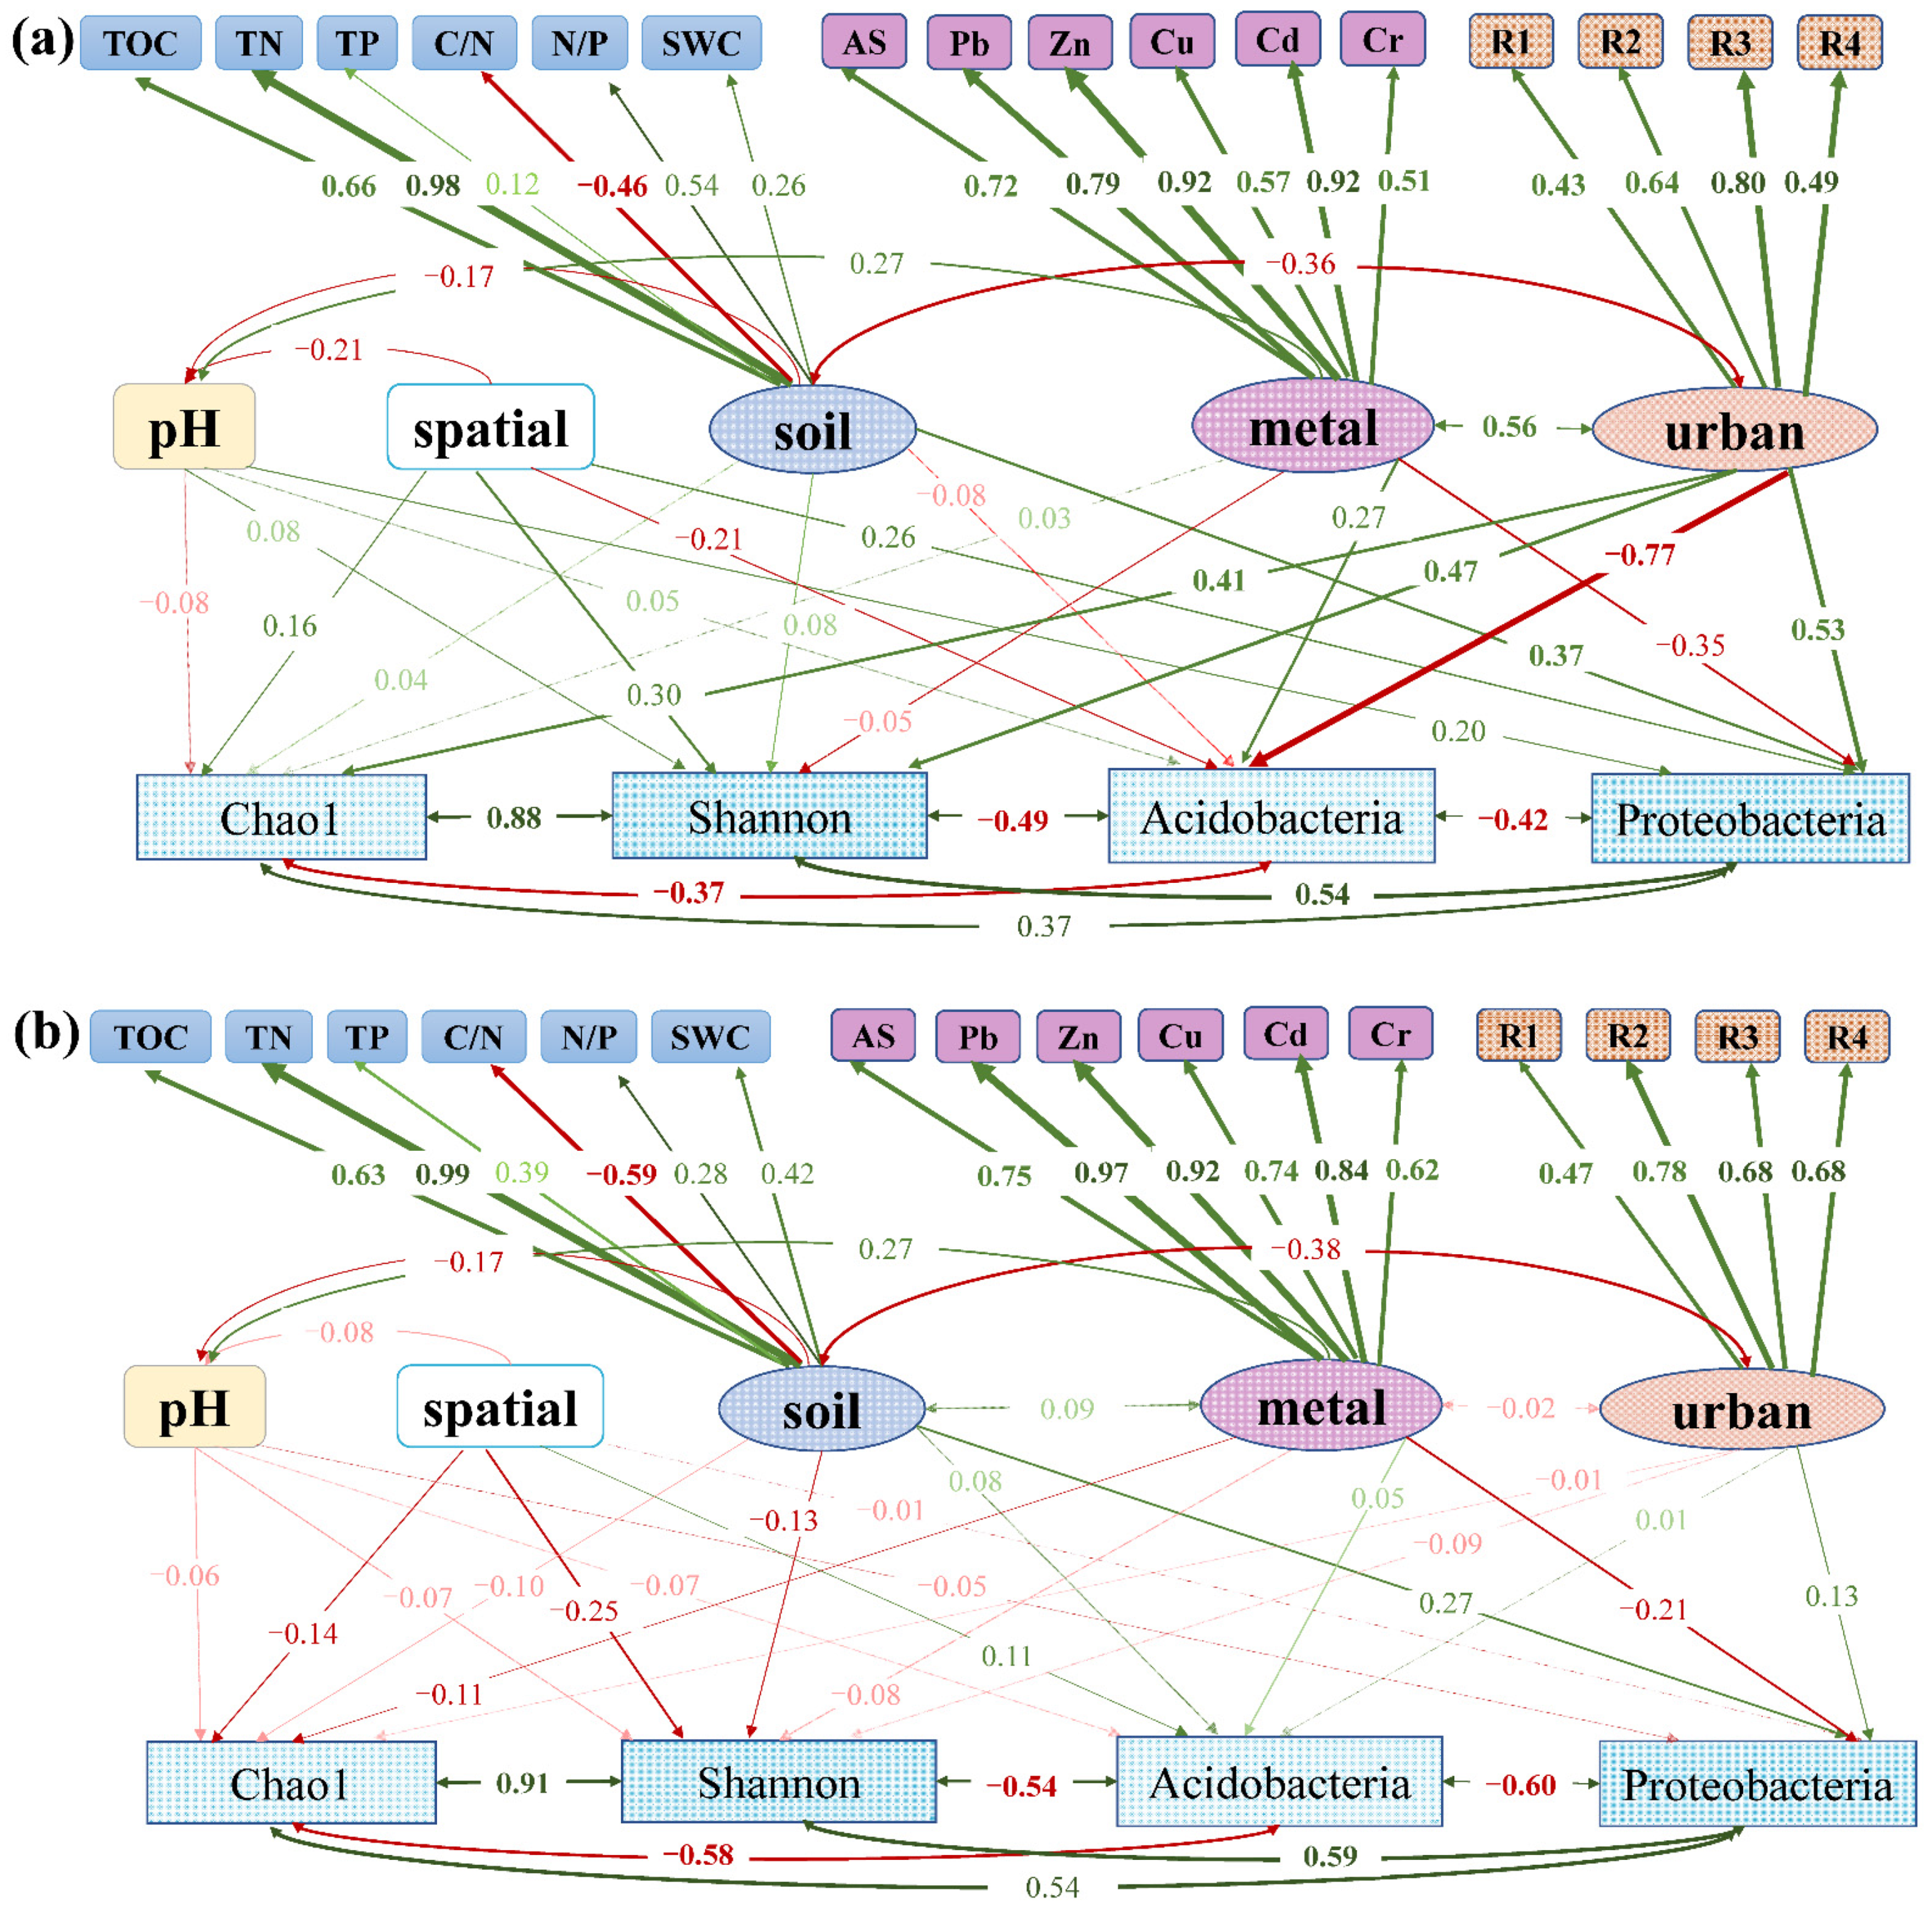
3.4. Relationship between Environmental Factors and Soil Bacterial Community

Distance-based RDA (db-RDA) analysis was used to reveal the relationships between bacterial community structure and environmental factors in forestland and grassland (Figure 4). The results showed that the composition of bacterial communities were related with multiple factors, and these characteristics could explain approximately 22.96% and 17.83% of the variations in the distribution of bacterial communities in forestland and grassland, respectively. Furthermore, soil TOC, TN, C/N and urbanization (coefficients R3) were the main factors that coincided with the bacterial community in forest soils (Figure 4a), whereas SWC, TN and urbanization (coefficient R3) were the main factors related with soil bacterial community in grassland (Figure 4b).
Structural equation model (SEM) analysis was employed to explain direct and indirect impacts of urbanization on bacterial diversity and the abundance of the two most dominant phyla (Figure 5). In forestland, the urbanization intensity (urban) showed robustly direct effects on Chao1, Shannon, Acidobacteria and Proteobacteria with the path coefficients being 0.41, 0.47, −0.77 and 0.53, respectively (Figure 5a). However, the indirect influence of urbanization on Chao1, Shannon, Acidobacteria and Proteobacteria via soil nutrients (path coefficient = 0.04, 0.08, −0.08 and 0.37, respectively) and heavy metals (path coefficient =0.03, −0.05, 0.27 and −0.35, respectively) was much weaker (Figure 4a). In grassland, urbanization showed similar direct (path coefficient = −0.01, −0.09, 0.05 and −0.21, respectively) and indirect effects via soil nutrients (path coefficient = −0.10, −0.13, 0.08 and 0.27, respectively) and heavy metals (path coefficient = −0.11, −0.08, 0.05 and −0.21, respectively) (Figure 5b). These results indicated that urbanization not only affect bacterial diversity and community composition directly, but also affect them by influencing soil environmental factors in both forest and grassland.

4. Discussion

4.1. The Influence of Urbanization on Diversity and Composition of Bacterial Communities

Our results showed that the diversity of soil bacterial communities increased significantly from rural forests to urban forests, and an increasing trend was also observed in soil bacterial diversity from rural grasslands to urban grasslands (Figure 1). This was consistent with previous studies [13,14], which showed that the soil bacterial diversity was increased by urbanization. However, Xu et al. [18] found that urbanization only affected soil bacterial community composition, but not their diversity, suggesting that the impact of urbanization on bacterial diversity is highly context-dependent. It was also determined that urbanization intensities suppress some bacterial species while promoting others, suggesting that the disturbance could result in environmental heterogeneity, creating more niches for species coexistence [48]. Moreover, a higher bacterial diversity helps maintaining ecosystem stability due to the high functional redundancy of bacterial communities [14,49].
Meanwhile, the bacterial community composition was shifted by urbanization in both forest and grassland, which was consistent with our hypothesis. Previous study also found that urbanization could change the composition of bacterial communities in urban park [18]. In this study, the relative abundances of Acidobacteria decreased while Proteobacteria increased by urbanization, particularly in forestland (Figure 2). Acidobacteria is considered to be a broad and phylogenetically diverse phylum, and they are abundant in acidic soils with high organic matter [50]. The rural soils were more acidic than that of urban soils in both forestland and grassland in this study (Table 1), which might enrich more Acidobacteria in rural soils. Proteobacteria contains many taxa that are highly sensitive to changes in soil properties [28]. SEM analysis showed that the relative abundance of Proteobacteria was strongly correlated with soil properties nutrients and soil heavy metals in both forestland and grassland (Figure 5). Thus, the changes in soil properties might have large impact on the abundance of Proteobacteria during the process of urban development.
The db-RDA analysis suggested that soil total nitrogen was a crucial factor that driving the bacterial community changes along the rural-suburban-urban gradient in both forestland and grassland (Figure 3). Nitrogen is an essential element for all living organisms due to its crucial role in biosynthesis of key cellular components [51]. Previous study showed that soil nitrogen was one important limiting factor for the bacterial communities [28]. Thus, the significant decreases in soil total nitrogen caused by urbanization might result in changes in the micro-environment [52], which might influence the bacterial communities in forestland and grassland. Moreover, soil heavy metals were also important environmental factors that influencing bacterial community composition and diversity in different land-use types [34]. The heavy metals (e.g., Cd, Pb, and Zn) were significantly enriched in urban forest soils (Table 1). The heavy metal enrichment in soil may be caused by construction debris and garbage generated during the construction process of the city [53]. In addition, a series of human activities, such as coal burning and automobile exhaust, are also the main sources of heavy metals in the urban soil [27,40]. As a result, urban development may lead to changes in the soil environment, resulting in a change in the micro-environment for bacterial communities.

4.2. Differences in the Composition and Diversity of Bacterial Communities between Forests and Grasslands

Our results revealed that the grass soils persistently showed a significantly higher bacterial diversity than forest soils under each urbanization level (Figure 1). This was consistent with previous studies which showed that land use affected the bacterial diversity [54,55]. Nacke et al. [56] also found the higher bacterial diversity in grass soils than in forest soils. Different with forests, grasslands have more intensive management practices including fertilization, irrigation, grazing, cutting or reseeding [57]. The fertilization may change soil nutrient status, and further soil microbial diversity in grasslands [58].
Nacke et al. [56] observed that the bacterial communities were different between forestland and grassland, suggesting that the bacterial communities were influenced by soil properties caused by vegetation diversity and heterogeneity [56,59]. Our study highlighted some taxa that were significantly different between forestland and grassland. Particularly, the relative abundance of Acidobacteriales, Acidobacteriia_Subgroup_2 and Solibacterales, which all belong to Acidobacteria, was significantly lower in forestland than that in grassland (Figure 2). It was found that Acidobacteria prefer more acidic environments [50], so the lower soil pH in forest soils might enrich more Acidobacteria. In addition, the abundance of Nitrospirae was significantly lower in forestland than that in grassland (Figure 2 and Table S2). Nitrospirae, the oligotrophic bacteria, were found in higher amounts in neutral and alkaline soils than in acidic soils [60]. Moreover, soil Nitrospirae could be affected by urban pollutants, such as heavy metals and permanent organic pollutants [61]. Thus, the lower abundance of Nitrospirae might be attributed to lower pH and organic matter contamination in forest soils.
Interestingly, we found that the main driving factors of soil bacterial community in forestland and grassland were also different. Except urbanization and TN, TOC and C/N were the main factors influencing the bacterial community in forest soils (Figure 3). The bacterial communities, such as groups belonging to Acidobacteria and Proteobacteria, are highly sensitive to changes in soil properties such as total organic carbon content and total nitrogen [28]. Thus, the changes in soil properties might result in changes in the micro-environment [52], which might influence the bacterial communities in forest soils. However, in grassland, SWC was main factor driving soil bacterial community besides urbanization and TN (Figure 3). In this study, soil SWC presents a significant decrease along the rural-suburban-urban gradient in grassland (Table 1). Previous study demonstrated that soil moisture was closely related to microbial community structure and enzyme activities, indicating that the important role of soil water availability in affecting bacterial community [62]. The significant lower moisture of urban grass soils might be due to the soil moisture evaporation caused by the urban heat island effect, as well as increase of impermeable surface in urban areas [18]. In comparison with forests, grasslands are managed more intensively, such as grazing, fertilization, irrigation, cutting or reseeding [59], which indicating that these human managements may affect soil properties, thus affect soil microbial communities in grasslands [58]. However, there are still many variables, such as vegetation composition and diversity, temperature, differences in dispersal along the rural-suburban-urban gradient, should be considered in future study to explore why forest and grass soil bacteria respond to urbanization differently. In addition, urban forests and grasslands play a positive role in alleviating the impacts of urbanization, which has multiple ecological benefits, such as regulation of urban microclimate, absorption of carbon and release of oxygen, and decrease of heat island effect [14,63]. Therefore, our data contributes to understanding the effect of urbanization on soil bacterial community, which will be helpful for effective management of urban greenspace ecosystems.

5. Conclusions

The dominant bacterial phyla in this study were Acidobacteria, Proteobacteria, Chloroflexi and Actinobacteria. The diversity of soil bacterial communities increased along the urbanization intensity gradient in both forestland and grassland, particularly in forests, where significant increases were detected. Additionally, grassland persistently showed a significantly higher bacterial diversity than forestland under each urbanization level. In addition, urbanization decreased the relative abundances of Acidobacteriales, Acidobacteriia_Subgroup_2 and Solibacterales (which all belong to Acidobacteria), and increased the relative abundances of Betaproteobacteriales, Myxococcales and Sphingomonadales (which all belong to Proteobacteria) in forestland. However, the most dominated bacterial phylum was always Proteobacteria along the rural-suburban-urban gradient in grassland. Significant decrease and increase in Nitrospirae and Latescibacteria were caused by urbanization in grassland, respectively. Furthermore, TOC, TN, C/N and urbanization were the main factors that influenced the bacterial community in forest soils, while SWC, TN and urbanization were main factors affecting soil bacterial community in the grassland. Our results suggest that the urbanization results in large and significant shifts in bacterial community composition and diversity in forestland, whereas urbanization has relatively weaker effects on grass soil bacteria, which may due to an increasing human management intensity in grass soils. Our data improve our understanding of how soil bacteria respond to urbanization in different land use types, which may provide guidelines for effective management of urban greenspace ecosystems.

Supplementary Materials

The following supporting information can be downloaded at: https://www.mdpi.com/article/10.3390/f14010038/s1. Table S1: The longitude, latitude and urbanization intensity of the 18 sample plots. RP1-RP6 represent rural plots, SP1-SP6 represent suburban plots, UP1-UP6 represent urban plots. R1, R2, R3 and R4 represent the urbanization intensity at 250 m, 1 km, 2 km and 5 km resolution, respectively. Table S2. The relative abundance of soil bacterial communities at phylum (top10) and order (top19) ranks (%). RF, SF, UF, RG, SG and UG represent rural forestland, suburban forestland, urban forestland, rural grassland, suburban grassland and urban grassland, respectively. Significant differences (p < 0.05) among treatments are shown with different letters. The differences were tested using one-way analysis of variance (ANOVA) and followed by post hoc Tukey Honestly Significant Difference (HSD) tests for significance.

Author Contributions

D.G.: Software, Formal analysis, Visualization, Writing—original draft, Writing—review and editing. N.Z.: Investigation, writing—original draft preparation, Software, Visualization. S.L.: Conceptualization, Methodology, Software, Data curation, Investigation, Funding acquisition, Project administration, Resources, Supervision, Validation, Writing—review and editing. C.N.: Investigation, Writing—review and editing. X.W.: Investigation. S.F.: Investigation. All authors have read and agreed to the published version of the manuscript.

Funding

This work was funded by research grants from the National Natural Science Foundation of China (U20A2089 and 41971152), Hunan Innovative Talent Program (2019RS1062) to SL, and the Postdoctoral Science Foundation of China (2021M693578).

Data Availability Statement

Not applicable.

Acknowledgments

The authors acknowledge the support of Zhengxi Tan for the suggestions.

Conflicts of Interest

The authors declare no conflict of interest.

References

  1. Wang, H.; Cheng, M.; Dsouza, M.; Weisenhorn, P.; Zheng, T. Soil Bacterial Diversity Is Associated with Human Population Density in Urban Greenspaces. Environ. Sci. Technol. 2018, 52, 5115–5124. [Google Scholar] [CrossRef] [PubMed] [Green Version]
  2. Zhao, S.; Zhou, D.; Zhu, C.; Qu, W.; Zhao, J.; Sun, Y.; Huang, D.; Wu, W.; Liu, S. Rates and patterns of urban expansion in China’s 32 major cities over the past three decades. Landsc. Ecol. 2015, 30, 1541–1559. [Google Scholar] [CrossRef]
  3. Grimm, N.B.; Faeth, S.H.; Golubiewski, N.E.; Redman, C.L.; Wu, J.; Bai, X.; Briggs, J.M. Global change and the ecology of cities. Science 2008, 319, 756–760. [Google Scholar] [CrossRef] [PubMed] [Green Version]
  4. Zhang, C.; Kuang, W.; Wu, J.; Liu, J.; Tian, H. Industrial land expansion in rural China threatens environmental securities. Front. Environ. Sci. Eng. 2021, 15, 29. [Google Scholar] [CrossRef]
  5. Trentanovi, G.; von der Lippe, M.; Sitzia, T.; Ziechmann, U.; Kowarik, I.; Cierjacks, A. Biotic homogenization at the community scale: Disentangling the roles of urbanization and plant invasion. Divers. Distrib. 2013, 19, 738–748. [Google Scholar] [CrossRef] [Green Version]
  6. Aronson, M.F.; La Sorte, F.A.; Nilon, C.H.; Katti, M.; Goddard, M.A.; Lepczyk, C.A.; Warren, P.S.; Williams, N.S.; Cilliers, S.; Clarkson, B. A global analysis of the impacts of urbanization on bird and plant diversity reveals key anthropogenic drivers. Proc. R. Soc. B Biol. Sci. 2014, 281, 20133330. [Google Scholar] [CrossRef]
  7. Sol, D.; Bartomeus, I.; González-Lagos, C.; Pavoine, S. Urbanisation and the loss of phylogenetic diversity in birds. Ecol. Lett. 2017, 20, 721–729. [Google Scholar] [CrossRef] [Green Version]
  8. Merckx, T.; Van Dyck, H. Urbanization-driven homogenization is more pronounced and happens at wider spatial scales in nocturnal and mobile flying insects. Glob. Ecol. Biogeogr. 2019, 28, 1440–1455. [Google Scholar] [CrossRef]
  9. Epp Schmidt, D.J.; Pouyat, R.; Szlavecz, K.; Setälä, H.; Kotze, D.J.; Yesilonis, I.; Cilliers, S.; Hornung, E.; Dombos, M.; Yarwood, S.A. Urbanization erodes ectomycorrhizal fungal diversity and may cause microbial communities to converge. Nat. Ecol. Evol. 2017, 1, 0123. [Google Scholar] [CrossRef]
  10. Stephanou, C.; Omirou, M.; Philippot, L.; Zissimos, A.M.; Christoforou, I.C.; Trajanoski, S.; Oulas, A.; Ioannides, I.M. Land use in urban areas impacts the composition of soil bacterial communities involved in nitrogen cycling. A case study from Lefkosia (Nicosia) Cyprus. Sci. Rep. 2021, 11, 8198. [Google Scholar] [CrossRef]
  11. Falkowski, P.G.; Fenchel, T.; Delong, E.F. The microbial engines that drive Earth’s biogeochemical cycles. Science 2008, 320, 1034–1039. [Google Scholar] [CrossRef] [PubMed] [Green Version]
  12. Yi, X.; Ning, C.; Feng, S.; Gao, H.; Zhao, J.; Liao, J.; Peng, Y.; Zhao, S.; Liu, S. Urbanization-induced environmental changes strongly affect wetland soil bacterial community composition and diversity. Environ. Res. Lett. 2022, 17, 014027. [Google Scholar] [CrossRef]
  13. Yan, B.; Li, J.; Xiao, N.; Qi, Y.; Fu, G.; Liu, G.; Qiao, M. Urban-development-induced changes in the diversity and composition of the soil bacterial community in Beijing. Sci. Rep. 2016, 6, 38811. [Google Scholar] [CrossRef] [Green Version]
  14. Tan, X.; Kan, L.; Su, Z.; Liu, X.; Zhang, L. The composition and diversity of soil bacterial and fungal communities along an urban-to-rural gradient in South China. Forests 2019, 10, 797. [Google Scholar] [CrossRef] [Green Version]
  15. Pereira, M.C.; O’Riordan, R.; Stevens, C. Urban soil microbial community and microbial-related carbon storage are severely limited by sealing. J. Soils Sediments 2021, 21, 1455–1465. [Google Scholar] [CrossRef]
  16. Boeraeve, M.; Honnay, O.; Jacquemyn, H. Local abiotic conditions are more important than landscape context for structuring arbuscular mycorrhizal fungal communities in the roots of a forest herb. Oecologia 2019, 190, 149–157. [Google Scholar] [CrossRef] [PubMed]
  17. Docherty, K.M.; Pearce, D.S.; Lemmer, K.M.; Hale, R.L. Distributing regionally, distinguishing locally: Examining the underlying effects of local land use on airborne bacterial biodiversity. Environ. Microbiol. 2018, 20, 3529–3542. [Google Scholar] [CrossRef] [PubMed]
  18. Xu, H.-J.; Li, S.; Su, J.-Q.; Nie, S.A.; Gibson, V.; Li, H.; Zhu, Y.-G. Does urbanization shape bacterial community composition in urban park soils? A case study in 16 representative Chinese cities based on the pyrosequencing method. FEMS Microbiol. Ecol. 2014, 87, 182–192. [Google Scholar] [CrossRef] [PubMed] [Green Version]
  19. Wang, H.; Marshall, C.; Cheng, M.; Xu, H.; Li, H.; Yang, X.; Zheng, T. Changes in land use driven by urbanization impact nitrogen cycling and the microbial community composition in soils. Sci. Rep. 2017, 7, 44049. [Google Scholar] [CrossRef]
  20. Hermans, S.M.; Buckley, H.L.; Case, B.S.; Curran-Cournane, F.; Taylor, M.; Lear, G. Using soil bacterial communities to predict physico-chemical variables and soil quality. Microbiome 2020, 8, 79. [Google Scholar] [CrossRef]
  21. Zhao, X.; Huang, J.; Lu, J.; Sun, Y. Study on the influence of soil microbial community on the long-term heavy metal pollution of different land use types and depth layers in mine. Ecotoxicol. Environ. Saf. 2019, 170, 218–226. [Google Scholar] [CrossRef] [PubMed]
  22. Chen, D.; Mi, J.; Chu, P.; Cheng, J.; Zhang, L.; Pan, Q.; Xie, Y.; Bai, Y. Patterns and drivers of soil microbial communities along a precipitation gradient on the Mongolian Plateau. Landsc. Ecol. 2015, 30, 1669–1682. [Google Scholar] [CrossRef]
  23. Drenovsky, R.E.; Steenwerth, K.L.; Jackson, L.E.; Scow, K.M. Land use and climatic factors structure regional patterns in soil microbial communities. Glob. Ecol. Biogeogr. 2010, 19, 27–39. [Google Scholar] [CrossRef] [PubMed] [Green Version]
  24. Hu, Y.; Xiang, D.; Veresoglou, S.D.; Chen, F.; Chen, Y.; Hao, Z.; Zhang, X.; Chen, B. Soil organic carbon and soil structure are driving microbial abundance and community composition across the arid and semi-arid grasslands in northern China. Soil Biol. Biochem. 2014, 77, 51–57. [Google Scholar] [CrossRef]
  25. Yergeau, E.; Bokhorst, S.; Kang, S.; Zhou, J.; Greer, C.W.; Aerts, R.; Kowalchuk, G.A. Shifts in soil microorganisms in response to warming are consistent across a range of Antarctic environments. ISME J. 2012, 6, 692–702. [Google Scholar] [CrossRef] [Green Version]
  26. Zhalnina, K.; Dias, R.; de Quadros, P.D.; Davis-Richardson, A.; Camargo, F.A.; Clark, I.M.; McGrath, S.P.; Hirsch, P.R.; Triplett, E.W. Soil pH determines microbial diversity and composition in the park grass experiment. Microb. Ecol. 2015, 69, 395–406. [Google Scholar] [CrossRef]
  27. Zhang, K.; Delgado-Baquerizo, M.; Zhu, Y.-G.; Chu, H. Space is more important than season when shaping soil microbial communities at a large spatial scale. Msystems 2020, 5, e00783-19. [Google Scholar] [CrossRef]
  28. Qi, D.; Wieneke, X.; Tao, J.; Zhou, X.; Desilva, U. Soil pH is the primary factor correlating with soil microbiome in karst rocky desertification regions in the Wushan County, Chongqing, China. Front. Microbiol. 2018, 9, 1027. [Google Scholar] [CrossRef] [Green Version]
  29. Liu, L.; Barberán, A.; Gao, C.; Zhang, Z.; Wang, M.; Wurzburger, N.; Wang, X.; Zhang, R.; Li, J.; Zhang, J. Impact of urbanization on soil microbial diversity and composition in the megacity of Shanghai. Land Degrad. Dev. 2022, 33, 282–293. [Google Scholar] [CrossRef]
  30. Nawaz, M.F.; Bourrie, G.; Trolard, F. Soil compaction impact and modelling. A review. Agron. Sustain. Dev. 2013, 33, 291–309. [Google Scholar] [CrossRef]
  31. Lu, C.; Kotze, D.J.; Setälä, H.M. Soil sealing causes substantial losses in C and N storage in urban soils under cool climate. Sci. Total Environ. 2020, 725, 138369. [Google Scholar] [CrossRef] [PubMed]
  32. Li, Y.; Fan, L.; Zhang, W.; Zhu, X.; Lei, M.; Niu, L. How did the bacterial community respond to the level of urbanization along the Yangtze River? Environ. Sci. Process. Impacts 2020, 22, 161–172. [Google Scholar] [CrossRef] [PubMed]
  33. Elvidge, C.D.; Tuttle, B.T.; Sutton, P.S.; Baugh, K.E.; Howard, A.T.; Milesi, C.; Bhaduri, B.L.; Nemani, R. Global distribution and density of constructed impervious surfaces. Sensors 2007, 7, 1962–1979. [Google Scholar] [CrossRef] [PubMed]
  34. Hu, Y.; Dou, X.; Li, J.; Li, F. Impervious surfaces alter soil bacterial communities in urban areas: A case study in Beijing, China. Front. Microbiol. 2018, 9, 226. [Google Scholar] [CrossRef] [PubMed]
  35. Devi, N.B.; Yadava, P. Seasonal dynamics in soil microbial biomass C, N and P in a mixed-oak forest ecosystem of Manipur, North-east India. Appl. Soil Ecol. 2006, 31, 220–227. [Google Scholar] [CrossRef]
  36. Anderson, J.M.; Ingram, J.S. Tropical soil biology and fertility: A handbook of methods. Soil Sci. 1994, 157, 265. [Google Scholar] [CrossRef]
  37. Bremner, J.; Mulvaney, C. Total nitrogen. In Methods of Soil Analysis. Part 2. Chemical and Microbiological Methods; Page, A.L., Ed.; American Society of Agronomy: Madison, WI, USA, 1982. [Google Scholar]
  38. Sparling, G.; Whale, K.; Ramsay, A. Quantifying the contribution from the soil microbail biomass to the extractable P levels of fresh and air-dried soils. Soil Res. 1985, 23, 613–621. [Google Scholar] [CrossRef]
  39. Kalembasa, S.J.; Jenkinson, D.S. A comparative study of titrimetric and gravimetric methods for the determination of organic carbon in soil. J. Sci. Food Agric. 1973, 24, 1085–1090. [Google Scholar] [CrossRef]
  40. Luo, X.-S.; Xue, Y.; Wang, Y.-L.; Cang, L.; Xu, B.; Ding, J. Source identification and apportionment of heavy metals in urban soil profiles. Chemosphere 2015, 127, 152–157. [Google Scholar] [CrossRef]
  41. Caporaso, J.G.; Lauber, C.L.; Walters, W.A.; Berg-Lyons, D.; Lozupone, C.A.; Turnbaugh, P.J.; Fierer, N.; Knight, R. Global patterns of 16S rRNA diversity at a depth of millions of sequences per sample. Proc. Natl. Acad. Sci. USA 2011, 108 (Suppl. 1), 4516–4522. [Google Scholar] [CrossRef]
  42. Edgar, R.C.; Haas, B.J.; Clemente, J.C.; Quince, C.; Knight, R. UCHIME improves sensitivity and speed of chimera detection. Bioinformatics 2011, 27, 2194–2200. [Google Scholar] [CrossRef] [PubMed] [Green Version]
  43. Edgar, R.C. UPARSE: Highly accurate OTU sequences from microbial amplicon reads. Nat. Methods 2013, 10, 996–998. [Google Scholar] [CrossRef] [PubMed]
  44. Oksanen, J.; Blanchet, F.; Kindt, R.; Legendre, P.; Minchin, P.; O’Hara, R.; Simpson, G.; Solymos, P.; Stevens, M.; Szoecs, E. Vegan: Community Ecology Package R Package Version 2 2-1. 2015. Available online: https://cran.r-project.org/web/packages/vegan/index.html (accessed on 15 February 2021).
  45. Eisenhauer, N.; Bowker, M.A.; Grace, J.B.; Powell, J.R. From patterns to causal understanding: Structural equation modeling (SEM) in soil ecology. Pedobiologia 2015, 58, 65–72. [Google Scholar] [CrossRef] [Green Version]
  46. Dray, S.; Pélissier, R.; Couteron, P.; Fortin, M.-J.; Legendre, P.; Peres-Neto, P.R.; Bellier, E.; Bivand, R.; Blanchet, F.G.; De Cáceres, M. Community ecology in the age of multivariate multiscale spatial analysis. Ecol. Monogr. 2012, 82, 257–275. [Google Scholar] [CrossRef]
  47. Grace, J.B. Structural equation modeling for observational studies. J. Wildl. Manag. 2008, 72, 14–22. [Google Scholar] [CrossRef]
  48. Barrico, L.; Castro, H.; Coutinho, A.P.; Gonçalves, M.T.; Freitas, H.; Castro, P. Plant and microbial biodiversity in urban forests and public gardens: Insights for cities’ sustainable development. Urban For. Urban Green. 2018, 29, 19–27. [Google Scholar] [CrossRef]
  49. Comte, J.; Del Giorgio, P.A. Linking the patterns of change in composition and function in bacterioplankton successions along environmental gradients. Ecology 2010, 91, 1466–1476. [Google Scholar] [CrossRef]
  50. Zhang, Y.; Cong, J.; Lu, H.; Yang, C.; Yang, Y.; Zhou, J.; Li, D. An integrated study to analyze soil microbial community structure and metabolic potential in two forest types. PLoS ONE 2014, 9, e93773. [Google Scholar] [CrossRef]
  51. Kuypers, M.M.; Marchant, H.K.; Kartal, B. The microbial nitrogen-cycling network. Nat. Rev. Microbiol. 2018, 16, 263–276. [Google Scholar] [CrossRef]
  52. Gill, A.S.; Lee, A.; McGuire, K.L. Phylogenetic and functional diversity of total (DNA) and expressed (RNA) bacterial communities in urban green infrastructure bioswale soils. Appl. Environ. Microbiol. 2017, 83, e00287-17. [Google Scholar] [CrossRef]
  53. Gao, X.; Gu, Y.; Xie, T.; Zhen, G.; Huang, S.; Zhao, Y. Characterization and environmental risk assessment of heavy metals in construction and demolition wastes from five sources (chemical, metallurgical and light industries, and residential and recycled aggregates). Environ. Sci. Pollut. Res. 2015, 22, 9332–9344. [Google Scholar] [CrossRef] [PubMed] [Green Version]
  54. Yuan, Y.; Si, G.; Wang, J.; Luo, T.; Zhang, G. Bacterial community in alpine grasslands along an altitudinal gradient on the Tibetan Plateau. FEMS Microbiol. Ecol. 2014, 87, 121–132. [Google Scholar] [CrossRef] [PubMed] [Green Version]
  55. Kaiser, K.; Wemheuer, B.; Korolkow, V.; Wemheuer, F.; Nacke, H.; Schöning, I.; Schrumpf, M.; Daniel, R. Driving forces of soil bacterial community structure, diversity, and function in temperate grasslands and forests. Sci. Rep. 2016, 6, 33696. [Google Scholar] [CrossRef] [PubMed] [Green Version]
  56. Nacke, H.; Thürmer, A.; Wollherr, A.; Will, C.; Hodac, L.; Herold, N.; Schöning, I.; Schrumpf, M.; Daniel, R. Pyrosequencing-based assessment of bacterial community structure along different management types in German forest and grassland soils. PLoS ONE 2011, 6, e17000. [Google Scholar] [CrossRef] [PubMed] [Green Version]
  57. Poeplau, C. Grassland soil organic carbon stocks along management intensity and warming gradients. Grass Forage Sci. 2021, 76, 186–195. [Google Scholar] [CrossRef]
  58. Leff, J.W.; Jones, S.E.; Prober, S.M.; Barberán, A.; Borer, E.T.; Firn, J.L.; Harpole, W.S.; Hobbie, S.E.; Hofmockel, K.S.; Knops, J.M.H.; et al. Consistent responses of soil microbial communities to elevated nutrient inputs in grasslands across the globe. Proc. Natl. Acad. Sci. USA 2015, 112, 10967–10972. [Google Scholar] [CrossRef] [Green Version]
  59. Gao, D.; Sheng, R.; Moreira-Grez, B.; Liu, S.; Xu, R.; Li, K.; Wei, W. Influences of phosphorus and potassium deficiencies on the methanotrophic communities in rice rhizosphere. Appl. Soil Ecol. 2022, 170, 104265. [Google Scholar] [CrossRef]
  60. Mosier, A.C.; Francis, C.A. Relative abundance and diversity of ammonia--oxidizing archaea and bacteria in the San Francisco Bay estuary. Environ. Microbiol. 2008, 10, 3002–3016. [Google Scholar] [CrossRef]
  61. Wu, Y.; Song, Q.; Wu, J.; Zhou, J.; Zhou, L.; Wu, W. Field study on the soil bacterial associations to combined contamination with heavy metals and organic contaminants. Sci. Total Environ. 2021, 778, 146282. [Google Scholar] [CrossRef]
  62. Brockett, B.F.; Prescott, C.E.; Grayston, S.J. Soil moisture is the major factor influencing microbial community structure and enzyme activities across seven biogeoclimatic zones in western Canada. Soil Biol. Biochem. 2012, 44, 9–20. [Google Scholar] [CrossRef]
  63. Gao, X.; Huang, R.; Li, J.; Wang, C.; Lan, T.; Li, Q.; Deng, O.; Tao, Q.; Zeng, M. Temperature induces soil organic carbon mineralization in urban park green spaces, Chengdu, southwestern China: Effects of planting years and vegetation types. Urban For. Urban Green. 2020, 54, 126761. [Google Scholar] [CrossRef]
Figure 1. Map of sampling sites along the rural-suburban-urban gradient in Chang-Zhu-Tan agglomeration. The yellow triangles represent rural areas, black triangles represent suburb areas, and green triangles represent urban areas.
Forests 14 00038 g001
Figure 2. Box plot indicating bacterial alpha diversity indexes of richness (a), Shannon (b), chao1 (c) and Simpson (d) in different land cover categories. * p < 0.05, ** p < 0.01, ‘ns’ represent no significant difference. The box plot shows the percentiles of 25, 50 and 75. The upper limit of the box chart does not exceed 1.5 quartile value, and the lower limit is at least 1.5 quartile value. RF, SF, UF, RG, SG and UG represent rural forestland, suburban forestland, urban forestland, rural grassland, suburban grassland and urban grassland, respectively.
Forests 14 00038 g002
Figure 3. Relative abundance of the bacterial community at the phylum (a) and order (b) level along the rural-suburban-urban gradient; and the non-metric multidimensional scaling (NMDS) analysis of the bacterial community in forestland (c) and grassland (d) at the OTU level. Groups with <1% sequence number were merged into the “Others” taxa. RF, SF, UF, RG, SG and UG represent rural forestland, suburban forestland, urban forestland, rural grassland, suburban grassland and urban grassland, respectively.
Forests 14 00038 g003
Figure 4. Distance based redundancy analysis (db-RDA) showing the relationships between bacterial communities and environmental factors in forestland (a) and grassland (b) at the OTU level. RF, SF, UF, RG, SG and UG represent rural forestland, suburban forestland, urban forestland, rural grassland, suburban grassland and urban grassland, respectively.
Forests 14 00038 g004
Figure 5. Structural equation model (SEM) of soil environmental factors effects on bacterial diversity and dominant group abundance in forestland (a) and grassland (b). Green and red arrows represent positive and negative effects, respectively, with the thickness indicating the extent of influence. Values associated with the arrows represent standardized path coefficients. Spatial, spatial variables; soil, soil nutrients; metal, soil heavy metals; urban, urbanization intensity; Acidobacteria, relative abundance of Acidobacteria; Proteobacteria, relative abundance of Acidobacteria; R1, R2, R3, and R4 represent the 250 m, 1 km, 2 km, and 5 km resolutions in the calculation of urbanization intensity, respectively.
Forests 14 00038 g005
Table 1. Soil properties in forestland and grassland along the rural-suburban-urban gradient (mean ± SE, n = 6).
ForestlandGrassland
U1U2U3U1U2U3
pH/6.15 ± 0.28 ab6.67 ± 0.21 a6.75 ± 0.18 a6.54 ± 0.17 a6.79 ± 0.17 a6.85 ± 0.17 a
TOCg/kg19.46 ± 1.0 a15.49 ± 0.94 b13.1 ± 1.13 bc14.71 ± 1.14 b14.58 ± 1.06 bc11.80 ± 0.71 c
TNg/kg2.00 ± 0.15 a1.46 ± 0.12 bc1.44 ± 0.11 bc1.71 ± 0.16 ab1.29 ± 0.1 c1.18 ± 0.11 c
TPg/kg0.83 ± 0.110.71 ± 0.080.86 ± 0.120.85 ± 0.060.75 ± 0.090.73 ± 0.08
C/N/10.36 ±0.58 ab11.62 ± 0.72 ab9.17 ± 0.63 b9.39 ± 0.96 ab12.04 ± 1.03 a11.03 ± 1.1 ab
N/P/2.74 ± 0.19 a2.55 ± 0.39 a1.96 ± 0.22 ab2.17 ± 0.22 a1.93 ± 0.17 ab2.53 ± 0.98 a
SWC%17.4 ± 0.94 ab16.3 ± 0.8 b16.3 ± 0.91 b18.94 ± 1.76 a17.22 ± 0.65 ab15.6 ± 0.53 b
SMBNmg/kg14.82 ± 2.7812.69 ± 2.0610.94 ± 2.4714.52 ± 2.1512.86 ± 2.7413.08 ± 2.72
SMBPmg/kg0.35 ± 0.080.49 ± 0.2040.32 ± 0.130.31 ± 0.070.76 ± 0.330.31 ± 0.07
Asmg/kg53.86 ± 0.8355.34 ± 0.73855.71 ± 1.0554.14 ± 0.7455.98 ± 0.9554.61 ± 0.55
Cdmg/kg0.71 ± 0.01 b0.76 ± 0.02 ab0.88 ± 0.06 a0.74 ± 0.02 b0.76 ± 0.02 ab0.81 ± 0.03 ab
Crmg/kg243.84 ± 2.22252.74 ± 2.87247.12 ± 3.16252.1 ± 3.92254.26 ± 3.28246.4 ± 2.6
Cumg/kg98.3 ± 2.3101.01 ± 1.7899.79 ± 1.9103.47 ± 2.78103.51 ± 2.2597.18 ± 1.45
Mnmg/kg425.14 ± 47.9460.79 ± 32.73480.27 ± 32.01498.61 ± 39.96494.69 ± 45.21450.89 ± 37.63
Nimg/kg106.69 ± 1.43 b112.15 ± 1.46 ab111.37 ± 1.69 ab110.78 ± 1.77 a112.8 ± 1.38 ab111.1 ± 2.19 ab
Pbmg/kg117.12 ± 2.36 b120.79 ± 2.11 b135.18 ± 7.5 a119.31 ± 2.9 b120.4 ± 3.01 b119.22 ± 3.24 b
Znmg/kg348.2 ± 6.78 b361.26 ± 7.16 b396.87 ± 18.54 a365.68 ± 9.51 ab369.01 ± 9.88 ab370.42 ± 10.67 ab
U1, U2 and U3 represent urbanisation intensity coefficients of rural, suburban and urban sites, respectively; C/N represents the ratio of TOC:TN; N/P represents the ratio of TN:TP; SWC represents soil water content. Significant differences (p < 0.05) along the urbanization intensity gradient are shown with different letters.
Disclaimer/Publisher’s Note: The statements, opinions and data contained in all publications are solely those of the individual author(s) and contributor(s) and not of MDPI and/or the editor(s). MDPI and/or the editor(s) disclaim responsibility for any injury to people or property resulting from any ideas, methods, instructions or products referred to in the content.

