Article

Occurrence Prediction of Western Conifer Seed Bug (Leptoglossus occidentalis: Coreidae) and Evaluation of the Effects of Climate Change on Its Distribution in South Korea Using Machine Learning Methods

1
Department of Biology, College of Sciences, Kyung Hee University, Dongdaemun, Seoul 02447, Republic of Korea
2
Division of Life Sciences, Incheon National University, Yeonsu, Incheon 22012, Republic of Korea
*
Author to whom correspondence should be addressed.
Forests 2023, 14(1), 117; https://doi.org/10.3390/f14010117
Submission received: 12 October 2022 / Revised: 24 December 2022 / Accepted: 5 January 2023 / Published: 8 January 2023
(This article belongs to the Special Issue Management of Forest Pests and Diseases II)

Abstract

:
The western conifer seed bug (WCSB; Leptoglossus occidentalis) causes huge ecological and economic problems as an alien invasive species in forests. In this study, a species distribution model (SDM) was developed to evaluate the potential occurrence of the WCSBs and the effects of climate on WCSB distribution in South Korea. Based on WCSB occurrence and environmental data, including geographical and meteorological variables, SDMs were developed with maximum entropy (MaxEnt) and random forest (RF) algorithms, which are machine learning methods, and they showed good performance in predicting WCSB occurrence. On the potential distribution map of WCSBs developed by the model ensemble with integrated MaxEnt and RF models, the WCSB occurrence areas were mostly located at low altitudes, near roads, and in urban areas. Additionally, environmental factors associated with anthropogenic activities, such as roads and night lights, strongly influenced the occurrence and dispersal of WCSBs. Metropolitan cities and their vicinities in South Korea showed a high probability of WCSB occurrence. Furthermore, the occurrence of WCSBs in South Korea is predicted to intensify in the future owing to climate change.

1. Introduction

The invasion of alien species has increased worldwide due to international exchange and global warming [1,2]. Biological or ecological disturbance due to invasive alien species induces severe damage to native species, ecosystems, and human societies [3,4,5]. Furthermore, invasive alien species become notorious pests in their settlement areas [6,7] and result in biodiversity loss [8].
At present, the western conifer seed bug (WCSB; Leptoglossus occidentalis Heidemann, 1910) (Hemiptera, Coreidae) has been causing problems all over the world as invasive species. It is native species in north-western America [9]. However, WCSB has been dispersed worldwide from east America to Asia [10,11]. Due to the damage caused by WCSBs to coniferous trees [11,12], various ecological and economic problems arise. Reductions in seed up to 41% in the forest of Douglas fir (Pseudotsuga menziesii) were reported due to WCSBs [13,14]. In South Korea, since WCSBs were first observed in 2010, their distribution has expanded to a nationwide scale, inducing an economic decrease in pine nuts [15]. Additionally, the damage caused by WCSBs will increase because of climate change. Climate change affects the natural environment, population dynamics of species, and dispersal of alien species [16,17,18]. Many studies have reported that the distribution area of alien species will expand due to climate change, and the damage will also increase [19,20].
The species distribution model (SDM), also known as the ecological niche model, is commonly used to predict distribution of a target species and their habitat suitability [21]. Initially, the SDM was mainly used to reveal ecological insights, such as relationships between species and the environment, and important factors for species occurrence. However, with recent advances in computational algorithms, it is widely used for the prediction of species distribution and variations due to climate change [22]. The SDM plays an important role in the decision-making process, contributing to the establishment and development of response strategies for invasive species and ecosystem management [23,24,25]. Recently, it has been reported that among the various SDMs, machine learning methods have shown good performance in the prediction of potential distributions of diverse species and the effects of climate change [19,26].
As the damage caused by WCSBs and their dispersal has intensified in South Korea, it is necessary to establish countermeasures. In this study, to contribute to the development of management and control strategies for WCSBs, the occurrence patterns of WCSBs in South Korea were evaluated, and the potential WCSB distribution areas in the present and future were predicted using the SDM with machine learning methods.

2. Materials and Methods

2.1. Ecological Characteristics of WCSB

WCSB, which is native to western North America [9] has three life stages: egg, 1st–5th nymphs, and adult, taking approximately 40 days from hatching to adulthood [12]. The body length of WCSB adults is approximately 20 mm, and their color is reddish-brown or gray-brown [27]. The WCSB feeds on the cone of pine trees (mainly genus Pinus) using its sting. WCSB adults overwinter under tree bark or in artificial structures, such as buildings [28]. Recently, it has been reported that the 5th nymph can overwinter, although only a few survive [29].

2.2. Data Collection

The occurrence records of WCSBs in South Korea were collected from the literature [12,27,28], field surveys, and the online database of the Global Biodiversity Information Facility [30]. To avoid spatial sampling bias, through spatial filtering (also called spatial rarefying) using a 5 km × 5 km grid scale, 90 WCSB occurrence sites were obtained (Figure 1).
In this study, 23 environmental variables in three categories were collected: geographical variables (elevation and slope), meteorological variables (nineteen bioclimatic variables), and anthropogenic variables (night light and distance to the road).
Elevation and slope maps were obtained from the National Geographic Information Institute (https://www.ngii.go.kr accessed on 19 March 2021) of South Korea. Meteorological data for historical climate (1970–2000 as climatological normal) were obtained from WorldClim (https://www.worldclim.org accessed on 30 August 2022). In the WorldClim version 2 dataset [31], nineteen bioclimatic variables with a resolution of 30 s (approximately 820 m in South Korea) were collected. These data had an average value for historical years and were considered to represent present climate conditions. In addition, for future climate data, we obtained climate change scenario data in South Korea for 2021–2040 (near future) and 2061–2080 (far future) based on shared socioeconomic pathway scenario data (SSP1-2.6 and SSP5-8.5) with MIROC6 global climate models from WorldClim [32]. WorldClim provided future climate data as an average over 20 years.
A map of night lights was provided by the National Aeronautics and Space Administration of the U.S.A. (https://earthobservatory.nasa.gov/features/NightLights accessed on 6 July 2021). We used a grayscale night light map for 2016 (region number D1). Distance to road refers to the distance from each location to the nearest road and was measured on a road map combining road data from the Korea Transport Database (https://www.ktdb.go.kr accessed on 7 April 2021) and the Intelligent Transport Systems of Standard Node Link (https://www.its.go.kr accessed on 5 April 2021) in South Korea.
All variables were used in the raster format in the geographical information system software [33]. The resolution of all maps was changed to 30 m × 30 m, and the coordinate reference system in GIS was Korea 2000/Central Belt 2010 (EPSG 5186).

2.3. Data Preprocessing and Analysis of Environmental Characteristics

In this study, eight selected variables were used to avoid multicollinearity among the whole environmental variables: elevation, slope, night light, distance to road, the maximum temperature of the warmest month (Bio5), the minimum temperature of the coldest month (Bio6), annual precipitation (Bio12), and precipitation of the driest month (Bio14). These variables were selected considering the value of Pearson’s correlation coefficient (r < 0.9) and variation inflation factor (VIF < 5). Although isothermality (Bio3) was also passed, we excluded Bio3 based on the ecological characteristics of WCSB, low variation in South Korea, and other studies on the SDM of WCSB [10,29,34].
To develop an SDM for WCSBs, the data on the presence and absence of WCSBs were necessary. However, because the occurrence data of WCSBs only had the presence (P) sites of WCSBs, pseudo-absence (A) sites were produced through the following steps: (1) make A sites three times as many as the number of P sites, (2) remove sites within 1 km from the P sites, (3) remove A sites within 10 km of A sites, and (4) select as many A sites as P sites. The environmental dataset was constructed by extracting environmental values from each digital environmental map based on the coordinates of sites P and A of the WCSBs. After removing A and P sites with missing values, a total of 162 WCSB sites were used in this study (81 sites each).
A nonparametric statistical test, the Mann–Whitney U test, was used to identify the differences in environmental characteristics that determine WCSB occurrence by comparing the environment between sites P and A. Additionally, Spearman’s correlation test was used to analyze the relationship between the environment and WCSB occurrence sites.

2.4. Development of SDM for WCSB

In this study, SDMs were developed to estimate the potential occurrence of WCSBs on a nationwide scale in South Korea. Two machine learning algorithms were used for the development of the SDM based on the environmental condition of the WCSB: the random forest (RF) model and the maximum entropy (MaxEnt) model. The RF model evaluates the relationships among a large number of potential predictor variables and a response variable [35] and shows good performance for ecological data [6]. In addition, the MaxEnt model has frequently been used to predict the potential distribution and habitat suitability of species with good performance [36,37].
In both the RF and MaxEnt models, the response variable was WCSB occurrence and the explanatory variables were the eight selected environmental variables. The dataset was divided into two parts in a ratio of 8:2 for training and testing the SDM. To avoid dataset bias, 10 training-test datasets were generated by sampling without replacement. Thus, both models were repeated ten times, and the final result of each SDM was calculated as the average of the repetition results. During the modeling process, each SDM was developed using the best hyperparameters through grid optimization. Finally, the ensemble results and potential distribution map of the WCSBs were obtained by integrating the outputs of the RF and MaxEnt models.
The area under the receiver operating characteristic curve (AUROC) and accuracy characteristic curve were used to evaluate the performance of each model. To calculate the accuracy value, SDM output, the occurrence probability ranging between 0 and 1 was transformed into binary data (0 or 1) using the cutoff value. The cutoff value was determined when the sum of the sensitivity and specificity of the model was the highest [38].
Variable importance in the SDM was evaluated by the mean decrease in node impurity by the residual sum of squares in the RF model [39] and percent contribution by calculating the change in gain in the MaxEnt model [40]. To compare the variable importance between the two models, the importance of each model was changed to the importance rank and compared. Furthermore, the marginal effect of the explanatory variables on the predicted probability was represented using partial dependence plots (PDPs). The PDPs were interpreted as the average influence and trend of each variable on the prediction result of the SDM. In the PDPs, regression curves were drawn using the local regression method (LOESS).
The future occurrence risks of WCSBs due to climate change were evaluated using SDMs. Using near and far future climate data, we predicted the future occurrence probability of WCSBs and integrated them to produce the final risk map. Based on the predicted future occurrence of WCSBs, we analyzed the effects of climate change on WCSB occurrence and areas vulnerable to climate change in South Korea.
All analyses and modeling were conducted on the R program (version 4.1.0; R Core Team [41]) using specific packages: package “stats [41]” for Mann–Whitney U test, correlation analysis, and LOESS, package “raster [42]” to treat GIS map in R, package “dismo [43]” for the process of SDM, package “randomForest [39]” to perform the RF modeling, and package “ROCR [44]” to calculate AUROC value. MaxEnt software (version 3.4.1, Phillips, et al. [45]) was used for MaxEnt modeling in R.

3. Results

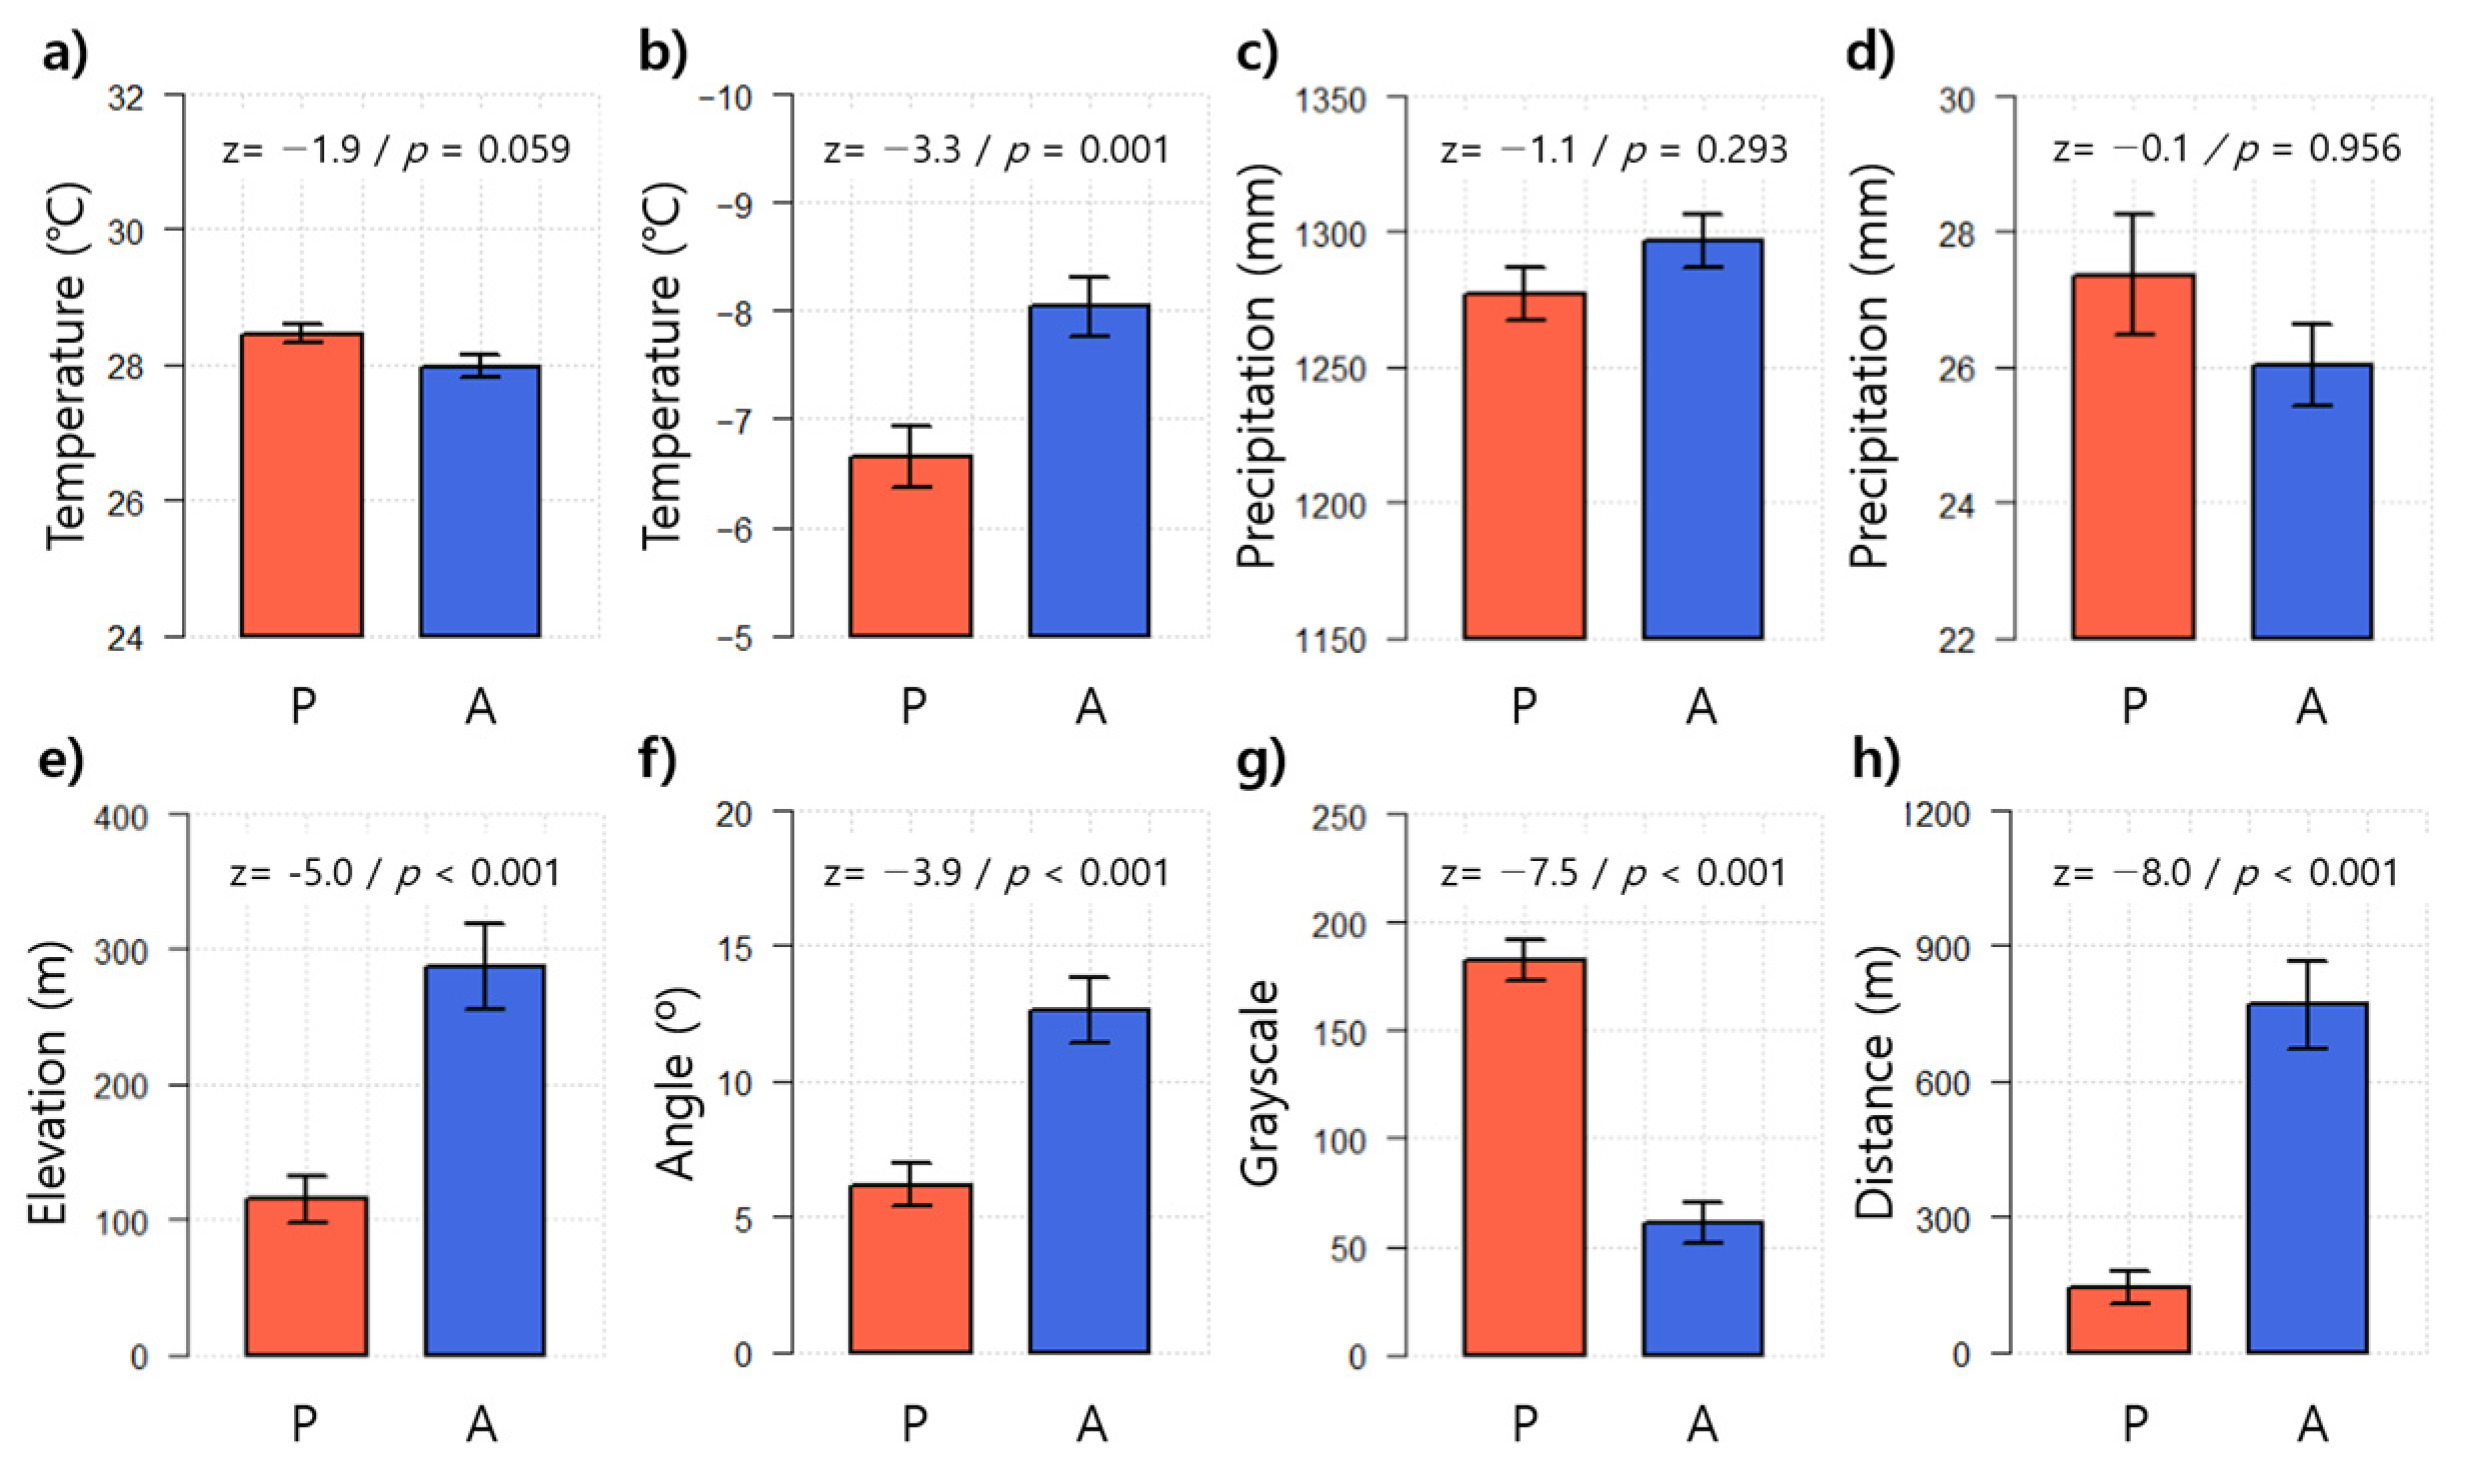
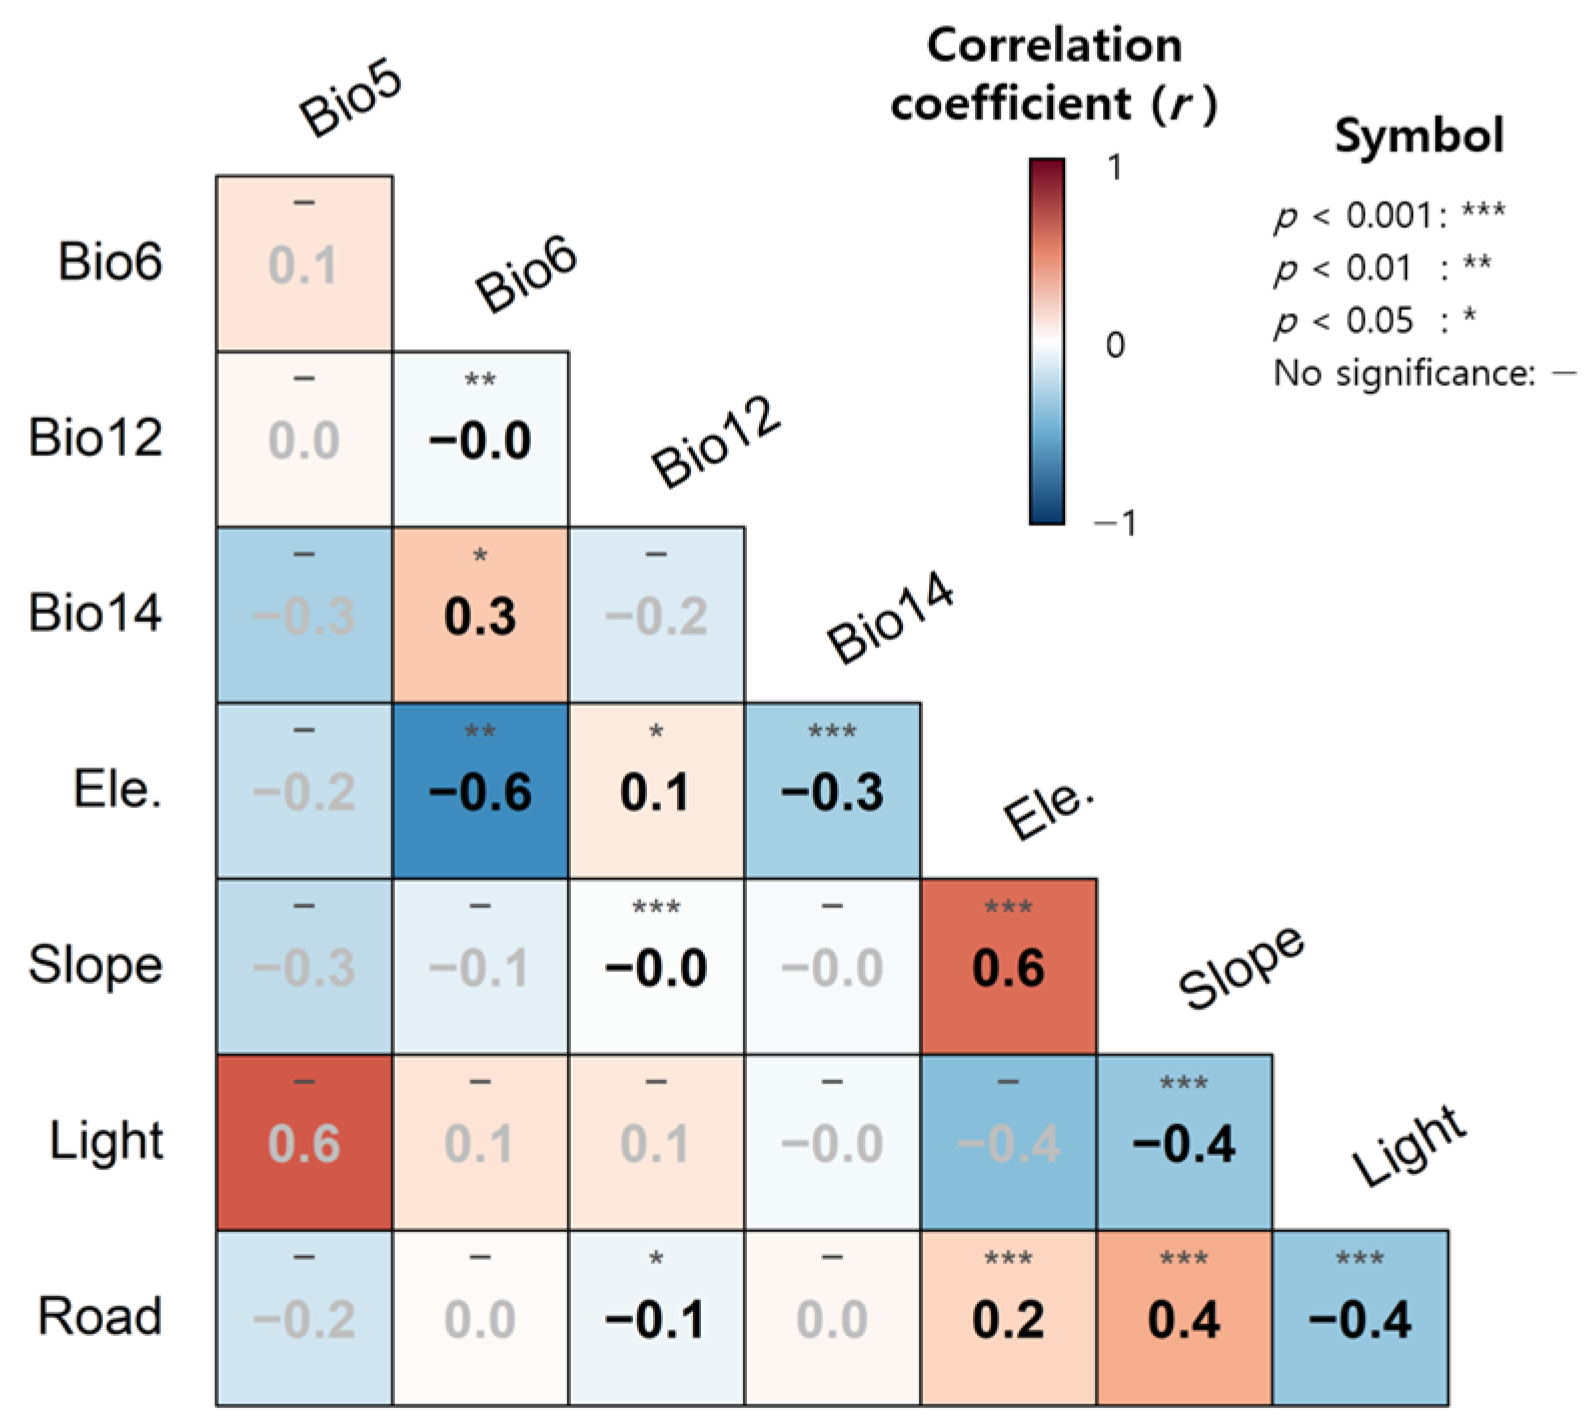
3.1. Environmental Characteristics of WCSB Occurrence

In South Korea, the meteorological conditions of WCSB habitats were that the maximum temperature of the warmest month (Bio5) was 28.5 ± 0.1 °C (mean ± standard error), minimum temperature of the coldest month (Bio6) was −6.7 ± 0.3 °C, annual precipitation (Bio12) was 1276.9 ± 9.6 mm, and precipitation of driest month (Bio14) was 27.4 ± 0.9 mm. In addition, the occurrence sites of WCSBs were located in areas where the elevation was 114.9 ± 8.9 m, slope was 6.2 ± 0.8°, night light was 93.2 ± 5.9 grayscale, and distance to the road was 145.0 ± 36.1 m.
Environmental variables, including geographical and anthropogenic factors, showed statistically significant differences between the presence and absence sites of WCSBs (Mann–Whitney U test, p-value < 0.05; Figure 2). Although some meteorological variables were not different, significant differences were found in five variables (minimum temperature of coldest month, elevation, slope, night light, and distance to road).
Furthermore, using nonparametric correlation analysis, some strong relationships between environmental conditions were found in the WCSB habitats (Figure 3). Strongly positive relationships (r > 0.5, p < 0.05) were observed between elevation and slope. Strongly negative relationships (r < −0.5, p < 0.05) also appeared between the minimum temperature of the coldest month (Bio6) and elevations.

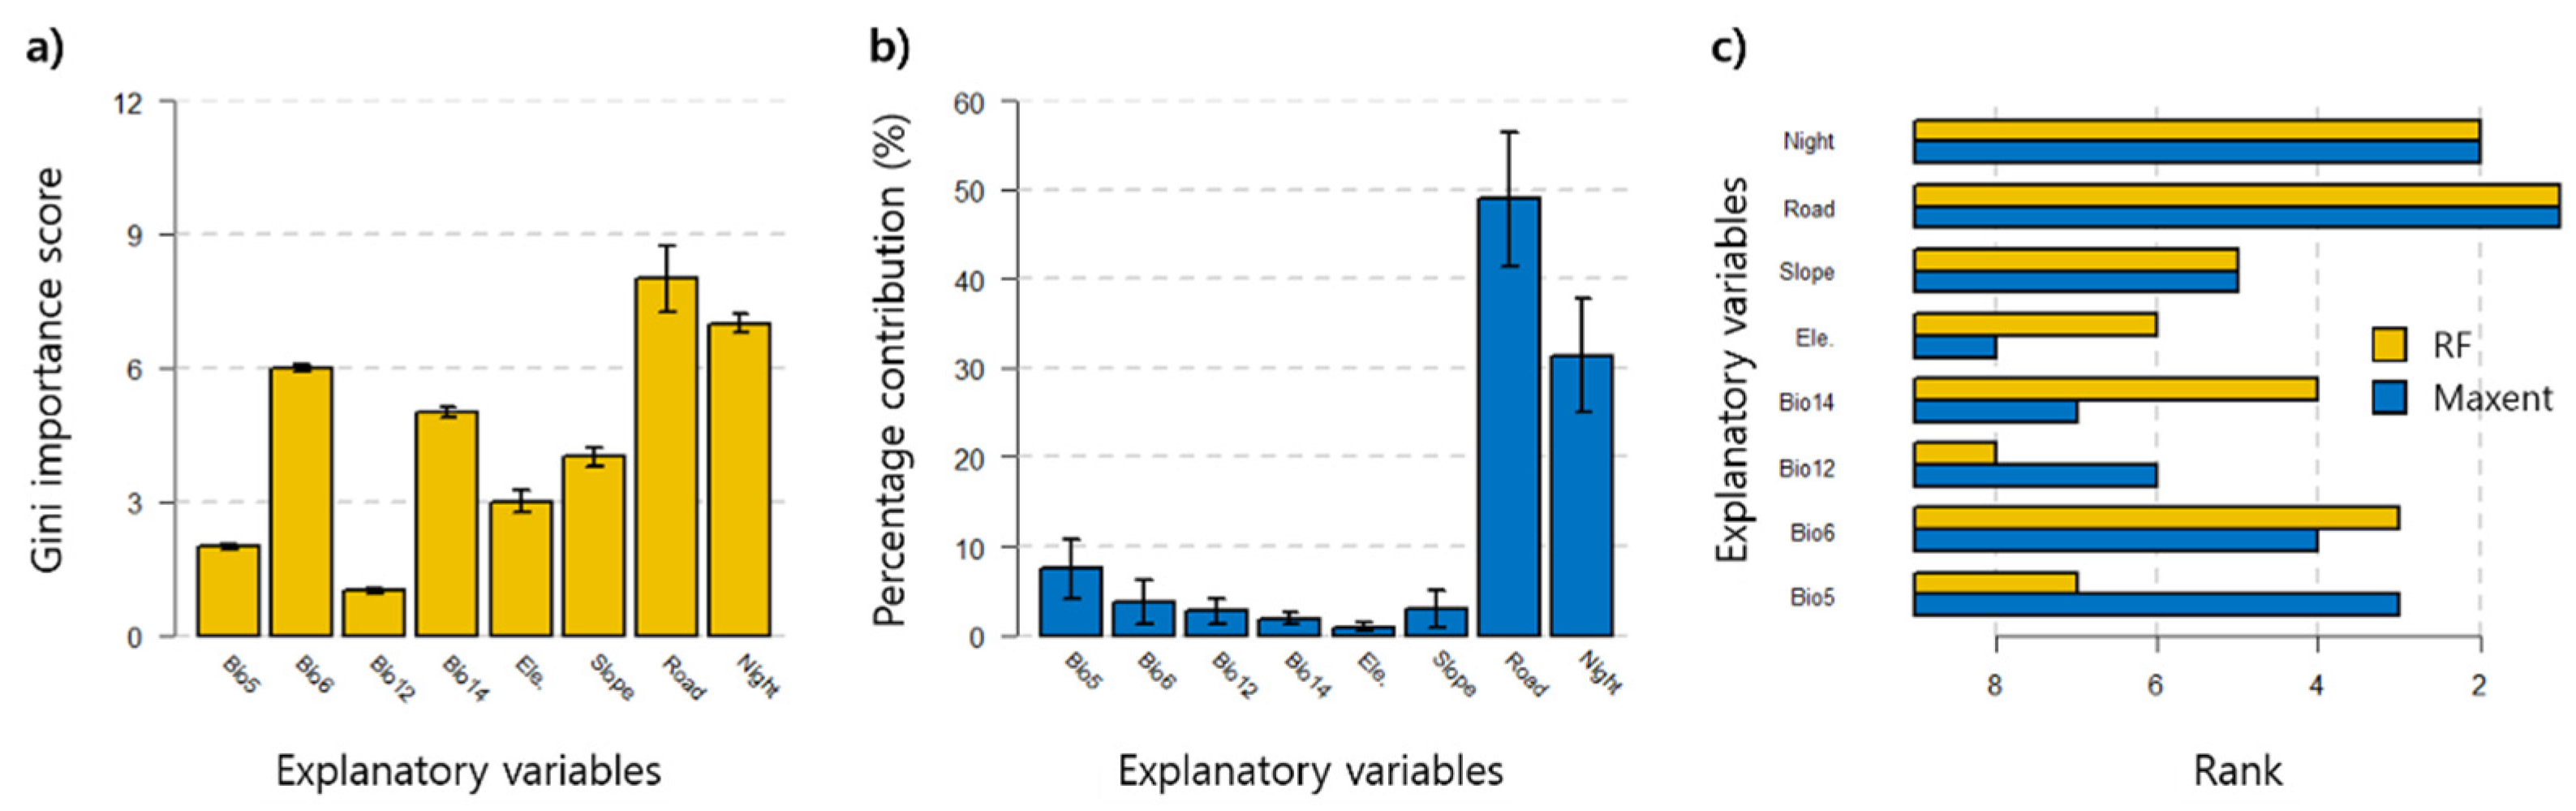
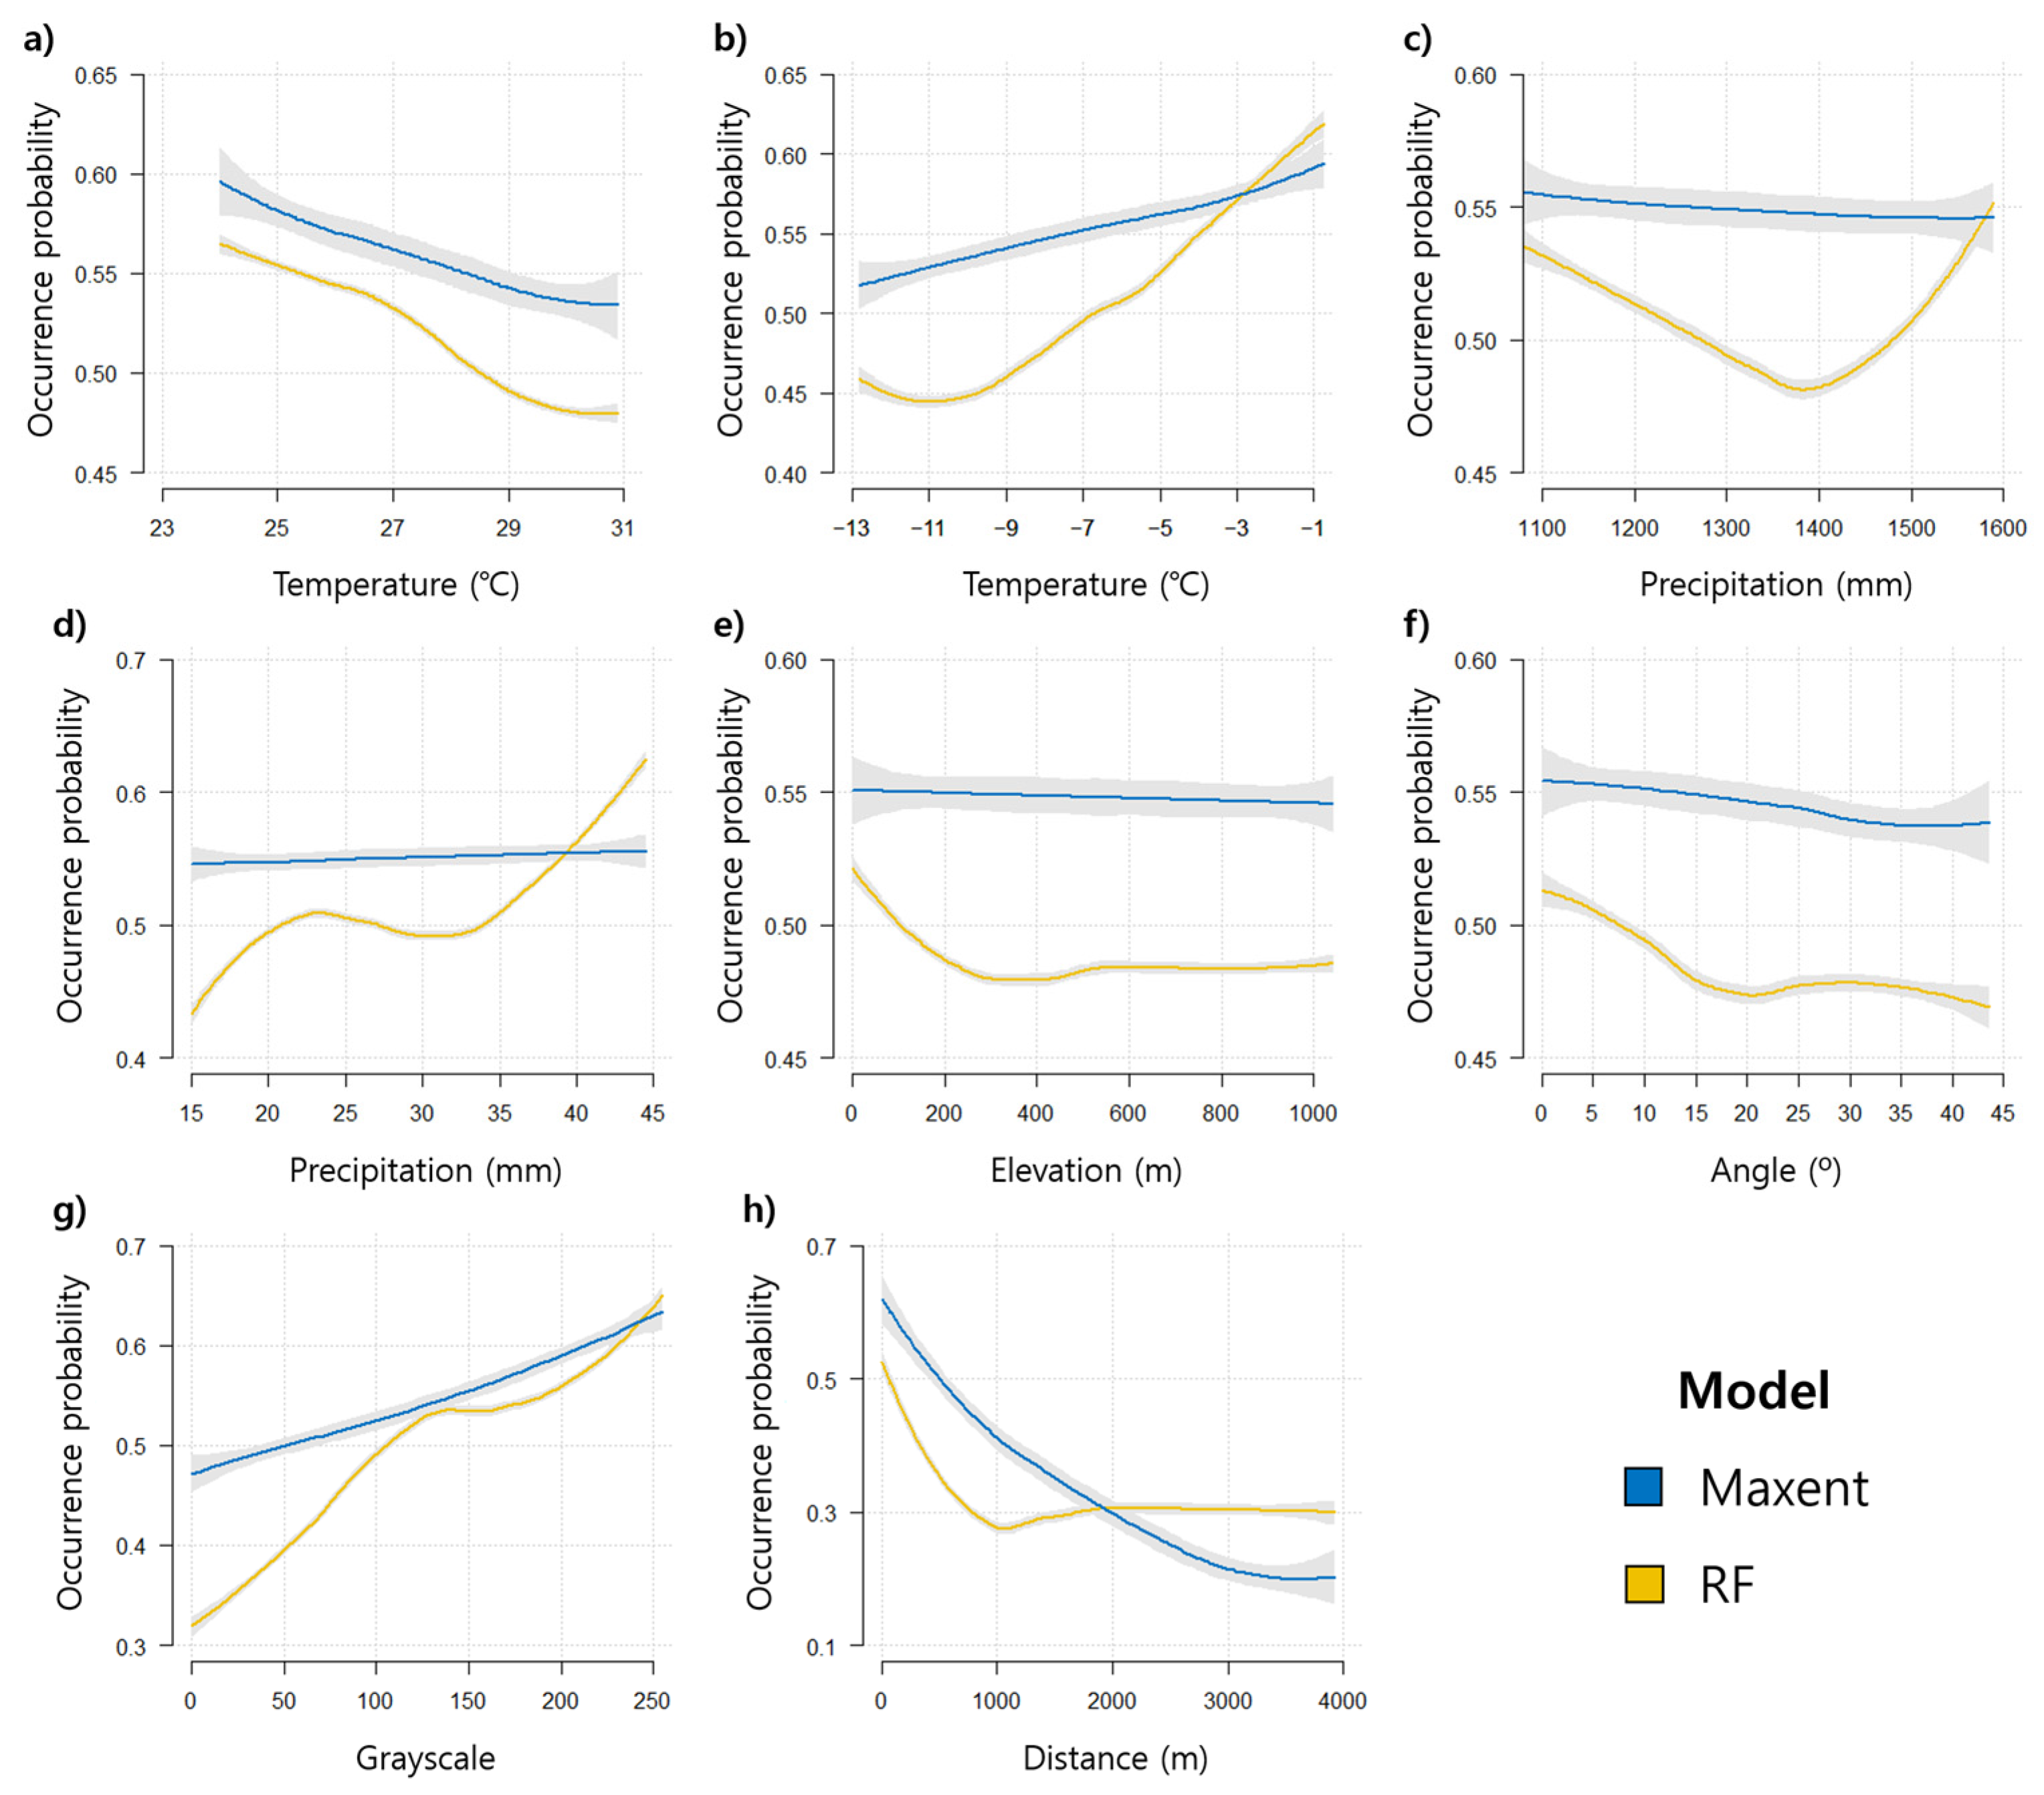
3.2. Prediction of WCSB Occurrence Using SDMs

The RF and MaxEnt models predicted the potential occurrence areas of WCSBs based on environmental conditions. Both SDMs showed good predictability (mean ± standard error) with accuracies of 0.863 ± 0.016 and 0.856 ± 0.016, respectively, in the RF and MaxEnt models, and 0.888 ± 0.015 and 0.889 ± 0.018 of AUROC, respectively, in the RF and MaxEnt models.
The major variables affecting WCSB prediction differed between the two models (Figure 4). Although both SDMs presented the anthropogenic variables (i.e., distance to road and night light) as the most important variables for predicting WCSB occurrence, the influence of these variables was very large compared to other variables in the MaxEnt model. However, in the RF model, the minimum temperature of the coldest month (Bio6) and the precipitation of the driest month (Bio14) were also influential. These differences of variable importance between SDMs are displayed in the importance ranks (Figure 4c). As described above, although the first and second most important variables were the same in both the RF and MaxEnt models, the influential variables were different in each model. Except for the anthropogenic variables, the temperature variables strongly affected the results of the MaxEnt model. However, in the RF model, meteorological and geographic variables, such as temperature, precipitation, and elevation, were all shown to affect WCSB prediction in the model.
The response trends to environmental variables were not different in the PDPs of both the SDMs (Figure 5). However, the degree of increase or decrease differed depending on the model. As the maximum temperature of the warmest month was lower and the minimum temperature of the coldest month was higher, the probability of occurrence of WCSBs increased in both models. Regarding precipitation, although the occurrence probability in the MaxEnt model showed little change, the probability in the RF model decreased when the annual precipitation was 1100 mm and 1384 mm or the precipitation of the driest month was lower. The occurrence probability in the MaxEnt model showed little change in geographical variables (elevation and slope) such as precipitation. However, when the elevation was lower than 345 m or the slope was lower than 20°, the probability of occurrence increased in the RF model. Additionally, as the night light became brighter and the road became closer, the occurrence probability of WCSBs increased in both the SDMs. In particular, in the RF model, the WCSB occurrence probability decreased until the distance to the road reached 1000 m.
By integrating the results of the two models, a potential occurrence probability map for WCSBs, known as the occurrence risk map, was produced (Figure 6a). Particularly, the occurrence probability was predicted to be high in metropolitan cities and their vicinities, such as Seoul, Incheon, Daegu, Daejeon, and Gwangju metropolitan cities in South Korea (Figure S1). Furthermore, Jeju Island and the northern area of the east coast, including Gangneung city, showed a high probability of WCSB occurrence. Using the model ensemble and future climate data, the change in the risk of WCSB occurrence due to climate change was predicted (Figure 6b–e). Due to climate change, the WCSB occurrence risk intensified with time flow (present → near future (2021–2040) → far future (2061-2080)) and magnitude of radiative forcing (SSP1-2.6 → SSP5-8.5) at the national scale (Figure S2). In the near future, the possibility of WCSB occurrence increased nationwide compared to the present, and the degree of increase was larger for SSP5-8.5 than that for SSP1-2.6 (Figure 6b–c). In both scenarios, it was predicted to be increased in Seoul metropolitan city, Gyeonggi-do (in the Korean administrative unit, -do is a province), and southern regions of South Korea (Figure S3a–b). The occurrence risk of WCSBs would be increased more in the far future with SSP5-8.5 data than that with SSP1-2.6 data (Figure 6d–e). In particular, it would be increased significantly in the mountainous region of the southern area of Korea (Jeolla-do and Gyeongsang-do) and the eastern coast of South Korea. Although the possibility of WCSB occurrence in the future (near future → far future) did not change much under the SSP1-2.6 scenario, the potential occurrence risk of WCSB increased significantly under the SSP5-8.5 conditions (Figure S3c–d). Furthermore, many areas in South Korea have shown vulnerability to climate change during WCSB occurrence (Figure S4). The more severe the global warming, the greater the possibility of WCSB occurrence in the future, except in high-mountainous regions. In particular, the plain in Chungcheongnam-do and the eastern coastal region of South Korea is greatly affected.
The occurrence risk of WCSBs due to climate change was highly increased at low-middle elevations (<900 m) and the southern region (latitude as 34.0°–37.0°) in South Korea (Figure 7a–b). Among the climate change conditions, the risk of WCSB occurrence in South Korea increased mostly in the far future with SSP5-8.5. Additionally, the occurrence risk of WCSBs increased significantly in many areas as global warming became more severe over time (Figure 7c). The occurrence probability of WCSBs increased in over half of the Korean territory under SSP5-8.5 conditions rather than SSP1-26 conditions. In the far future, vulnerable areas where the risk of WCSB occurrence increased due to climate change were shown in almost all regions, especially in the southern and central region (latitude as 34.5°–36.5°) of South Korea with low-middle elevations (<900 m) (Figure 7d).

4. Discussion

4.1. Occurrence and Dispersal Characteristics of WCSBs in South Korea

WCSBs were first observed in Changwon in the southern region of South Korea in 2010 [27]. After that, WCSBs were observed in broad areas, including Seoul and the east coast of Gangwon-do, in a survey in 2016–2017 [12]. Their distribution area has gradually expanded in South Korea (Figure 1), and the WCSBs have caused ecological and economic problems in South Korea, such as a decrease in pine nut production in Gangwon-do [15].
Anthropogenic factors played a key role in the occurrence and dispersal of WCSBs in South Korea (Figure 2 and Figure 3). The WCSBs were mostly observed in areas close to roads with bright night lights. These areas are located at low elevations and slopes and have a warm annual mean temperature and minimum temperature in the coldest month. Considering the relationships between environments within WCSB habitats, these results support that the occurrence sites of WCSBs are mainly located in the sphere of human influence. These results indicate that strong influences of anthropogenic factors on the dispersal of invasive species are well-supported by much of the literature [46,47,48]. The roads become a passage in the invasion and dispersal of invasive species, and various human activities, such as light during the night and extensive road networks, can contribute substantially to the dispersal of species [49] and habitat disturbance, causing the extinction of local species [50]. Furthermore, artificial structures, such as buildings, provide good habitats for WCSBs to overwinter [11,12,14,29].

4.2. Interpretation of SDMs for WCSB Occurrence Prediction

Through data preprocessing and optimal modeling processes, such as hyperparameter optimization, both RF and MaxEnt models showed good performance in predicting WCSB occurrence. However, they produced different model results for the same input data because each model has a different model structure and reflects the relationship between environmental conditions differently [48]. Variable importance and PDPs were used to explain the relationship between independent and dependent variables in the machine learning model [51], and they displayed the influence of each variable on the model result.
In both the RF and MaxEnt models, the distance to the road showed the greatest influence in predicting WCSB occurrence, followed by night light (Figure 4). However, the MaxEnt model was strongly influenced by specific variables, whereas the RF model was generally influenced by more variables than the MaxEnt model. This was consistent with the results of previous studies using the RF and MaxEnt models [48,52]. Additionally, the occurrence probability of WCSBs increased with high elevation, bright light at night, and proximity to roads, whereas it decreased as annual precipitation increased (Figure 5). Furthermore, in the PDPs, the RF model showed more dynamic changes in the model output in response to changes in environmental variables than the MaxEnt model. These differences resulted in differences in model outputs.
Anthropogenic factors were consistently evaluated as major factors in both RF and MaxEnt models for the prediction of WCSB occurrence. These results were also supported by the analysis of environmental variables in WCSB habitats. Meanwhile, meteorological variables, such as the maximum temperature of the warmest month and annual precipitation, did not play a significant role in either model in this study. In general, the temperature is a fundamental factor in the development and distribution of species, including insects [53], and precipitation affects insect communities and habitats [54]. They had a small effect on the occurrence of WCSBs in the SDMs (Figure 2 and Figure 4). This might be caused by the relatively small variation in these variables compared to the anthropogenic factors in the dataset. According to a previous study [55], WCSBs are distributed from Mexico to Sweden in the Northern Hemisphere. This latitude range includes the range for South Korea, indicating that the entire country of South Korea would have meteorological conditions suitable for WCSBs.

4.3. Supporting the Management and Controls Strategies for Alien Species

Information, such as dispersal patterns and potential occurrence probability, is fundamental to developing management and control strategies for alien species [56,57]. WCSBs have already invaded and dispersed in South Korea, and their negative impacts have already been reported. Therefore, effective management strategies are needed to reduce damage to the ecosystem and the economy by preventing the expansion of WCSBs based on ecological knowledge of WCSB occurrence. In this study, the characteristics of WCSB occurrence were revealed through both statistical tests on field data and SDMs, presenting the habitat environmental conditions of WCSBs, the relationship between environment and WCSB occurrence, and influential factors on WCSB occurrence [22]. These findings provided baseline information for the monitoring and surveillance of WCSB occurrence.
The potential occurrence probability map for alien species contributes to improving the efficiency of monitoring and surveillance [25]. In our study, the potential occurrence probability map of the WCSBs, known as the occurrence risk map in South Korea, was developed using an ensemble of the RF and MaxEnt models. Combining the RF and MaxEnt models worked complementarily and produced better results than those of each model [48]. In the potential occurrence map, the high occurrence probability of the WCSBs appeared mainly in metropolises and their vicinities in South Korea (Figure 6). Areas with a high occurrence probability are considered areas with a high potential for damage by WCSBs and vulnerable areas to WCSBs. For example, the map presented the occurrence possibility of WCSBs in Jeollanam-do and Jeju Island, where there is no record of WCSB occurrence yet. Areas with a high probability of occurrence should be intensively monitored. This map does not present the habitat suitability of WCSBs, but it shows the occurrence probability of WCSBs being dispersed. Secondary damage, such as ecological and economic damage, can also be inferred from this information. Plants and animal species that exist in areas damaged by WCSBs are mainly affected by WCSBs.
Tamburini, et al. [58] reported that the distribution of WCSBs could be further expanded due to climate change. Indeed, the occurrence probability of WCSBs in South Korea is predicted to increase on a national scale owing to future climate change (Figure 6 and Figure S1). In particular, the middle mountainous areas of South Korea were mainly influenced by climate change in terms of WCSB occurrence in the prediction model. This was also applied to southern regions such as Jeollanam-do, South Korea. Furthermore, as climate change intensified, an increase in the occurrence probability of WCSBs was predicted (Figure 7 and Figure S4). Mountainous areas in Gyeongsangnam-do and Gyeongsangbuk-do in southeastern South Korea and the plain area in Chungcheongnam-do are highly vulnerable to WCSB occurrence due to climate change. Therefore, continuous WCSB surveillance and monitoring are required to prevent WCSB invasion and dispersal into these areas.
Although some studies have been conducted to analyze the characteristics of WCSB occurrence and to predict their potential distribution [10,55,59], our study provides novel information for developing efficient management and control strategies for WCSBs using novel climatic data, such as SSP scenarios and improvement of SDMs with machine learning algorithms, model optimization, and interpretation methods.
However, this study did not show the actual interaction between species and the environment and dispersal pathways because the study was conducted to predict the occurrence of WCSBs using SDMs based on various environmental factors. In general, invasive alien species easily adapt to new environments and spread rapidly [60]. Therefore, to develop an effective strategy for the management and control of alien species, including WCSBs, further studies are required to evaluate the distribution and dispersal of alien species by considering the complex interactions within real ecosystems and their effects on the dispersal and settlement of alien species.

5. Conclusions

Since the first WCSB observation in South Korea, they have been dispersed rapidly and are now widely distributed on a national scale. Among the various environmental factors, anthropogenic factors caused by human activities significantly affect the occurrence and dispersal of WCSBs in South Korea. The RF and MaxEnt models were developed to predict the potential distribution and occurrence of WCSBs and showed good performance in predicting WCSB occurrence. The potential distribution map produced by the model ensemble with both SDMs showed that metropolitan cities and their vicinities in South Korea had a high probability of occurrence for the WCSBs. Some areas, such as Jeollanam-do and Jeju Island, where there is no record of WCSB occurrence, also have a high possibility of WCSB occurrence. Furthermore, South Korea has a high potential for increasing the WCSB occurrence probability on a nationwide scale due to climate change. Mainly the middle mountainous areas and southern regions of South Korea are largely affected by climate change. According to the results of this study, the risk of WCSBs persistently increases in South Korea. It is obvious that the dispersal of WCSB will harm the forest and economy in South Korea. Therefore, continuous surveillance and monitoring of WCSB occurrence are necessary to control the dispersal and occurrence of WCSBs.

Supplementary Materials

The following supporting information can be downloaded at: https://www.mdpi.com/article/10.3390/f14010117/s1, Figure S1: Major cities in South Korea. Figure S2: Change of occurrence probability density of WCSBs in South Korea due to climate change. Figure S3: Change of occurrence risk of WCSBs between present and future. Figure S4: Vulnerable areas to climate change in WCSB occurrence.

Author Contributions

Conceptualization, D.-S.L. and Y.-S.P.; data curation, D.-S.L., T.-G.L., and Y.-S.B.; Methodology, D.-S.L. and Y.-S.P.; writing—original draft preparation, D.-S.L. and Y.-S.P.; writing—review and editing, all authors. All authors have read and agreed to the published version of the manuscript.

Funding

This study was carried out with the support of the R&D Program for Forest Science Technology (Project No. 2017042B10-2223-CA01) provided by Korea Forest Service (Korea Forestry Promotion Institute).

Institutional Review Board Statement

Not applicable.

Informed Consent Statement

Not applicable.

Data Availability Statement

Included in the text.

Conflicts of Interest

The authors declare no conflict of interest.

References

  1. Hughes, L. Biological consequences of global warming: Is the signal already. Trends Ecol. Evol. 2000, 15, 56–61. [Google Scholar] [CrossRef]
  2. Hulme, P.E. Trade, transport and trouble: Managing invasive species pathways in an era of globalization. J. Appl. Ecol. 2009, 46, 10–18. [Google Scholar] [CrossRef]
  3. Lowe, S.; Browne, M.; Boudjelas, S.; De Poorter, M. 100 of the World’s Worst Invasive Alien Species: A Selection from the Global Invasive Species Database; The Invasive Species Specialist Group, Species Survival Commission, The International Union for Conservation of Nature: Auckland, New Zealand, 2000. [Google Scholar]
  4. Pyšek, P.; Richardson, D.M. Invasive species, environmental change and management, and health. Annu. Rev. Environ. Resour. 2010, 35, 25–55. [Google Scholar] [CrossRef] [Green Version]
  5. U.S. Department of Agriculture. Major Forest Insect and Disease Conditions in the United States 2015; U.S. Department of Agriculture: Washington, DC, USA, 2017.
  6. Lee, D.-S.; Bae, Y.-S.; Byun, B.-K.; Lee, S.; Park, J.K.; Park, Y.-S. Occurrence prediction of the citrus flatid planthopper (Metcalfa pruinosa (Say, 1830)) in South Korea using a random forest model. Forests 2019, 10, 583. [Google Scholar] [CrossRef] [Green Version]
  7. Liebhold, A.M.; Tobin, P.C. Population ecology of insect invasions and their management. Annu. Rev. Entomol. 2008, 53, 387–408. [Google Scholar] [CrossRef] [PubMed] [Green Version]
  8. Doherty, T.S.; Glen, A.S.; Nimmo, D.G.; Ritchie, E.G.; Dickman, C.R. Invasive predators and global biodiversity loss. Proc. Natl. Acad. Sci. USA 2016, 113, 11261–11265. [Google Scholar] [CrossRef] [PubMed] [Green Version]
  9. McPherson, J.; Packauskas, R.; Taylor, S.; O’brien, M. Eastern range extension of Leptoglossus occidentalis with a key to Leptoglossus species of America north of Mexico (Heteroptera: Coreidae). Great Lakes Entomol. 1990, 23, 5. [Google Scholar]
  10. Kim, D.E.; Lee, H.; Kim, M.J.; Ban, Y.G.; Kim, D. Leptoglossus occidentalis (Hemiptera: Coreidae) occurrence, potential habitats, and COI diversity in South Korea. J. Asia-Pac. Biodivers. 2020, 13, 35–45. [Google Scholar] [CrossRef]
  11. Bates, S.L.; Borden, J.H. Life table for Leptoglossus occidentalis Heidemann (Heteroptera: Coreidae) and prediction of damage in lodgepole pine seed orchards. Agric. For. Entomol. 2005, 7, 145–151. [Google Scholar] [CrossRef]
  12. National Institute of Ecology. Investigating Ecological Risk of Alien Species (IV); National Institute of Ecology: Seocheon, Republic of Korea, 2017.
  13. Bates, S.L.; Borden, J.H.; Kermode, A.R.; Bennett, R.G. Impact of Leptoglossus occidentalis (Hemiptera: Coreidae) on Douglas-fir seed production. J. Econ. Entomol. 2000, 93, 1444–1451. [Google Scholar] [CrossRef]
  14. Koerber, T.W. Leptoglossus occidentalis (Hemiptera, Coreidae), a newly discovered pest of coniferous seed. Ann. Entomol. Soc. Am. 1963, 56, 229–234. [Google Scholar] [CrossRef]
  15. Park, K. Gyeonggi-do Forest Resources Research Institute. Decrease in Pine Nut Production in the Gapyeong Area. Reveal the Leptoglossus occidentalis. Media News, 8 October 2020. [Google Scholar]
  16. Beaury, E.M.; Fusco, E.J.; Jackson, M.R.; Laginhas, B.B.; Morelli, T.L.; Allen, J.M.; Pasquarella, V.J.; Bradley, B.A. Incorporating climate change into invasive species management: Insights from managers. Biol. Invasions 2020, 22, 233–252. [Google Scholar] [CrossRef] [Green Version]
  17. Hellmann, J.J.; Byers, J.E.; Bierwagen, B.G.; Dukes, J.S. Five potential consequences of climate change for invasive species. Conserv. Biol. 2008, 22, 534–543. [Google Scholar] [CrossRef] [PubMed]
  18. Cornelissen, T. Climate change and its effects on terrestrial insects and herbivory patterns. Neotrop. Entomol. 2011, 40, 155–163. [Google Scholar] [CrossRef] [Green Version]
  19. Lee, C.M.; Lee, D.-S.; Kwon, T.-S.; Athar, M.; Park, Y.-S. Predicting the global distribution of Solenopsis geminata (Hymenoptera: Formicidae) under climate change using the MaxEnt model. Insects 2021, 12, 229. [Google Scholar] [CrossRef] [PubMed]
  20. Mainka, S.A.; Howard, G.W. Climate change and invasive species: Double jeopardy. Integr. Zool. 2010, 5, 102–111. [Google Scholar] [CrossRef]
  21. Warren, D.L.; Seifert, S.N. Ecological niche modeling in Maxent: The importance of model complexity and the performance of model selection criteria. Ecol. Appl. 2011, 21, 335–342. [Google Scholar] [CrossRef] [Green Version]
  22. Elith, J.; Leathwick, J.R. Species distribution models: Ecological explanation and prediction across space and time. Annu. Rev. Ecol. Evol. Syst. 2009, 40, 677–697. [Google Scholar] [CrossRef]
  23. Pecchi, M.; Marchi, M.; Burton, V.; Giannetti, F.; Moriondo, M.; Bernetti, I.; Bindi, M.; Chirici, G. Species distribution modelling to support forest management. A literature review. Ecol. Model. 2019, 411, 108817. [Google Scholar] [CrossRef]
  24. Fois, M.; Cuena-Lombraña, A.; Fenu, G.; Bacchetta, G. Using species distribution models at local scale to guide the search of poorly known species: Review, methodological issues and future directions. Ecol. Model. 2018, 385, 124–132. [Google Scholar] [CrossRef] [Green Version]
  25. Srivastava, V.; Lafond, V.; Griess, V.C. Species distribution models (SDM): Applications, benefits and challenges in invasive species management. CAB Rev. 2019, 14, 1–13. [Google Scholar] [CrossRef]
  26. Drake, J.M.; Randin, C.; Guisan, A. Modelling ecological niches with support vector machines. J. Appl. Ecol. 2006, 43, 424–432. [Google Scholar] [CrossRef]
  27. Ahn, S.J.; Son, D.; Choo, H.Y.; Park, C.G. The first record on Leptoglossus occidentalis (Hemiptera: Coreidae) in Korea, a potential pest of the pinaceous tree species. J. Asia-Pac. Entomol. 2013, 16, 281–284. [Google Scholar] [CrossRef]
  28. National Institute of Environmental Research. A Photographic Guide to the Alien Insects and Their Host Plants in Korea; National Institute of Environmental Research: Incheon, Republic of Korea, 2013.
  29. Barta, M. Biology and temperature requirements of the invasive seed bug Leptoglossus occidentalis (Heteroptera: Coreidae) in Europe. J. Pest Sci. 2016, 89, 31–44. [Google Scholar] [CrossRef]
  30. GBIF org. GBIF Occurrence Download. 2022. Available online: https://www.gbif.org/occurrence/download/0428875-210914110416597 (accessed on 5 September 2022).
  31. Fick, S.E.; Hijmans, R.J. WorldClim 2: New 1-km spatial resolution climate surfaces for global land areas. Int. J. Climatol. 2017, 37, 4302–4315. [Google Scholar] [CrossRef]
  32. IPCC. Climate Change 2021: The Physical Science Basis. Contribution of Working Group I to the Sixth Assessment Report of the Intergovernmental Panel on Climate Change; Masson-Delmotte, V., Zhai, P., Pirani, A., Connors, S.L., Péan, C., Berger, S., Caud, N., Chen, Y., Goldfarb, L., Gomis, M.I., et al., Eds.; Cambridge University Press: Cambridge, UK, 2021; p. 2391. [Google Scholar] [CrossRef]
  33. QGIS Development Team. QGIS Geographic Information System. QGIS Association. 2021. Available online: http://www.qgis.org (accessed on 1 May 2022).
  34. Zhu, G.-P.; Rédei, D.; Kment, P.; Bu, W.-J. Effect of geographic background and equilibrium state on niche model transferability: Predicting areas of invasion of Leptoglossus occidentalis. Biol. Invasions 2014, 16, 1069–1081. [Google Scholar] [CrossRef]
  35. Breiman, L. Random forests. Mach. Learn. 2001, 45, 5–32. [Google Scholar] [CrossRef] [Green Version]
  36. Byeon, D.-H.; Jung, J.-M.; Park, Y.; Lee, H.-S.; Lee, J.-H.; Jung, S.; Lee, W.-H. Model-based assessment of changes in the potential distribution of Solenopsis geminata (Hymenoptera: Formicidae) according to climate change scenarios. J. Asia-Pac. Biodivers. 2020, 13, 331–338. [Google Scholar] [CrossRef]
  37. Kumar, S.; Yee, W.L.; Neven, L.G. Mapping global potential risk of establishment of Rhagoletis pomonella (Diptera: Tephritidae) using MaxEnt and CLIMEX niche models. J. Econ. Entomol. 2016, 109, 2043–2053. [Google Scholar] [CrossRef] [PubMed]
  38. Fielding, A.H.; Bell, J.F. A review of methods for the assessment of prediction errors in conservation presence/absence models. Environ. Conserv. 1997, 24, 38–49. [Google Scholar] [CrossRef]
  39. Liaw, A.; Wiener, M. Classification and regression by randomForest. R News 2002, 2, 18–22. [Google Scholar]
  40. Phillips, S.J.; Anderson, R.P.; Schapire, R.E. Maximum entropy modeling of species geographic distributions. Ecol. Model. 2006, 190, 231–259. [Google Scholar] [CrossRef] [Green Version]
  41. R Core Team R: A Language and Environment for Statistical Computing; R Foundation for Statistical Computing: Vienna, Austria, 2021; Available online: https://www.R-project.org/ (accessed on 1 May 2022).
  42. Hijmans, R.J.; Raster: Geographic Data Analysis and Modeling. R package version 3.5-29. 2020. Available online: https://CRAN.R-project.org/package=raster (accessed on 1 May 2022).
  43. Hijmans, R.J.; Phillips, S.; Leathwick, J.; Elith, J. dismo: Species Distribution Modeling. R Package Version 1.3-5. 2017. Available online: https://CRAN.R-project.org/package=dismo (accessed on 1 May 2022).
  44. Sing, T.; Sander, O.; Beerenwinkel, N.; Lengauer, T. ROCR: Visualizing classifier performance in R. Bioinformatics 2005, 21, 3940–3941. [Google Scholar] [CrossRef] [PubMed]
  45. Phillips, S.J.; Dudík, M.; Schapire, R.E. Maxent Software for Modeling Species Niches and Distributions, Version 3.4.1. Available online: http://biodiversityinformatics.amnh.org/open_source/maxent/ (accessed on 1 May 2022).
  46. Choi, W.I.; Song, H.J.; Kim, D.S.; Lee, D.-S.; Lee, C.-Y.; Nam, Y.; Kim, J.-B.; Park, Y.-S. Dispersal patterns of pine wilt disease in the early stage of its invasion in South Korea. Forests 2017, 8, 411. [Google Scholar] [CrossRef] [Green Version]
  47. Pantaleoni, R. The ways in which Metcalfa pruinosa (Say, 1830)(Auchenorrhyncha Flatidae) invades a new area. Boll. Dell’istituto DiEntomol. Guid. Grandi Della Univ. Degli Studi Di Bologna 1989, 43, 1–7. [Google Scholar]
  48. Lee, D.-S.; Choi, W.I.; Nam, Y.; Park, Y.-S. Predicting potential occurrence of pine wilt disease based on environmental factors in South Korea using machine learning algorithms. Ecol. Inform. 2021, 64, 101378. [Google Scholar] [CrossRef]
  49. Chen, S.; Ding, F.; Hao, M.; Jiang, D. Mapping the potential global distribution of red imported fire ant (Solenopsis invicta Buren) based on a machine learning method. Sustainability 2020, 12, 10182. [Google Scholar] [CrossRef]
  50. Husté, A.; Boulinier, T. Determinants of local extinction and turnover rates in urban bird communities. Ecol. Appl. 2007, 17, 168–180. [Google Scholar] [CrossRef]
  51. Molnar, C. Interpretable Machine Learning: A Guide for Making Black Box Models Explainable, 2nd ed.; Lulu: Morrisville, NC, USA, 2022. [Google Scholar]
  52. Zhao, Z.; Xiao, N.; Shen, M.; Li, J. Comparison between optimized MaxEnt and random forest modeling in predicting potential distribution: A case study with Quasipaa boulengeri in China. Sci. Total Environ. 2022, 842, 156867. [Google Scholar] [CrossRef]
  53. Régnière, J.; Powell, J.; Bentz, B.; Nealis, V. Effects of temperature on development, survival and reproduction of insects: Experimental design, data analysis and modeling. J. Insect Physiol. 2012, 58, 634–647. [Google Scholar] [CrossRef]
  54. Zhu, H.; Wang, D.; Wang, L.; Fang, J.; Sun, W.; Ren, B. Effects of altered precipitation on insect community composition and structure in a meadow steppe. Ecol. Entomol. 2014, 39, 453–461. [Google Scholar] [CrossRef]
  55. Olivera, L.; Minghetti, E.; Montemayor, S.I. Ecological niche modeling (ENM) of Leptoglossus clypealis a new potential global invader: Following in the footsteps of Leptoglossus occidentalis? Bull. Entomol. Res. 2021, 111, 289–300. [Google Scholar] [CrossRef] [PubMed]
  56. McGeoch, M.A.; Genovesi, P.; Bellingham, P.J.; Costello, M.J.; McGrannachan, C.; Sheppard, A. Prioritizing species, pathways, and sites to achieve conservation targets for biological invasion. Biol. Invasions 2016, 18, 299–314. [Google Scholar] [CrossRef] [Green Version]
  57. Alvarez, S.; Solís, D. Rapid Response Lowers Eradication Costs of Invasive Species. Choices 2018, 33, 1–9. [Google Scholar]
  58. Tamburini, M.; Maresi, G.; Salvadori, C.; Battisti, A.; Zottele, F.; Pedrazzoli, F. Adaptation of the invasive western conifer seed bug Leptoglossus occidentalis to Trentino, an alpine region (Italy). Bull. Insectology 2012, 65, 161–170. [Google Scholar]
  59. Byeon, D.-h.; Jung, J.-M.; Jung, S.; Lee, W.-H. Distribution analysis of Leptoglossus occidentalis Heidemann (Heteroptera: Coreidae) in South Korea using climate and host plant ensemble maps. J. Asia-Pac. Entomol. 2021, 24, 1077–1086. [Google Scholar] [CrossRef]
  60. Rehage, J.S.; Sih, A. Dispersal behavior, boldness, and the link to invasiveness: A comparison of four Gambusia species. Biol. Invasions 2004, 6, 379–391. [Google Scholar] [CrossRef]
Figure 1. Distribution of WCSB occurrence (red points) in South Korea. These are the points after performing spatial filtering.
Forests 14 00117 g001
Figure 2. Comparison of environmental conditions between the presence (P) and absence (A) sites of WCSBs. The z-score (z) and p-value (p) were calculated based on test statistics (U) of the Mann–Whitney U test. The bars and error bars represent the mean and standard error of each variable. (a) Maximum temperature of the warmest month, (b) minimum temperature of the coldest month, (c) annual precipitation, (d) precipitation of driest month, (e) elevation, (f) slope, (g) night light, (h) distance to the road.
Forests 14 00117 g002
Figure 3. The relationship between the environments in the occurrence sites of WCSBs. Spearman’s correlation analysis was used. The numbers in the figure mean correlation coefficient (r). Gray letters indicate statistically insignificant relationships (p ≥ 0.05). Bio5: maximum temperature of the warmest month; Bio6: minimum temperature of the coldest month; Bio12: annual precipitation; Bio14: precipitation of driest month; Ele: elevation; Light: night light; Road: distance to the road.
Forests 14 00117 g003
Figure 4. Variable importance in the RF model (a) and the MaxEnt model (b) and importance ranks (c) to predict the occurrence of WCSBs. The bars and error bars represent the mean and standard error of each variable. The abbreviation of environmental variables is the same as in Figure 3.
Forests 14 00117 g004
Figure 5. Partial dependence plots of both the SDMs for WCSBs. Solid lines are regression curves using LOESS, and gray areas display the 95% confidence interval. (a) Maximum temperature of the warmest month, (b) minimum temperature of the coldest month, (c) annual precipitation, (d) precipitation of driest month, (e) elevation, (f) slope, (g) night light, (h) distance to the road.
Forests 14 00117 g005
Figure 6. Prediction of the potential distribution areas of WCSB in historical (a) and future climate conditions (be). Two shared socioeconomic pathway (SSP) scenarios were used for future climate data: (near future for 2021–2040) SSP1-2.6 data (b) and SSP5-8.5 (c), (far future for 2061–2080) SSP1-2.6 data (d) and SSP5-8.5 data (e). The maps are the ensemble result of the random forest model and maximum entropy model. All maps have the same color legends.
Forests 14 00117 g006
Figure 7. The effects of climate change on the occurrence of WCSBs in South Korea. All values in the figure are interval values. Change in the occurrence risk of WCSBs according to (a) elevation and (b) latitude (NF: near future (2021–2040); FF: Far future (2061-2080)). (c) Impacts of intensified climate change in the future. (d) Change in the occurrence risk of WCSBs between climate change scenarios in the far future. The degree of change in the near future and the far future (c,d) was obtained by subtracting probability under SSP5-8.5 from probability under SSP1-2.6. Grids with gray color mean no data.
Forests 14 00117 g007
Disclaimer/Publisher’s Note: The statements, opinions and data contained in all publications are solely those of the individual author(s) and contributor(s) and not of MDPI and/or the editor(s). MDPI and/or the editor(s) disclaim responsibility for any injury to people or property resulting from any ideas, methods, instructions or products referred to in the content.

