Article

Variations in Ecosystem Service Value and Its Driving Factors in the Nanjing Metropolitan Area of China

College of Economics and Management, Nanjing Forestry University, Nanjing 210037, China
*
Author to whom correspondence should be addressed.
Forests 2023, 14(1), 113; https://doi.org/10.3390/f14010113
Submission received: 19 November 2022 / Revised: 31 December 2022 / Accepted: 5 January 2023 / Published: 6 January 2023
(This article belongs to the Special Issue Forest Ecosystem Services and Landscape Design)

Abstract

:
More than 60% of the world’s ecosystem services have deteriorated over the past few decades. Studying the spatio-temporal fluctuations in ecosystem service value and its influencing factors is important for identifying regional ecosystem service value issues, upholding regional ecological harmony, and encouraging regionally healthy and coordinated sustainable development. Ecosystem service value has so far been studied primarily in relation to the effect of socioeconomic and physical–geographical variables. However, the trade-offs and synergies among ecosystem service values also drive the spatio-temporal variations in ecosystem service value. Few studies have been conducted to date to investigate the trade-offs and synergies between ecosystem service values and their impact on ecosystem service value. Therefore, this paper used sensitivity analysis, correlation analysis, trade-offs and synergies analysis, and a Geodetector to examine changes in ecosystem service value and their influencing factors within the Nanjing metropolitan region. The ecosystem service value decreased somewhat overall between 2000 and 2020, with a decline rate of 2.19 million CNY/year. In comparison to the north of the Nanjing metropolitan region, the ecosystem service value was relatively higher in the south. The water bodies had the highest total ecosystem service value, followed by forest land, cultivated land, and grassland, with construction land and unused land having the lowest ecosystem service values overall. The main socioeconomic factor influencing the spatial variations in ecosystem service value was population density, while the main physical–geographical factors were the digital elevation model, the normalized difference vegetation index, and precipitation. As a result, the Nanjing metropolitan area should tighten its grip on excessive population growth. In contrast to the expository strength of a single factor on the ecosystem service value, the influence of all individual elements on the ecosystem service value under interaction was significantly increased, and the interaction among the normalized difference vegetation index and gross economic product had the most obvious effect on the ecosystem service value. The spatial variation in the ecosystem service value was also influenced by trade-offs and synergies between the value of supply services, regulation services, support services, and cultural services. Therefore, trade-offs and synergies among ecosystem services also need to be considered in land-use decisions.

1. Introduction

Global climate change and anthropological disturbances are affecting the stability and biodiversity of ecosystems, which in turn leads to the degradation of ecosystem services. The Millennium Ecosystem Assessment (MEA) found that in the last 50 years, approximately 60% of the world’s ecosystem services have become worse [1]. Among the 18 categories of ecosystem services assessed by the Intergovernmental Science-Policy Platform on Biodiversity and Ecosystem Services (IPBES), 14 categories of ecosystem services have declined since 1970 [2]. According to the New Nature Economy (NNE) report, published by the World Economic Forum (WEF) in partnership with the consultancy firm Price Waterhouse Coopers (PwC), an analysis of 163 industry sectors and their supply chains found that more than half of the global GDP is moderately or highly dependent on natural ecosystems and their services [3]. Therefore, the degradation or loss of ecosystem services is a development issue that directly threatens the health of human society, sustainable development, and global ecological security. Ecosystem service value (ESV) is a monetary evaluation of the various products and services ecosystems provide for human welfare and long-term economic and social development, including the values of supply services, regulation services, support services, and cultural services provided by ecosystems. It is critical to investigate the changes in ecosystem service value (ESV) and its influencing factors in order to correctly clarify regional ecosystem service issues, uphold regional ecological harmony, and encourage regionally healthy and coordinated sustainable development [4].
Numerous studies have shown that the ESV is influenced by both physical–geographical factors and socioeconomic factors, and the influencing factors vary within different regions. According to some studies, land use change is responsible for the global ESV loss state [5]. The primary cause of the reduction of terrestrial ESV, notably throughout Asia, Africa, and South America, is the spread of cultivated land in tropical forests. Additionally, the impact of urban growth contributes to the loss of ESV across Europe [6]. In China, the reconstruction and industrialization of agricultural land in recent decades have also been important reasons for the fluctuating downward trend in ESV. The ESV has a distinct spatial pattern of being high in the west and south regions of China and low in the east and north regions of China. The ESV in northeastern and northern China decreased significantly, while in Fujian and western Xinjiang, the ESV increased significantly [7,8]. Numerous studies have concluded that in ecologically fragile areas, ESV variations are more influenced by physical–geographical factors than by socioeconomic factors [9], while in areas with better hydrothermal conditions, ESV variations are more influenced by socioeconomic factors [10,11,12].
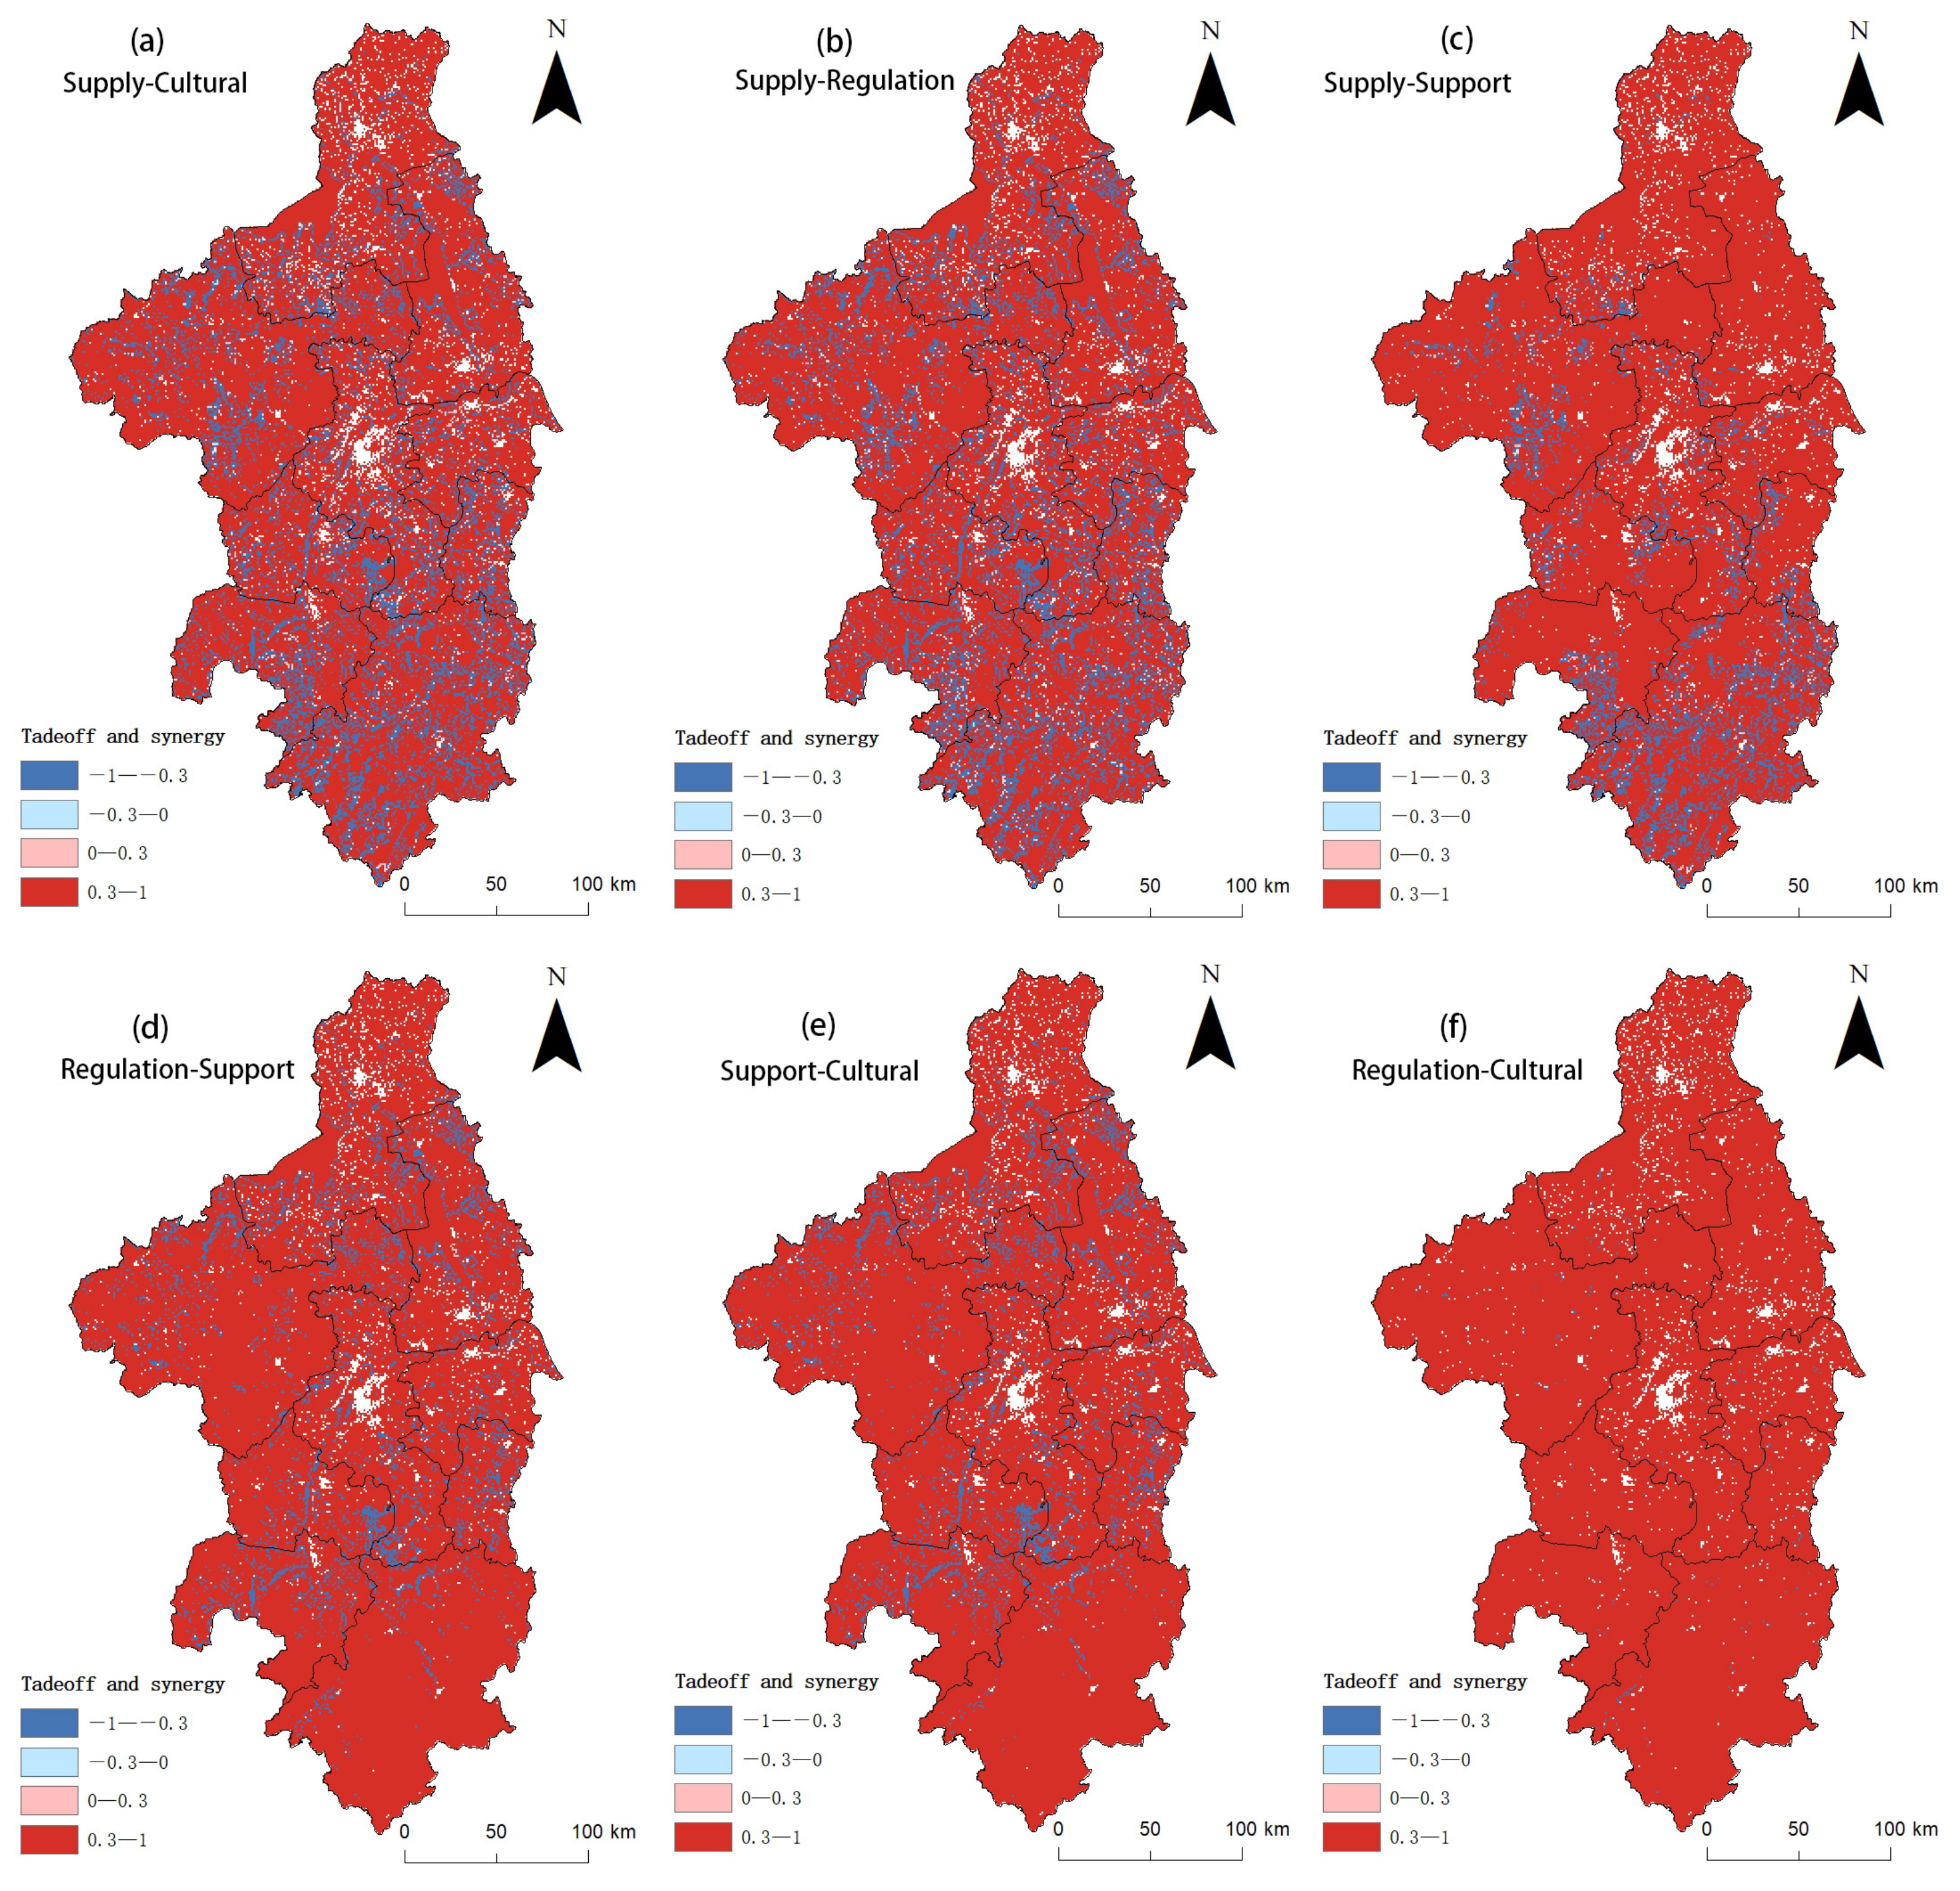
Ecosystem services are not totally independent of each other at different spatial and temporal scales, and there is a complex non-linear variation among them, where the growth or decline of one ecosystem service impacts the growth or decline of another service, resulting in trade-offs and synergies between ecosystem services [13,14,15]. Earlier studies have generally concentrated on straightforward trade-offs and synergistic interactions between ecosystem services but have neglected to explore the drivers and mechanisms of these relationships. Despite this, some research has indicated that trade-offs and synergies across ecosystem services also drive spatial and temporal variability in ecosystem services [16]. The analysis of trade-offs and synergies is important for global ecological and environmental governance, as well as providing a theoretical framework for the wise exploitation of natural resources, given the increasing rise of the global economy, population, and resource scarcity. Therefore, clarifying the impact of trade-offs and synergies on ESV can help us to eliminate the negative effects of trade-offs on ESV and achieve sustainable socio-ecological system development goals. Currently, one of the most pressing issues confronting ecologists is the variation in ESV and its response to trade-offs or synergistic relationships.
So far, the unit area value equivalent factor method developed by Costanza et al. [17] has been widely employed to account for regional ESVs. A new version of the unit area value equivalent factor approach and an equivalent factor table for the ESV of terrestrial ecosystems in China were produced by Xie et al. [18] and are extensively utilized in numerous studies in China [9,12]. However, because ESV is estimated using unit area value coefficients, this method has a few disadvantages. Firstly, the determination of unit area value coefficients is to some extent subjective [19,20]. Secondly, whether the unit area value coefficients correspond to the current condition in the research area has a direct impact on the ESV estimation accuracy [21]. As a result, the unit area value coefficients must be updated to reflect the current condition in the research region [22,23].
Studies have shown that spatial variations in ESV are caused by the combination of physical–geographical and socioeconomic factors, that is, any two elements have a bigger impact on the ESV than any one factor alone [9,12]. Currently, researchers focus on the influencing factors and their interactions with ESV [24]. The relationship between ESV and the influencing factors is not linear and shows significant spatial phenotypic variation [21]. The majority of earlier research on the spatial variations in ESV and their underlying factors has relied on qualitative and correlation analysis methods, such as analysis of spatial autocorrelation, logistic regression, and grey correlation [
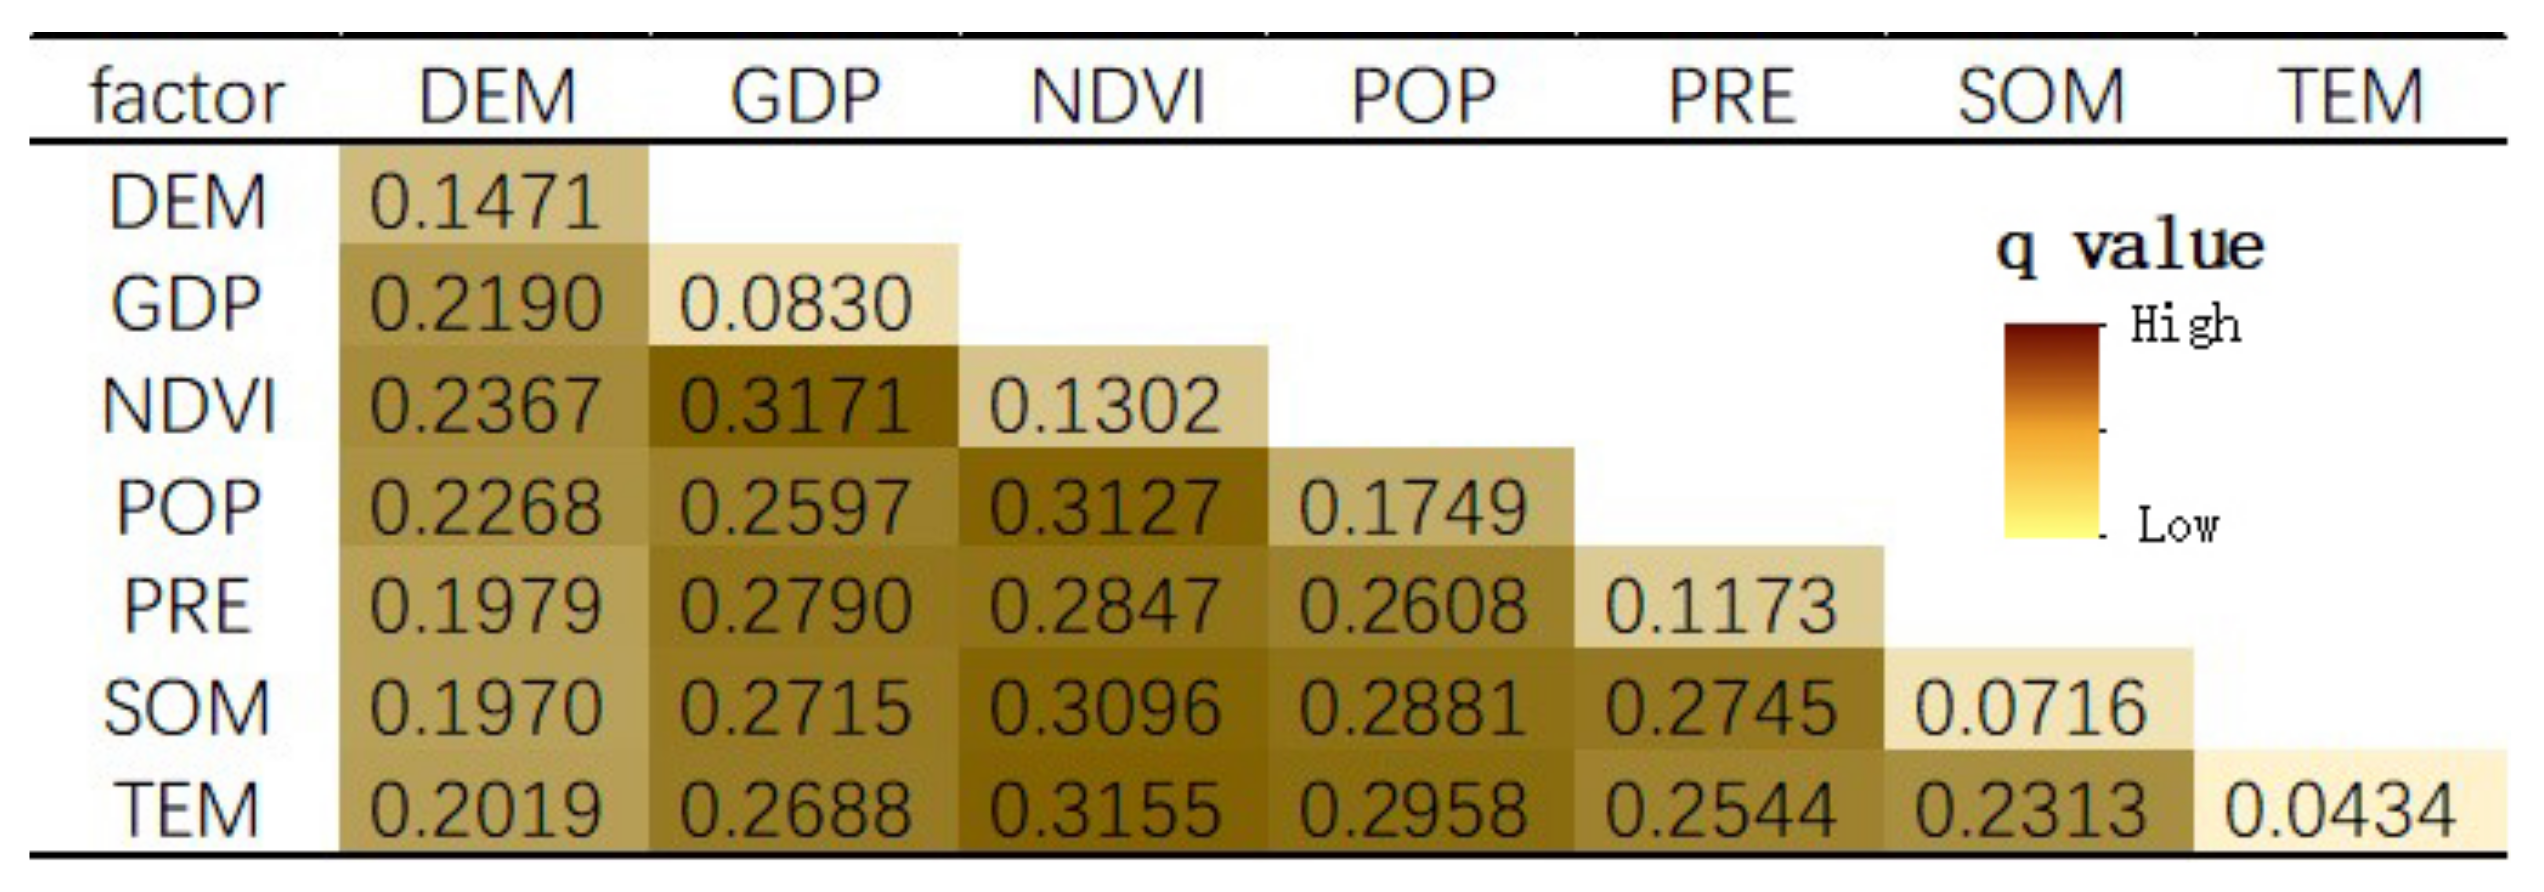
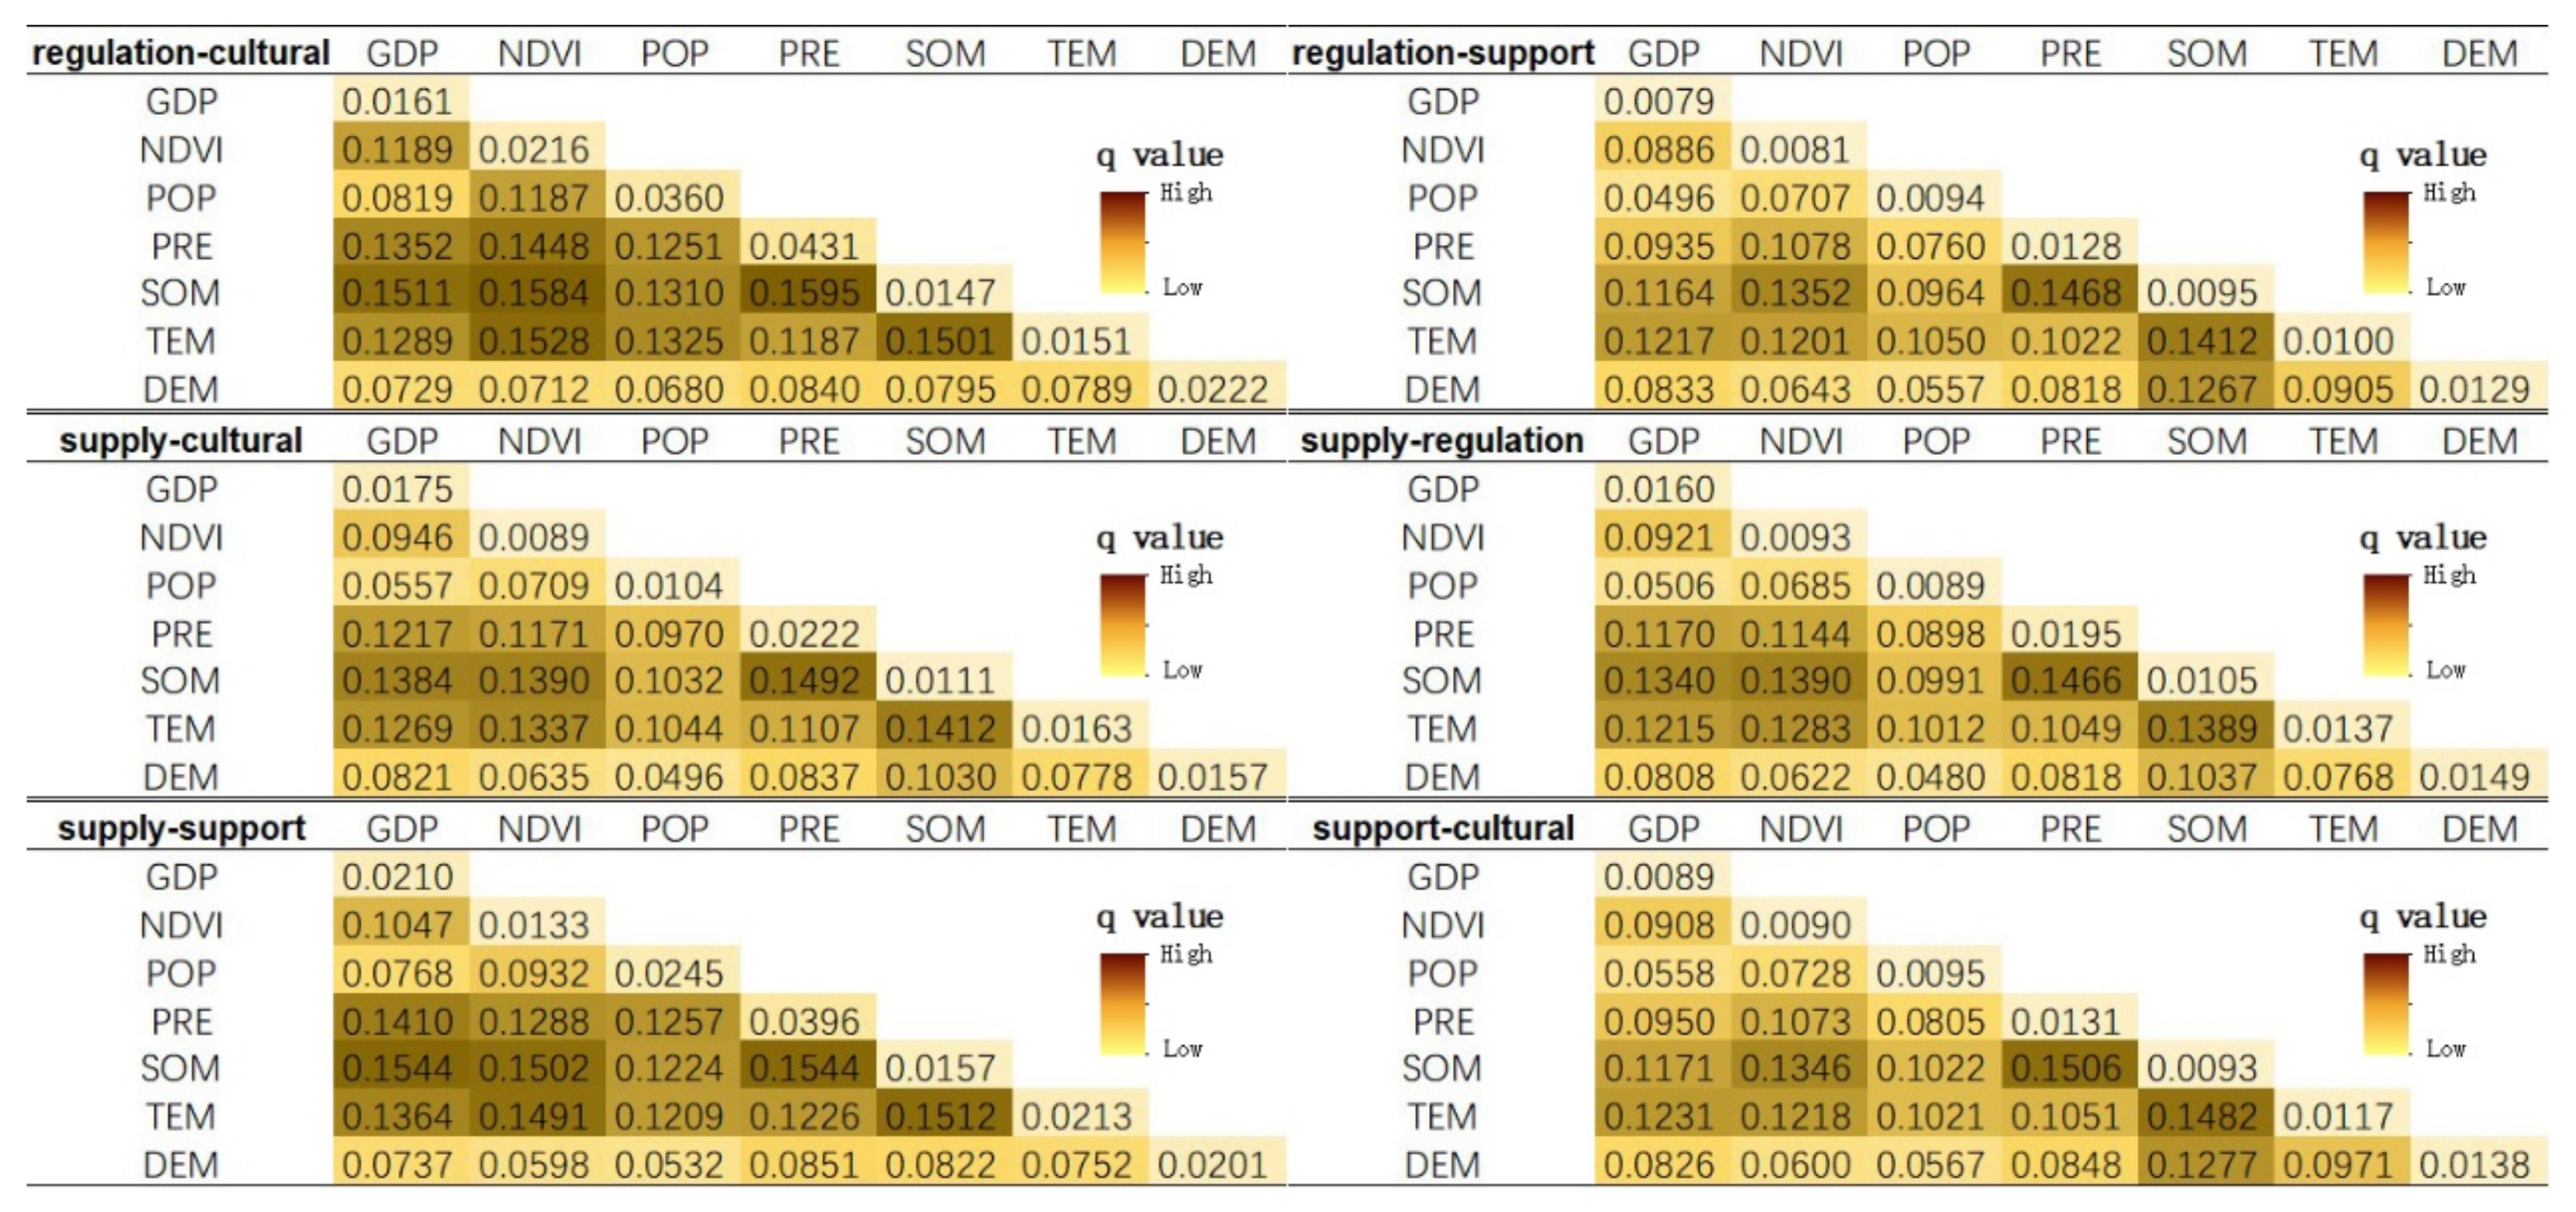
25]. However, the internal coupling effect is not taken into consideration in the majority of research, which also overlooks the spatial connection between the driving elements. The Geodetector method can be used to identify the driving factors in ESV variation [26,27]. It can identify both the influence of a single factor and the combined effect of several factors on the ESV [28].
In summary, the research on ESV has progressed from a conceptual definition and methodological exploration to a dynamic assessment and spatio-temporal variations to influence factors and their driving mechanisms, which has achieved relatively fruitful results. However, the spatial and temporal dynamics of ESVs need to be deepened, the interrelationships between different ecological functions and their trade-offs and synergies are yet to be clarified, and the driving causes of ESV spatial variation need to be discovered. As the first metropolitan area to be officially approved by the Chinese National Development and Reform Commission, the struggle between economic expansion and environmental preservation in the Nanjing metropolitan region is gradually intensifying. Behind the rapid economic and social advancement is a slew of ecological difficulties, including the degradation of water quality, the destruction of wetlands, the yearly decline of forest area, and the growth of industrial land constantly occupying ecological territory [
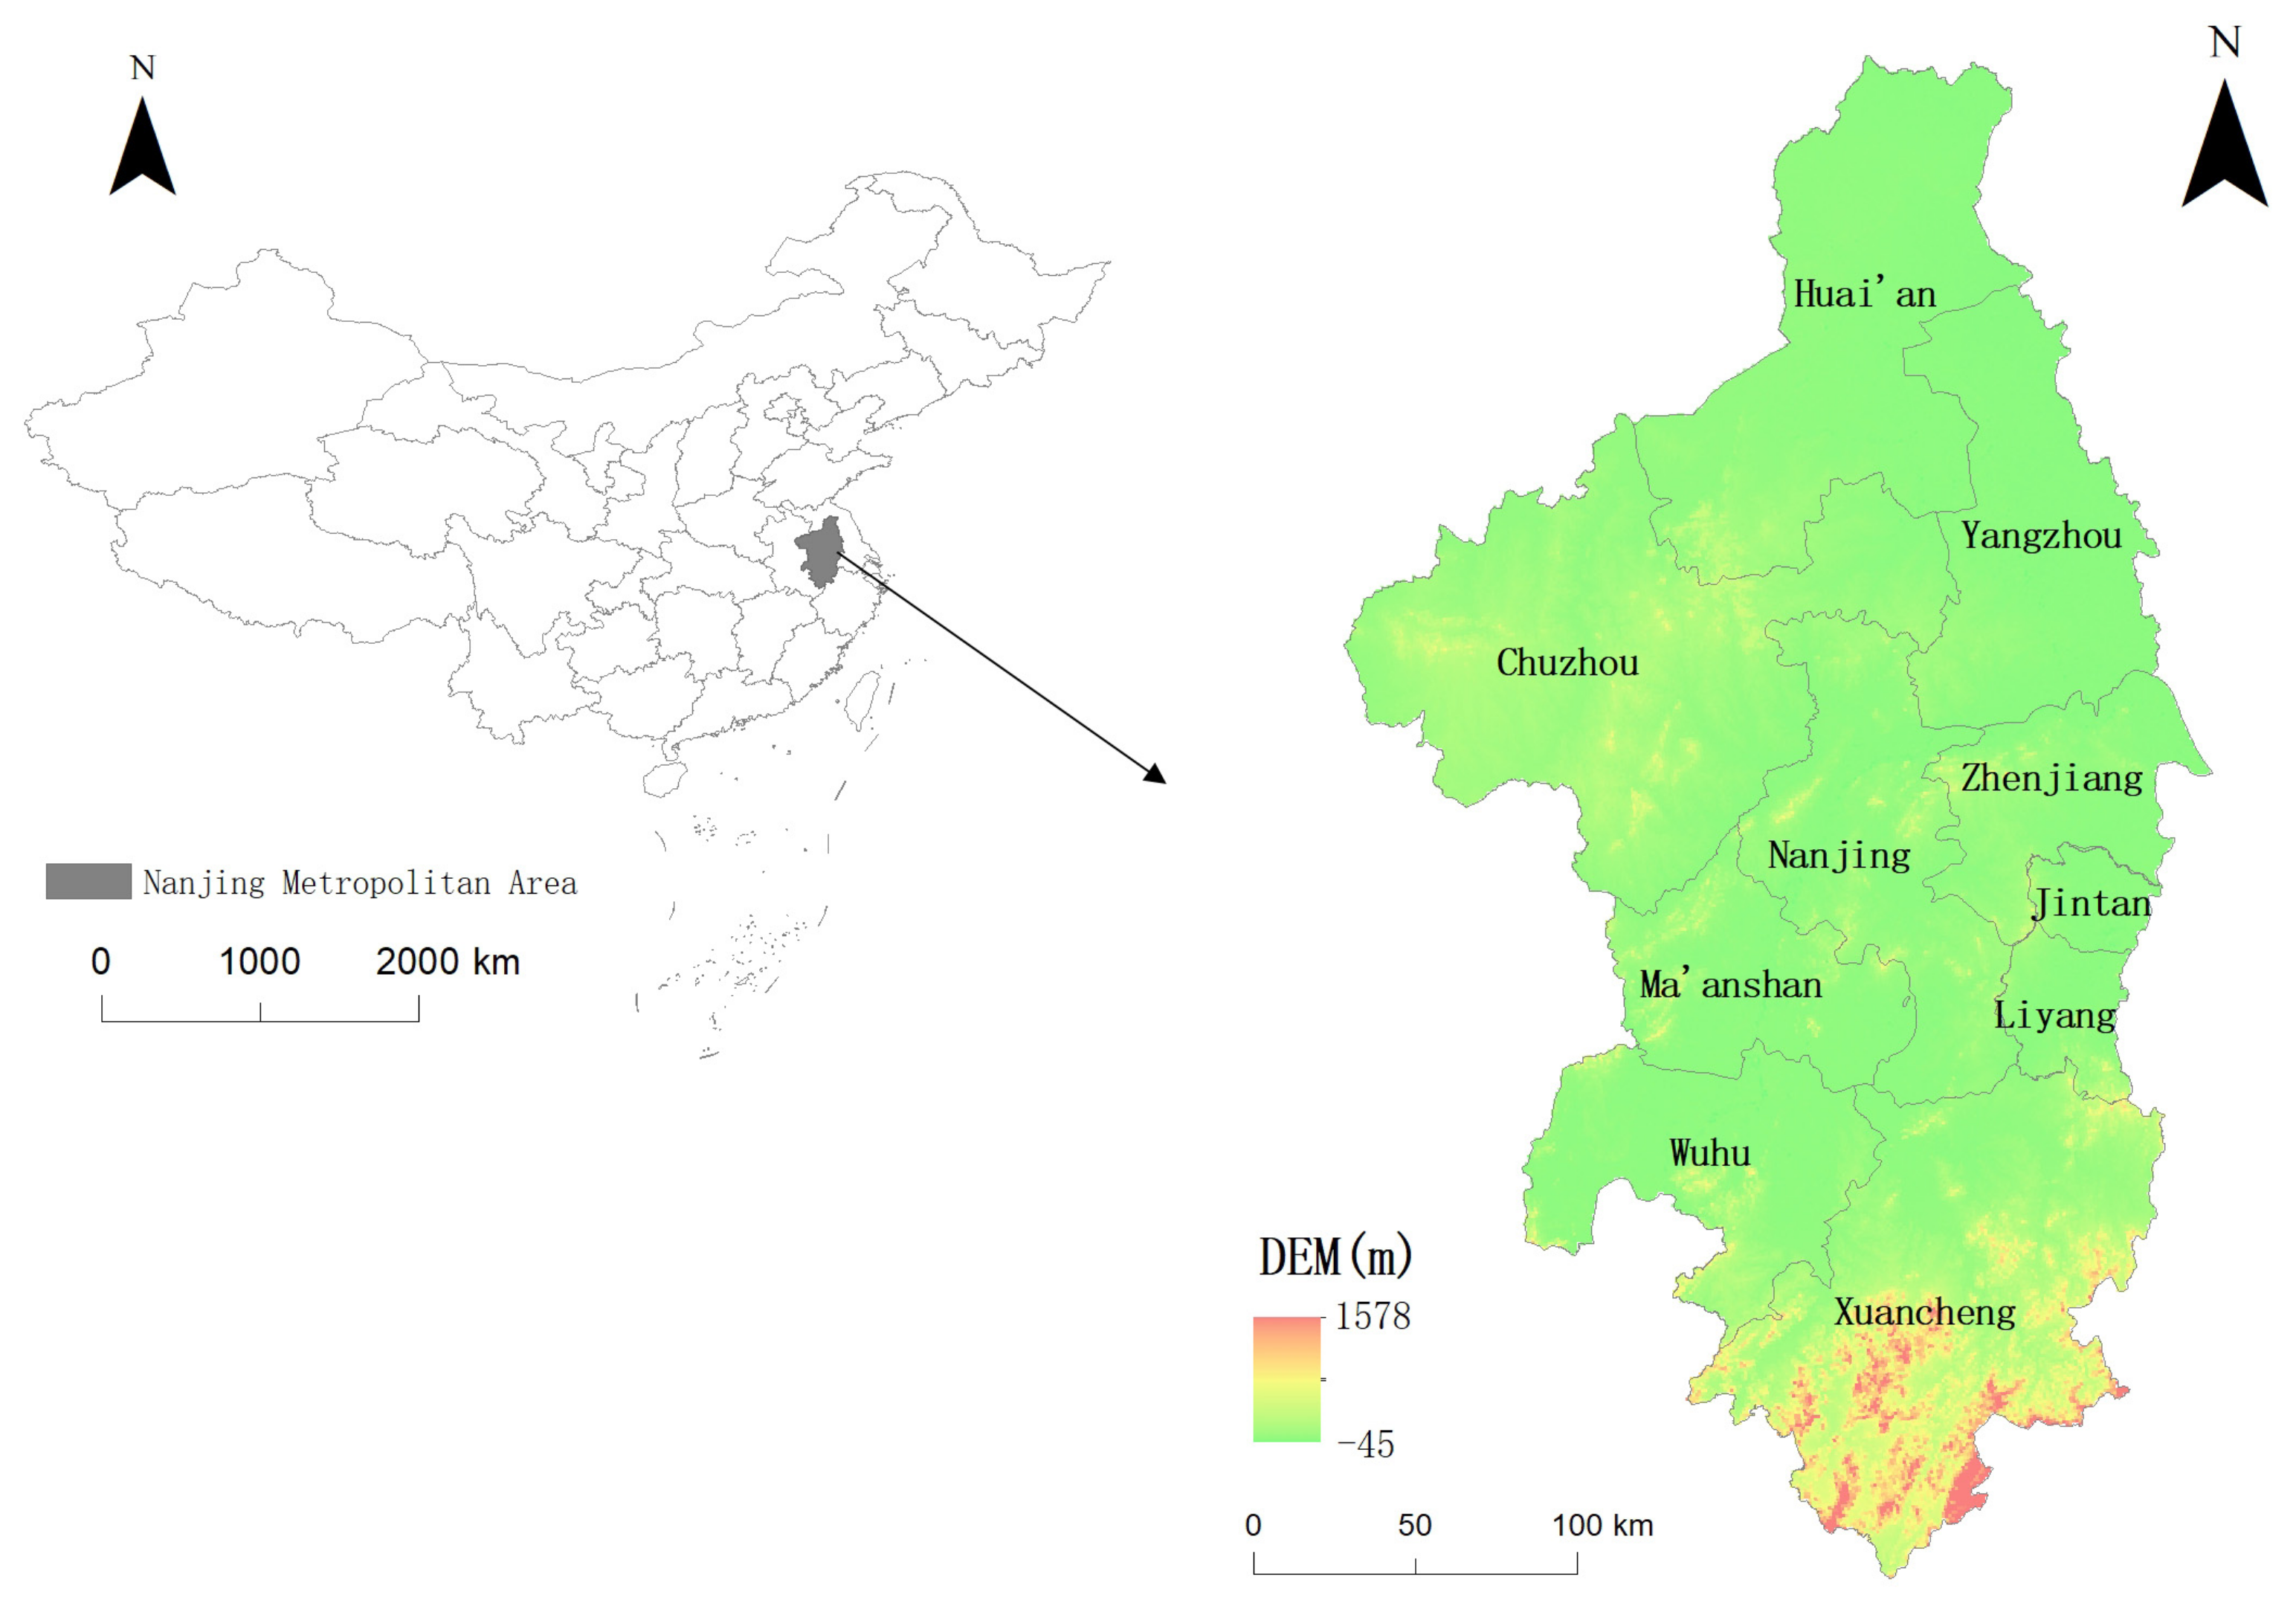
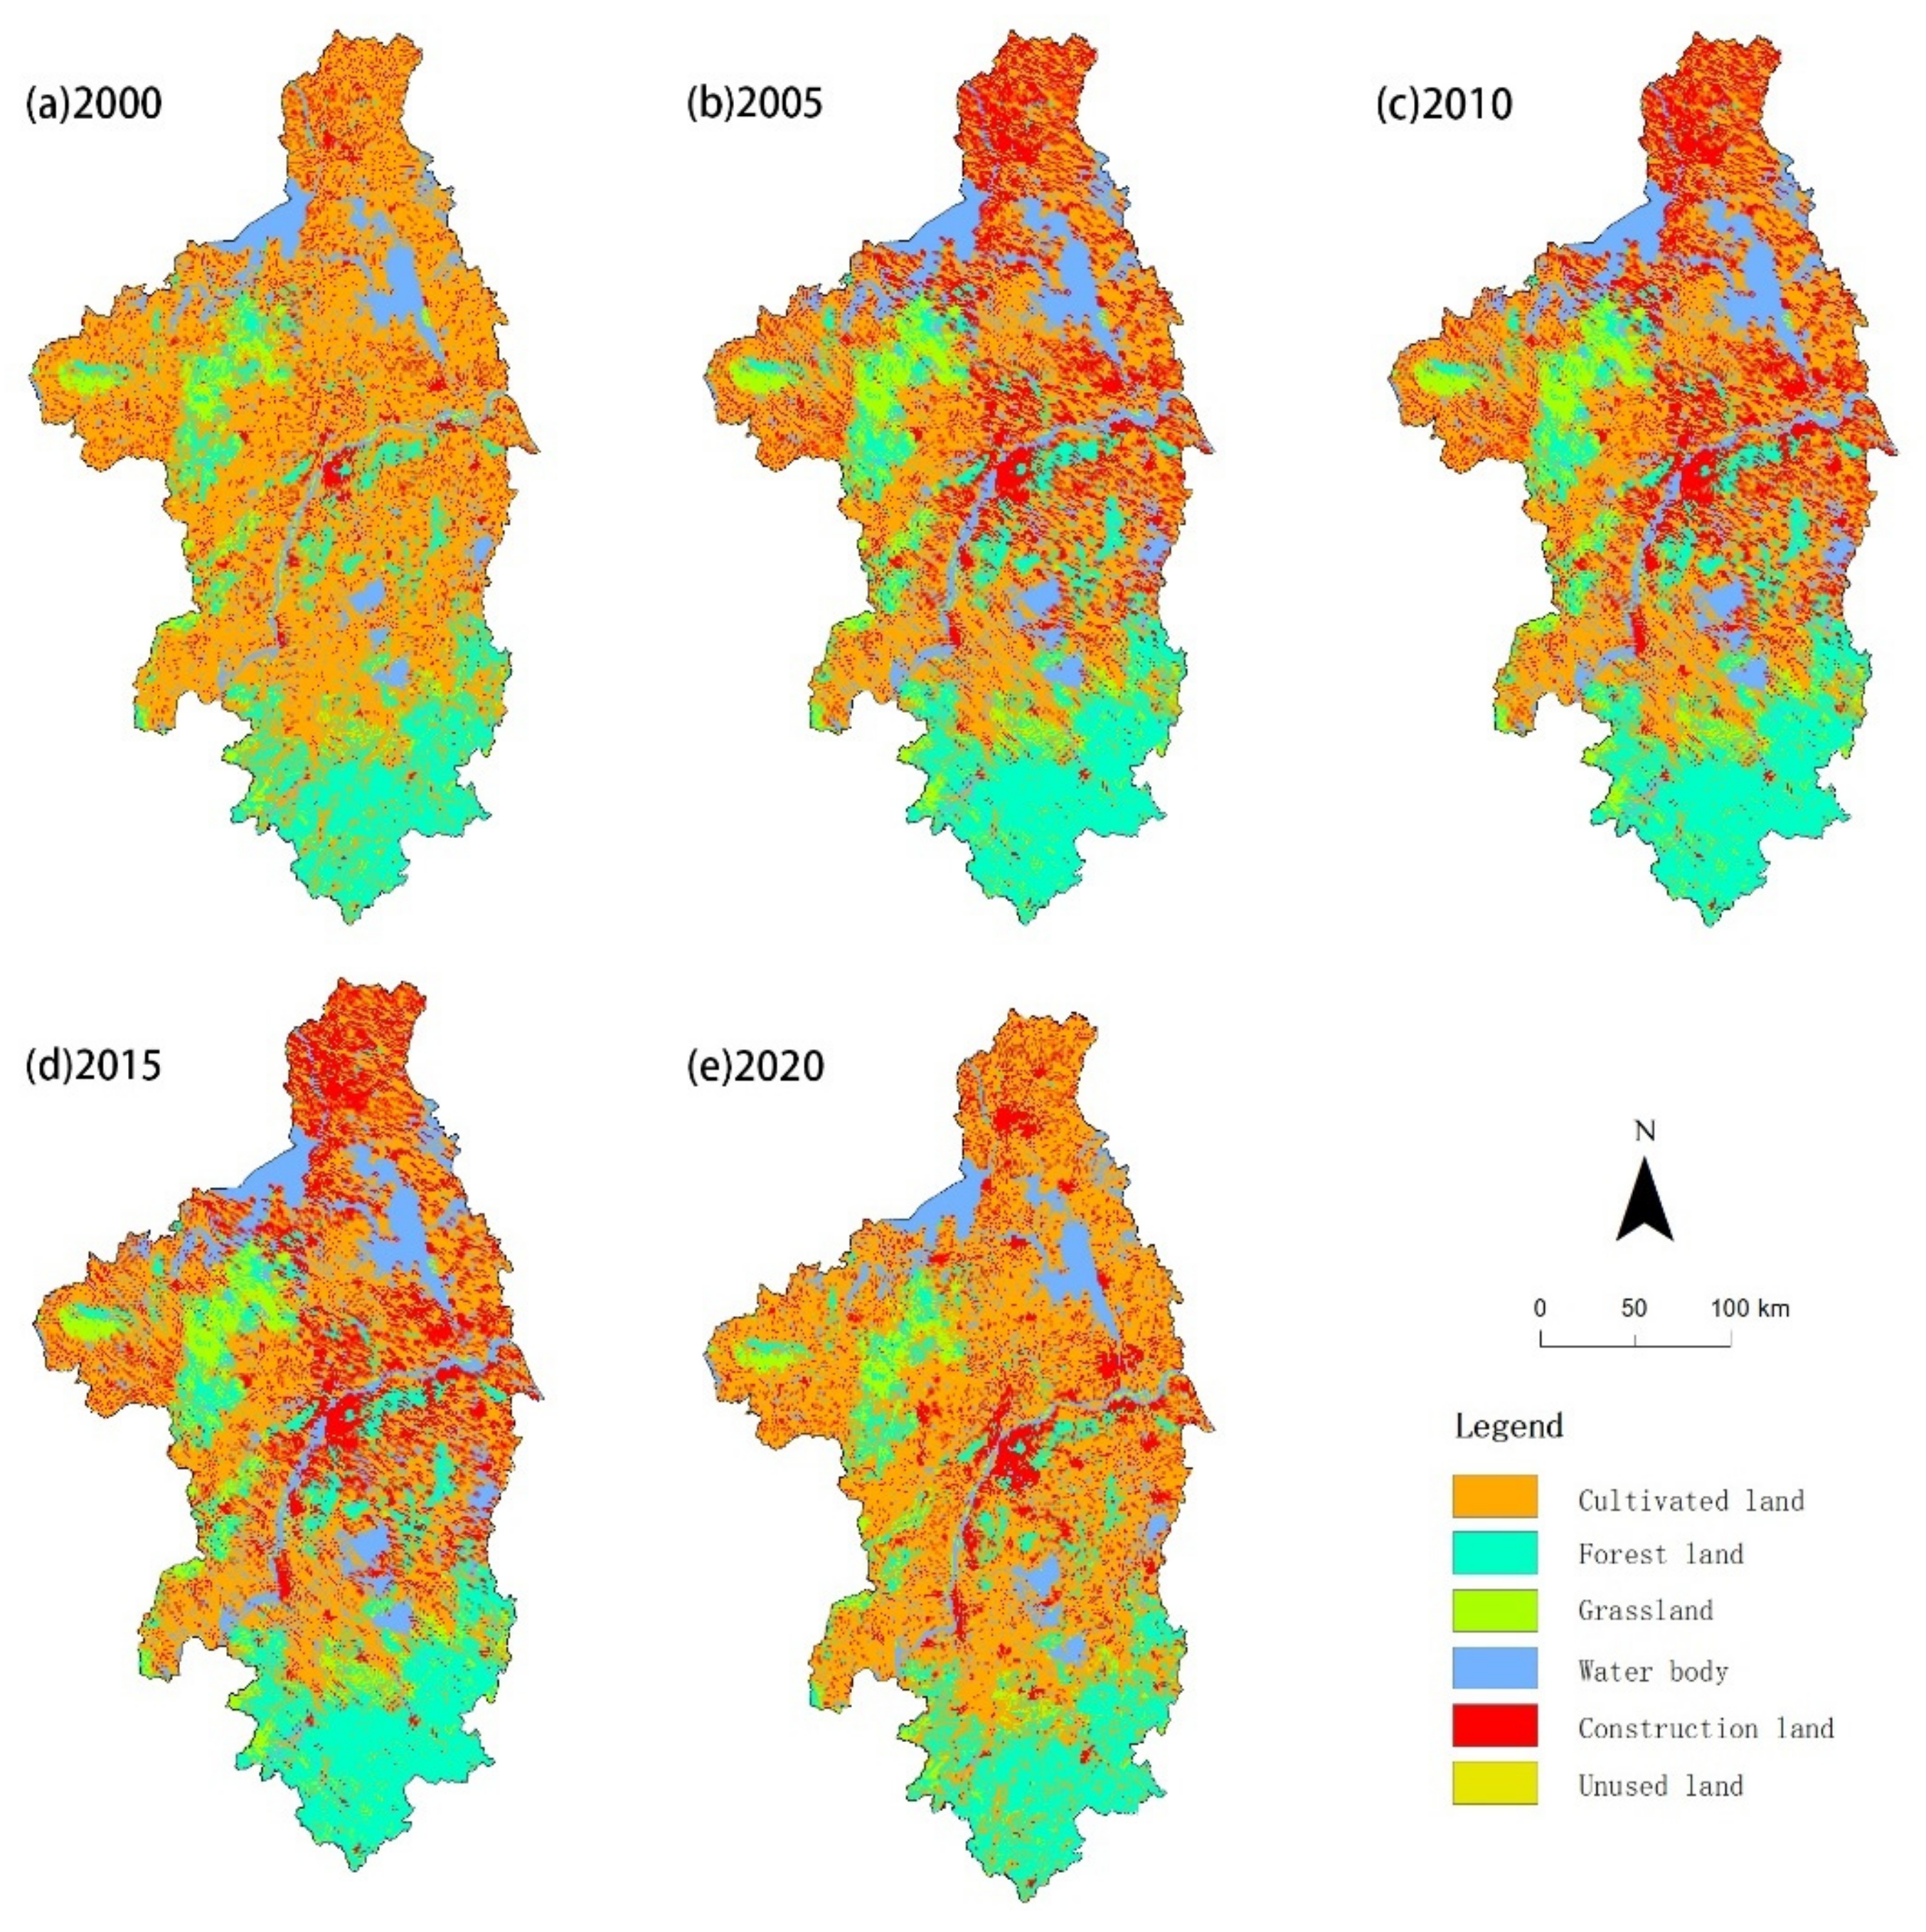
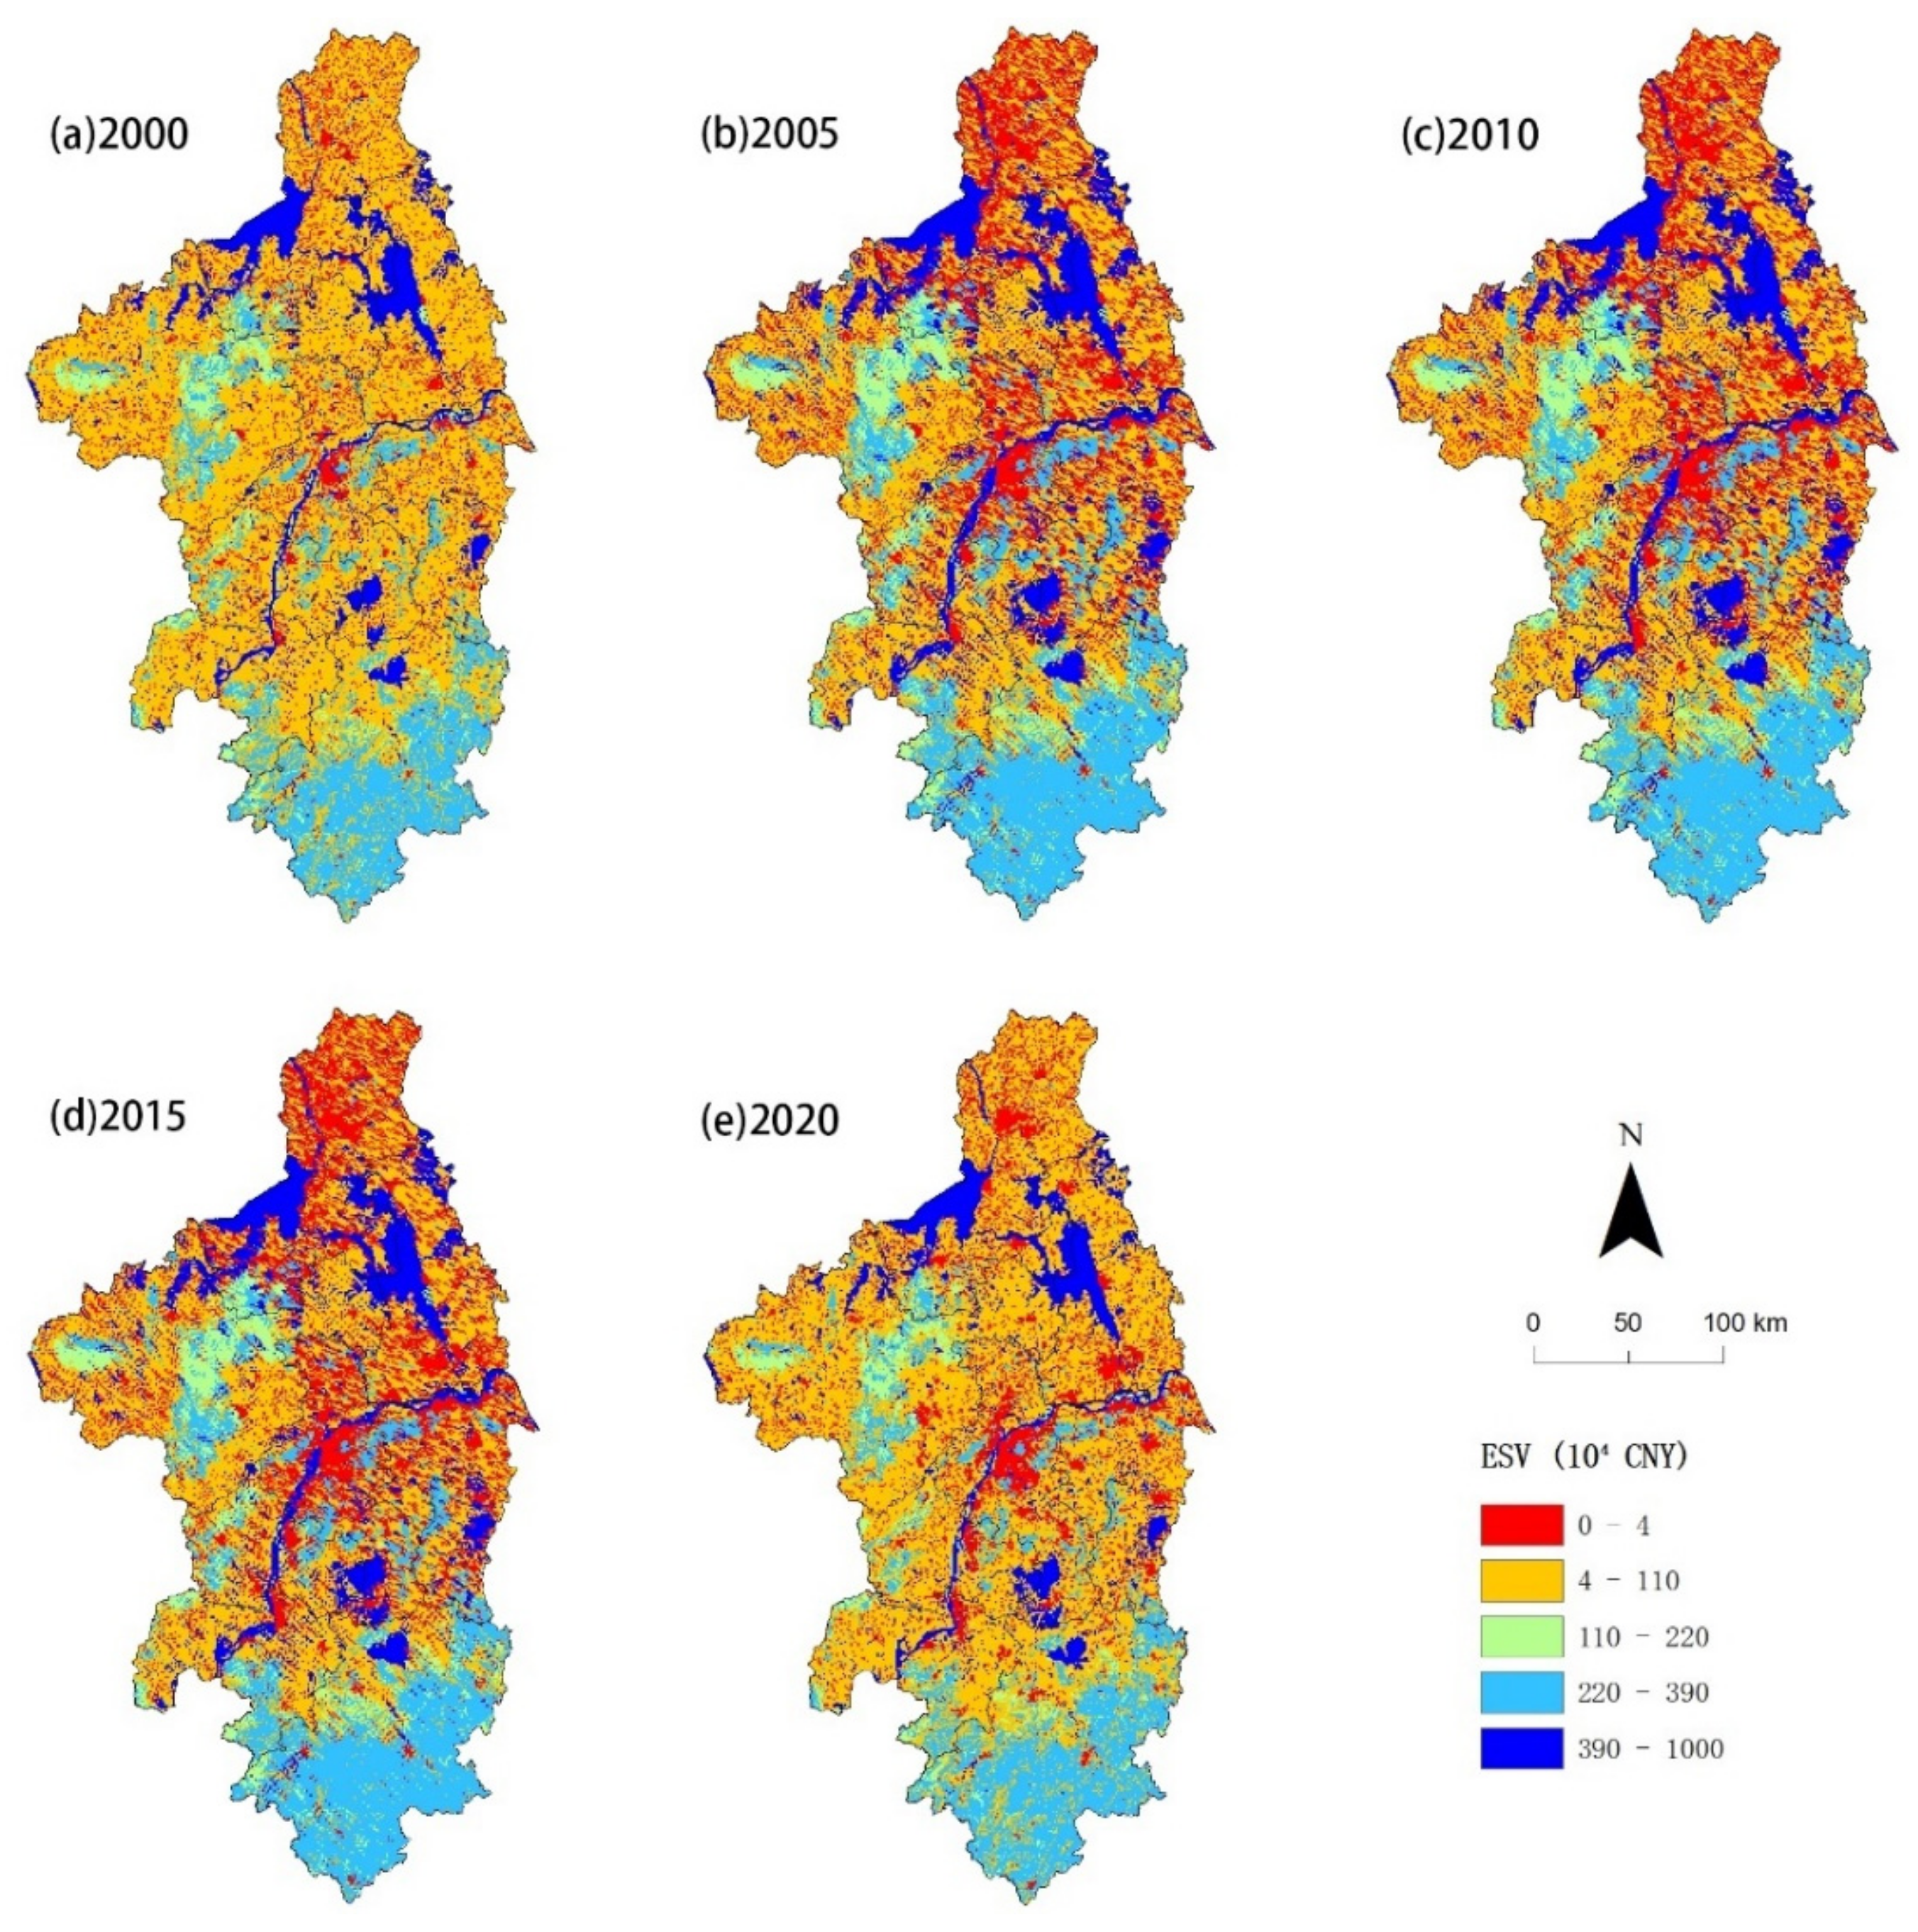
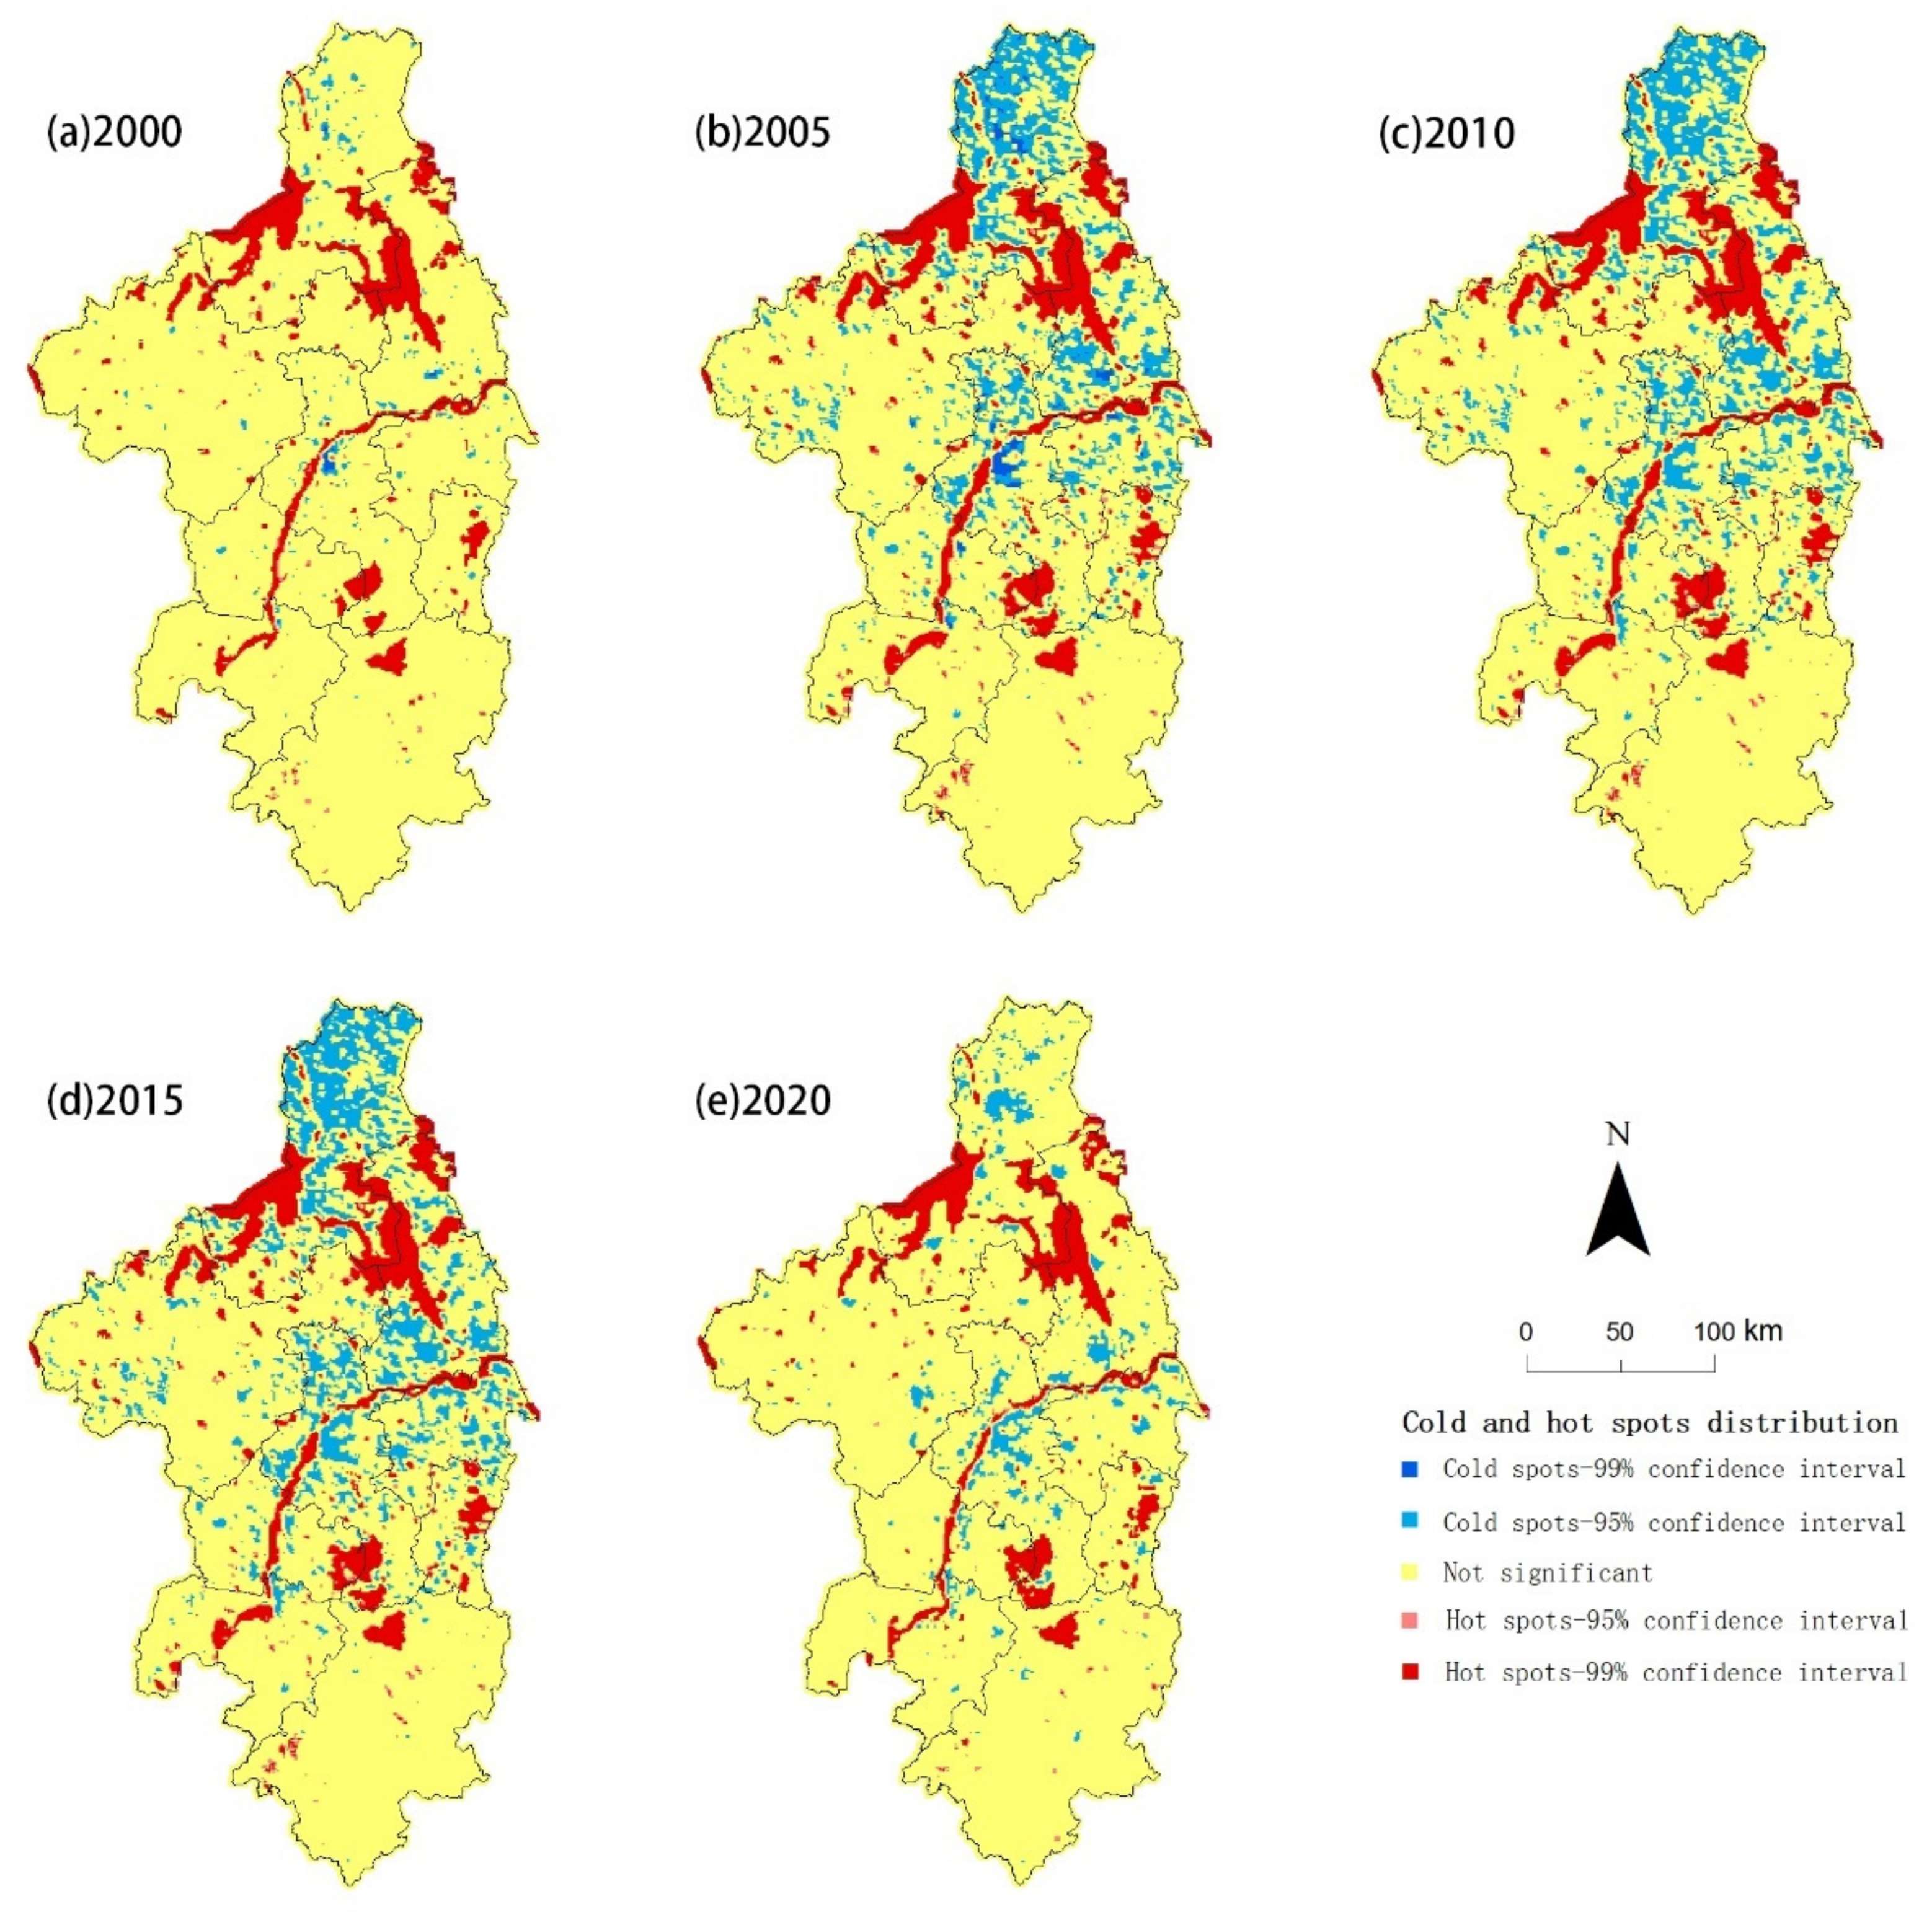
29]. Assessing the ESV and its influencing factors in the Nanjing metropolitan region is, therefore, one of the urgent issues faced by the government and ecologists. However, only a few researchers have analyzed the spatial variations in ESV and its underlying forces in the Nanjing metropolitan area. The spatio-temporal variations in the ESV and its driving factors in the Nanjing metropolitan area from 2000 to 2020 were explored in this study. The results can be helpful for the coordinated urban sustainability in the Nanjing metropolitan region as well as for the cooperative conservation and management of the environmental ecology. The following are the objectives of this paper: (1) to build a regional ESV estimation model and an index system of driving factors; (2) to measure the spatio-temporal dynamics in ESVs, as well as the links between each ecosystem service’s trade-offs and synergies; and (3) to explore the driving forces of the ESV variation using Geodetectors.

2. Materials and Methods

2.1. Study Area

The Nanjing metropolitan area (29°57′ N–34°06′ N, 117°09′ E–119°59′ E) is located in eastern China and is the core area of the urban zone along the middle and lower reaches of the Yangtze River (see Figure 1). It is the first inter-provincial metropolitan area to be officially approved in China, and the cities in it are Nanjing, Zhenjiang, Yangzhou, Huai’an, Ma’anshan, Chuzhou, Wuhu, Xuancheng, Liyang, and Jintan. The area of Nanjing metropolitan area is about 6.6 million hm2. As of 2020, the resident population is about 35.2 million, and the regional GDP is 4198.2 billion CNY. It generates an economic output of 4.1% of the total in China, with a land area of 0.7% of China and a resident population of 2.5%. The climate in the region is mostly subtropical monsoon, with an average annual temperature of approximately 17 °C and an annual precipitation of around 977 mm. The DEM rises in the south and falls in the north [30].

2.2. Data Sources and Processing

Seven driving factors were selected in this paper, including (1) physical–geographical factors: temperature (TEM), precipitation (PRE), soil organic matter (SOM), the normalized difference vegetation index (NDVI), a digital elevation model (DEM), and land use maps and (2) socioeconomic factors: the gross economic product (GDP) and population density (POP).
The datasets, including temperature, precipitation, NDVI, land use maps, DEM, GDP, and population density figures, were obtained from the Chinese Academy of Sciences’ Resource and Environmental Science and Data Center (http://www.resdc.cn/Default.aspx, accessed on 10 August 2022). Based on the continuous time series of SPOT/VEGETATION NDVI remote sensing data, the monthly NDVI dataset was obtained using the maximum synthesis method. Six groups were utilized to categorize the different types of land use: cultivated land, forest land, grassland, water body, construction land, and unused land (see Figure 2). Unused land indicates saline land, marsh land, bare land, and bare rocky land. The DEM dataset was derived from the Shuttle Radar Topography Mission (SRTM) payload onboard the Space Shuttle Endeavour. The dataset for soil organic matter (SOM) was obtained from the National Tibetan Plateau Data Center (http://data.tpdc.ac.cn/en/, accessed on 10 August 2022) [31]. These datasets were resampled to fit a regional resolution of 1 km. The datasets, including grain production, sown area, and prices, were gathered from the China Yearbook of Agricultural Price Survey and the Statistical Yearbooks produced by the Bureau of Statistics.

2.3. ESV Evaluation

Starting with the world’s and China’s ESV equivalent factor tables established by Costanza et al. [17] and Xie et al. [18,32], this article updated the ESV factor table from 2000 to 2020 based on grain production and prices inside the Nanjing metropolitan area. The ESV equivalent factor coefficient, whose value is around one-seventh of the average market value of grain produced in the research area, is determined using the comparative donation of ecosystem services that various ecosystems may supply [18]. The mean grain production in the Nanjing metropolitan area during 2000–2020 was 6427.88 kg/hm2, and the national mean minimum purchase price of rice and wheat in 2020 was 2.45 CNY/kg, so the study area’s updated ESV unit factor value was 2249.76 CNY/hm2, and the ESV coefficients per unit area were calculated and displayed in Table 1. Previous studies have discovered that the ESV in construction land is extremely low [9]; therefore, the ESV in the construction land was not considered and assigned a value of zero in this article. The ESV in the Nanjing metropolitan area can be calculated as:
E S V = A k × V C k E S V f = A k × V C f k
where E S V is the value of all ecosystem services (CNY), A k is the area of the research area’s land use type k (hm2), V C k is the ESV coefficient of land use type k (CNY/hm2/year), E S V f is the value of the ecosystem service function f (CNY), and V C f k is the ESV coefficient of the ecosystem service function f in the land use type k (CNY/hm2/year).

2.4. Sensitivity Test

A sensitivity test was performed to assess the reasonableness of the revised ESV coefficients in the Nanjing metropolitan region. In order to determine the sensitivity coefficient in this study, 50% of the ESV coefficient for each ecosystem service function was moved up and down [33], and the formula is as follows:
C S = ( E S V j E S V i ) / E S V i V C j k V C i k / V C i k
where C S is the traditional sensitivity coefficient, E S V i and E S V j are the overall value of ecosystem services prior to and following modification, respectively, and V C i k and V C j k are the ESV coefficients prior to and following modification for the land use type k , respectively. If C S ≤ 1, it means that the revised ESV coefficients are reliable, while if C S ≥ 1, it means that the revised ESV coefficients are unreliable.

2.5. Ecosystem Service Trade-Offs and Synergies

Relationships between ecosystem services can be positive (synergies), where two services are provided more frequently or less frequently at the same time, or negative (trade-offs), where one service is provided more frequently while another is provided less frequently. Ecosystem service trade-offs and synergies can be determined using the Pearson correlation coefficient. A positive result implies a synergistic relationship between the two ecosystem service functions, whereas a negative result shows a trade-off relationship [15]. The trade-offs and synergies among four categories of ecosystem services, namely supply services, regulation services, support services, and cultural services, were calculated in this paper as follows:
R x y = i = 1 n x i x ¯ y i y ¯ i = 1 n x i x ¯ 2 i = 1 n y i y ¯ 2
where R x y is the correlation coefficient, x i and y i are the values of two types of ecosystem services, and x ¯ and y ¯ are the average values of x and y, respectively.

2.6. ESV Spatial Analysis

The worldwide spatial autocorrelation analysis in this study was evaluated using Moran’s I index. Moran’s I has a range of values within (−1, 1). If Moran’s I is greater than zero, it means that the spatial distribution of ESV is positively relevant, and the higher the index, the more significant the spatial aggregation. If the value of Moran’s I is negative, it means that the spatial distribution of ESV is negatively relevant, and the lower the index, the more significant the spatial dispersion. The spatial distribution of the regional ESV hotspots and cold spots in the Nanjing metropolitan area between 2000 and 2020 was also obtained using the Hotspot Detection Tool (Getis-Ord Gi*) in the ArcGIS software (Version 10.5, Redlands, CA, USA) [34].

2.7. Driving Factors Analysis

The Geodetector method is a statistical approach created by Wang and Xu [26] that detects spatial heterogeneity and identifies the underlying variables. The method determines the impact of multi-factor interactions on the ESV in addition to detecting the influence of a single component. The Geodetector method includes four detectors: factor detector, interaction detector, risk detector, and ecological detector [26]. The factor detector and interaction detector were used in this paper to investigate the underlying factors of ESV.
The factor detector may determine how well a single factor x explains the spatial variance of attribute y using a q-value, whose model is stated as:
q = 1 h = 1 L N h σ h 2 N σ 2
where q is the strength of an explanation for a driving factor on the spatially divergent characteristics of ESV, which takes the range (0,1), and a larger number denotes a stronger ability of the independent variable x to explain the attribute y, and vice versa, that is, the greater explanatory power of the independent variable x on the attribute y, and vice versa; h is the partition of the attribute y or variable x; N h and N are the numbers of cells in partition h and the number of partitions, respectively; and σ h 2 and σ 2 are the variances of y in partition h and the variances of y in the study area, respectively.
The explanatory power of the attribute y is evaluated using the interaction detector to determine whether the interaction between factors x 1 and x 2 increases or decreases that power. The calculation process is as follows:
Firstly, separately compute the q-values of the two factors x 1 and x 2 on y : q x 1 and q x 2 .
Secondly, compute the q-value of the interaction between the two variables x 1 and x 2 : q x 1 x 2 .
Finally, compare q x 1 , q x 2 , and q x 1 x 2 . The relationship between the two factors can be classified into five categories: two-factor enhancement, linear enhancement, nonlinear attenuation, one-factor nonlinear attenuation, and independence.

3. Results and Analysis

3.1. ESV Variation and Sensitivity Analysis

The ESV coefficients for the Nanjing metropolitan region (see Table 1) and land use maps for 2000 to 2020 were utilized to calculate the ESV within each land use category (Table 2). The overall ESV rose significantly between 2000 and 2005, with the increasing value of 27,784 billion CNY. After 2005, the total ESV decreased significantly, with the decreasing value of 28,222 billion CNY. High ESV ecosystems, such as forests, grasslands, wetlands, and water bodies, have an important influence in the increase and reduction of regional ESV. Although there was considerable growth in construction land in the early stages of the study, the area of cultivated land reduced significantly as a result of the strategy of returning cropland to forestland and grassland, which led to an increase rather than a decrease in ESV. After 2005, with each region’s rapid economic growth, forms of land usage such as rivers or streams and grasslands with high ESV coefficients were encroached upon by forms of land usage such as agricultural lands and industrial lands with low ESV coefficients. This caused forest and grassland to be degraded, and then the ecological quality of the region declined. The largest total ESV appeared in water bodies; forest land, cultivated land, and grassland came next, with unused land having the smallest total ESV. Among them, the ESV of cultivated land remained in decline during 2000–2015 and then increased after 2015. The ESV of water bodies, grassland, and forest land trended in the same direction as the overall ESV, first increasing and then declining. The ESV of unused land fluctuated from year to year but showed a generally increasing trend.
The regulation services had a larger total ESV than the support and supply services, while the cultural services had the least overall ESV, as seen in Table 3. The slight increase in ESV of the hydrological regulation function and environmental purification function in the research area was driven by the expansion of the water body surface area at the time of the study, as the ESV of these two ecosystem service functions was mainly influenced by the area of water bodies. In contrast, other ecosystem service functions saw a decline in ESV, with the largest declines in the food production function and nutrient cycle maintenance function, which were caused by the decrease in the area of cultivated land and forest land during the research period because the area of either cultivated land or forest land had a significant impact on the ESV of various ecosystem service functions.
The accuracy of an ESV assessment greatly depends on the validity of the revised ESV coefficients. Therefore, a sensitivity analysis on the revised ESV coefficients was carried out in this paper (see Table 4), and the findings indicate that for every land use category, the sensitivity coefficients of the revised ESV coefficients were below 1. This indicates that the ESV for the Nanjing metropolitan region was trustworthy and stable.

3.2. Spatial Pattern in ESV

The overall ESV of the Nanjing metropolitan region displayed a geographical trend of being high in the south and low in the north in the last 20 years (see Figure 3). The reason for this is that cultivated land dominated the area north of the Nanjing metropolitan region, while forest land was extensively spread in the south of the research area (see Figure 2), and the ESV of cultivated land was lower than that of forest land (see Table 2). The lowest ESV (0–0.04 million CNY) appeared in the construction land and unused land, while the highest value (3.9–10 million CNY) appeared in the rivers, lakes, and other water bodies. The forest land also had a high ESV (2.2–3.9 million CNY), which was dispersed towards the Nanjing metropolitan area’s southern region. The ESV of the cultivated land was low, with the values ranging from 0.04 to 1.1 million CNY. The majority of the grassland was situated in the western portion of the Nanjing metropolitan region, and its ESV ranged from 1.1 to 2.2 million CNY.
Moran’s I index was computed in order to assess the global spatial autocorrelation study (Table 5). The results indicate that the Moran’s I were higher than 0.5, revealing that the geographic distribution of ESV in the Nanjing metropolitan region was dramatically spatially positively correlated and had a high degree of spatial clustering, with high values converging and low values close to each other. In general, lower levels of ecological space fragmentation are associated with more concentrated geographic distributions of ESV. The higher positive agglomeration is helpful for the division of ecological space and the realization of the co-protection and co-administration of the natural ecosystem in the Nanjing metropolitan area.
Regional ESV hot spots and cold spots were examined using the Hotspot Detection Tool to determine their spatial distribution, and the results show that the ESV hot spots were located around the Yangtze River and its environs, or in the lakes in Huai’an, northern Yangzhou, and southern Nanjing (see Figure 4 and Table 6). The ESV cold spots were mainly distributed in the construction land in Huai’an, Nanjing, Yangzhou and Zhenjiang, and the low ESV clustered significantly, indicating that the ESV in those regions was low. The number of cold spots displayed a pattern of initial increase and subsequent decrease, with the maximum number appearing in 2015. The number of hot spots fluctuated from year to year but showed a generally increasing trend. The interannual fluctuations in the number of cold and hot spots were generally similar with the regional ESV fluctuations.

3.3. Spatial Variation in ESV

Figure 5 shows that during the period 2000–2020, the ESV had primarily demonstrated a downward trend in the Nanjing metropolitan area’s northwest, central, and southern regions, while in the water bodies and their surrounding areas, the ESV had mainly shown an increasing trend. The regions with decreasing ESV accounted for 33.69% within the Nanjing metropolitan area. Among them, there was approximately 17.67% of the research area where the ESV decline rate was greater than 2, and they were primarily spread in the research area’s central and northern regions. Within the Nanjing metropolitan area, regions with increasing ESV accounted for 20.40% of the total. Among them, there was approximately 13.37% of the study area where the ESV growth rate was greater than 2, and they were primarily spread in southwestern Nanjing and northern Xuancheng.

3.4. Factors Affecting ESV

The ESV in the Nanjing metropolitan area was affected by both physical–geographical factors and socioeconomic factors. Using the factor detector, it was possible to assess the explanatory power of the variables influencing the geographic variations in ESV (see Figure 6), and the results show that the explanatory strength of factors in descending order was population density (17.5%) > DEM (14.7%) > NDVI (13.0%) > precipitation (11.7%) > GDP (8.3%) > soil organic matter (7.2%) > temperature (4.3%). The population density was the main socioeconomic factor influencing ESV spatial variation, while the major physical–geographical factors were the DEM, NDVI, and precipitation. The impact of temperature on ESV was the lowest.
The effect of two-factor interaction on the ESV variation was also investigated using the interaction detector (see Figure 6). The results show that, in contrast to the explanatory strength of a single element on the ESV, the impact of any individual element on the ESV under interaction is significantly increased. After interacting with physical–geographical factors, the impact of the GDP and population density on ESV was brought to light. It implies that socioeconomic factors had a significant interaction in combination with physical–geographical factors. The interplay between the NDVI and GDP showed the most obvious effect on the ESV, reaching 31.71% of the explanatory strength for ESV variation.

3.5. Trade-Offs and Synergies Affecting ESV

Figure 7 depicts the trade-offs and synergies between supply service value, regulation service value, support service value, and cultural service value. The results show that during the period 2000–2020, the trade-offs and synergies between the ESVs were mainly synergies. However, there were still trade-offs among the ESVs. In the Nanjing metropolitan region, the trade-offs between supply and cultural service values made up 17.85% of the total area, while those between supply and regulation service values made up 17.15%. These areas were distributed spatially in a largely uniform manner and were most spread in the central part of Xuancheng, Wuhu, Ma’anshan, Liyang, Chuzhou, and southern Huai’an. The areas with trade-offs between supply service value and support service value made up 9.28% of the Nanjing metropolitan area, primarily in the eastern Ma’anshan, southern Huai’an, and northern Wuhu. In the Nanjing metropolitan region, the trade-offs between regulation service value and support service value made up 7.85% of the total area, while those between support service value and cultural service value made up 7.27%. These areas were distributed spatially in a largely uniform manner and were mainly distributed in northern Wuhu, southeastern Ma’anshan, northern Yangzhou, western Chuzhou, and southern Huai’an. The areas with trade-offs between regulation service value and cultural service value only made up 0.42% of the Nanjing metropolitan area.
According to Figure 5 and Figure 7, the results show that the trade-offs among the ESVs affected the spatial variation in ESV. The areas with trade-offs between supply-cultural service value, supply-regulation service value, supply-support service value, and regulation-support service value accounted for 26.81%, 21.66%, 16.33% and 14.97% of the area where the ESV was declining, respectively.

3.6. Factors Affecting Trade-Offs and Synergies

The physical–geographical factors and socioeconomic factors affected the trade-offs and synergies (TOSs) among supply service value, regulation service value, support service value, and cultural service value. Figure 8 shows that, in contrast to the limited strength of a single factor on the TOSs, the influence of all single factors on the TOSs under interaction is greatly increased. The interaction between SOM and GDP had the most obvious effect on the TOSs between supply service value and support service value, while the effect of the interaction between SOM and precipitation was more substantial for the other five TOSs.
The TOSs for supply service value, regulation service value, support service value, and cultural service value were also impacted by land use change. The change in land usage from high-ESV type to low-ESV type resulted in trade-off relationships among the ESVs. According to Figure 7a–f, the regions where land usage patterns had transformed from high–ESV type to low–ESV type made up 50.27%, 46.52%, 49.91%, 43.95%, 43.23%, and 40.24% of the trade-off regions, respectively.

4. Discussion

4.1. Comparison with Previous Work

In this paper, the ESV in the Nanjing metropolitan area during 2000–2020 was calculated based on the world’s and China’s ESV equivalent factor tables established by Costanza et al. [5] and Xie et al. [32]. The computed ESVs agreed with the findings of Cao et al. [35]. In the Nanjing metropolitan area, the key factors impacting the spatial variations in ESV were the POP, DEM, and NDVI, with socioeconomic factors having a stronger influence on the spatial variations in ESV. This is in line with the results found in the Yangtze River Economic Belt reported by Liu et al. [12] and Long et al. [11]. However, our result is different from those found in northeastern China reported by Yi et al. [9]. It is possible that this difference is due to the region’s unique climatic circumstances. The Nanjing metropolitan region is situated in eastern China, with suitable hydrothermal conditions for vegetation growth. Therefore, the ESV variations are more likely to be influenced by socioeconomic factors. This is in line with the results of He et al. [36] in Sichuan Province and Wang et al. [37] in Xinjiang.

4.2. Policy Implications

At the root of the urban ecological catastrophe is the degradation and eradication of urban ecological services [38]. While ecological land, along with forest land, grassland, and garden land, has been severely encroached upon, urbanization in the Nanjing metropolitan region has propelled the construction of construction land. Policies that are pertinent to ecological protection have an excellent effect on the growth of ESV. We need to take targeted measures to mitigate the conflict between ESV and urbanization needs based on research findings [38]. For example, the high-ESV regions and the regions with severe ESV degradation should be protected. In addition, with the significant impact of population density on ESV, the massive pressure that population increase puts on the ecosystem must be relieved in order to better control excessive and rapid population growth.
In land-use decisions, TOSs among ESVs also need to be taken into account [39]. For example, land development that guarantees food security necessarily leads to diminished preservation of soil and water and hydrological regulation. As a result, it is crucial to develop scientific, rational, and practice-oriented decisions to avoid negative trade-offs and promote positive synergies. It is possible to break through administrative boundaries in the future management of ESVs, implement integrated management of ESVs in the Nanjing metropolitan area, restrict agricultural development around the Yangtze River and lakes, and protect their regulation services and support services. At the same time, in the surrounding regions of cities and towns where cultivated land is the primary land use type, consideration should be given to protecting food production functions and strictly limiting the takeover of farming areas by the extension of industrial land.

4.3. Shortcomings and Prospects

Geographers and ecologists have devoted a lot of attention to the study of ESV since Costanza first introduced the concept of ESV [40]. Research on ESV has gradually shifted from the early days of assessing their value to examining the distribution of ESVs in various ecosystem types and their driving variables. However, the exploration of spatio-temporal patterns of change and their driving mechanisms is a step-by-step task due to the complexity of ecosystems. The Geodetector method can better reveal the geographical scale driving mechanisms of the regional ESV spatial divergence phenomenon, but the motivating factors still need to be further explored at the temporal scale. In the future, the existing index system can be expanded to examine the mechanisms underlying regional ESV evolution at multiple scales across time and space.

5. Conclusions

Using the method of updated unit area value equivalent factor, this paper estimated the ecosystem service value in the Nanjing metropolitan area and analyzed the ecosystem service value fluctuations in space and time and the factors that affect it. The findings indicate that:
(1)
The overall value of ecosystem services decreased between 2000 and 2020. Moreover, the ecosystem service value in the southern section of the Nanjing metropolitan region was higher than in the northern portion. The spatial distribution of the value of ecosystem services was significantly spatially positively correlated and showed a high level of spatial clustering.
(2)
The highest overall ecosystem service value appeared in the water bodies, followed by forest land, cultivated land, and grassland, with construction land and unused land having the smallest total ecosystem service value.
(3)
The population density was the primary socioeconomic factor influencing the spatial variation of ecosystem service value, while the digital elevation model, normalized difference vegetation index, and precipitation were the primary physical–geographical factors.
(4)
The impact of the gross economic product and population density on the ecosystem service value was highlighted after interacting with physical–geographical factors. The interaction between the normalized difference vegetation index and gross economic product had the most obvious effect on the ecosystem service value.
(5)
The synergies and trade-offs that exist between the value of supply service, regulation service, support service, and cultural service affect the spatial variations in ecosystem service value.

Author Contributions

Data curation, X.L.; Funding acquisition, S.C.; Investigation, Z.Z.; Methodology, X.L. and L.Y.; Project administration, S.C.; Writing—original draft, S.C. and X.L. All authors have read and agreed to the published version of the manuscript.

Funding

This research was funded by the Major Project of the Philosophy and Social Science Foundation of the Jiangsu Higher Education Institutions of China (Grant number 2021SJZDA130).

Institutional Review Board Statement

Not applicable.

Informed Consent Statement

Not applicable.

Data Availability Statement

Not applicable.

Conflicts of Interest

The authors declare no conflict of interest.

References

  1. Millennium Ecosystem Assessment Board. Millennium Ecosystem Assessment: Frameworks; World Resources Institute: Washington, DC, USA, 2005. [Google Scholar]
  2. Brondizio, E.S.; Settele, J.; Díaz, S.; Ngo, H.T. Global Assessment Report on Biodiversity and Ecosystem Services of the Intergovernmental Science-Policy Platform on Biodiversity and Ecosystem Services; IPBES Secretariat: Bonn, Germany, 2019. [Google Scholar]
  3. World Economic Forum. Nature Risk Rising: Why the Crisis Engulfing Nature Matters for Business and the Economy. In Collaboration with PwC; New Nature Economy Series; WEF: Geneve, Switzerland, 2020. [Google Scholar]
  4. Liu, Z.; Wang, S.J.; Fang, C. Spatiotemporal evolution and influencing mechanism of ecosystem service value in the Guangdong-Hong Kong-Macao Greater Bay Area. J. Geogr. Sci. 2021, 76, 2797–2813. [Google Scholar]
  5. Costanza, R.; de Groot, R.; Sutton, P.; van der Ploeg, S.; Anderson, S.J.; Kubiszewski, I.; Farber, S.; Turner, R.K. Changes in the global value of ecosystem services. Glob. Environ. Chang.-Hum. Policy Dimens. 2014, 26, 152–158. [Google Scholar] [CrossRef]
  6. Li, Y.; Tan, M.; Hao, H. The impact of global cropland changes on terrestrial ecosystem services value, 1992–2015. J. Geogr. Sci. 2019, 29, 323–333. [Google Scholar] [CrossRef] [Green Version]
  7. Song, W.; Deng, X. Land-use/land-cover change and ecosystem service provision in China. Sci. Total Environ. 2017, 576, 705–719. [Google Scholar] [CrossRef] [PubMed]
  8. Yang, R.F.; Ren, F.; Xu, W.X.; Ma, X.Y.; Zhang, H.W.; He, W.W. China’s ecosystem service value in 1992–2018: Pattern and anthropogenic driving factors detection using Bayesian spatiotemporal hierarchy model. J. Environ. Manag. 2022, 302, 114089. [Google Scholar] [CrossRef]
  9. Shang, Y.; Wang, D.; Liu, S.; Li, H. Spatial-Temporal Variation and Mechanisms Causing Spatial Differentiation of Ecosystem Services in Ecologically Fragile Regions Based on Value Evaluation: A Case Study of Western Jilin, China. Land 2022, 11, 629. [Google Scholar] [CrossRef]
  10. Song, F.; Su, F.L.; Mi, C.X.; Sun, D. Analysis of driving forces on wetland ecosystem services value change: A case in Northeast China. Sci. Total Environ. 2021, 751, 141778. [Google Scholar] [CrossRef]
  11. Long, X.; Lin, H.; An, X.; Chen, S.; Qi, S.; Zhang, M. Evaluation and analysis of ecosystem service value based on land use/cover change in Dongting Lake wetland. Ecol. Indic. 2022, 136, 108619. [Google Scholar] [CrossRef]
  12. Yang, L.; Jiao, H. Spatiotemporal Changes in Ecosystem Services Value and Its Driving Factors in the Karst Region of China. Sustainability 2022, 14, 6695. [Google Scholar] [CrossRef]
  13. Ma, X.; Zhu, J.; Zhang, H.; Yan, W.; Zhao, C. Trade-offs and synergies in ecosystem service values of inland lake wetlands in Central Asia under land use/cover change: A case study on Ebinur Lake, China. Glob. Ecol. Conserv. 2020, 24, e01253. [Google Scholar] [CrossRef]
  14. Liu, H.; Zheng, L.; Wu, J.; Liao, Y. Past and future ecosystem service trade-offs in Poyang Lake Basin under different land use policy scenarios. Arab. J. Geosci. 2020, 13, 46. [Google Scholar] [CrossRef]
  15. Liu, H.; Wu, J.; Liao, M. Ecosystem service trade-offs upstream and downstream of a dam: A case study of the Danjiangkou dam, China. Arab. J. Geosci. 2019, 12, 17. [Google Scholar] [CrossRef] [Green Version]
  16. Zuo, L.; Jiang, Y.; Gao, J.; Du, F.; Zhang, Y. Quantitative separation of multi-dimensional driving forces of ecosystem services in the ecological conservation red line area. J. Geogr. Sci. 2022, 77, 2174–2188. [Google Scholar]
  17. Costanza, R.; d’Arge, R.; de Groot, R.; Farber, S.; Grasso, M.; Hannon, B.; Limburg, K.; Naeem, S.; O’Neill, R.V.; Paruelo, J.; et al. The value of the world’s ecosystem services and natural capital. Nature 1997, 387, 253–260. [Google Scholar] [CrossRef]
  18. Xie, G.; Zhen, L.; Lu, C.; Xiao, Y.; Chen, C. Expert Knowledge Based Valuation Method of Ecosystem Services in China. J. Nat. Resour. 2008, 23, 911–919. [Google Scholar]
  19. Wang, Y.; Pan, J. Building ecological security patterns based on ecosystem services value reconstruction in an arid inland basin: A case study in Ganzhou District, NW China. J. Clean. Prod. 2019, 241, 118337. [Google Scholar] [CrossRef]
  20. Xiao, R.; Lin, M.; Fei, X.; Li, Y.; Zhang, Z.; Meng, Q. Exploring the interactive coercing relationship between urbanization and ecosystem service value in the Shanghai-Hangzhou Bay Metropolitan Region. J. Clean. Prod. 2020, 253, 119803. [Google Scholar] [CrossRef]
  21. Wu, C.; Chen, B.; Huang, X.; Wei, Y.H.D. Effect of land-use change and optimization on the ecosystem service values of Jiangsu province, China. Ecol. Indic. 2020, 117, 106507. [Google Scholar] [CrossRef]
  22. Rao, Y.; Zhou, M.; Ou, G.; Dai, D.; Zhang, L.; Zhang, Z.; Nie, X.; Yang, C. Integrating ecosystem services value for sustainable land-use management in semi-arid region. J. Clean. Prod. 2018, 186, 662–672. [Google Scholar] [CrossRef]
  23. Shi, L.; Halik, U.; Mamat, Z.; Aishan, T.; Abliz, A.; Welp, M. Spatiotemporal investigation of the interactive coercing relationship between urbanization and ecosystem services in arid northwestern China. Land Degrad. Dev. 2021, 32, 4105–4120. [Google Scholar] [CrossRef]
  24. Li, S.; Yang, H.; Liu, J.; Lei, G. Towards Ecological-Economic Integrity in the Jing-Jin-Ji Regional Development in China. Water 2018, 10, 1653. [Google Scholar] [CrossRef] [Green Version]
  25. Chen, M.; Lu, Y.; Ling, L.; Wan, Y.; Luo, Z.; Huang, H. Drivers of changes in ecosystem service values in Ganjiang upstream watershed. Land Use Policy 2015, 47, 247–252. [Google Scholar] [CrossRef]
  26. Wang, J.; Xu, C. Geodetector: Principle and prospective. J. Geogr. Sci. 2017, 72, 116–134. [Google Scholar]
  27. Bai, L.; Jiang, L.; Yang, D.Y.; Liu, Y.B. Quantifying the spatial heterogeneity influences of natural and socioeconomic factors and their interactions on air pollution using the geographical detector method: A case study of the Yangtze River Economic Belt, China. J. Clean. Prod. 2019, 232, 692–704. [Google Scholar] [CrossRef]
  28. Liu, X.; Wang, H.; Wang, X.; Bai, M.; He, D. Driving factors and their interactions of carabid beetle distribution based on the geographical detector method. Ecol. Indic. 2021, 133, 108393. [Google Scholar] [CrossRef]
  29. Liu, W.; Zhan, J.; Zhao, F.; Wang, C.; Zhang, F.; Teng, Y.; Chu, X.; Kumi, M.A. Spatio-temporal variations of ecosystem services and their drivers in the Pearl River Delta, China. J. Clean. Prod. 2022, 337, 130466. [Google Scholar] [CrossRef]
  30. Liu, W.; Xu, H.; Zhang, X.; Jiang, W. Green Infrastructure Network Identification at a Regional Scale: The Case of Nanjing Metropolitan Area, China. Forests 2022, 13, 735. [Google Scholar] [CrossRef]
  31. Shangguan, W.; Dai, Y.J.; Liu, B.Y.; Zhu, A.X.; Duan, Q.Y.; Wu, L.Z.; Ji, D.Y.; Ye, A.Z.; Yuan, H.; Zhang, Q. A China data set of soil properties for land surface modeling (EI). J. Adv. Model. Earth Syst. 2013, 5, 212–224. [Google Scholar] [CrossRef]
  32. Xie, G.; Zhang, C.; Zhang, L.; Chen, W.; Li, S. Improvement of the Evaluation Method for Ecosystem Service Value Based on Per Unit Area. J. Nat. Resour. 2015, 30, 1243–1254. [Google Scholar]
  33. Pan, N.; Guan, Q.; Wang, Q.; Sun, Y.; Li, H.; Ma, Y. Spatial Differentiation and Driving Mechanisms in Ecosystem Service Value of Arid Region: A case study in the middle and lower reaches of Shule River Basin, NW China. J. Clean. Prod. 2021, 319, 128718. [Google Scholar] [CrossRef]
  34. Li, Z.; Sun, Z.; Tian, Y.; Zhong, J.; Yang, W. Impact of Land Use/Cover Change on Yangtze River Delta Urban Agglomeration Ecosystem Services Value: Temporal-Spatial Patterns and Cold/Hot Spots Ecosystem Services Value Change Brought by Urbanization. Int. J. Environ. Res. Public Health 2019, 16, 123. [Google Scholar] [CrossRef] [Green Version]
  35. Cao, J.; Wang, L.; Cao, W. Research on Ecological Zoning Based on the Differential Pattern of Ecosystem Service Supply and Denmand—Taking Nanjing Metropolitan Area as an Example. Resour. Dev. Mark. 2022, 38, 520–528. [Google Scholar]
  36. He, C.; Shao, H.; Xian, W. Spatiotemporal Variation and Driving Forces Analysis of Eco-System Service Values: A Case Study of Sichuan Province, China. Int. J. Environ. Res. Public Health 2022, 19, 8595. [Google Scholar] [CrossRef]
  37. Wang, Y.; Shataer, R.; Zhang, Z.; Zhen, H.; Xia, T. Evaluation and Analysis of Influencing Factors of Ecosystem Service Value Change in Xinjiang under Different Land Use Types. Water 2022, 14, 1424. [Google Scholar] [CrossRef]
  38. Luo, Q.; Zhou, J.; Li, Z.; Yu, B. Spatial differences of ecosystem services and their driving factors: A comparation analysis among three urban agglomerations in China’s Yangtze River Economic Belt. Sci. Total Environ. 2020, 725, 138452. [Google Scholar] [CrossRef]
  39. Pan, S.; Liang, J.; Chen, W.; Li, J.; Liu, Z. Gray Forecast of Ecosystem Services Value and Its Driving Forces in Karst Areas of China: A Case Study in Guizhou Province, China. Int. J. Environ. Res. Public Health 2021, 18, 12404. [Google Scholar] [CrossRef]
  40. Li, W.; Wang, L.; Yang, X.; Liang, T.; Zhang, Q.; Liao, X.; White, J.R.; Rinklebe, J. Interactive influences of meteorological and socioeconomic factors on ecosystem service values in a river basin with different geomorphic features. Sci. Total Environ. 2022, 829, 154595. [Google Scholar] [CrossRef]
Figure 1. Location of the Nanjing metropolitan area.
Forests 14 00113 g001
Figure 2. Maps of land use in the Nanjing metropolitan area from 2000 to 2020.
Forests 14 00113 g002
Figure 3. Spatial distribution of ESV per unit area during 2000–2020.
Forests 14 00113 g003
Figure 4. ESV cold spots and hot spots distribution during 2000–2020.
Forests 14 00113 g004
Figure 5. ESV trends from 2000 to 2020.
Forests 14 00113 g005
Figure 6. The impact of single-factor and two-factor interaction on the ESV variation. DEM is the digital elevation model, GDP is the gross economic product, NDVI is the normalized difference vegetation index, POP is population density, PRE is precipitation, SOM is soil organic matter, and TEM is temperature.
Forests 14 00113 g006
Figure 7. The trade-offs and synergies between (a) supply service value and cultural service value, (b) supply service value and regulation service value, (c) supply service value and support service value, (d) regulation service value and support service value, (e) support service value and cultural service value, and (f) regulation service value and cultural service value.
Forests 14 00113 g007
Figure 8. The impact of single-factor and two-factor interaction on the trade-offs and synergies.
Forests 14 00113 g008
Table 1. The ESV coefficients per unit area in the Nanjing metropolitan area.
Class One TypeClass Two TypeUnit Area Value Coefficient by Land Use Type/(CNY/hm2/year)
Cultivated LandForest LandGrasslandWaterUnused Land
Supply servicesFood production2249.76497.90424.14737.630.00
Raw material production313.491161.76626.98258.170.00
Regulation servicesGas regulation1844.073817.222231.32885.1536.88
Climate regulation958.9111,433.215882.572618.570.00
Environment purification276.613319.321936.275274.03184.41
Hydrological regulation3872.547118.094315.1183,960.3255.32
Support servicesSoil conservation479.464647.052710.78866.7136.88
nutrient cycle maintenance313.49350.37202.8573.760.00
Biodiversity350.374241.352471.052360.4036.88
Cultural servicesAesthetic landscape147.531862.511088.001825.6218.44
Table 2. Total ESV of the Nanjing metropolitan area.
Land TypeESV/×108 CNY
20002005201020152020
Cultivated land433.092285.706281.124278.293398.620
Forest land412.863506.255502.180500.911409.979
Grassland60.78691.58491.38791.14659.538
Water621.239922.268917.424913.964655.444
Unused land0.0040.0110.0100.0140.022
Total1527.9841805.8241792.1251784.3281523.603
Table 3. Changes of individual ESV in the Nanjing metropolitan area.
Class One TypeClass Two TypeESV/×108 CNYESV Change Rate/%
200020052010201520202000–20052005–20102010–20152015–20202000–2020
Supply servicesFood production101.3374.6973.6573.0194.34−26.94−1.39−0.8729.22−6.90
Raw material production28.4028.6228.3428.2127.370.77−0.98−0.46−2.98−3.63
Regulation servicesGas regulation126.65116.61115.36114.70120.67−7.93−1.07−0.575.20−4.72
Climate regulation195.25226.80224.99224.20191.9716.16−0.80−0.35−14.38−1.68
Environment purification85.30108.33107.58107.2085.8427.00−0.69−0.35−19.930.63
Hydrological regulation771.23997.43990.88986.65787.1529.22−0.66−0.43−20.222.06
Support servicesSoil conservation82.0993.2992.5392.1980.3913.64−0.81−0.38−12.80−2.07
nutrient cycle maintenance17.3514.4414.2614.1616.34−16.77−1.25−0.7015.40−5.82
Biodiversity81.2897.4796.7396.3980.5219.92−0.76−0.35−16.46−0.94
Cultural servicesAesthetic landscape40.4150.0149.6549.4740.3723.76−0.72−0.36−18.39−0.10
Table 4. Sensitivity test of the revised ESV coefficients in the Nanjing metropolitan area.
Land Type20002005201020152020
Cultivated land0.2830.1580.1570.1560.262
Forest land0.2700.2800.2800.2810.269
Grassland0.0400.0510.0510.0510.039
Water0.4070.5110.5120.5120.430
Unused land0.0000.0000.0000.0000.000
Table 5. The analysis of spatial autocorrelation in ESV.
YearMoran’s IZ Valuep Value
20000.511256.022<0.001
20050.506253.504<0.001
20100.505252.939<0.001
20150.503252.056<0.001
20200.507254.019<0.001
Table 6. Changes in the number of ESV cold spots and hot spots during 2000–2020.
Type20002005201020152020
Cold spots414717,23917,56117,6437033
Hot spots89679125911690489113
Disclaimer/Publisher’s Note: The statements, opinions and data contained in all publications are solely those of the individual author(s) and contributor(s) and not of MDPI and/or the editor(s). MDPI and/or the editor(s) disclaim responsibility for any injury to people or property resulting from any ideas, methods, instructions or products referred to in the content.

