Next Article in Journal
A Unique Grubbing Head Prototype for Environmentally Friendly and Sustainable Stump Removal
Previous Article in Journal
Soil Quality Assessment and Management in Karst Rocky Desertification Ecosystem of Southwest China
 
 
Retraction published on 6 December 2023, see Forests 2023, 14(12), 2380.
Article

RETRACTED: Evaluating the Carrying Capacity and Spatial Pattern Matching of Urban and Rural Construction Land in a Representative City of Middle China

1
College of Land Resources and Environment, Jiangxi Agricultural University, Nanchang 330045, China
2
Jiangxi Provincial Key Laboratory of Poyang Lake Basin Agricultural Resources and Ecology, Nanchang 330045, China
*
Author to whom correspondence should be addressed.
Forests 2022, 13(9), 1514; https://doi.org/10.3390/f13091514
Submission received: 31 July 2022 / Revised: 12 September 2022 / Accepted: 13 September 2022 / Published: 18 September 2022 / Retracted: 6 December 2023

Abstract

:
Evaluation of the carrying capacity and spatial pattern matching of urban–rural construction land is critical for solving problems associated with irrational land use and the destruction of ecosystems. Here, we present a case study exploring the spatial matching relationship between the carrying capacity and current development status of urban–rural construction land in Nanchang, the capital city of Jiangxi Province, China. Land suitability evaluation for urban and rural construction was performed using the analytic hierarchical process and restrictive coefficient method. The spatial matching degree between current construction land and available construction land was obtained by a spatial overlay analysis. Results show that the area most suitable for construction land development (19.2% of the total) is mainly concentrated in the central urban districts, while the relatively suitable area (17.5% of the total) is present around the most suitable area. The ultimate development intensity (i.e., carrying capacity threshold) of construction land in the study region is 41.4%, and the residual development intensity (i.e., development potential) is 24.2%. The available construction land (including most suitable and relatively suitable areas) is generally abundant. The spatial matching degree of construction land ranges from 69.5% to 99.1% in different counties (districts). Pearson’s correlation analysis reveals that the spatial matching degree is positively correlated with the carrying capacity threshold of construction land (r = 0.926; p < 0.01) and the abundance of available construction land (r = 0.732; p < 0.05). The results could be useful for the rational development of urban–rural construction land and the optimization of land space at the city scale.

1. Introduction

Land resources are non-renewable resources on which humans depend for survival. As land resources provide the basic materials for human production and life [1,2], their rational utilization is the key to maintaining sustainable socioeconomic development [3,4,5]. The suitability of land use can be evaluated based on the natural and socioeconomic attributes of a particular region in order to provide useful information for rational land allocation and land use planning by decision-makers [6,7,8]. Along with the uncoordinated development of the economy and ecology, many studies have been carried out to evaluate land suitability worldwide. From the perspectives of geological environment and social conditions, Ustaogh et al. (2020) combined the geographic information system and multi-criteria decision analysis to evaluate land suitability for construction in the Pendik district of Istanbul, Turkey [9]. Considering ecological security factors, Cheng et al. (2018) evaluated land suitability for construction in low mountainous and hilly urban areas based on the Delphi method and analytic hierarchy process [10]. However, the evaluation results may vary with different study methods and regions. Therefore, care must be taken in selecting the method based on local conditions to accurately evaluate land development suitability.
Since the middle of the 20th century, the problems associated with natural resources and the environment have gradually become prominent due to the increasing contradiction between humans and nature [11]. The research on land carrying capacity that measures the relationship between humans and land is receiving great attention worldwide [12,13]. In 1965, Allen (1965) took grain demand as the principal line to study the carrying capacity of land resources by focusing on the relationship between humans, land, and grain [14]. In the 1980s, many theoretical discussions and empirical analyses were conducted based on the equation of land carrying capacity proposed by Allen (1965). For example, the Food and Agriculture Organization of the United Nations (1982) hosted a study evaluating the potential population-supporting capacity of land in developing countries [15]. In 1991, the Natural Resources Committee of the Chinese Academy of Sciences implemented a research project on the productivity and population carrying capacity of land resources in China to investigate the relationship between population, resources, the environment, and development [16]. Due to the constantly increasing level of land development [17,18], the spatial imbalance of land use is becoming evident. The limitations of single-dimensional studies on land carrying capacity that explore the relationship between land productivity and human demand for food have been recognized; thus, the research topic is gradually extended to comprehensive land carrying capacity [19,20,21,22].
As previous studies of land carrying capacity are mainly conducted in resource-based cities [23], urban agglomerations [24,25], and specific regions [26,27,28], the evaluation results lack broad applicability. In addition, the commonly used methods to evaluate land carrying capacity have some limitations. For example, the DPSIR model selects the evaluation indices from five aspects (driver–pressure–state–impact–response), which can comprehensively evaluate the current status of land carrying capacity; however, factors that have no direct influence on land carrying capacity are likely to be ignored [29,30]. Moreover, the ecological footprint model quantifies the current status of ecological pressure and the supporting capacity of the ecological environment and conveys the concept of time to land carrying capacity; yet, this model takes the study region as a closed system without considering the flow of natural resources between local areas [31,32,33]. Based on the multi-index comprehensive evaluation method, the indices are selected by comprehensively considering multiple aspects, and the results indicate regional land carrying capacity scientifically, objectively, and comprehensively [34,35]; however, studies based on this method have rarely considered location conditions or socioeconomic factors such as population density, and therefore cannot demonstrate the influence of human activities on land carrying capacity [36,37,38].
The spatial matching relationship between the carrying capacity and current development status of urban–rural construction land is their spatial relevance and consistency. The higher the spatial matching degree between current urban–rural construction and available construction land, the better the match, indicating that the current development status of urban–rural construction land is good. Otherwise, it is worse if the spatial matching degree is lower. In recent decades, a large amount of farmland has been developed into construction land, causing global changes in the spatial pattern of land use. There is a significant spatial imbalance in regional development due to irrational land use and the over-development of natural resources. Despite many studies evaluating land suitability and carrying capacity from different perspectives, little research has investigated the carrying capacity of urban–rural construction land based on the level of land suitability. Particularly, there is a lack of knowledge about the spatial matching relationship between the carrying capacity and the current development status of urban–rural construction land. Clarifying this relationship is essential for dealing with the spatial imbalance of regional land use and coordinating the relationship between population, resources, and social development. Such knowledge is vital for rational use and optimal spatial layout of land resources, ultimately facilitating the construction of ecological civilization and achieving sustainable regional development.
Here, we present a case study conducted in Nanchang, the capital city of Jiangxi Province, China. The evaluation of land suitability for urban-rural construction was carried out by the analytic hierarchical process combined with the restrictive coefficient method, and the level of land suitability was classified by cluster analysis. Based on the evaluation results of land suitability, we explored the spatial matching relationship between the carrying capacity and the current development status of construction land in the study region. The results could be useful for rational utilization of construction land resources and optimization of land space at the city scale.

2. Materials and Methods

2.1. Study Region

This study was conducted in Nanchang City (115°27′–116°35′ E and 28°09′–29°11′ N) in the central north of Jiangxi Province, China. The administrative area of Nanchang City consists of five districts (Donghu, Xihu, Qingyunpu, Wanli, and Qingshanhu) and four counties (Nanchang, Xinjian, Anyi, and Jinxian; Figure 1). The study region has a total area of 7194.61 km2, including 965.60 km2 of urban–rural construction land area (13.42% of the total). It experiences a subtropical humid monsoon climate with abundant light, rainfall, and natural resources. The terrain of this region is flat in the southeast and hilly in the northwest. In recent years, the study region has witnessed rapid economic and social development. In 2021, the gross domestic product of Nanchang City reached 665.05 billion yuan, with a permanent population of 6.438 million and an urbanization rate of 78.64%.

2.2. Date Sources

The data used in this study mainly included the land use change survey database of Nanchang City (2018), the delineation of permanent basic farmland in Nanchang City (2017), the overall land use planning database of Nanchang City (2006–2020), the delineation of ecological red line in Nanchang City (2018), and the delimitation data of three lines. In addition, the map of geological disaster survey and evaluation in Jiangxi Province, the map of ground subsidence in Jiangxi Province, the distribution map of mineral resources, the protection range of river and lake shoreline, the slope map, the Nanchang statistical yearbook (2017–2021), and road vector data of Nanchang were collected. The digital elevation model with a spatial resolution of 30 m was obtained from the Geospatial Data Cloud (http://www.gscloud.cn; accessed on 10 September 2019). The data were projected into a unified coordinate system using ArcGIS 10.2 (ESRI Inc., Redlands, CA, USA) and divided into 30 m × 30 m grids as the units for spatial analysis.

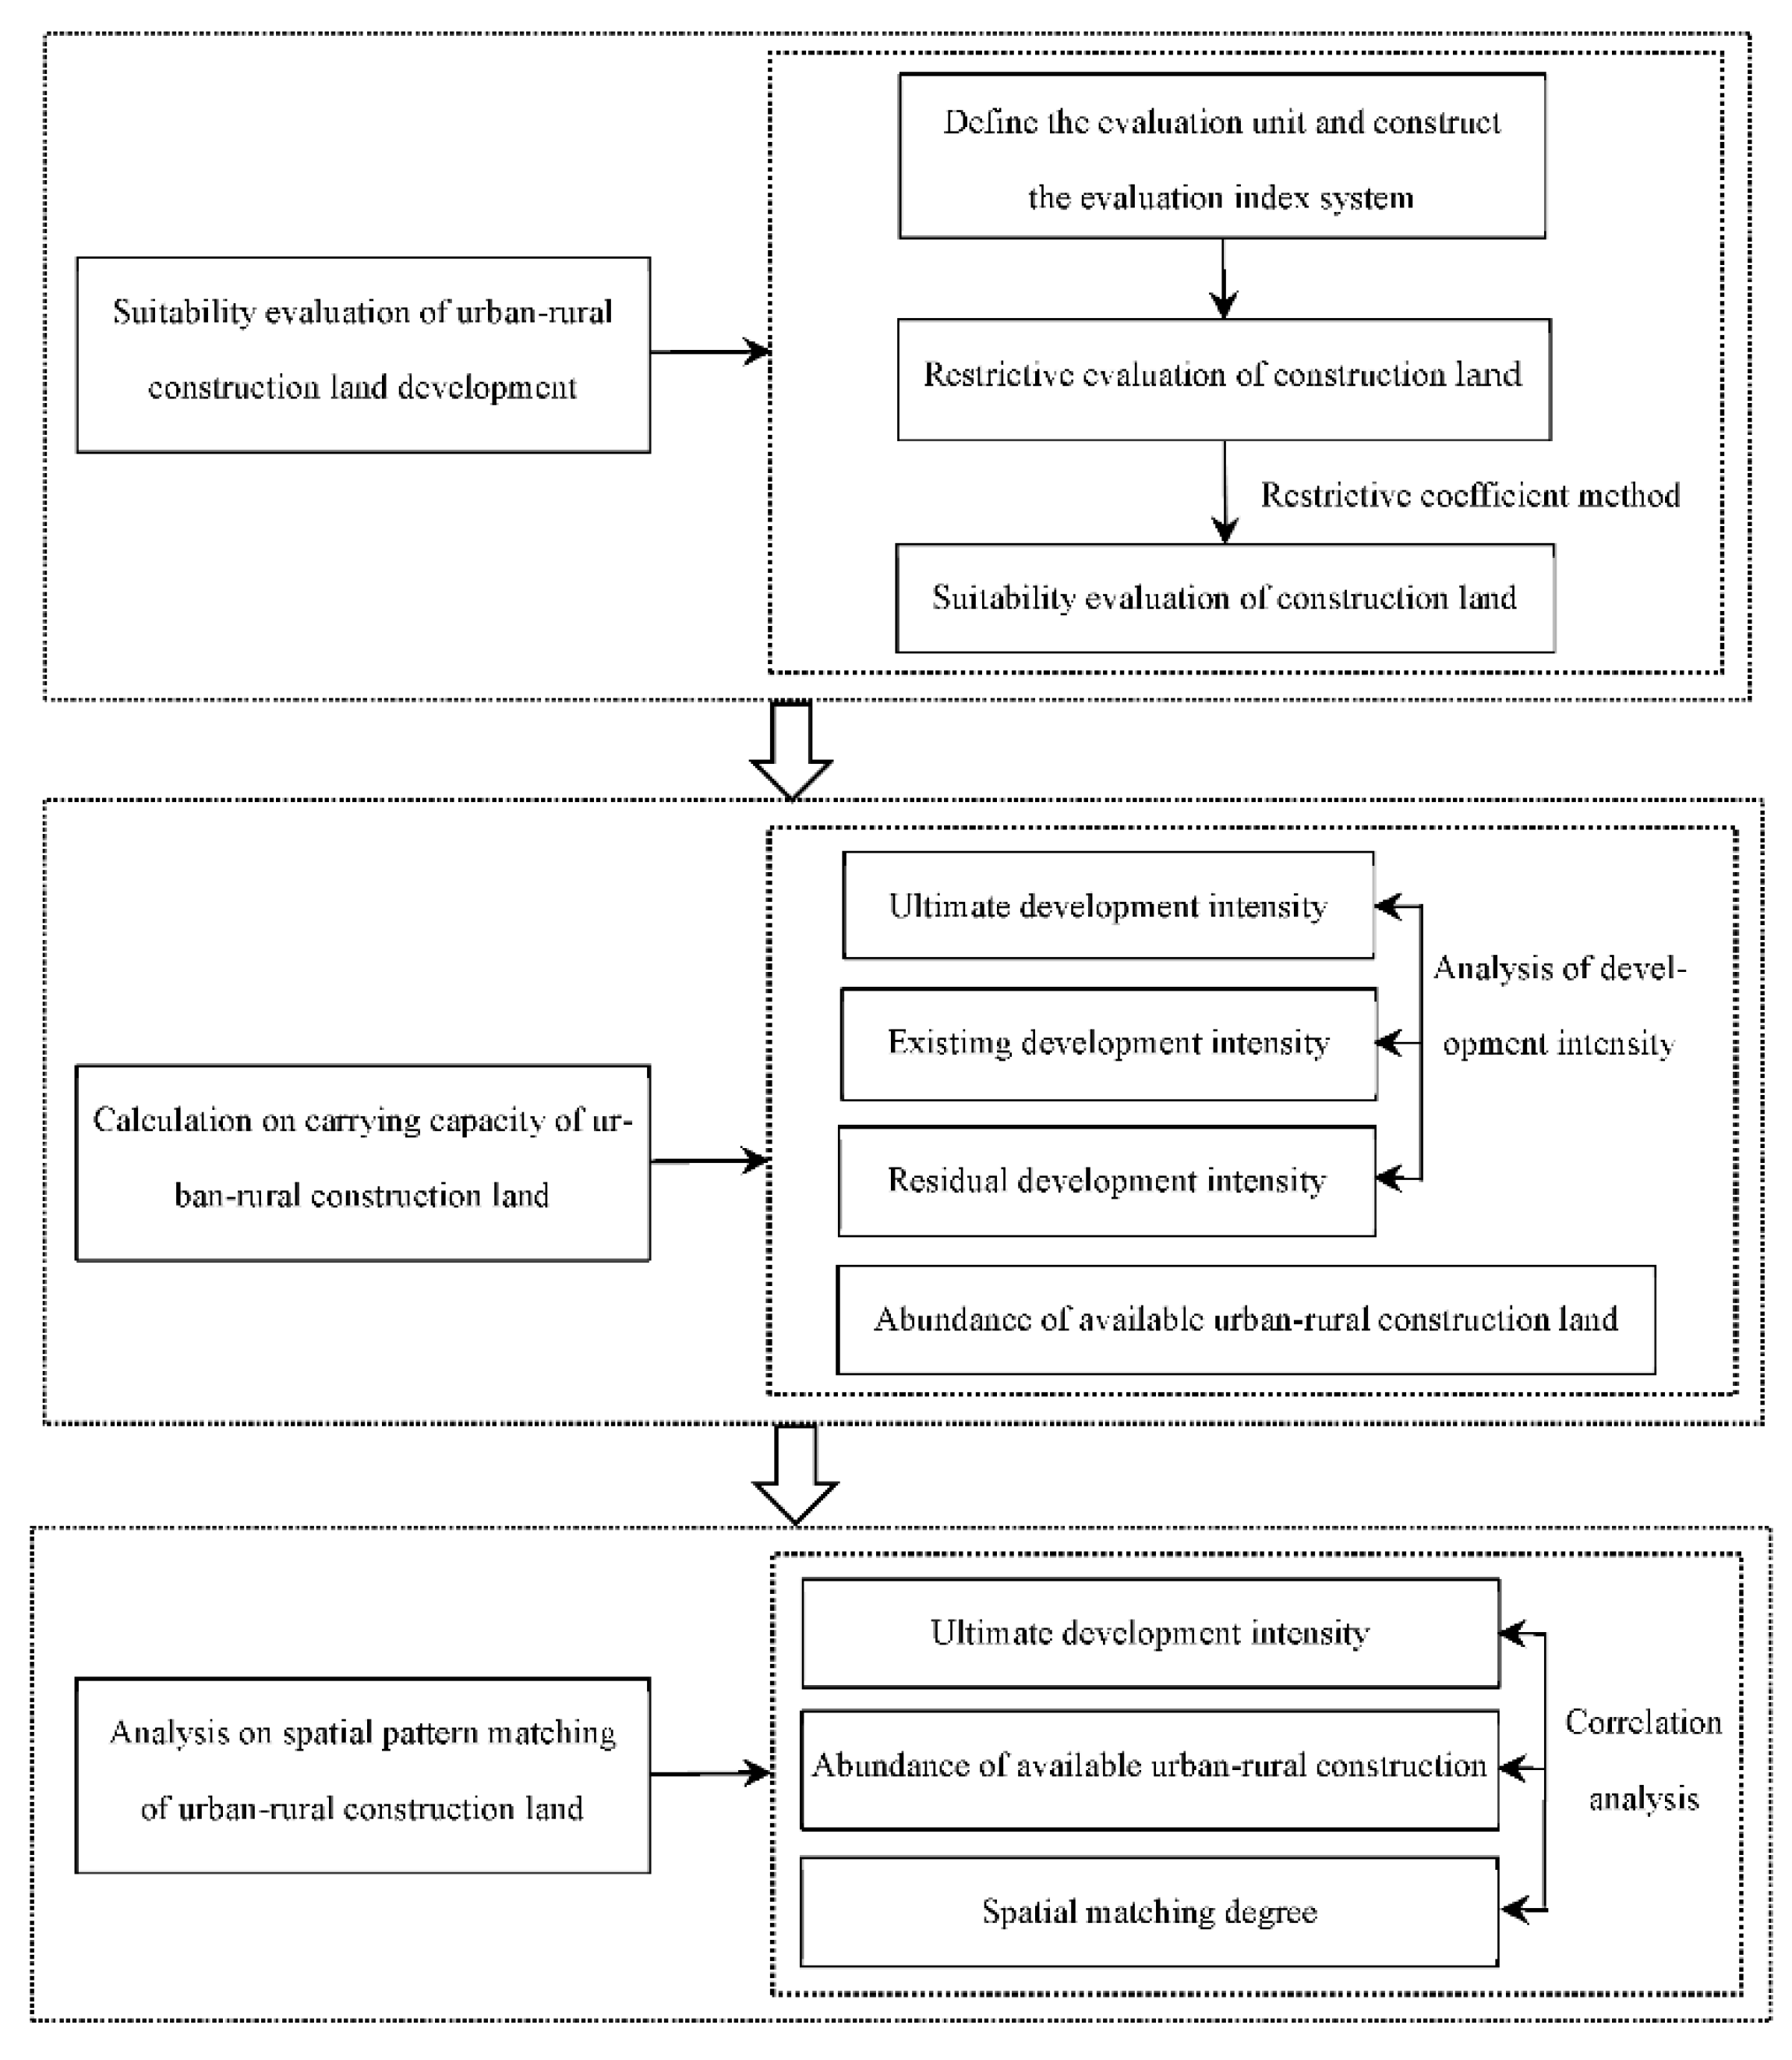
2.3. Research Methodology

The technical roadmap used in this study is shown in Figure 2. Firstly, it evaluates the suitability of urban-rural construction land development based on the suitability evaluation index system. Secondly, it judges the carrying capacity of urban-rural construction land according to the evaluation results, and calculates the critical value of carrying capacity in each county (district). Then, it comprehensively calculates the abundance of available construction land, and analyses the spatial matching relationship between current construction land and available construction land. Finally, a correlation analysis is performed on the carrying capacity threshold, available land abundance, and spatial matching degree to explore the relationship between current land use and rational land development.

2.4. Selection and Quantification of Evaluation Indices

According to data availability and the actual situation in Nanchang City, 13 indices including strong and less strong restriction factors were selected (Table 1). Permanent basic farmland area was regarded as a strong restriction factor in order to implement the most stringent farmland protection policies. Considering the contradiction between economic development and ecological protection, the ecological red line area, protection range of river and lake shoreline, and mineral resources protection area were also taken as a strong restriction factor. The ecological red line refers to the boundary of land space delineated by scientific and rational methods that must be particularly protected to maintain ecological security and ecosystem integrity [39]. In addition, Geological disaster high-prone area and ground subsidence area are difficult to develop and generally prone to natural disasters, so they were selected as a strong restriction factor. Moreover, slope gradient directly affects the cost and difficulty of construction land development, and larger slope gradient can reduce the stability of buildings while increasing the potential danger. Previous studies have shown that steep slopes greater than 25° are generally regarded as “prohibited construction areas” [40,41]. Therefore, slope greater than 25° was regarded as a strong restriction factor and slope less than 25° was taken as a less strong restriction factor. Furthermore, geological hazards directly threaten the safety of human life and property, while location conditions and population density influence the social and economic development, the accessibility of information, and the convenience of residents’ life. These factors, together with elevation, land use type, and flood storage and detention area, were included as less strong restriction factors to establish the evaluation index system.
The strong restriction factors were assigned values of 0 and 1 following the “one-vote veto” principle. The less strong restriction factors were assigned values of 0–100 according to the suitability level based on previous research, and the weight of each less strong restriction factor was determined by the analytic hierarchy process and the expert scoring method [42,43,44,45]. The index values and weights are listed in Table 1.

2.5. Evaluation of the Suitability for Urban–Rural Construction Land Development

A restrictive coefficient method was applied to calculate the suitability score of each evaluation unit for urban-rural construction land development using ArcGIS 10.2. The equation for the calculation is given by [43,46]:
S = j = 1 m P j * k = 1 n w k p k
where S is the comprehensive suitability score; j is the number of strong restriction factor; k is the number of less strong restriction factor; Pj is the suitability score of the j-th strong restriction factor; pk is the suitability score of the k-th less strong restriction factor; wk is the weight of the k-th less strong restriction factor; m is the total number of strong restriction factors; and n is the total number of less strong restriction factors. The suitability scores were divided into four different levels (Table 2) based on a cluster analysis using SPSS 22.0 (SPSS Inc., Chicago, IL, USA).

2.6. Determination of the Carrying Capacity of Urban–Rural Construction Land

The threshold of land carrying capacity refers to the maximum scale and intensity of human activities that can be carried by land resources in a region. Here, the carrying capacity threshold of construction land was calculated using ArcGIS 10.2 based on the results of land suitability evaluation combined with the current situation of construction land in Nanchang City. The equation for the calculation is as follows [43]:
L D I = A 1 + A 2 C U × 100 %
where LDI is the carrying capacity threshold of construction land, namely, the ultimate development intensity (UDI); A1 is the available area most suitable for construction land development; A2 is the available area relatively suitable for construction land development; C is the current area of construction land, and U is the total area of the study region.
The existing development intensity (EDI) reflects the current development of construction land in a region. This variable was obtained as the proportion of current construction land area (C) in the total land area of each county (district) (UT).
E D I = C / U T
where EDI is the existing development intensity; C is the proportion of current construction land area; UT is the total land area of each county (district); the T in UT means the symbol of county (district).
The UDI was subtracted by the EDI to obtain the residual development intensity (RDI), which indicates the development potential of construction land.

2.7. Calculation of the Abundance of Available Urban–Rural Construction Land

The abundance of available urban–rural construction land (E) in the study region was calculated by considering the relative quantity and spatial distribution [47]. In terms of the abundance in quantity (E1), the proportion of available construction land area (A1 + A2) in the total land area of each county (district) (UT) was obtained. In terms of the abundance in space (E2), the proportion of available construction land area of each county (district) (A1 + A2) in the available construction land area of the study region (UV) was obtained. After standardization of the data, the abundance of available construction land in each county (district) was obtained based on the following equation [43,48]:
E = A 1 + A 2 / U T E 1 max + A 1 + A 2 / U V E 2 max
where E is the abundance of available construction land; E1max is the maximum abundance displayed in terms of quantity; E2max is the maximum abundance displayed in terms of space; A1 is the available area most suitable for construction land development; A2 is the available area relatively suitable for construction land development; UT is the total land area of each county (district); UV is the available construction land area of the study region; the V in UV means the symbol of the available construction land.
Natural break classification was used to divide the abundance level of available construction land into the following three grades [43,48,49]: I, abundant, E > 1.0; II, moderately abundant, 0.6 < E < 1.0; III, deficient, E < 0.6.

2.8. Spatial Matching Analysis of Urban–Rural Construction Land

The spatial matching degree of urban–rural construction land refers to the spatial matching relationship between current construction land and available construction land. Here, the current construction land was spatially superimposed with the most suitable and relatively suitable areas using ArcGIS 10.2 to determine the suitability of current construction land. The spatial matching degree was calculated using the following equation [43]:
D = C 1 + C 2 / C
where D is the spatial matching degree between current construction land and available construction land; C1 is the current construction land located in the most suitable area; C2 is the current construction land located in the relatively suitable area; C is the total area of the current construction land.

2.9. Data Analysis

The suitability of urban-rural construction land was evaluated using ArcGIS 10.2. After the evaluation results were obtained through the cluster analysis of SPSS 22.0, the spatial overlay was conducted with ArcGIS software. In addition, Excel 2016 (Microsoft Corp., Redmond, WA, USA) was used to process the overlaid data, calculate the critical value of urban-rural construction land carrying capacity, the abundance of urban-rural construction land and other relevant data, so as to clarify the spatial matching relationship. And relevant maps were drawn with ArcGIS software.

3. Results

3.1. Land Suitability for Urban-Rural Construction

The evaluation results of land suitability for urban-rural construction in the study region are listed in Table 2. The areas most suitable, relatively suitable, and less suitable, respectively, account for 19.22%, 17.52%, and 4.70% of the total study area, and the unsuitable area accounts for 58.57% of the total study area. There is a significant spatial differentiation in the suitability for construction land development in the study region (Figure 3). The most suitable areas are mainly found in the four urban districts (i.e., Xihu, Qingyunpu, Qingshanhu, and Donghu) in the central part. The relatively suitable area is distributed in several counties (e.g., Xinjian and Nanchang) around the most suitable area. The less suitable area is small in size and scattered in distribution. The unsuitable areas are widely present in different counties (districts).

3.2. Carrying Capacity of Urban–Rural Construction Land

3.2.1. Development Intensity of Urban–Rural Construction Land

The development intensity levels of construction land in the study region are listed in Table 3. The UDI in the study region is 41.36%, and the UDIs in different counties (districts) vary over a broad range of 20.13%–98.51%. The highest UDIs are found in Donghu District, Qingshanhu District, and Qingyunpu District (>90%), followed by 86.52% in Xihu District. Nanchang County has a moderately high UDI of 50.62%, followed by 30%–40% of Xinjian County, Jinxian County, and Anyi County. Most of Wanli District are unsuitable for construction land development, resulting in its low UDI of 20.13%.
The study region has an EDI of 17.32%, and the different counties (districts) have their EDIs varying from 10.65% to 86.51% (Table 3). Urban areas located in the central part have greater EDIs than other surrounding counties (districts). The Qingyunpu District, as one of the prosperous sectors known as the “Three Silver Centers” in the study region, has the largest EDI of 86.51%. Xihu District and Qingshanhu District are the major historical and cultural districts and industrial zones, respectively, which have relatively high EDIs of 76.05% and 72.16%, respectively. The EDIs in Donghu District and Nanchang County are moderately high, at 43.62% and 20.37%, respectively. The EDIs of several counties (districts) located in ecological protection and agricultural development areas are generally low, e.g., <20% in Anyi County, Xinjian County, Jinxian County, and Wanli District. The lowest EDI is found in Jinxian County, at 10.65%.
The RDI in the study region is 24.16%, which is slightly larger than its EDI and thus indicates a space for construction land development (Table 3). The RDIs in different counties (districts) vary considerably from 5.83% to 49.72%. The lowest RDI is found in the Wanli District (5.83%). Xihu District and Qingyunpu District have their RDIs between 10% and 20%, while many other counties (districts; except Donghu) have their RDIs in the range of 20%–30%. Due to the low EDIs in Anyi County, Jinxian County, and Xinjian County, there are still some areas suitable for construction land development. Based on the need for economic development, most of Qingshanhu District has been developed into construction land, and the RDI is therefore relatively small. The highest RDI is found in Donghu District (49.72%).

3.2.2. Abundance of Available Urban–Rural Construction Land

The available construction land is generally abundant in the study region, albeit with large differences in the abundance level across counties (districts; Figure 4). The abundance of available construction land ranges from 0.20 to 1.50, with the highest level found in Nanchang County and the lowest level in Wanli District. Specifically, the available construction land is abundant in Xinjian County, Qingshanhu District, Qingyunbu District, Nanchang County, and Donghu District (level I), moderately abundant in Jinxian County and Xihu District (level II), and deficient in Anyi County and Wanli District (level III).

3.3. Spatial Pattern Matching of Urban–Rural Construction Land

The results of spatial overlay analysis show that 827.79 km2 (79.86%) of the current construction land is located in the most suitable area, while 111.73 km2 (10.78%), 23.95 km2 (2.31%), and 73.08 km2 (7.05%) of it are respectively located in the relatively suitable, less suitable, and unsuitable areas in the study region (Figure 5). The spatial matching degree of construction land in different counties (districts) ranges from 69.5% to 99.13%. Specifically, the spatial matching degree is >90% in the four urban districts (Donghu, Qingyunpu, Xihu, and Qingshanhu), all of which are located in the central part with good location conditions and flat terrain. The spatial matching degree in several counties (Anyi, Jinxian, Nanchang, and Xinjian) is between 70% and 90%, while the lowest value is found in Wanli District (69.5%). The spatial matching degree in the study region is 91.52%, indicating that the overall suitability of current construction land in the study region is good. Based on Pearson’s correlation analysis, the spatial matching degree of construction land is positively correlated with the carrying capacity threshold of construction land (r = 0.926; p < 0.01) and the abundance of available construction land (r = 0.732; p < 0.05). The result demonstrates a close relationship between the current development status of construction land and its rational development status.

4. Discussion

4.1. About the Research Methods and Results

In recent decades, the intensity of land development has been increasing constantly on a global scale, which has led to the deterioration of the ecological environment. Urban-rural construction land is an important type of land use. Determining the regional carrying capacity of urban-rural construction land, i.e., the carrying scale and boundary, is significant for guiding land development. Currently, it is imperative to analyze the carrying capacity and spatial pattern matching of urban–rural construction land in order to resolve the conflicts between land development and ecological protection. In this study, we take Nanchang City (Jiangxi Province, China) as an example to explore the spatial matching relationship between the carrying capacity of urban–rural construction land and its current development status based on the evaluation results of land suitability. The results can provide a basis for the optimal allocation and differential management decisions of urban-rural construction land. We find that the abundance of available construction land and its spatial matching with current construction land in the study region are satisfactory. The development intensity of construction land varies substantially among counties (districts) depending on multiple factors. For example, the UDIs and EDIs in Anyi County and Jinxian County are lower than those in Qingshanhu District and Qingyunpu District, with good location conditions. However, the RDI is not evidently correlated with location conditions.
Different scholars have carried out evaluation research on land suitability and land carrying capacity from different aspects, but there is still less research on urban-rural construction land carrying capacity based on land suitability evaluation, and there is even less research on the spatial matching relationship between urban-rural construction land carrying capacity and current development status. From the perspective of the evaluation system, existing studies have rarely considered location conditions or socioeconomic factors such as population density, ecological red line, permanent basic farmland, and so on [36,37,38]. Moreover, the existing research on carrying capacity and the construction of ecological civilization are not well integrated, and the evaluation index system needs to be further improved [50]. In this study, we explore the spatial matching relationship between the carrying capacity and current development status of construction land based on the evaluation results of land suitability by taking Nanchang City as an example. In total, we take into consideration 13 indices, including ecological red line, geological hazards, location conditions, population density, and permanent basic farmland in the land suitability evaluation. Compared with other related studies, the evaluation index of the study is relatively comprehensive [43,51,52,53,54,55]. Particularly, our results are roughly in line with the previous findings of a study conducted in the Harbin-Changchun Urban Agglomeration and the urban agglomeration around Poyang Lake in Jiangxi Province [43,51]. However, it is still subjective to determine the index weight through the analytic hierarchy process and expert scoring method. Therefore, the scientific nature of the index weight needs to be broken through in future research [51,52,53,54,55].

4.2. About the Application in Land Spatial Planning

It is of great significance to clarify the spatial matching relationship between the carrying capacity of urban-rural construction land and the current development status, to make rational use of land and optimize the spatial layout of the land, to accelerate the construction of ecological civilization and to achieve regional sustainable utilization. Relevant studies on the spatial matching relationship between the carrying capacity of urban-rural construction land and the current development situation show that the regions with high spatial matching should continue to maintain and increase the intensity of intensive and economical land use, while the regions with low spatial pattern matching priority should be given to the development of urban-rural construction land in combination with the actual situation [43,51,52,53,54,55]. In the future development of urban–rural construction land, attention should be paid to the combination of land carrying capacity threshold and available land abundance, in order to achieve rational land planning of spatial layout and prevent over-development of construction land.
Based on the spatial matching analysis, the development suitability of current construction land in Nanchang City and its administrative areas (counties or districts) is relatively rational, albeit with considerable spatial differentiation in the study region. Therefore, it is necessary to rationally use land resources and optimize their allocation according to the requirements of land spatial planning in combination with local conditions. Additionally, specific suggestions for the rational utilization and spatial planning of land resources include the following:
(1) Due to the restrictions on permanent basic farmland areas and ecological protection, Wanli District is mostly located in unsuitable areas with low development potential. In this case, it is recommended to control construction land development, strengthen ecological environmental protection, adhere to ecological construction combined with tourism development, and implement a strict ecological protection system;
(2) Although large areas of Anyi County, Xinjian County, and Jinxian County are also unsuitable for construction land development, these counties have low EDIs and therefore high development potential. In these counties, the suitable areas can be appropriately developed to partly undertake the functions of central urban areas and drive economic development by taking into account the local conditions, on the premise of ensuring agricultural production and without destroying the ecological environment;
(3) Donghu District and Nanchang County show relatively high development potential and spatial matching because these areas are located in the core zone of urban development with flat terrain, convenient transportation, a developed economy, and a rare ecological protection area. In these areas, we can make full use of their location advantages and give priority to construction land development on the premise of without damaging the ecological environment;
(4) As for the other three districts (Qingshanhu, Qingyunpu, and Xihu) with high development intensity and low development potential, it is not recommended to develop new construction land with regard to the mitigation of land-carrying pressure. Instead, urban reconstruction and ecological construction should be strengthened on the existing construction land to improve the ecological environment of human settlements.

5. Conclusions

This study has evaluated the carrying capacity and spatial pattern matching of urban–rural construction land in Nanchang City. The main conclusions are as follows:
(1) For construction land development, the most suitable and relatively suitable areas are mainly distributed in urban districts in the central part of the study region with good geographical conditions. The less suitable area is small and scattered, while the unsuitable area is widely found in all counties (districts);
(2) The carrying capacity threshold of construction land in the study region is 41.36%, and the available construction land is generally abundant. Both the carrying capacity threshold and the available land abundance differ substantially among counties (districts). High carrying capacity thresholds and available land abundance are obtained in Donghu District, Qingyunpu District, and Qingshanhu District, with developed economies and superior geographical conditions. In contrast, Wanli District is restricted by ecological protection, and attention should be paid to its construction land development in combination with ecological environmental protection;
(3) The residual development intensity of construction land in the study region is slightly higher than its existing development intensity, which indicates that there is still a potential for construction land development in Nanchang City. The spatial matching degree between current construction land and available construction land in different counties (districts) varies between 69.5% and 99.1%, indicating that the current development status of construction land is good.

Author Contributions

Conceptualization, Z.L.; methodology, Y.Y.; software, Y.Y. and S.Q.; validation, S.Q.; investigation, J.X.; writing—original draft preparation, Y.Y. and Z.L.; writing—review and editing, Z.L. All authors have read and agreed to the published version of the manuscript.

Funding

This research was funded by the National Natural Science Foundation of China (No. 41961042) and the Humanities and Social Sciences Research Planning Foundation of the Ministry of Education of China (No. 19YJAZH061).

Data Availability Statement

The data are available on request from the corresponding author.

Acknowledgments

We are all very grateful to the anonymous reviewers of this paper for their helpful comments.

Conflicts of Interest

The authors declare no conflict of interest.

References

  1. He, R.W.; Liu, S.Q. Application of SD Model in Analyzing the Cultivated Land Carrying Capacity: A Case Study in Bijie Prefecture, Guizhou Province, China. Procedia Environ. Sci. 2011, 10, 1985–1991. [Google Scholar] [CrossRef]
  2. Xie, H.L.; Zou, J.L.; Jiang, H.L.; Zhang, N.; Choi, Y. Spatiotemporal Pattern and Driving Forces of Arable Land-Use Intensity in China: Toward Sustainable Land Management Using Emergy Analysis. Sustainability 2014, 6, 3504–3520. [Google Scholar] [CrossRef]
  3. Fan, J.; Sun, W.; Zhou, K. Major function oriented zone:New method of spatial regulation for reshaping regional development pattern in China. Chin. Geogr. Sci. 2012, 22, 196–209. [Google Scholar] [CrossRef]
  4. Malmir, M.; Zarkesh, M.M.K.; Monavari, S.M.; Jozi, S.A.; Sharifi, E. Analysis of land suitability for urban development in Ahwaz County in southwestern Iran using fuzzy logic and analytic network process (ANP). Environ. Monit. Assess. 2016, 188, 447. [Google Scholar] [CrossRef] [PubMed]
  5. Guo, J.J.; Yue, D.X.; Li, K.; Hui, C. Biocapacity optimization in regional planning. Sci. Rep. 2017, 7, 41150. [Google Scholar] [CrossRef] [PubMed]
  6. Rodriguez-Gallego, L.; Achkar, M.; Conde, D. Land suitability assessment in the Catchment Area of Four Southwestern Atlantic Coastal Lagoons: Multicriteria and optimization modeling. Environ. Manag. 2012, 50, 140–152. [Google Scholar] [CrossRef]
  7. Chow, T.E.; Sadler, R. The consensus of local stakeholders and outside experts in suitability modeling for future camp development. Landsc. Urban Plan. 2010, 94, 9–19. [Google Scholar] [CrossRef]
  8. Olmedo, M.T.C.; Paegelow, M.; Mas, J.F. Interest in intermediate soft-classified maps in land change model validation: Suitability versus transition potential. Int. J. Geogr. Inf. Sci. 2013, 27, 2343–2361. [Google Scholar] [CrossRef]
  9. Ustaoglu, E.; Aydınoglu, A.C. Suitability evaluation of urban construction land in Pendik district of Istanbul, Turkey. Land Use Policy 2020, 99, 104783. [Google Scholar] [CrossRef]
  10. Cheng, B.; Lan, H.F.; Wu, W.W. Study on Low Hilly Cities Land Suitability Evaluation Method Based on Ecological Considerations—A Case Study of Longfeng New Town in Sichuan. J. Build. Constr. Plan. Res. 2018, 6, 41–51. [Google Scholar] [CrossRef]
  11. Chen, W.B.; Carsjens, G.; Zhao, L.H.; Li, H.F. A Spatial Optimization Model for Sustainable Land Use at Regional Level in China: A Case Study for Poyang Lake Region. Sustainability 2014, 7, 35–55. [Google Scholar] [CrossRef]
  12. Helliwell, D.R. Can Britain Feed Itself? Environ. Conserv. 1977, 4, 74. [Google Scholar] [CrossRef]
  13. Anders, B.; Hauschild, M.Z. Introducing carrying capacity-based normalisation in LCA: Framework anddevelopment of references at midpoint level. Int. J. Life Cycle Assess. 2015, 20, 1005–1018. [Google Scholar]
  14. Allan, W. The African Husband Man; Lit Verlag: Münster, Germany, 1965. [Google Scholar]
  15. FAO. Potential Population Supporting Capacities of Lands in the Developing World; Food and Agriculture Organization: Rome, Italy, 1982. [Google Scholar]
  16. Chen, B.M. An outline of the research method of the project “The Productivity and Population Carrying Capacity of the Land Resource in China”. J. Nat. Resour. 1991, 6, 197–205. (In Chinese) [Google Scholar]
  17. Schmitz, M.F.; Arnaiz-Schmitz, C.; Herrero-Jauregui, C.; Rodríguez, P.D.; Matos, D.G.G.; Pineda, F.D. People and nature in the Fuerteventura Biosphere Reserve (Canary Islands). Socio-ecological relationships under climate change. Environ. Conserv. 2017, 45, 20–29. [Google Scholar] [CrossRef]
  18. Xie, H.L.; Zhu, Z.H.; Wang, B.H.; Liu, G.Y.; Zhai, Q.L. Does the Expansion of Urban Construction Land Promote Regional Economic Growth in China? Evidence from 108 Cities in the Yangtze River Economic Belt. Sustainability 2018, 10, 4073. [Google Scholar] [CrossRef]
  19. Lane, M. The carrying capacity imperative: Assessing regional carrying capacity methodologies for sustainable land-use planning. Land Use Policy 2010, 27, 1038–1045. [Google Scholar] [CrossRef]
  20. Xu, Y.; Tang, Q.; Fan, J.; Bennett, S.J.; Yang, L. Assessing construction land potential and its spatial pattern in China. Landsc. Urban Plan. 2011, 103, 207–216. [Google Scholar] [CrossRef]
  21. Yan, H.M.; Liu, F.; Liu, J.Y.; Xiao, X.M.; Qin, Y.W. Status of land use intensity in China and its impacts on land carrying capacity. J. Geogr. Sci. 2017, 27, 387–402. [Google Scholar] [CrossRef]
  22. Xu, K.; Kong, C.F.; Li, J.F.; Zhang, L.Q.; Wu, C.L. Suitability evaluation of urban construction land based on geo-environmental factors of Hangzhou, China. Comput. Geosci. 2011, 37, 992–1002. [Google Scholar] [CrossRef]
  23. Zhao, Z.; Ning, J.; Zhou, F.F.; Du, K.; Rong, G.H. Evaluation of Ecological Carrying Capacity of Resource Cities Based on Ecological Footprint Model—A Case Study at Daqing City, Heilongjiang Province. Bull. Soil Water Conserv. 2019, 39, 281–287. (In Chinese) [Google Scholar]
  24. Dong, J.; Zhuang, D.F.; Xu, X.L.; Ying, L. Integrated Evaluation of Urban Development Suitability Based on Remote Sensing and GIS Techniques - A Case Study in Jingjinji Area, China. Sensors 2008, 8, 5975–5986. [Google Scholar] [CrossRef] [PubMed]
  25. Liu, H.M. Comprehensive carrying capacity of the urban agglomeration in the Yangtze River Delta, China. Habitat Int. 2012, 36, 462–470. [Google Scholar] [CrossRef]
  26. Bunruamkaew, K.; Murayama, Y. Site suitability evaluation for ecotourism using GIS&AHP: A case study of Surat Thani province, Thailand. Procedia Soc. Behav. Sci. 2011, 21, 269–288. [Google Scholar]
  27. Yu, G.H.; Sun, C.Z. Land carrying capacity spatiotemporal differentiation in the Bohai Sea Coastal Areas. Acta Ecologica Sinica. 2015, 35, 4860–4870. (In Chinese) [Google Scholar]
  28. Gao, L.; Ma, C.M.; Wang, Q.X.; Zhou, A.G. Sustainable use zoning of land resources considering ecological and geological problems in Pearl River Delta Economic Zone, China. Sci. Rep. 2019, 9, 16052. [Google Scholar] [CrossRef] [PubMed]
  29. Chen, J.H.; Izhar, M.J.; Chen, J.L.; Hui, Y. Evaluation and future framework of green mine construction in China based on the DPSIR model. Sustain. Environ. Res. 2020, 30, 448–457. [Google Scholar] [CrossRef]
  30. Qu, S.J.; Hu, S.G.; Li, W.D.; Wang, H.; Zhang, C.R.; Li, Q.F. Interaction between urban land expansion and land use policy: An analysis using the DPSIR framework. Land Use Policy 2020, 99, 104856. [Google Scholar] [CrossRef]
  31. Rees, W.E. Ecological footprints and appropriated carrying capacity: What urban economics leaves out. Environ. Urban. 1992, 4, 121–130. [Google Scholar] [CrossRef]
  32. Niccolucci, V.; Bastianoni, S.; Tiezzi, E.B.P.; Wackernagel, M.; Marchettini, N. How deep is the footprint? A 3D representation. Ecol. Model. 2009, 220, 2819–2823. [Google Scholar] [CrossRef]
  33. Long, X.Y.; Yu, H.J.; Sun, M.X.; Wang, X.C.; Jiří, J.K.; Xie, W.; Wang, C.D.; Li, W.Q.; Wang, Y.T. Sustainability evaluation based on the Three-dimensional Ecological Footprint and Human Development Index: A case study on the four island regions in China. J. Environ. Manag. 2020, 265, 110509. [Google Scholar] [CrossRef]
  34. Ma, P.P.; Ye, G.Q.; Peng, X.; Liu, J.F.; Qi, J.G.; Jia, S.G. Development of an index system for evaluation of ecological carrying capacity of marine ecosystems. Ocean. Coast. Manag. 2017, 144, 23–30. [Google Scholar] [CrossRef]
  35. Zhang, X.R.; Fang, C.L.; Wang, Z.B.; Ma, H.T. Urban construction land suitability evaluation based on improved multicriterria evaluation based on GIS (MCE-GIS): Case of new Hefei City, China. Chin. Geogr. Sci. 2013, 23, 740–753. [Google Scholar] [CrossRef]
  36. Martire, S.; Castellani, V.; Sala, S. Carrying capacity assessment of forest resources: Enhancing environmental sustainability in energy production at local scale. Resour. Conserv. Recycl. 2015, 94, 11–20. [Google Scholar] [CrossRef]
  37. Xu, Y.; Tang, H.P.; Wang, B.J.; Chen, J. Effects of land-use intensity on ecosysterm services and human well-being: A case study in Huailai county China. Environ. Earth Sci. 2016, 75, 416. [Google Scholar] [CrossRef]
  38. Murray, L.; Les, D.; Peter, G. The essential parameters of a resource-based carrying capacity assessment model: An Australian case study. Ecol. Model. 2014, 272, 220–231. [Google Scholar]
  39. Lin, Y.; Fan, J.F.; Wen, Q.; Liu, S.X.; Li, B.Y. Primary exploration of ecological theories and technologies for delineation of ecological redline zones. Acta Ecol. Sin. 2016, 36, 1244–1252. (In Chinese) [Google Scholar]
  40. Yang, Z.S. Land Suitability Evaluation for Urban Construction and Its Application in Mountainous Areas: A Case Study in Dehong Dai-Jingpo Autonomous Prefecture, Yunnan Province. J. Nat. Resour. 2016, 31, 64–76. (In Chinese) [Google Scholar]
  41. Zhu, T.Z.; Du, H.R.; Zhang, X.L.; Wang, B.L. Delimitation of Urban Growth Boundary in Arid Oasis Based on Evaluating the Suitability of Construction and Development: A Case Study in Urumqi City. Arid Zone Res. 2019, 36, 1318–1324. (In Chinese) [Google Scholar]
  42. Akıncı, H.; Özalp, A.Y.; Turgut, B. Agricultural land use suitability analysis using GIS and AHP technique. Comput. Electron. Agric. 2013, 97, 71–82. [Google Scholar] [CrossRef]
  43. Yi, D.; Zhao, X.M.; Guo, X.; Jiang, Y.F.; Wang, C.L.; Lai, X.H.; Huang, X.Y.; Chen, L. Evaluation of carrying capacity and spatial pattern matching on urban-rural construction land in the Poyang Lake urban agglomeration, China. Chin. J. Appl. Ecol. 2019, 30, 627–636. (In Chinese) [Google Scholar]
  44. Aburas, M.M.; Ho, Y.M.; Ramli, M.F.; Ash’aari, Z.H. Improving the capability of an integrated CA-Markov model to simulate spatio-temporal urban growth trends using an analytical hierarchy process and frequency ratio. Int. J. Appl. Earth Obs. Geoinf. 2017, 59, 65–78. [Google Scholar] [CrossRef]
  45. Lu, C.; Xi, R.; Hei, Z.; Tang, L. Safety Evaluation of Water Environment Carrying Capacity of Five Cities in Ningxia Based on Ecological Footprint of Water Resources. Asian Agric. Res. 2022, 14, 11–16. [Google Scholar] [CrossRef]
  46. Zhong, S.; Zhao, X.M.; Guo, X.; Ye, Y.C.; Li, W.F. Delimitation of Urban Growth Boundary Based on Spatial Suitability Evaluation and Population Carrying Capacity in Guixi County. J. Nat. Resour. 2018, 33, 801–812. (In Chinese) [Google Scholar]
  47. Zhang, X.P.; He, C.M.; Hu, Z.H.; Nie, J. Study on the Comprehensive Suitability of Low-Hilly Land Resource. Ecol. Econ. 2019, 35, 166–169. (In Chinese) [Google Scholar]
  48. Gao, Y.N.; Bao, G.Y.; Wang, J.; Yang, C.Q.; Wang, Z.F.; Yang, X.D.; Huang, Q. Carrying Capability and Matching Evaluation of Urban and Rural Construction Land in the Coastal Areas of Jiangsu Province. J. Nat. Resour. 2015, 30, 1278–1288. (In Chinese) [Google Scholar]
  49. Yuan, J. Evaluation of Available Land for Construction based on GIS in Liaoning Province; Liaoning Normal University: Shenyang, China, 2011. (In Chinese) [Google Scholar]
  50. Lv, Y.H.; Fu, W.; Li, T.; Liu, Y.X. Progress and prospects of research on integrated carrying capacity of regional resources and environment. Prog. Geogr. 2018, 37, 130–136. (In Chinese) [Google Scholar]
  51. Tang, Y.; Yuan, Y.; Zhong, Q. Evaluation of Land Comprehensive Carrying Capacity and Spatio-Temporal Analysis of the Harbin-Changchun Urban Agglomeration. Int. J. Environ. Res. Public Health 2021, 18, 521. [Google Scholar] [CrossRef]
  52. Liu, Y.; Shi, F.; He, H.; Shen, L.; Luo, W.; Sun, L. Study on the Matching Degree between Land Resources Carrying Capacity and Industrial Development in Main Cities of Xinjiang, China. Sustainability 2021, 13, 10568. [Google Scholar] [CrossRef]
  53. Zhou, W.; Elshkaki, A.; Zhong, S.; Shen, L. Study on Relative Carrying Capacity of Land Resources and Its Zoning in 31 Provinces of China. Sustainability 2021, 13, 1459. [Google Scholar] [CrossRef]
  54. Yue, W.Z.; Wu, T.; Wang, T.Y.; Xia, H.X. “Double evaluations” for territorial spatial planning: Challenges and responses. J. Nat. Resour. 2020, 35, 2299–2310. (In Chinese) [Google Scholar] [CrossRef]
  55. Xie, X.; Li, X.; He, W. A Land Space Development Zoning Method Based on Resource–Environmental Carrying Capacity: A Case Study of Henan, China. Int. J. Environ. Res. Public Health 2020, 17, 900. [Google Scholar] [CrossRef] [PubMed]
Figure 1. Geographical location of the study region—Nanchang City, Jiangxi Province, China.
Forests 13 01514 g001
Figure 2. Technical roadmap for the evaluation of carrying capacity and spatial matching pattern of urban–rural construction land.
Forests 13 01514 g002
Figure 3. Spatial distribution of land suitability for urban-rural construction in the study region.
Forests 13 01514 g003
Figure 4. Spatial distribution of the abundance of available land for urban-rural construction in the study region.
Forests 13 01514 g004
Figure 5. Spatial distribution of the suitability of current urban–rural construction land in the study region.
Forests 13 01514 g005
Table 1. Evaluation indices of land suitability for urban–rural construction in the study region.
CriterionFactorIndexValueWeight
Strong restrictionEcological red line areaEcological red line area0
Others1
Slope (°)≥250
Others1
Permanent basic farmland areaPermanent basic farmland area0
Others1
Geological disaster high-prone areaGeological disaster high-prone area0
Others1
Ground subsidence areaGround subsidence area0
Others1
Protection range of river and lake shorelineProtection range of river and lake shoreline0
Others1
Mineral resources protection areaMineral resources protection area0
Others1
Less strong restrictionElevation (m)>500200.0762
320–50040
200–32060
80–20080
0–80100
Slope (°)15–25400.1038
6–1560
2–680
0–2100
Land use typeFarmland300.1375
Woodland, garden land60
Grassland, water, unused land80
Construction land100
Geological hazard areaModerate-risk area of geological hazard300.1672
Low-risk area of geological hazard60
No-risk area of geological hazard100
Flood storage and detention areaFlood storage and detention area400.1783
Others100
Population densityVery low density200.0852
Low density40
Medium density60
High density80
Very high density100
Distance from provincial road (km)>5400.1093
2.5–560
1–2.580
0–1100
Distance from city or town (km)>9400.1425
6–960
3–680
0–3100
Table 2. Land suitability for urban-rural construction in the study region.
Suitability LevelSuitability ScoreArea (km2)Proportion (%)
Most suitable85.0–1001382.75 19.22%
Relatively suitable75.0–85.01260.35 17.52%
Less suitable50.0–75.0337.89 4.70%
Not suitable04213.62 58.57%
Table 3. Development intensity of urban–rural construction land in the study region (%).
Development IntensityDonghu DistrictXihu DistrictQingshanhu DistrictQingyunpu DistrictXinjian CountyNanchang CountyJinxian CountyAnyi CountyWanli DistrictStudy Region
UDI93.4686.5293.3898.5138.5650.6231.6734.3720.1341.36
EDI43.6276.0572.1686.5114.3920.3710.6510.6813.9617.32
RDI49.7210.5821.1312.1824.0530.3920.9623.625.8324.16
Note: UDI, ultimate development intensity; EDI, existing development intensity; RDI, residual development intensity.
Publisher’s Note: MDPI stays neutral with regard to jurisdictional claims in published maps and institutional affiliations.

