Article

Genetic Diversity and Structure of a Diverse Population of Picea sitchensis Using Genotyping-by-Sequencing

1
Crops, Environment and Land Use Programme, Crop Science Department, Teagasc, Oak Park, Carlow, Co., R93XE12 Carlow, Ireland
2
Botany, School of Natural Sciences, Trinity College Dublin, University of Dublin, D02PN40 Dublin, Ireland
3
Forestry Development Department, Teagasc, Athenry, Co., H65R718 Galway, Ireland
4
DBN Plant Molecular Laboratory, National Botanic Gardens of Ireland, Glasnevin, D09YV29 Dublin, Ireland
*
Author to whom correspondence should be addressed.
Forests 2022, 13(9), 1511; https://doi.org/10.3390/f13091511
Submission received: 15 August 2022 / Revised: 8 September 2022 / Accepted: 12 September 2022 / Published: 17 September 2022

Abstract

:
Picea sitchensis, Sitka spruce, is of interest to forestry as both a conservation species and a highly productive crop. Its native range stretches from Alaska to California, and it is hence distributed across a large environmental cline with areas of local adaptation. The IUFRO collection, established in 1968–1970, consists of 81 provenances of commercial and scientific interest spanning this native range. We used genotyping-by-sequencing on 1177 genotypes, originating from 80 of the IUFRO provenances which occupy 19 geographic regions of the Pacific Northwest, resulting in an SNP database of 36,567 markers. We detected low levels of genetic differentiation across this broad environmental cline, in agreement with other studies. However, we discovered island effects on geographically distant populations, such as those on Haida Gwaii and Kodiak Island. Using glaciation data, alongside this database, we see apparent post-glacial recolonization of the mainland from islands and the south of the range. Genotyping the IUFRO population expands upon the use of the collection in three ways: (i) providing information to breeders on genetic diversity which can be implemented into breeding programs, optimizing genetic gain for important traits; (ii) serving a scientific resource for studying spruce species; and (iii) utilizing provenances in breeding programs which are more tolerant to climate change.

1. Introduction

Picea sitchensis (Bong.) Carrière (Sitka spruce) is one of the seven Picea species native to North America, with a native range from Alaska 69° N to coastal California 39° N, occupying coastal areas, islands in the Alexander Archipelago and river regions [1]. Picea sitchensis is a species of considerable commercial importance in Atlantic Europe, where it is well adapted to the mild maritime conditions of Britain, Ireland and the coastal region from France to Denmark. In its native range, commercial interests are limited to Alaska, British Columbia and Haida Gwaii. Its natural distribution overlaps with Picea engelmannii Parry ex. Engelm. (Engelmann spruce) and Picea glauca (Moench) Voss (White spruce), which it hybridizes with to form Picea x lutzii Little, in areas such as South Alaska and Northwestern British Columbia [2]. However, Sitka and Engelmann spruce hybrids do not commonly occur. Hybrids of White and Engelmann spruce can also occur in this area, but neither hybrid is of economic importance [3]. The geographical niche occupied by Sitka spruce reflects its adaption to moist coastal areas provided by mild maritime conditions with high humidity. It continues inland until these conditions change and other species dominate. Peripheral zones are occupied largely by White spruce. This creates a large latitudinal spread and a thin longitudinal niche of Sitka along coastal areas. As a result of this, genetic isolation is likely due largely to geographical distance along the north–south range. However, the isolation of spruce on three large islands, namely Kodiak Island, Montague Island and Haida Gwaii (50, 36 and 55 km from the coast respectively), may also present a more significant barrier to gene flow than isolation by distance processes occurring along the continuous stretch of Sitka from Alaska to California [4]. While conifers occupy many geographic and ecological niches, species diversity is not as high compared to angiosperms in similar distributions [5]. The resulting large population sizes of conifer species and their efficient gene flow cause low frequencies of rare alleles, nucleotide diversity and genetic differentiation [6,7]. In general, conifer species tend to have large distribution ranges across environmental clines, with populations demonstrating local adaptions depending on the ecological niche occupied [8,9].
Phylogenetic and historical biogeographical relationships between the Picea species have been inferred from DNA analyses, crossing experiments and fossil evidence [10,11]. The fossil record suggests that Picea diverged within Pinaceae 135 million years ago in the peripherals of the pacific basin [6]. Picea koyamae Shiras is thought to be an ancestor species of Sitka that migrated from Siberia to Alaska; however, there is no current fossil evidence to support this [12]. It has been inferred that many conifer populations were fragmented during the Pleistocene era due to glaciation, isolating populations in refugia [13]. Due to an incomplete fossil record, this theory cannot be fully supported by fossils and requires molecular phylogenetic analyses. These inferences are leading to a better understanding of conifer evolution and the discovery of traits of interest for breeders.
Molecular markers, such as Single Nucleotide Polymorphisms (SNPs), have allowed for improved breeding, trait discovery, population genetics and phylogenetics [14,15,16]. Genotyping-by-sequencing (GBS) allows for the discovery of genome-wide SNPs. For plant breeding, these can be specifically used to create linkage maps, discover traits through genome wide association studies and improve the selection of parental crosses through genomic selection [16]. In conservation genetics and molecular ecology, SNPs can be used to investigate population diversity, structure and ancestry [14,17].
The population used in this study was the IUFRO (International Union of Forest Research Organisation) collection, which represents a diverse distribution of the native range of Sitka spruce [18]. The establishment of the IUFRO collection was carried out with two seed-collecting phases in 1968 and 1970. Seed was collected from 81 provenances, with twenty representative trees sampled per provenance and seed being bulked per provenance for distribution. The provenances selected were at least 50–80 km from each other and represented commercial or scientific areas of interest [19]. The provenances occupied 19 geographic regions, which were determined at collection. Initially, this collection was used to test the performance of provenances in non-native regions for forestry. The collection was planted across eleven countries in its entirety, or subsets of provenances were used, to assess their establishment and performance. The initial experiments found that provenances from Washington were best suited to Ireland, Haida Gwaii was most suited to the UK and Oregon was the best suited to France [18,20]. Some of these initial field collections remain in multiple countries and have been used for breeding and scientific purposes. For example, in the United States, the genetic variability of enzymes within ten provenances from this collection was characterized [21], and in Canada, it has been used to study the resistance of Sitka spruce to white pine weevil (Pissodes strobe) [22]. The IUFRO collection in Ireland presents a large collection located in the same area, allowing for novel studies to be completed.
To preserve, build on and utilize the IUFRO collection, we genotyped as many individuals of the population as possible. Genotyping this population serves numerous functions. Firstly, this is a widely distributed collection grown in several countries and captures the diversity of the native population, along with areas of interest to breeders. Secondly, a collection this large will allow us to investigate fundamental questions about its ancestry, hybridization, clinal adaptation and post-glacial spread. Finally, with the effects of climate change, it is uncertain that our current breeding stock is resilient against some of the foreseeable climatic changes, such as drought, and unforeseeable changes, such as the invasion of new insect pest species. The genotyping of this material will allow for the acceleration of breeding and genetic gain, hopefully combating productivity losses associated with climate change. This will act as a DNA bank that can be used to investigate traits and screen for resistant genotypes for breeding. In this study, we aimed to build a key resource for Sitka Spruce and North American Spruce research and will expand on existing resources that are available to research. We also described this population by using the genotyping data to highlight areas of interest to scientists and breeders.

2. Materials and Methods

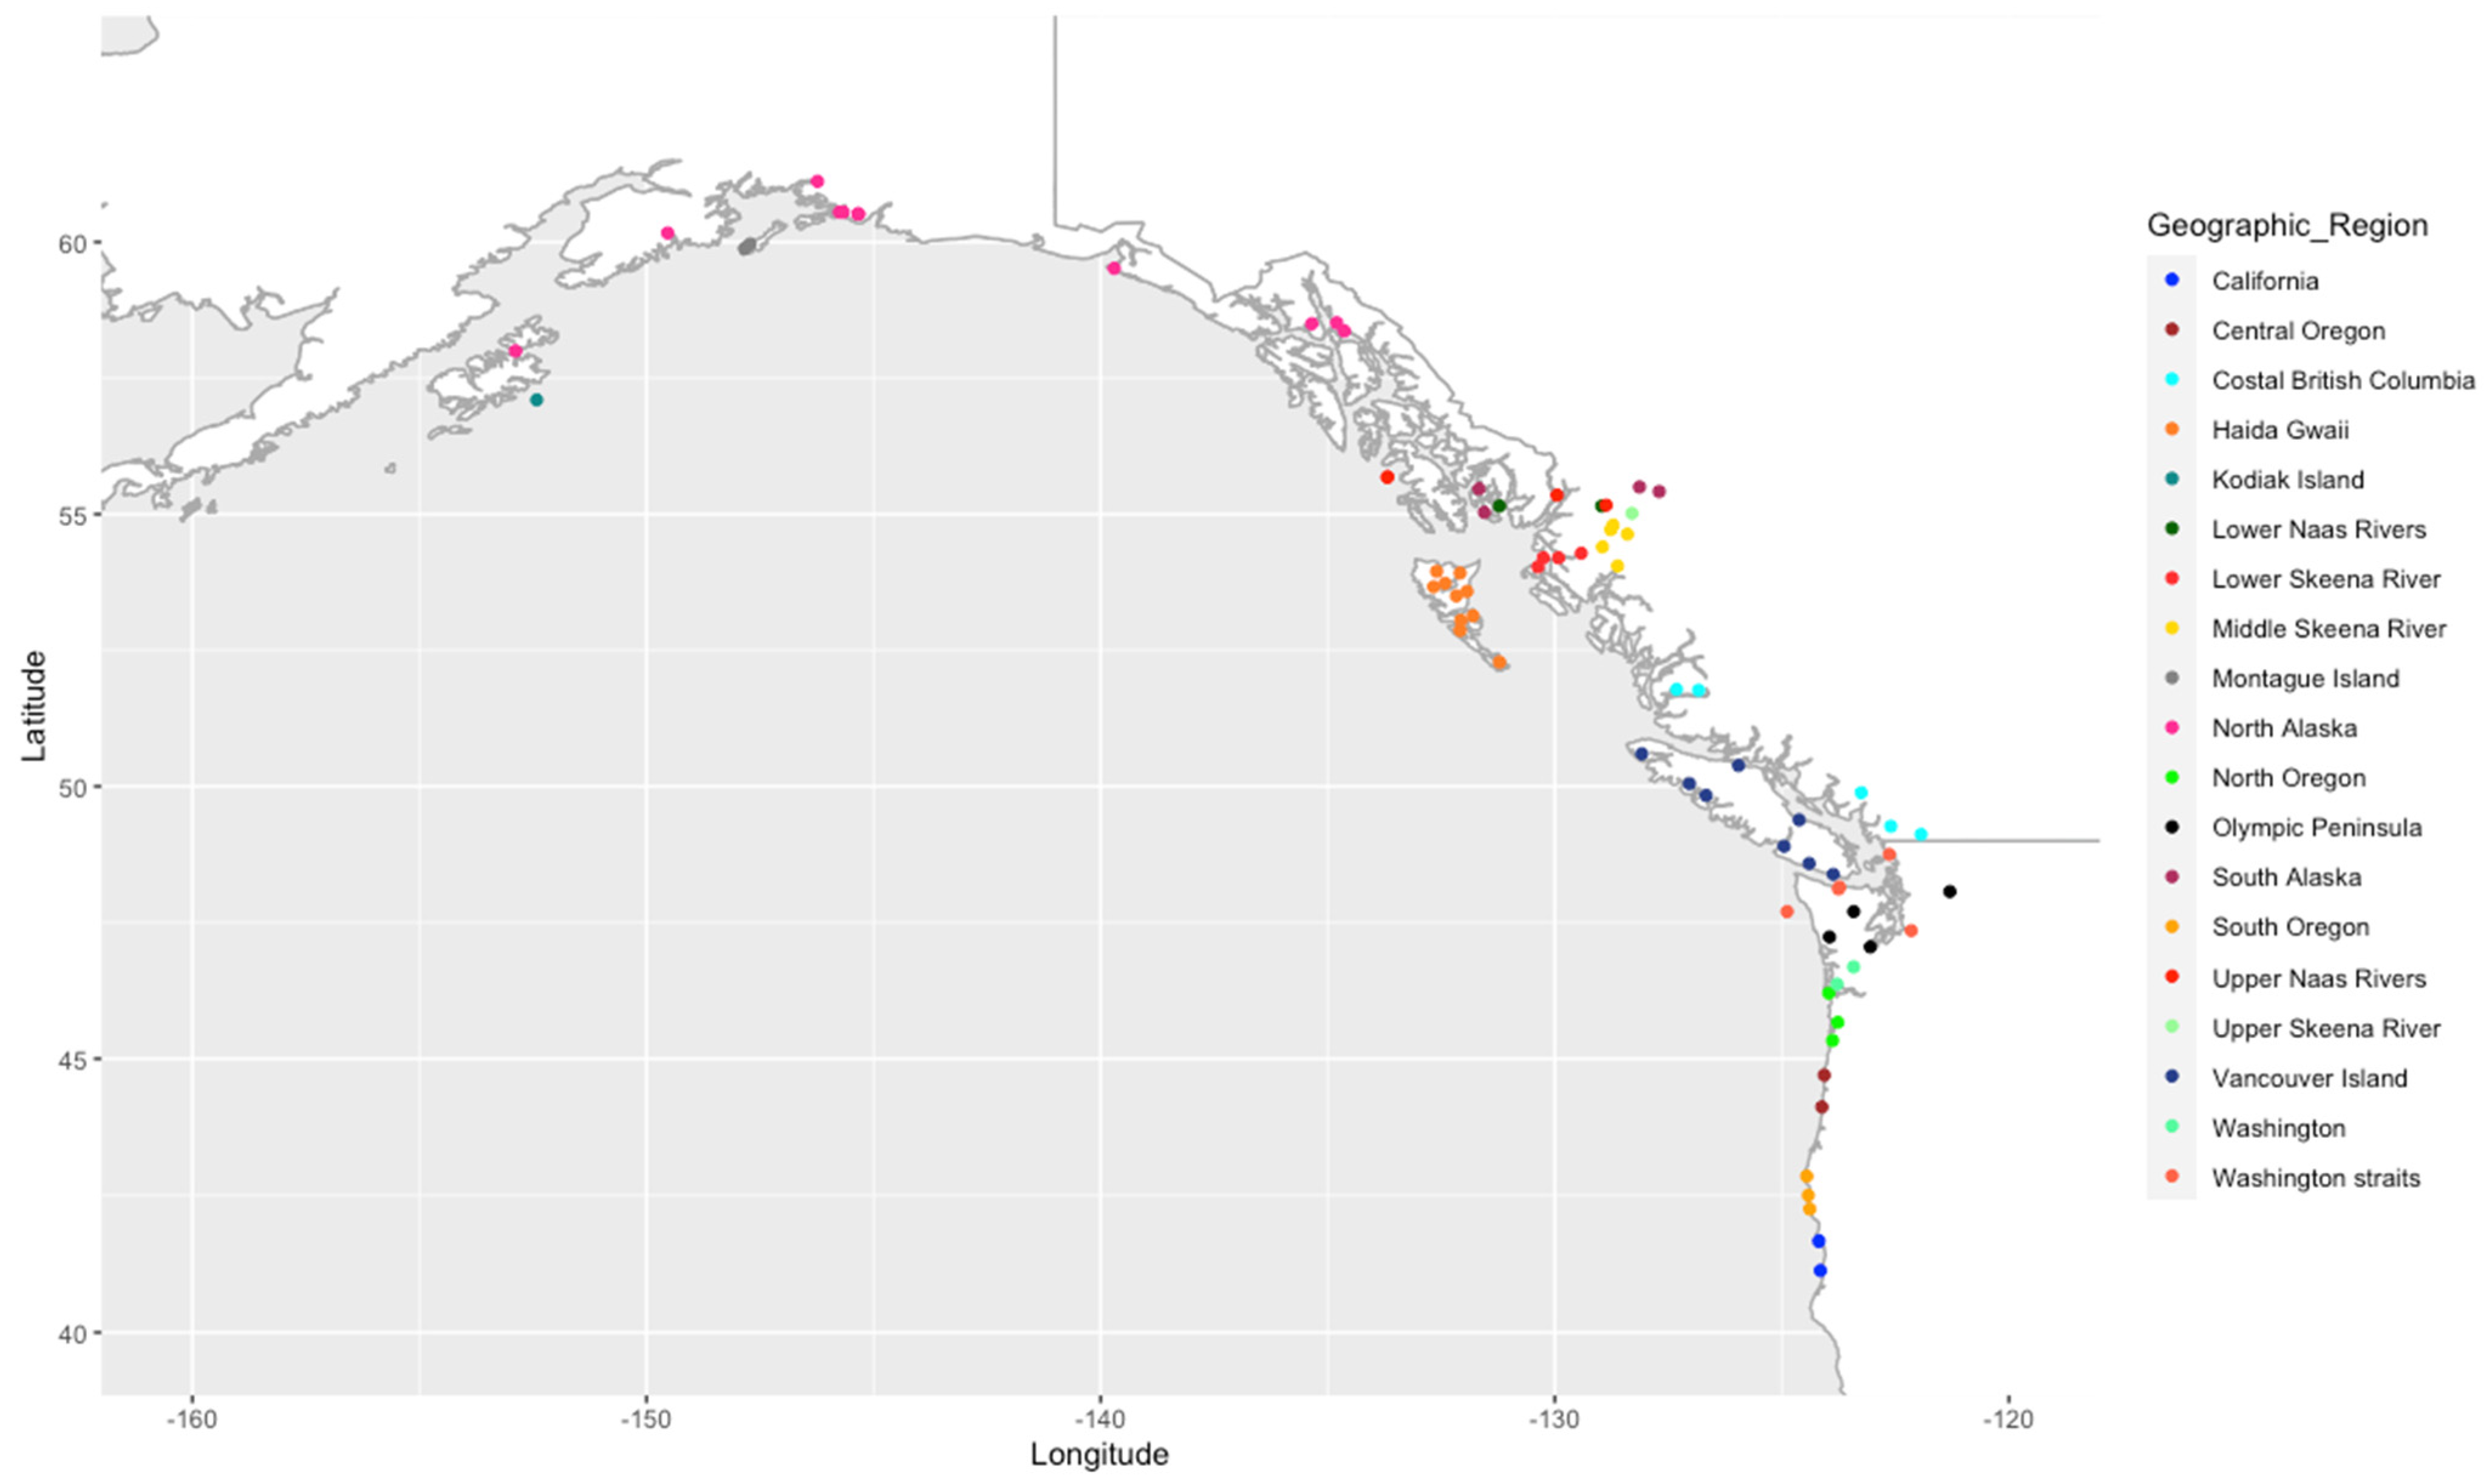
2.1. Sample Populations

The IUFRO population was planted in 1975 and 1978 at John F. Kennedy Arboretum in county Wexford, Ireland (52.315, −6.941) [23]. This population consisted of seeds collected from 80 provenances of the original 81 available in the IUFRO population (Figure 1) (Supplementary Table S1), with 30 trees planted per provenance in a line. Each line was thinned sporadically, resulting in 1400 trees by 2021. The population consisted of 19 geographic locations, as defined by the original IUFRO collection, ranging from Alaska (152.53 W, 58.0 N) to California (121.45 W, 48.07 N), with an elevation range of 0 to 671 m (Figure 1) (Supplementary Table S1). Vascular cambium was sampled for DNA extractions in May 2021, using a cork borer. The samples were then frozen at −20 °C, which allowed the cambium layer to split from the bark layer. The cambial layer was removed and freeze-dried prior to DNA extraction.

2.2. DNA Extraction and Sequencing

First, 30 mg of the freeze-dried cambial sample was transferred to deep-well plates, and three titanium beads were added to each well prior to milling. Cambium samples were milled for 1 h at 30 oscillations per minute on a Retsch MM400 mill (long milling time was used due to the woody nature of the samples). The samples were extracted by using the Machery and Nagel NucleoMag Plant DNA kit (744400.1) modified for the Kingfisher flex extraction system. The incubation time was increased to three hours to aid in the breakdown of woody tissue. A second elution step was added at the end of the Kingfisher protocol that increased the yield of DNA. Samples were quantified after extraction by using the Quant-iT PicoGreen dsDNA Assay Kit (P7589) and a BioTek Synergy HT to assess if samples were at a quantity of 30 ± 5 ng/µL. Samples were sent to LGC Genomics (Berlin, Germany), where genotyping-by-sequencing (GBS) libraries were prepared by using restriction enzymes to reduce genome complexity [24]. The restriction enzymes used for library preparation were Pstl-ApeK1, and the resulting libraries were sequenced on an Illumina platform in paired-end mode and read lengths of 150 bp to achieve a target depth of 3 M paired-end reads per sample.

2.3. Variant Calling

The FASTQ sequences generated from the GBS were aligned to the Q903_v1_1000 plus Sitka spruce genome (GCA_010110895.2) [25], using BWA-mem with default parameters [26]. Samtools (v1.9) mpileup generated a mpileup file, which was processed with bcftools (v1.9) to call variants [27]. A minimum site mapping quality of 20 was required to retain an SNP. The VCF files were summarized and visualized by using vcfR (v1.12.0) and vcftools (v0.1.16) [28] that allowed for the filtering of variants. We removed indels and only retained biallelic SNPs. The minimum genotype quality (GQ) was set to 20, and the minimum read depth was set to 5, as the majority of variants were above this threshold. The minimum allele frequency was set to 0.05. We filtered out sites with greater than 30% of missing data points, leaving 108,606 SNPs (—remove-indels —min-alleles 2 —max-alleles 2 —minDP 5 —maf 0.05 —max-maf 0.975 —minGQ 20 —max-missing 0.7). SNPs were thinned so that no two SNPs would be within 10 bp of each other, using vcftools (v0.1.16). An investigation into the Loss of Heterozygosity (LoHe) and Gain of Heterozygosity (GoHe) was completed by using vcftools (v0.1.16)(-hwe -het) and dplyr (v1.0.8) to access filtering on HWE.

2.4. Genetic Diversity Statistics

The data analysis was completed by using R version 4.0.2, unless specified otherwise. The VCF file of 36567 variants was converted into a genind object by using the adegenet (v 2.15) package [29,30]. Observed heterozygosity (Ho), expected heterozygosity (He), gene diversity (Ht and Dst), allelic richness (AR), fixation index (Fst) and population differentiation statistics (Dest and Gst) were calculated across the entire population, using the hierfstat (v0.5-10) function basic.stats [31], and summarized per population, using dplyr (v1.0.8).

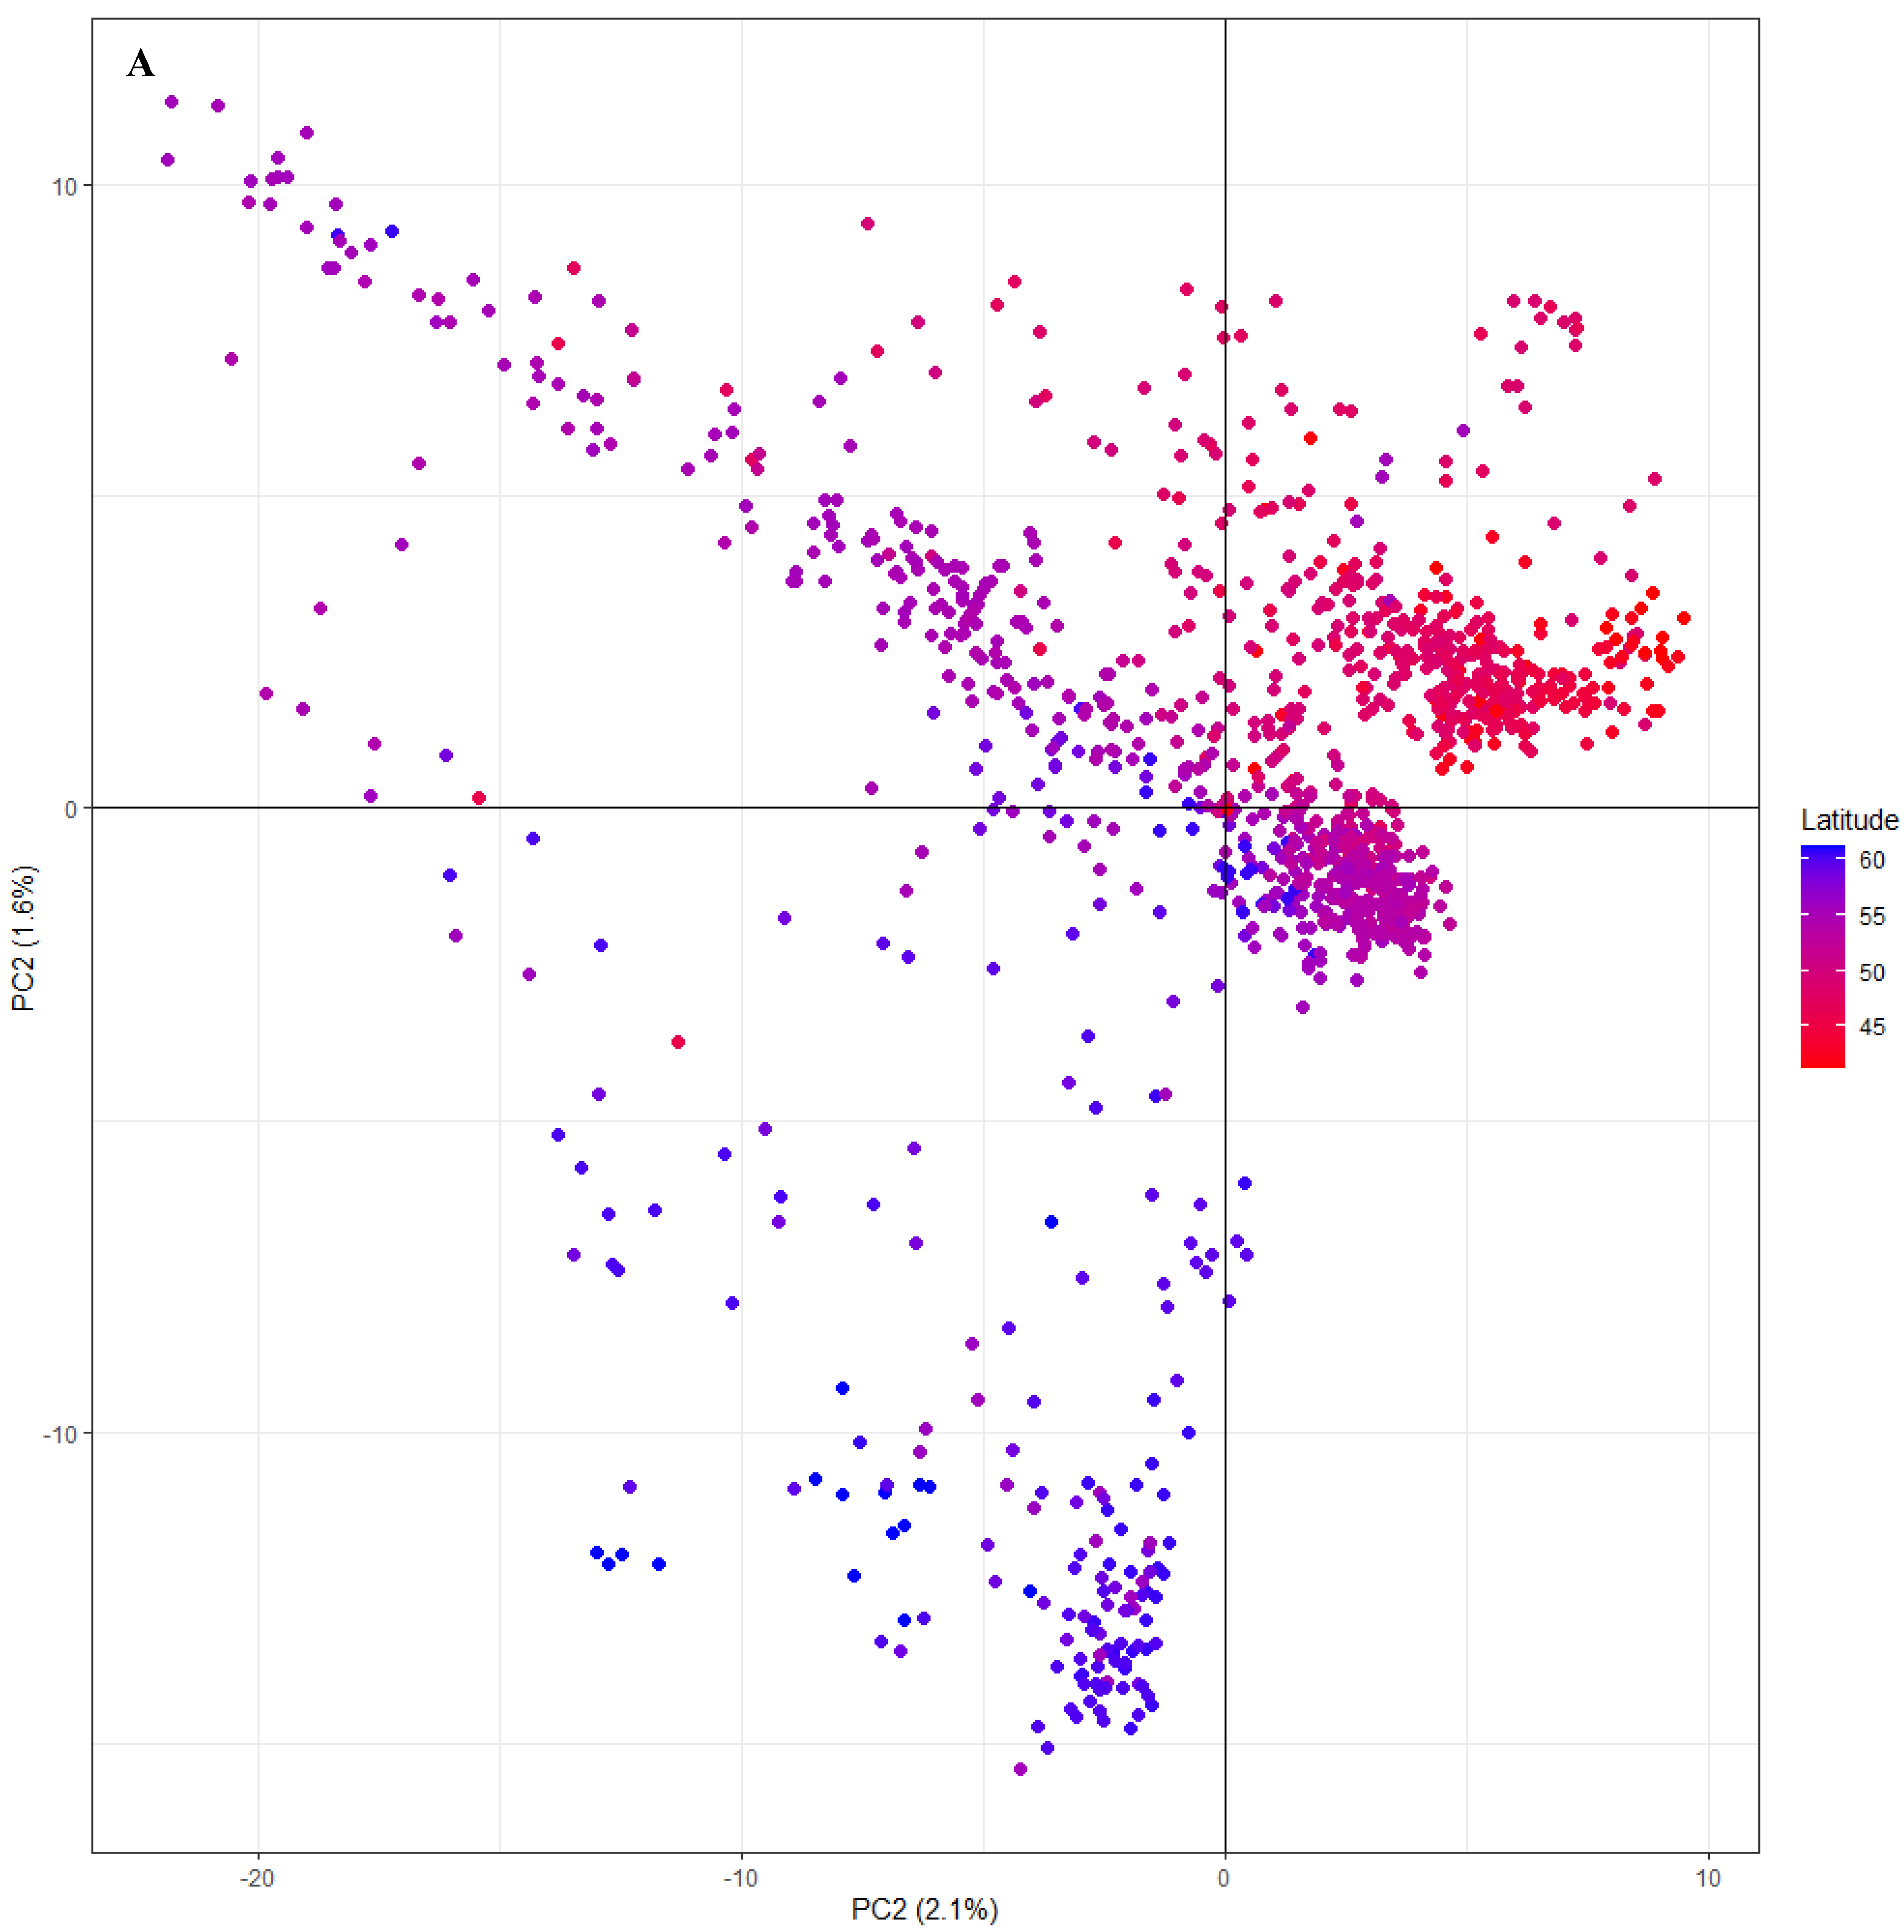
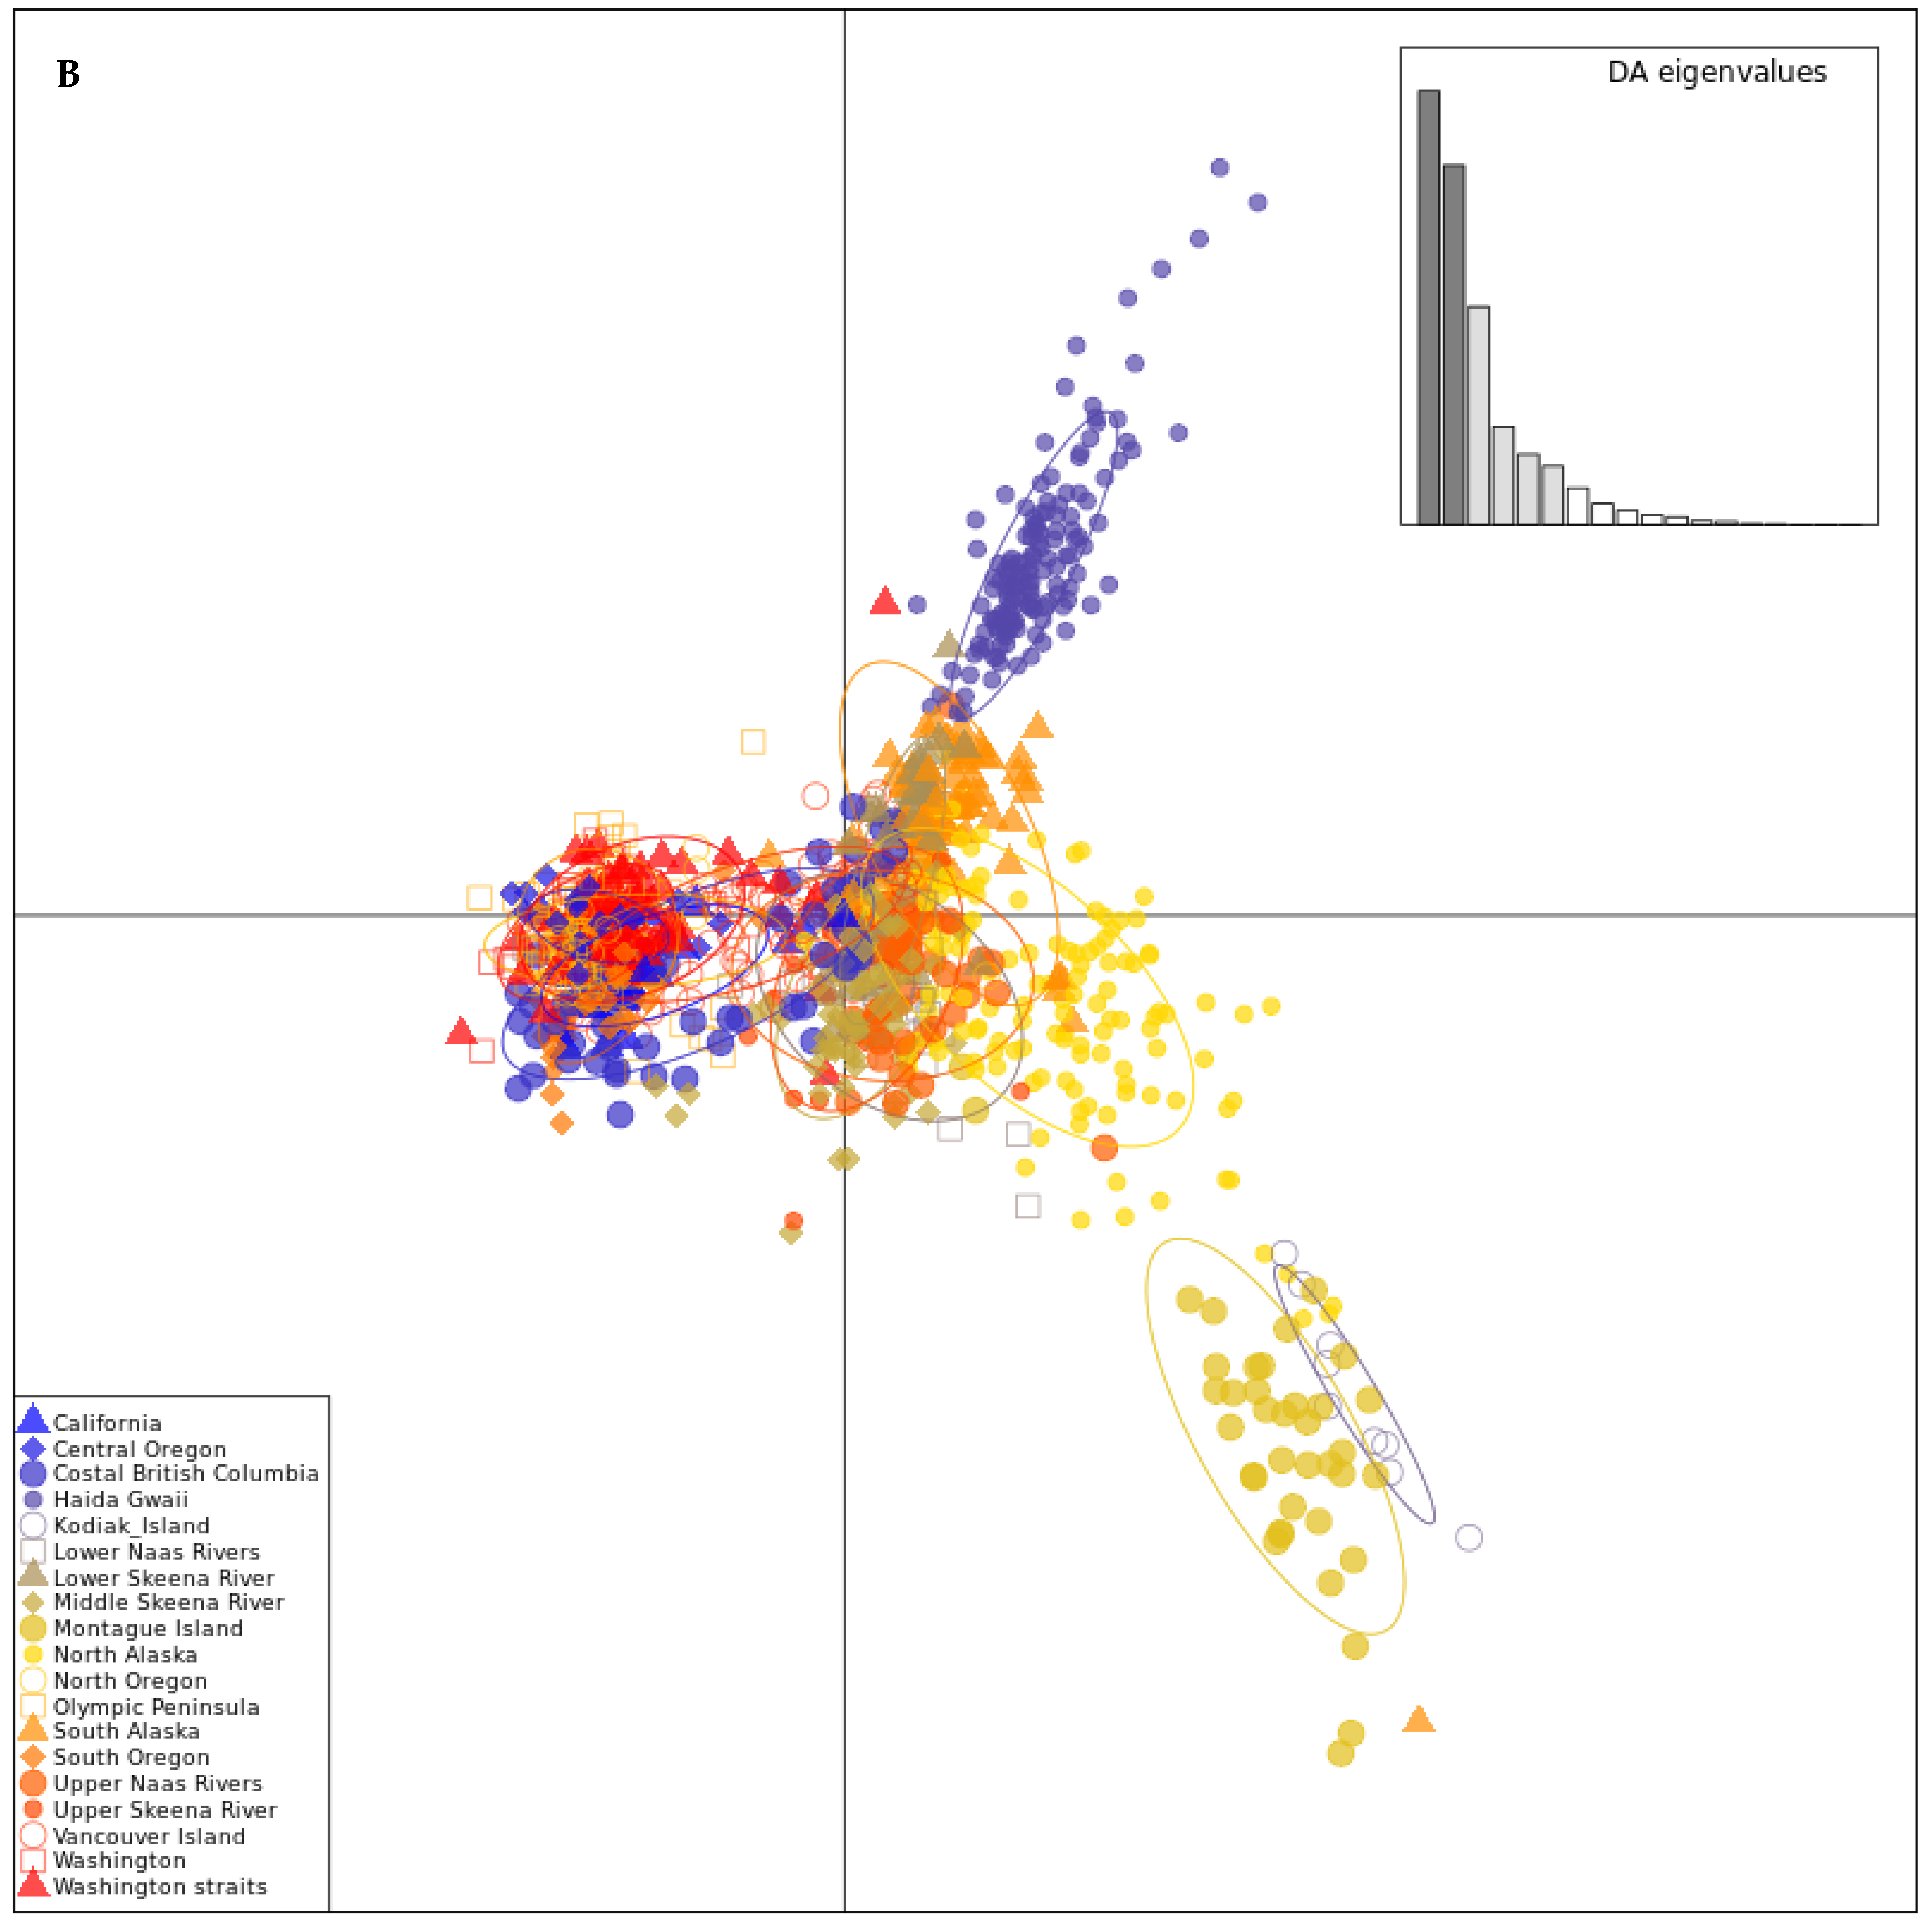
2.5. Population Structure

Here we investigated the prior assignments of the geographic regions for discernible population structure. An Analysis of Molecular Variance (AMOVA) was used to compare the given geographic regions of the IUFRO population and run by using poppr (v2.9.3) [32] on a geneclone object created from the VCF file, using adegenet [29,30]. The AMOVA was run with the geographic region being hierarchical to the provenance. A principal component analysis (PCA) was run on the dataset, using adegenet and ggpolot2 (v3.3.5), retaining 1400 principal components. A discriminate analysis of principal components (DAPC) retaining 6 discriminate analyses was applied to analyze population structure, using supervised clustering with regions as prior [32,33]. Analyses of the population structure while using undefined prior regional assignments were also conducted to investigate the population structure. Optimal genetic clusters (K) were analyzed by using snapclust in adegenet, using the Bayesian information criterion (BIC) [29]. Values for each BIC model were compared, and the optimal K was determined by using the elbow method.

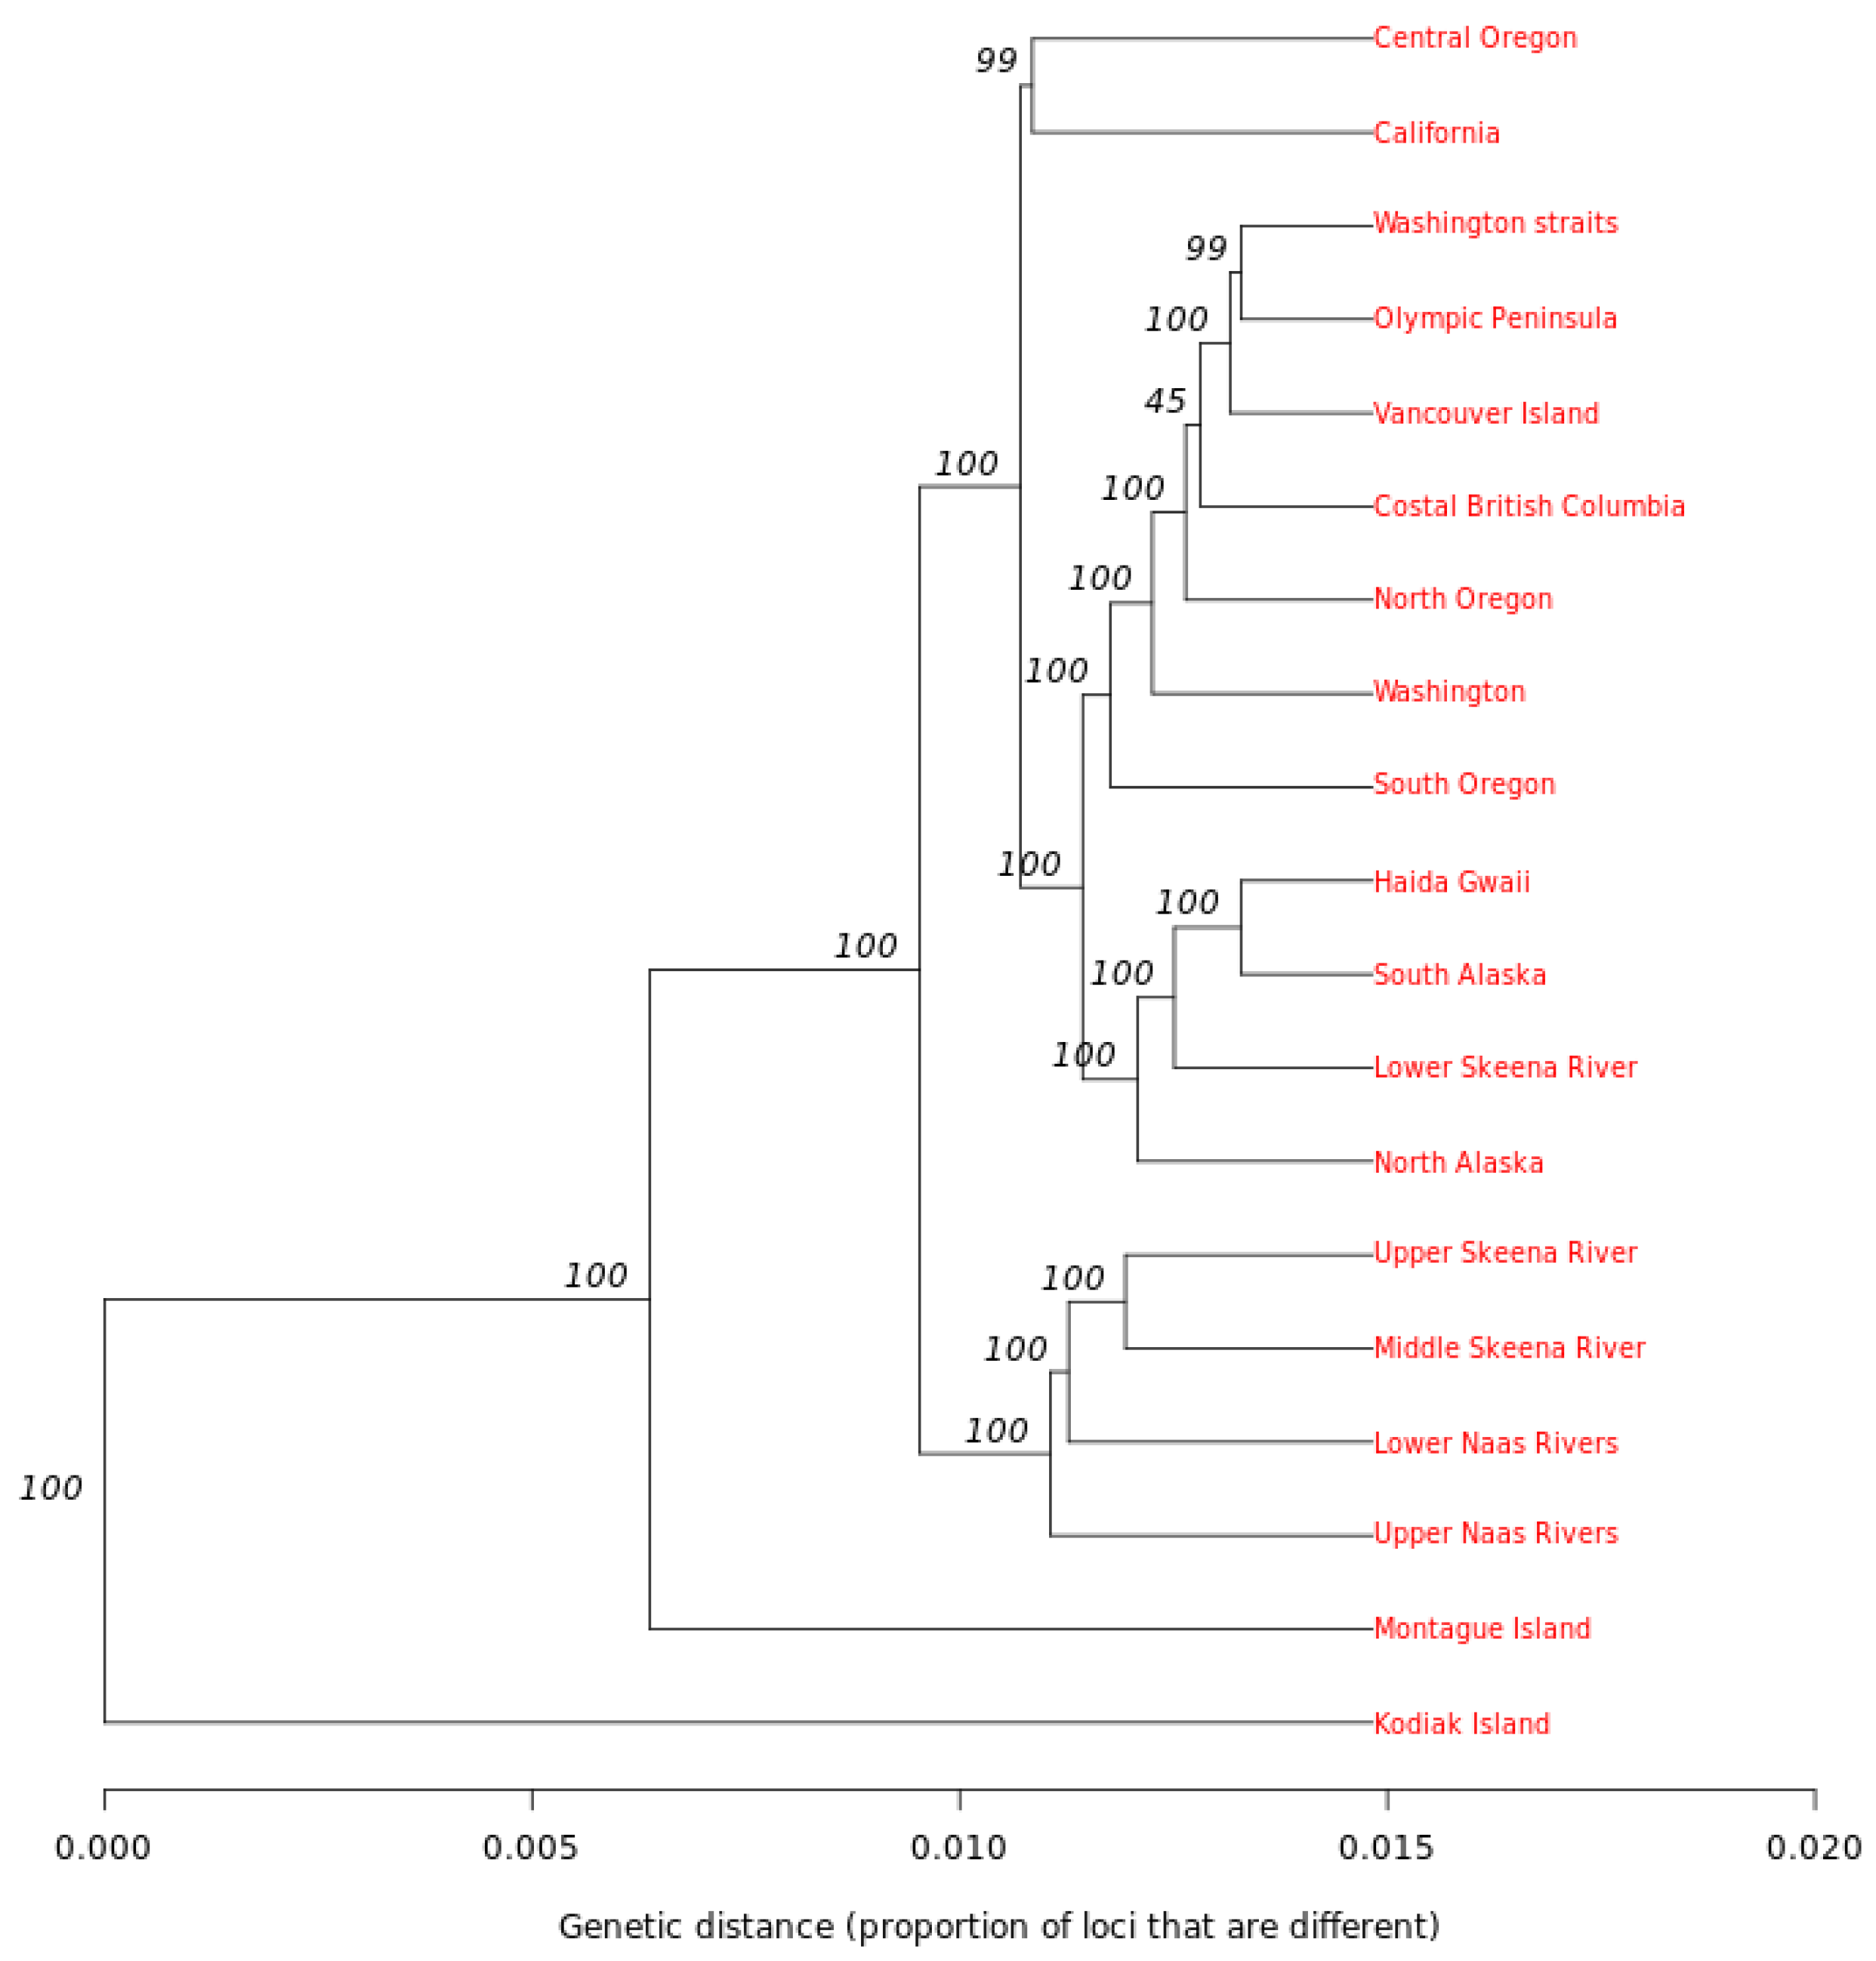
2.6. Phylogenetic Analysis

The relationships between the geographic regions were investigated to show the genetic distance between regions and also highlight any population structure. The IUFRO population was clustered by geographic region and transformed into a genind object by adegenet and dplyr (v1.0.8) [29,30]. The aboot function in poppr was used to create an unweighted pair group method with arithmetic mean (UPGMA) clustering tree with 100 bootstrap replicates [32,34].

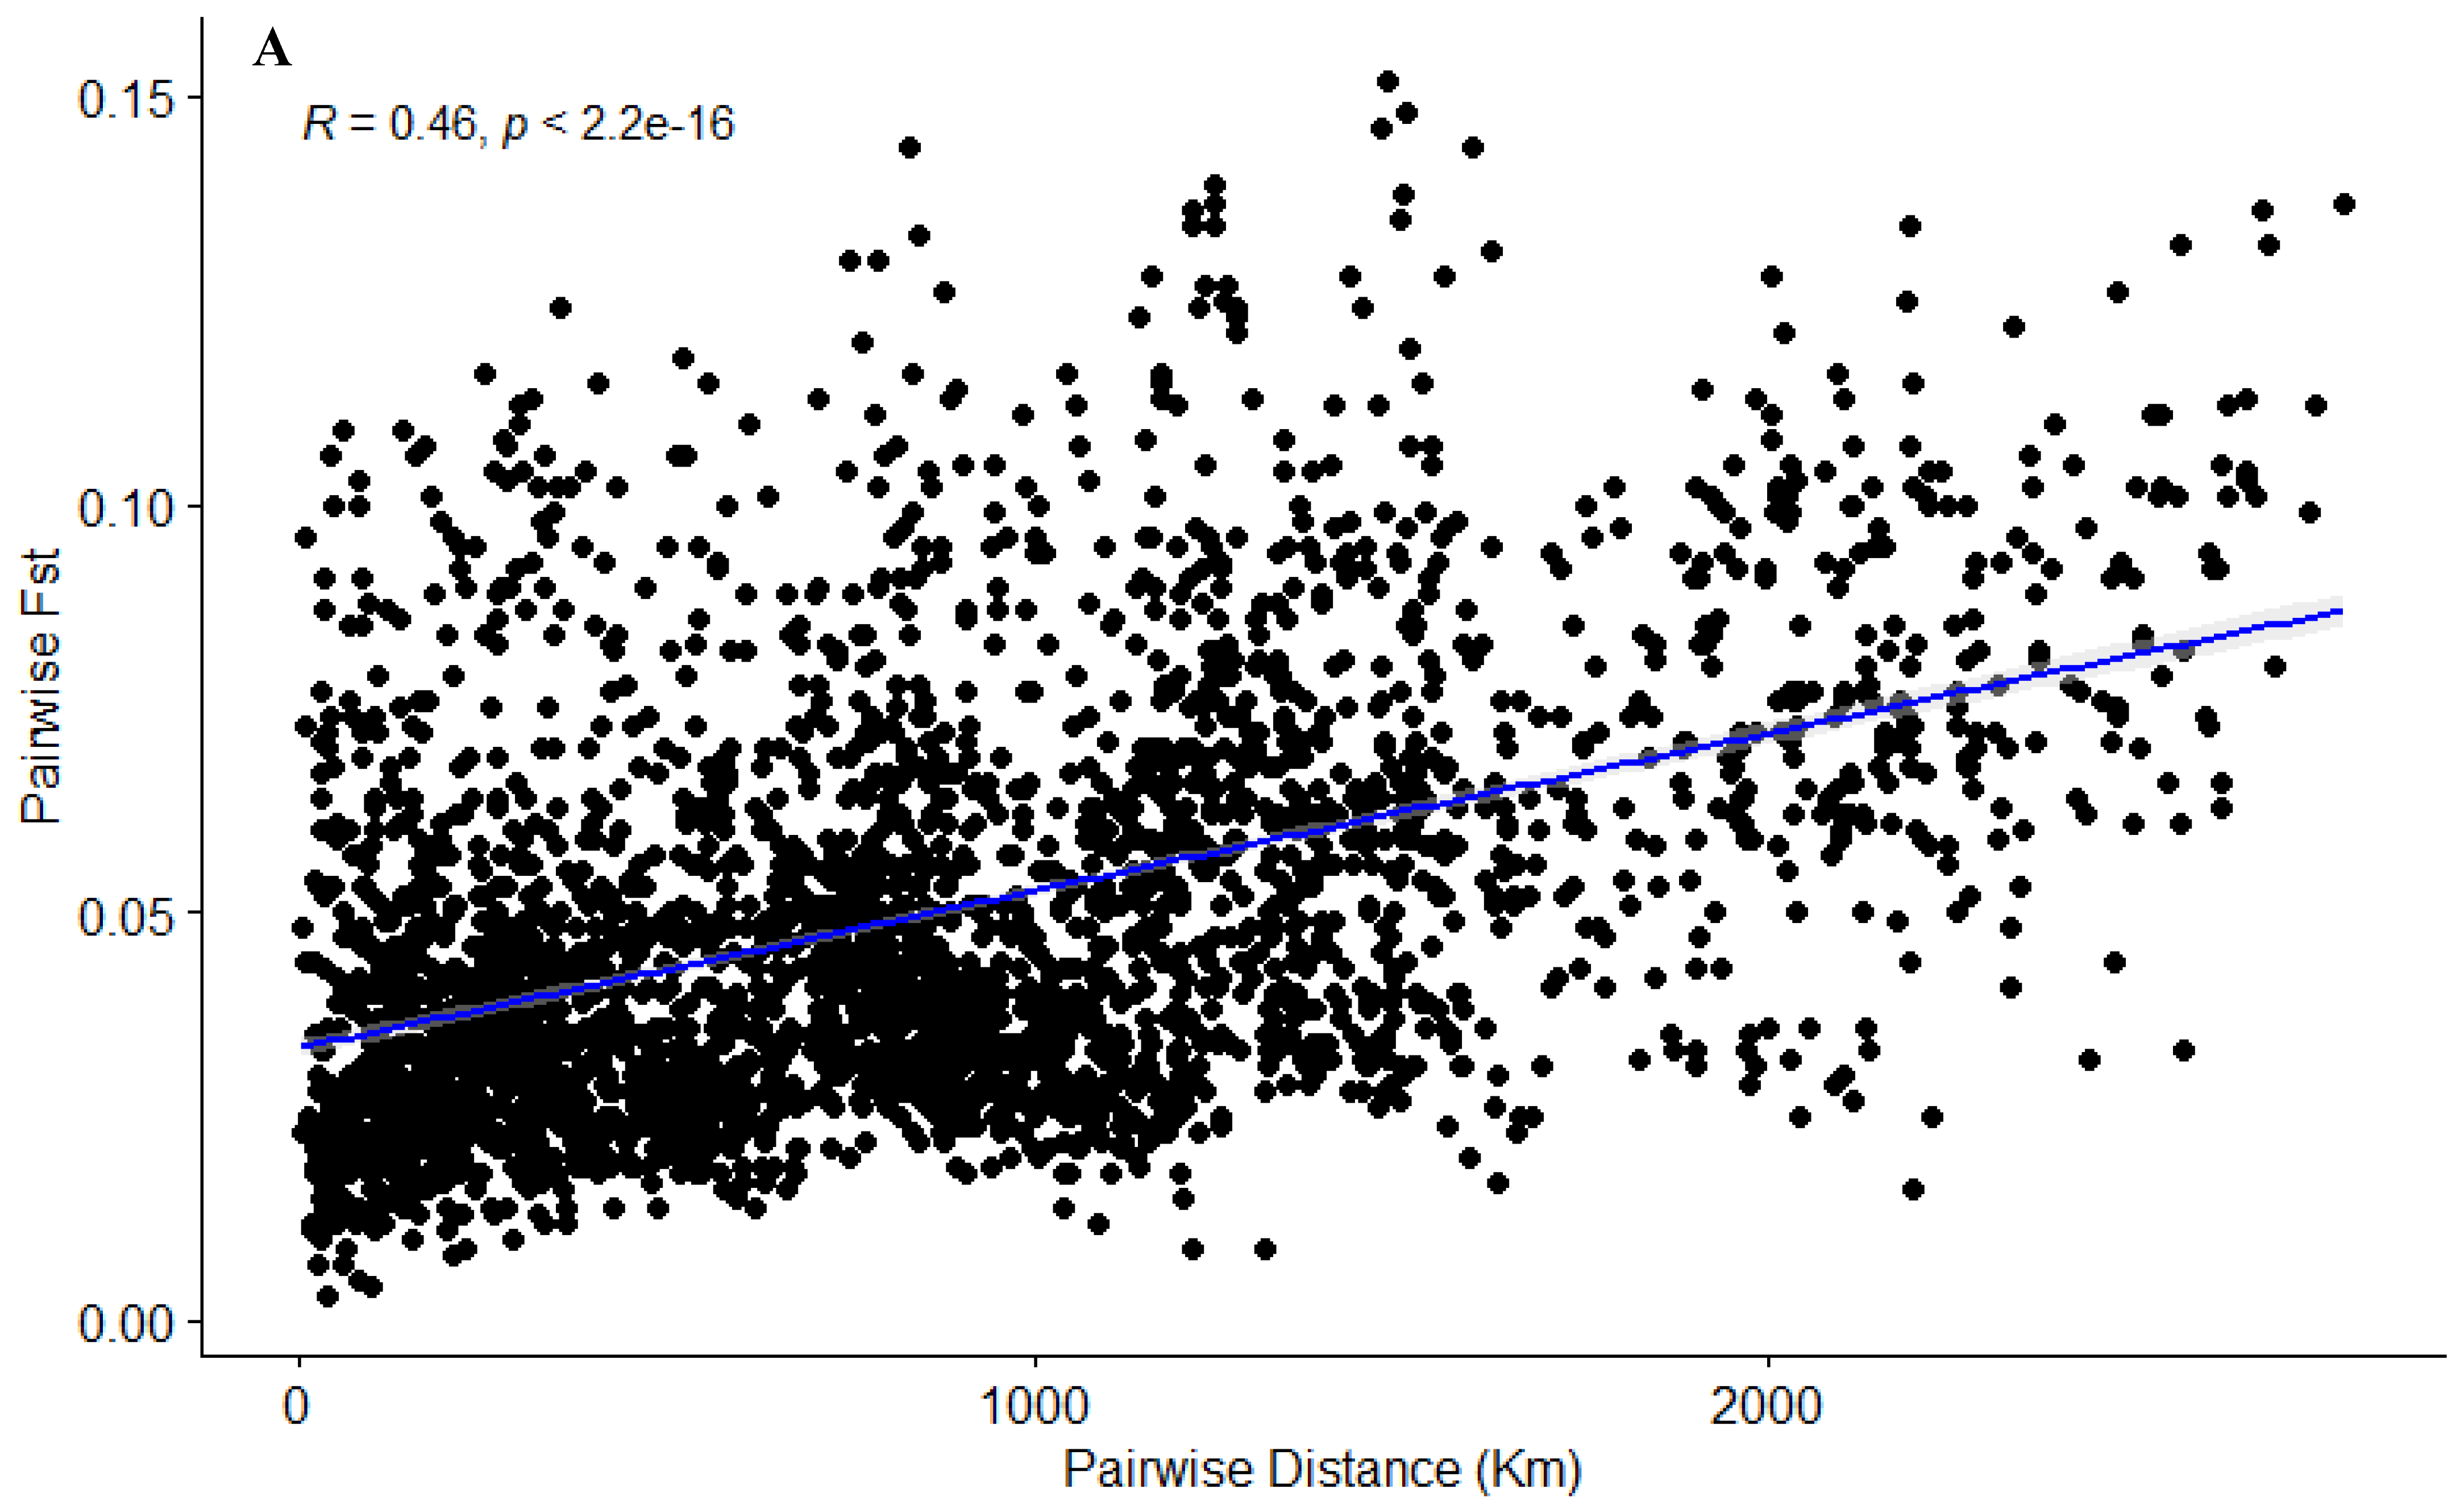
2.7. Isolation by Distance

The geographic distance amongst the populations was compared to their genetic distance to investigate gene flow and diversity. The pairwise Weir and Cockerham Fst were calculated for each pair of provenances, using the hierfstat package [31,35]. Geographic distances between provenances were measured by using the package geodist (v0.0.7). The geographic distance (km) was plotted against Fst/1-Fst, and outliers were investigated.

2.8. Admixture Analysis

Admixture (v1.3) was used to investigate the optimal number of ancestor populations [36]. Admixture was run between K = 2 and K = 50, with 10 reps per K, showing an optimal K of 11 determined by the elbow method. The resulting Q matrix for K = 11 was plotted per geographic region, as defined in Figure 1, using ggplot2. Admixture on a provenance level was plotted on a geographic map, using scatterpie (v0.1.7), ggplot and rnaturalearth (v0.1.0) [37,38,39].

3. Results and Discussion

3.1. Genotyping a Large Sitka Spruce Population, Covering Its Native Geographic Range

The continuous development of genotyping technologies, such as GBS, has resulted in a dramatic increase in sequencing density and reduction in cost, leading to the adoption of SNP genotyping across many forestry species [16]. However, this uptake in SNP genotyping has produced a wealth of data which cannot be fully taken advantage of in most forestry tree species due to the absence of high-quality reference genomes and/or appropriate tools designed and benchmarked for large-genome species [40,41]. The availability of a draft Sitka genome, while being a fragmented assembly, allows for refined processing of the GBS data, resulting in high mapping rates. Encouragingly, the average mapping rate to the draft assembly was 84.9% across the 1184 samples (seven samples were removed due to poor mapping rates). In total, 81.9% of the reads were properly paired.
Putative SNPs were identified in the population, and standard filtering on read depth, minor allele frequency and genotype quality resulted in a final database of 108,608 variants [42]. The variant filtration applied to the database was aimed at finding a balance between false negatives and false positives. The filtering of the SNP sets is dependent on the task with, for example, association studies requiring hard filtration of the dataset [43]. Overly harsh filtering to reduce false positives would bias sampling toward frequent alleles impacting our ability to capture diversity, and population structure. This final dataset we analyzed was formed after thinning to ensure that no two SNPs were within 10 bp of each other; this was performed to remove SNPs in strong LD, as conventional LD filtering is challenging in fragmented assemblies [44,45]. Deviations in Hardy–Weinberg equilibrium (HWE) were due to GoHe (Supplementary Figure S1), indicating that deviations were due to sequencing and alignment errors rather than natural processes [46]. HWE was filtered to p > 0.001, resulting in 36,567 variants that were used in a further analysis. The sequence data were submitted to NCBI (BioProject PRJNA852515) The resulting SNP database in this study includes 36,567 variants over 1177 genotypes and captures most of the native range of Sitka, but future improvements in the genome assembly and bioinformatics tools can allow for the reanalysis of the GBS dataset [47]. Here we created a key genetic database for the IUFRO population grown in Ireland. For breeders, this database can provide a baseline of genetic diversity to compare against breeding stock and seed orchards. Most notably SNP sets have been used for evaluating the parental contributions and contamination in seed orchards, allowing for the better design and selection of parents [14]. For researchers, this database can allow for the investigation of traits of interest, using methods such as Environmental Association Analysis (EAA) [48,49]. For example, responses to climate change have been investigated by using EAA in both Lolium perenne [48] and Pinus taeda [49], utilizing SNP sets.

3.2. Geographic and Genetic Diversity

The IUFRO collection that was used in this study primarily captures a representative sample of the entire native range of Sitka, with a large diversity of habitats [12]. There are large clusters of populations sampled from around the Vancouver region, Coastal British Columbia, Alaska and Haida Gwaii (Figure 1). These areas are more populous, with larger forestry industries, leading to more seed being included in the original collection. The more isolated populations, such as those of Montague Island, Afognack Island, Kodiak Island, Southeastern Alaska and Northern California, are not as well represented in this database. The high geographic diversity and isolation of these adjacent populations does not, however, result in high genetic differentiation due to the high amounts of gene flow between populations. The genetic diversity of the geographic regions measured by He ranged from 0.17 to 0.24, with an overall He of 0.21. In most cases, the Ho was greater than the He, but some regions had the same Ho and He. Heterozygosity is low compared to a study using SSRs, but it is similar to what is found in a study using SNPs, thus highlighting marker differences [50,51]. Additionally, no private alleles were discovered within the geographic regions, and the overall allelic richness (AR) was 1.198 (Table 1), further suggesting high amounts of gene flow among the provenances and geographic regions.
It is in the peripheral populations where genetic differentiation is seen, notably Kodiak Island, which is the most isolated region. However, there is effective gene flow across thousands of kilometers in non-isolated populations, similar to what is seen in other conifers [52]. The efficacy of this gene flow is reduced over larger distances, but physical barriers such as the ocean result in the larger genetic differentiation of those populations. Our results for genetic differentiation amongst provenances and regions are in accordance with those of another study [4] with a reported Gst of 0.03 across eight sampling sites, from Alaska to California. Ho and He differed between studies, but it is difficult to compare with these studies due to differences in sample size, sampling range, marker type and marker number; however, the large sample size and distribution combined with detailed genotype data used in this study allows for a more complex analysis.

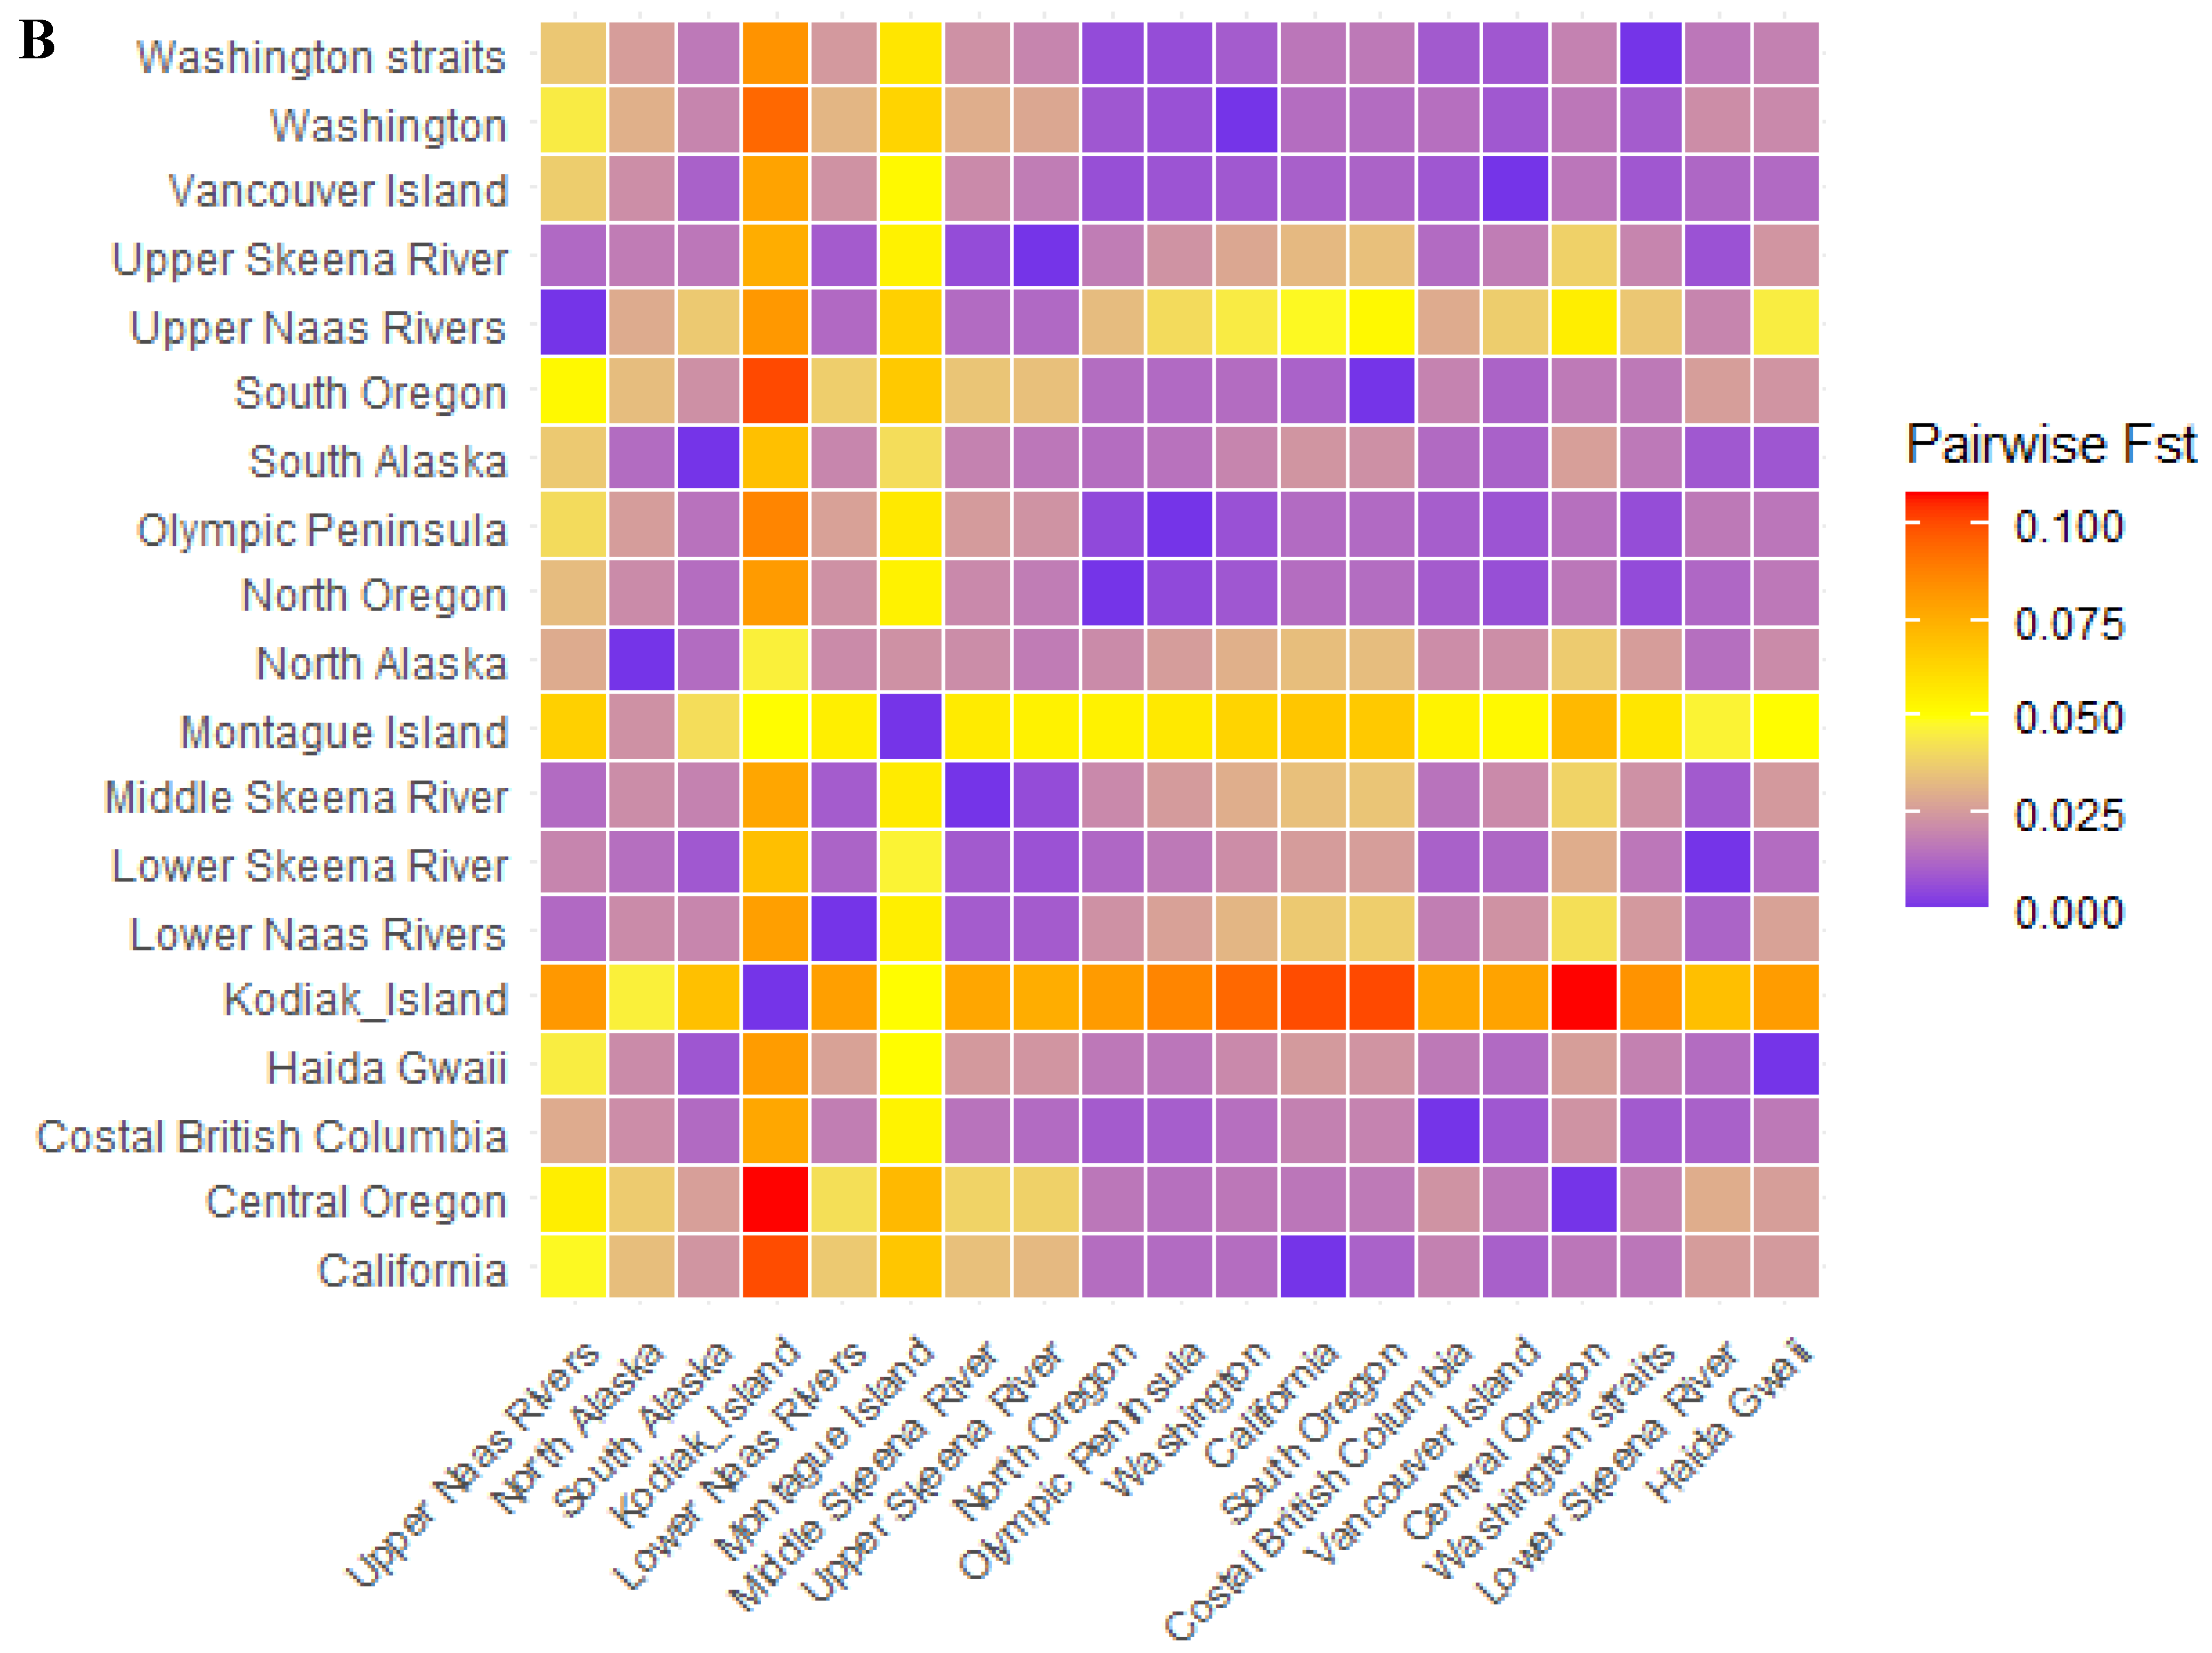
3.3. Genetic Structure

The AMOVA for the entire Sitka spruce population indicated that the majority of genetic variation occurred between samples with between-region genetic variation only accounting for 1.98% (p > 0.01) of the total genetic variation. The variation between provenances was 7.49% (p > 0.01), with within-provenance variation being 3.77%, yet not significant (p > 0.31). The low overall Fst value (0.023) shows low levels of differentiation within the entire population. These Fst values are similar to what are seen in previous studies and suggest an excess of heterozygosity within the populations [53]. Some regions have higher levels of differentiation (Table 2), notably Central Oregon, with an Fst of 0.16. This lack of distinct population structure is somewhat typical in conifer species with large distributions across environmental clines when gene flow is not prohibited.
The PCA analysis revealed a high degree of uncertainty in population structure (Figure 2A); however, some general differentiation is apparent, notably in regard to the Kodiak and Montague islands. The axes of the PCA account for 2.1% and 1.6% of the variation, further indicating the presence of high gene flow within and among populations of this species, as described in other studies. The indication of some structure and differentiation is seen in the DAPC (Figure 2B), which also shows differentiation of Kodiak and Montague islands, along with Haida Gwaii, suggesting an isolation effect on these islands. The same is not seen on the other large island in the population, Vancouver Island.
The BIC supports the clustering seen in the PCA and DAPC, with estimates of K at 3/4 (Supplementary Figure S2). The BIC estimation of four optimal clusters does not take into account prior regional assignment, and the DAPC and PCA alone do not lead to any strong conclusions on population assignment, but taken together, they show a core population of Sitka on the North American mainland, with the separation of populations isolated on islands. This island effect is typical across species due to limitations on gene flow. Spruce seeds have a mean wind dispersal of 345 m and typically conifer pollen travels 4–6 km, which isolates Afognak, Haida Gwaii and Kodiak Island (Figure 1); however, some pollen may be introduced by strong winds or by human and animal interference, which can also generate seed-mediated gene flow [15,54,55,56].
The overall isolation effect is not just one of distance (Figure 3A) but largely due to isolation based on geographical barriers, namely the open sea separating islands (Figure 3B). The correlation coefficient of isolation by distance was 0.46 and 0.41 without these outlier islands of Kodiak and Montague. Phylogenetic structure clustering shows some distinct clustering groups with high bootstrap confidence support (Figure 4). Again, the Kodiak and Montague islands are outliers, likely due to their geographic distance from the mainland. The regions surrounding Naas and Skeena Rivers cluster away from the main population. The AMOVA was rerun, taking into account the structure as signified by the PCA, BIC, DAPC and UPGMA, but this did not change the outcome.
On the mainland, genetic clustering indicates segregation of the genotypes originating from the Skeena and Naas rivers (Figure 4). This area is a known hybrid zone with White spruce, so the genetic influence is likely to be seen between the two closely related species [2,3]. Conifers have a slow rate of speciation, so the genetic differences between White spruce and Sitka spruce may be slight in many areas of this population, especially in the hybrid zone [9]. Identifying “pure” White spruce and “pure” Sitka spruce markers in our dataset would allow for these genetic differences to be fully quantified but the effect of gene flow within the entire population and the close relationship between the two species means the recognition of “pure” Sitka or White spruce is not a realistic concept.

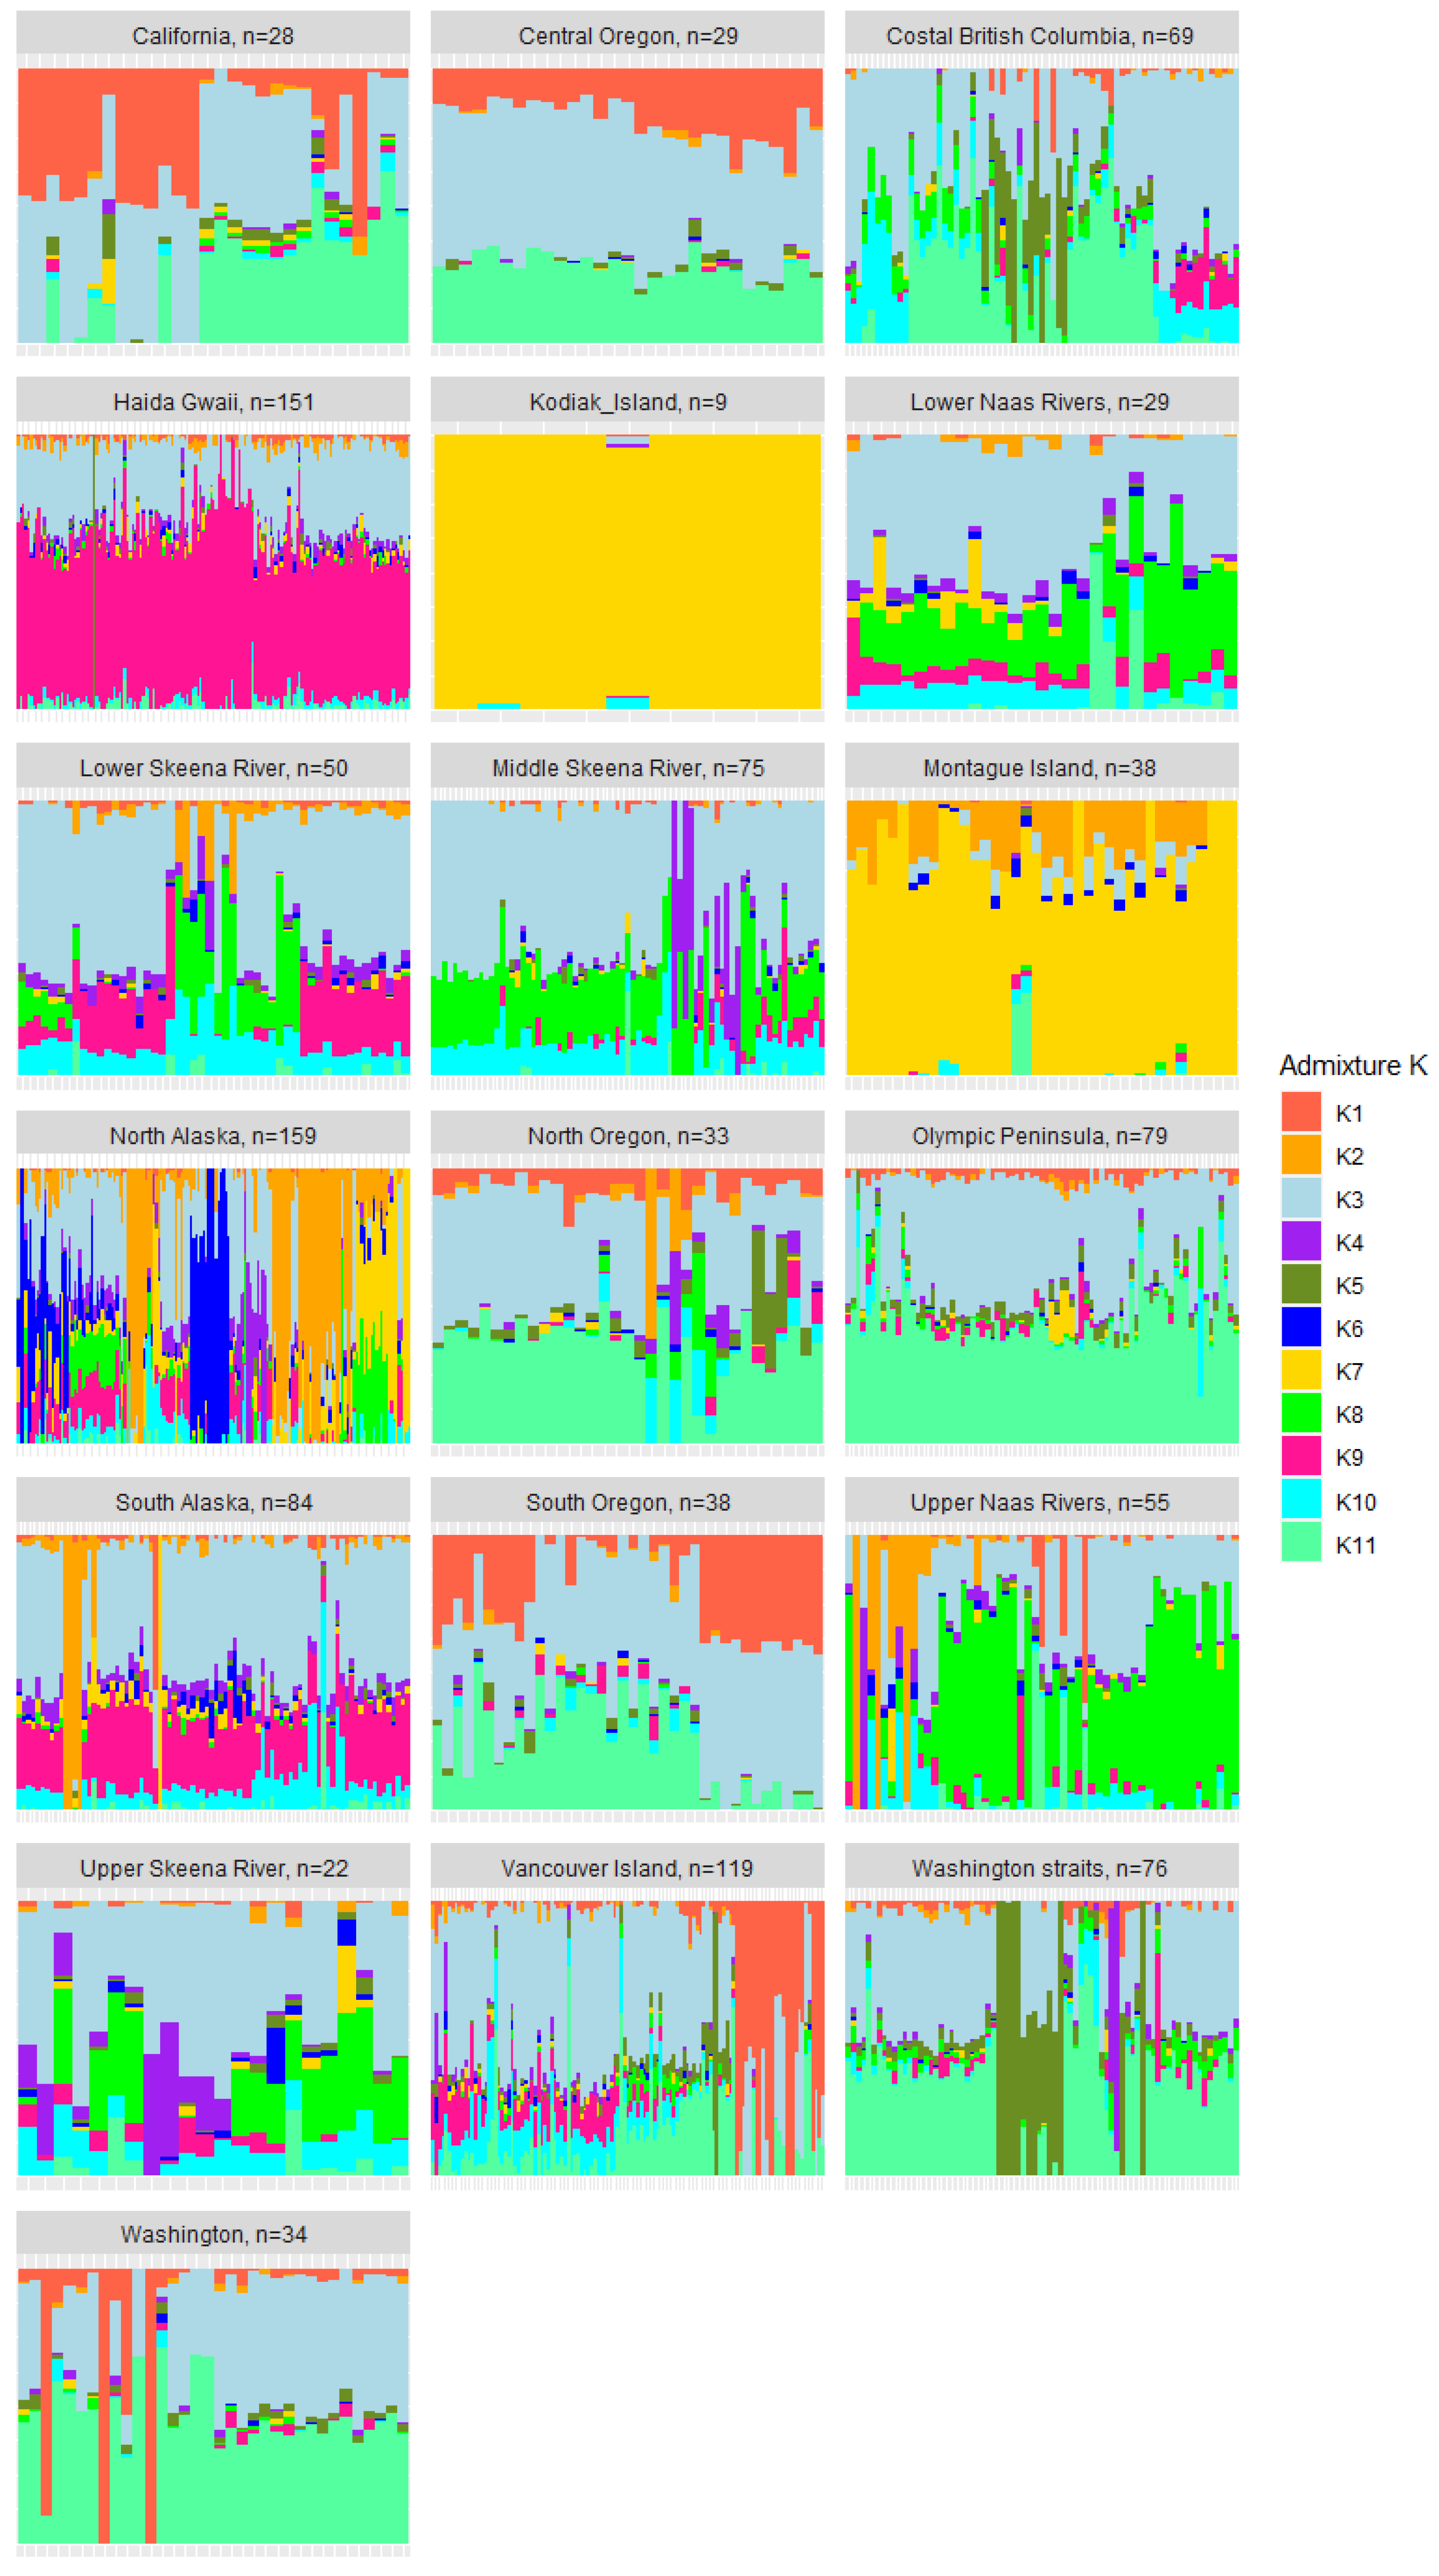
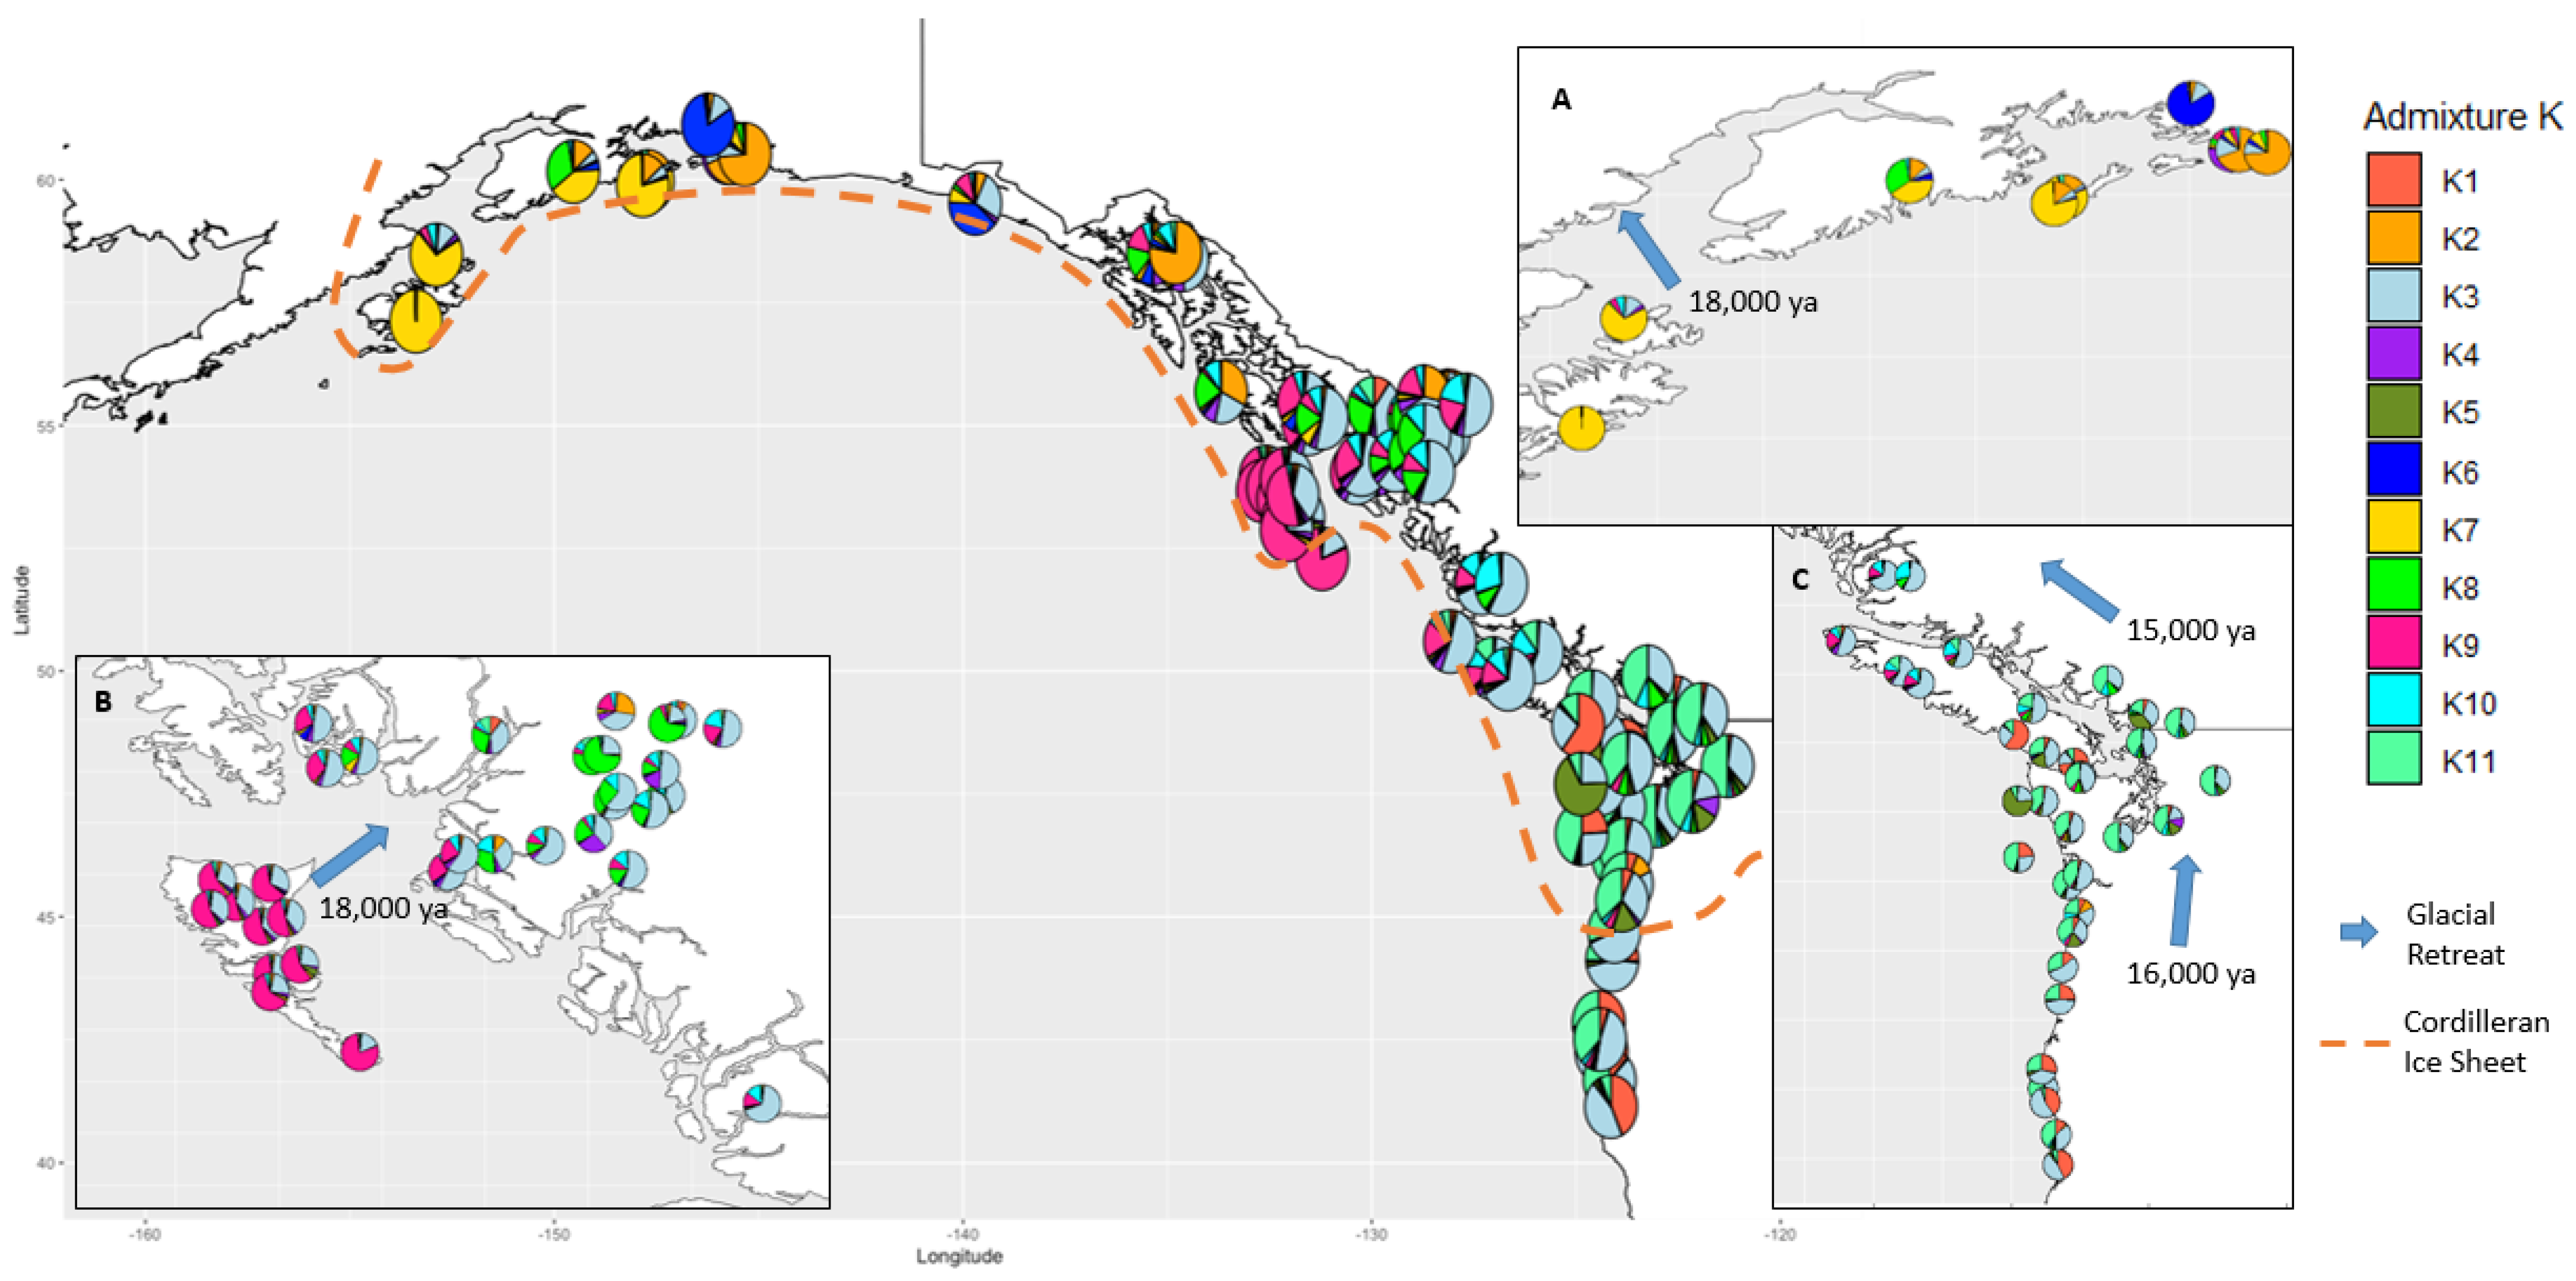
3.4. Genetic Admixture and Ancestry

The admixture model confirms the population structure and enlightens some of the questions about the evolutionary history of the species. We again confirm the island effects on Kodiak and Montague Islands, with no clear admixture events at all in the Kodiak region. Kodiak Island is primarily composed of the K7 ancestral population, indicating there has been little historical mixing with other populations. Montague Island is also primarily composed of a single ancestral population, K11, yet mixing has occurred with K2 and K3. This raises questions about when the isolation event occurred (Figure 5 and Figure 6). The geological history of the Kodiak archipelago shows no land bridges between it and the mainland [57]. The geological history of the area and the history of spruce evolution leads to the conclusion that the Pleistocene glaciation created a refugium on Kodiak Island which in turn recolonized the mainland [13]. During the Pleistocene glaciation, the Cordilleran ice sheet was at its largest 18,500 years ago [58]. The ice sheet covered the area of the entire IUFRO collection range apart from Oregon and Washington states, with some debate on whether refugia existed on islands such as Kodiak or Haida Gwaii [59]. Costal glaciation retreat occurred earliest, around 18,000 years ago, allowing for the recolonization of the species from islands, as is apparent in the admixture model with the K7 and K9 ancestral populations (Figure 6). The southern retreat of the ice sheet was slower with regions such as Washington and Vancouver with glacial retreat occurring 15,000–16,000 years ago [59].
The K8 population occurs frequently in the hybrid zones, possibly due to hybridization events. This is also supported by the phylogenetic tree, which indicates clustering of provenances located around the Skeena and Naas rivers. This area did not become fully clear of ice until approximately 12,000 years ago, suggesting that it could have been one of the last areas to be recolonized by both Sitka and White spruce. The North Alaskan provenances have the most diverse genetic admixture; however, the region also has the largest sample size (n = 159) (Figure 5). In the southern regions of the IUFRO collection, K3, K1 and K11 are most represented. These ancestral populations may be of interest to breeding programs, and association studies may find traits of interest in these populations.
The population genetic structuring of the species has clearly been shaped by the Pleistocene glaciation and the retreat of the Cordilleran ice sheet, which has isolated areas such as Kodiak, but remixture of some of the refugia has occurred into the main population. This answers key questions about isolation events of Sitka but raises additional questions about the evolutionary spread of ancestral populations and how they relate to East Asian spruce. A phylogenetic analysis of North American and East Asian species is required at a detailed level to piece together the puzzles of Picea ancestry. Unfortunately, such genetic resources are not all collected yet; however, here we have contributed an SNP dataset for Sitka spruce, a species which is at the forefront of the ancient land bridge between Asia and America. On the western reaches of this range, White spruce is well distributed and often hybridizes with Sitka. Future work should focus on comparing these closely related species and identifying patterns of speciation and adaptation between the two species. Carrying out similar work in the western range of White spruce may allow for the reclassification of some samples in our database as hybrids or White spruce.

4. Conclusions

The IUFRO collection has been a valuable resource for scientific research of Sitka spruce and for use within breeding programs and has been distributed to many organizations across different countries. Here we built on the existing resource by genotyping 80 of the 81 provenances in the original collection. We used the data to study population diversity and found a high degree of gene flow within the population on Mainland North America, with diverse clusters occurring on isolated islands. The IUFRO collection and the genotyping data will allow for trait-association studies as the genomic resources available in Sitka spruce improve. This will be beneficial for breeders and enable further phylogenetic comparisons of spruce species of scientific interest.

Supplementary Materials

The following supporting information can be downloaded at https://www.mdpi.com/article/10.3390/f13091511/s1. Figure S1: Gain of Heterozygosity (GoHe) associated with sequencing based errors causes deviations from Hardy Weinberg Equilibrium; Figure S2: Optimal clusters as determined by Bayesian Information Criterion (BIC); Table S1: Provenances and their respective geographic regions.

Author Contributions

Conceptualization, S.L.B., N.F., T.R.H., C.K. and S.B.; methodology, S.L.B., N.F., T.R.H., S.B., C.K. and T.B.; software, T.B. and S.L.B.; validation, S.L.B., T.R.H., N.F.,C.K. and S.B.; formal analysis, T.B. and S.L.B.; investigation, T.B.; data curation, T.B. and S.L.B.; writing—original draft preparation, T.B.; writing—review and editing, T.B., S.L.B., T.R.H., N.F., C.K. and S.B.; visualization, T.B.; supervision, S.L.B., T.R.H., N.F., C.K. and S.B.; project administration, N.F.; funding acquisition, S.L.B., T.R.H., N.F., C.K. and S.B. All authors have read and agreed to the published version of the manuscript.

Funding

This research was funded by the Department of Agriculture, Food and the Marine under grant award 17/C/297.

Data Availability Statement

Raw sequence data were submitted to NCBI (BioProject PRJNA852515).

Acknowledgments

The authors would like to acknowledge the financial support of the Department of Agriculture, Food and the Marine under grant award 17/C/297, which supported this work. The authors would also like to thank the staff at the JFK Arboretum for help with sampling trees.

Conflicts of Interest

The authors declare no conflict of interest.

References

  1. Griffith, R. Picea sitchensis. In Fire Effects Information System; Forest Services: Washington, DC, USA; Available online: https://www.fs.fed.us/database/feis/plants/tree/picsit/all.html (accessed on 14 April 2022).
  2. Hamilton, J.A.; Aitken, S.N. Genetic and Morphological Structure of a Spruce Hybrid (Picea Sitchensis x P. Glauca) zone along a Climatic Gradient. Am. J. Bot. 2013, 100, 1651–1662. [Google Scholar] [CrossRef] [PubMed]
  3. Degner, J. Spruce hybridization in British Columbia. For. Genet. Counc. BC 2015, 1–2. [Google Scholar]
  4. Gapare, W.J.; Aitken, S.N.; Ritland, C.E. Genetic diversity of core and peripheral Sitka spruce (Picea sitchensis (Bong.) Carr) populations: Implications for conservation of widespread species. Biol. Conserv. 2005, 123, 113–123. [Google Scholar] [CrossRef]
  5. Leitch, A.R.; Leitch, I.J. Ecological and genetic factors linked to contrasting genome dynamics in seed plants. New Phytol. 2012, 194, 629–646. [Google Scholar] [CrossRef] [PubMed]
  6. Florin, R. The distribution of conifer and taxad genera in time and space. Ann. De Geogr. 1964, 73, 712–713. [Google Scholar]
  7. Buschiazzo, E.; Ritland, C.; Bohlmann, J.K.R. Slow but not low: Genomic comparisons reveal slower evolutionary rate and higher dN/dS in conifers compared to angiosperms. BMC Evol. Biol. 2012, 12. [Google Scholar] [CrossRef]
  8. De La Torre, A.R.; Birol, I.; Bousquet, J.; Ingvarsson, P.K.; Jansson, S.; Jones, S.J.; Keeling, C.I.; MacKay, J.; Nilsson, O.; Ritland, K.; et al. Insights into conifer giga-genomes. Plant Physiol. 2014, 166, 1724–1732. [Google Scholar] [CrossRef]
  9. Prunier, J.; Verta, J.P.; MacKay, J.J. Conifer genomics and adaptation: At the crossroads of genetic diversity and genome function. New Phytol. 2016, 209, 44–62. [Google Scholar] [CrossRef]
  10. Wright, J. Species crossability in spruce in relation to distribution and taxonomy. For. Sci 1955, 30. [Google Scholar]
  11. Lockwood, J.D.; Aleksic, J.M.; Zou, J.; Wang, J.; Liu, J.; Renner, S.S. A new phylogeny for the genus Picea from plastid, mitochondrial, and nuclear sequences. Mol. Phylogenet. Evol. 2013, 69, 717–727. [Google Scholar] [CrossRef]
  12. OECD. Section 5—Sitka Spruce (PICEA SITCHENSIS (BONG.) CARR.). OECD Publishing: Paris, France, 2006. [Google Scholar]
  13. Critchfield, W.B. Impact of the Pleistocene on the genetic structure of North American conifers. In Proceedings of the Proceedings of the 8th North American Forest Biology Workshop, Utah State University, Logan, UT, USA, 30 July–1 August 1984; pp. 70–118. [Google Scholar]
  14. Galeano, E.; Bousquet, J.; Thomas, B.R. SNP-based analysis reveals unexpected features of genetic diversity, parental contributions and pollen contamination in a white spruce breeding program. Sci. Rep. 2021, 11, 4990. [Google Scholar] [CrossRef]
  15. Korecky, J.; Cepl, J.; Stejskal, J.; Faltinova, Z.; Dvorak, J.; Lstiburek, M.; El-Kassaby, Y.A. Genetic diversity of Norway spruce ecotypes assessed by GBS-derived SNPs. Sci. Rep. 2021, 11. [Google Scholar] [CrossRef] [PubMed]
  16. Rasheed, A.; Hao, Y.; Xia, X.; Khan, A.; Xu, Y.; Varshney, R.K.; He, Z. Crop breeding chips and genotyping platforms: Progress, challenges, and perspectives. Mol Plant 2017, 10, 1047–1064. [Google Scholar] [CrossRef] [PubMed] [Green Version]
  17. Pereira-Dias, L.; Vilanova, S.; Fita, A.; Prohens, J.; Rodriguez-Burruezo, A. Genetic diversity, population structure, and relationships in a collection of pepper (Capsicum spp.) landraces from the Spanish centre of diversity revealed by genotyping-by-sequencing (GBS). Hortic. Res. 2019, 6, 54. [Google Scholar] [CrossRef] [PubMed]
  18. O’Driscoll, J. Sitka Spruce International Ten Provenance Experiment. Available online: https://www.fao.org/3/l1807e/L1807E06.htm (accessed on 14 April 2022).
  19. O’Driscoll, J. Sitka Spruce, its distribution and genetic variation. Ir. For. 1977, 2, 11. [Google Scholar]
  20. O’Driscoll, J. Working Plan for International Ten Provenance Experiment; Forest and Wildlife Service: Dublin, Ireland, 1972. [Google Scholar]
  21. Van de Sype, H.; Roman-Amat, B. Genetic Variability of Sitka Spruce of the IUFRO Collection; IUFRO: Montreal, QC, Canada, 1990; p. 1. [Google Scholar]
  22. King, J.; Alfaro, R.; Cartwright, C. Genetic resistance of Sitka spruce (Picea sitchensis) populations to the white pine weevil (Pissodes strobi): Distribution of resistance. Forestry 2004, 77, 7. [Google Scholar] [CrossRef]
  23. Parra-Salazar, A.; Gomez, J.; Lozano-Arce, D.; Reyes-Herrera, P.H.; Duitama, J. Robust and efficient software for reference-free genomic diversity analysis of genotyping-by-sequencing data on diploid and polyploid species. Mol. Ecol. Resour. 2022, 22, 439–454. [Google Scholar] [CrossRef]
  24. Elshire, R.J.; Glaubitz, J.C.; Sun, Q.; Poland, J.A.; Kawamoto, K.; Buckler, E.S.; Mitchell, S.E. A robust, simple genotyping-by-sequencing (GBS) approach for high diversity species. PLoS ONE 2011, 6, e19379. [Google Scholar] [CrossRef]
  25. Gagalova, K.K.; Warren, R.L.; Coombe, L.; Wong, J.; Nip, K.M.; Yuen, M.M.S.; Whitehill, J.G.A.; Celedon, J.M.; Ritland, C.; Taylor, G.A.; et al. Spruce giga-genomes: Structurally similar yet distinctive with differentially expanding gene families and rapidly evolving genes. Plant J. 2022, 111, 1469–1485. [Google Scholar] [CrossRef]
  26. Li, H.; Durbin, R. Fast and accurate short read alignment with Burrows-Wheeler transform. Bioinformatics 2009, 25, 1754–1760. [Google Scholar] [CrossRef]
  27. Li, H.; Handsaker, B.; Wysoker, A.; Fennell, T.; Ruan, J.; Homer, N.; Marth, G.; Abecasis, G.; Durbin, R.; Genome Project Data Processing, S. The Sequence Alignment/Map format and SAMtools. Bioinformatics 2009, 25, 2078–2079. [Google Scholar] [CrossRef] [PubMed]
  28. Danecek, P.; Auton, A.; Abecasis, G.; Albers, C.A.; Banks, E.; DePristo, M.A.; Handsaker, R.E.; Lunter, G.; Marth, G.T.; Sherry, S.T. The variant call format and VCFtools. Bioinformatics 2011, 27, 2156–2158. [Google Scholar] [CrossRef]
  29. Jombart, T. Adegenet: A R package for the multivariate analysis of genetic markers. Bioinformatics 2008, 24, 1403–1405. [Google Scholar] [CrossRef] [PubMed]
  30. Jombart, T.; Ahmed, I. Adegenet 1.3-1: New tools for the analysis of genome-wide SNP data. Bioinformatics 2011, 27, 3070–3071. [Google Scholar] [CrossRef] [PubMed] [Green Version]
  31. de Meeus, T.; Goudet, J. A step-by-step tutorial to use HierFstat to analyse populations hierarchically structured at multiple levels. Infect Genet Evol 2007, 7, 731–735. [Google Scholar] [CrossRef]
  32. Kamvar, Z.N.; Tabima, J.F.; Grunwald, N.J. Poppr: An R package for genetic analysis of populations with clonal, partially clonal, and/or sexual reproduction. PeerJ 2014, 2, e281. [Google Scholar] [CrossRef] [PubMed]
  33. Miller, J.M.; Cullingham, C.I.; Peery, R.M. The influence of a priori grouping on inference of genetic clusters: Simulation study and literature review of the DAPC method. Hered. (Edinb) 2020, 125, 269–280. [Google Scholar] [CrossRef]
  34. Highton, R. The relationship between the number of loci and the statistical support for the topology of UPGMA trees obtained from genetic distance data. Mol. Phylogenet. Evol. 1993, 2, 337–343. [Google Scholar] [CrossRef]
  35. Weir, B.S.; Cockerham, C.C. Estimating F-Statistics for the analysis of population structure. Evolution 1984, 38, 1358–1370. [Google Scholar] [CrossRef]
  36. Alexander, D.H.; Lange, K. Enhancements to the ADMIXTURE algorithm for individual ancestry estimation. BMC Bioinform. 2011, 12, 246. [Google Scholar] [CrossRef]
  37. Yu, G. Scatterpie: Scatter Pie Plot. Available online: https://CRAN.R-project.org/package=scatterpie (accessed on 14 April 2022).
  38. Wickham, H. ggplot2: Elegant Graphics for Data Analysis; Springer: New York, NY, USA, 2016. [Google Scholar]
  39. South, S. Rnaturalearth: World Map Data from Natural Earth. Available online: https://github.com/ropensci/rnaturalearth (accessed on 14 April 2022).
  40. He, J.; Zhao, X.; Laroche, A.; Lu, Z.X.; Liu, H.; Li, Z. Genotyping-by-sequencing (GBS), an ultimate marker-assisted selection (MAS) tool to accelerate plant breeding. Front. Plant Sci. 2014, 5, 484. [Google Scholar] [CrossRef] [PubMed]
  41. Wang, N.; Yuan, Y.; Wang, H.; Yu, D.; Liu, Y.; Zhang, A.; Gowda, M.; Nair, S.K.; Hao, Z.; Lu, Y.; et al. Applications of genotyping-by-sequencing (GBS) in maize genetics and breeding. Sci. Rep. 2020, 10, 16308. [Google Scholar] [CrossRef] [PubMed]
  42. O’Leary, S.J.; Puritz, J.B.; Willis, S.C.; Hollenbeck, C.M.; Portnoy, D.S. These aren’t the loci you’e looking for: Principles of effective SNP filtering for molecular ecologists (vol 27, pg 3193, 2018). Mol. Ecol. 2019, 28, 3459. [Google Scholar] [CrossRef]
  43. Veeckman, E.; Van Glabeke, S.; Haegeman, A.; Muylle, H.; van Parijs, F.R.D.; Byrne, S.L.; Asp, T.; Studer, B.; Rohde, A.; Roldan-Ruiz, I.; et al. Overcoming challenges in variant calling: Exploring sequence diversity in candidate genes for plant development in perennial ryegrass (Lolium perenne). DNA Res. 2019, 26, 1–12. [Google Scholar] [CrossRef] [Green Version]
  44. Pavy, N.; Namroud, M.C.; Gagnon, F.; Isabel, N.; Bousquet, J. The heterogeneous levels of linkage disequilibrium in white spruce genes and comparative analysis with other conifers. Heredity 2012, 108, 273–284. [Google Scholar] [CrossRef]
  45. Qu, J.; Kachman, S.D.; Garrick, D.; Fernando, R.L.; Cheng, H. Exact distribution of linkage disequilibrium in the presence of mutation, selection, or minor allele frequency filtering. Front. Genet. 2020, 11, 362. [Google Scholar] [CrossRef]
  46. Chen, B.W.; Cole, J.W.; Grond-Ginsbach, C. Departure from Hardy Weinberg Equilibrium and Genotyping Error. Front. Genet. 2017, 8, 167. [Google Scholar] [CrossRef]
  47. Pavan, S.; Delvento, C.; Ricciardi, L.; Lotti, C.; Ciani, E.; D’Agostino, N. Recommendations for Choosing the Genotyping Method and Best Practices for Quality Control in Crop Genome-Wide Association Studies. Front. Genet. 2020, 11, 447. [Google Scholar] [CrossRef]
  48. Blanco-Pastor, J.L.; Barre, P.; Keep, T.; Ledauphin, T.; Escobar-Gutierrez, A.; Roschanski, A.M.; Willner, E.; Dehmer, K.J.; Hegarty, M.; Muylle, H. Canonical correlations reveal adaptive loci and phenotypic responses to climate in perennial ryegrass. Mol. Ecol. Resour. 2021, 21, 849–870. [Google Scholar] [CrossRef]
  49. De La Torre, A.R.; Wilhite, B.; Neale, D.B. Environmental Genome-Wide Association Reveals Climate Adaptation Is Shaped by Subtle to Moderate Allele Frequency Shifts in Loblolly Pine. Genome Biol. Evol. 2019, 11, 2976–2989. [Google Scholar] [CrossRef]
  50. A’Hara, S.W.; Cottrell, J.E. A set of microsatellite markers for use in Sitka spruce (Picea sitchensis) developed from Picea glauca ESTs. Mol. Ecol. Notes 2004, 4, 4. [Google Scholar] [CrossRef]
  51. Hamilton, J.A.; Lexer, C.; Aitken, S.N. Differential introgression reveals candidate genes for selection across a spruce (Picea sitchensis x P. glauca) hybrid zone. New Phytol. 2013, 197, 927–938. [Google Scholar] [CrossRef] [PubMed]
  52. Holliday, J.A.; Suren, H.; Aitken, S.N. Divergent selection and heterogeneous migration rates across the range of Sitka spruce (Picea sitchensis). Proc. Biol. Sci. 2012, 279, 1675–1683. [Google Scholar] [CrossRef] [PubMed]
  53. Holliday, J.A.; Ritland, K.; Aitken, S.N. Widespread, ecologically relevant genetic markers developed from association mapping of climate-related traits in Sitka spruce (Picea sitchensis). New Phytol. 2010, 188, 501–514. [Google Scholar] [CrossRef] [PubMed]
  54. Chen, X.; Sun, X.; Dong, L.; Zhang, S. Mating patterns and pollen dispersal in a Japanese larch (Larix kaempferi) clonal seed orchard: A case study. Sci. China Life Sci. 2018, 61, 1011–1023. [Google Scholar] [CrossRef] [PubMed]
  55. Ebrahimi, A.; Lawson, S.S.; Frank, G.S.; Coggeshall, M.V.; Woeste, K.E.; McKenna, J.R. Pollen flow and paternity in an isolated and non-isolated black walnut (Juglans nigra L.) timber seed orchard. PLoS ONE 2018, 13, e0207861. [Google Scholar] [CrossRef]
  56. O’Connell, L.M.; Mosseler, A.; Rajora, O.P. Extensive long-distance pollen dispersal in a fragmented landscape maintains genetic diversity in white spruce. J. Hered. 2007, 98, 640–645. [Google Scholar] [CrossRef]
  57. Farris, D.W.H.; Haeussler, P.J. Selected geologic maps of the Kodiak batholith and other Paleocene intrusive rocks, Kodiak Island, Alaska. US Geol. Surv. Sci. Investig. Map 2020, 3441, 10. [Google Scholar] [CrossRef]
  58. Menounos, B.; Goehring, B.M.; Osborn, G.; Margold, M.; Ward, B.; Bond, J.; Clarke, G.K.C.; Clague, J.J.; Lakeman, T.; Koch, J.; et al. Cordilleran Ice Sheet mass loss preceded climate reversals near the Pleistocene Termination. Science 2017, 358, 781–784. [Google Scholar] [CrossRef] [Green Version]
  59. Haro, H. Animating the Temporal Progression of Cordilleran Deglaciation and Vegetation Succession in the Pacific Northwest during the late Quaternary Period. In Proceedings of the Western Cedar, Western Washington University, Belligham, DC, USA, 17 May 2017. [Google Scholar]
Figure 1. Origins of Sitka in the IUFRO population. The main population in the database is the IUFRO population, which consists of trees planted from seed collected in locations marked.
Forests 13 01511 g001
Figure 2. Genetic structure of the Sitka spruce IUFRO population. All 19 distinct geographic regions are represented here. (A) Principal component analysis (PCA) performed with adegenet, using 1400 principal components. (B) Discriminate analysis of principal components (DAPC) supervised clustering (with geographic regions as prior) performed with adegenet, using 20 principal components and 6 discriminate analyses.
Forests 13 01511 g002aForests 13 01511 g002b
Figure 3. Isolation by distance of the Sitka spruce population. (A) Pairwise Fst values for each provenance have been plotted against geographic distance (km). (B) Pairwise Fst for each geographic region.
Forests 13 01511 g003aForests 13 01511 g003b
Figure 4. Genetic clustering of geographic regions. Tree was constructed by using pairwise genetic distance between loci, using the UPGMA method, which employed Nei’s genetic distance. Numbers above branches represent bootstrap values (100 replicates).
Forests 13 01511 g004
Figure 5. Genetic admixture of all 19 geographic regions of the IUFRO population for 11 ancestral populations. Optimal K (ancestral populations) for admixture is 11 based on 10 replicates of K 2-50, using a cross-validation method. Each geographic region is represented here, showing the ancestral makeup of the population.
Forests 13 01511 g005
Figure 6. Geographic depiction of admixture of all 80 provenances of the IUFRO population for eleven ancestral populations. Optimal K (ancestral populations) for admixture is eleven based on 10 replicates of K 2-50. The map shows the largest extent of the Cordilleran ice sheet at the extent of the Pleistocene glaciation 18,500 year ago (ya). Arrows represent key areas of frontal glacial retreat starting in coastal areas. (A) Represents the northern expanse of the range with admixture from Kodiak Island recolonizing the range. (B) Representation of Haida Gwaii recolonizing the mainland. (C) Southern expanses of the range showing admixture after the retreat of the Cordilleran ice sheet.
Forests 13 01511 g006
Table 1. Summary of the genetic diversity and differentiation of the IUFRO population.
DefinitionOverall
HoObserved Heterozygosity0.21
HsWithin Population Gene Diversity0.198
HtOverall Gene Diversity0.204
DstGene Diversity among samples0.006
FstFixation index0.029
FisInbreeding Coefficient0
Dest *Population Differentiation0.0078
Gst **Population Differentiation0.0284
Notes: * Jost (2008), ** Hamrick and Godt’s (1989).
Table 2. Differentiation and diversity statistics of the geographic regions within the IUFRO population.
Geographic RegionsHoHeFstAllelic Richness
California0.180.180.1171.180
Central Oregon0.170.170.1621.171
Coastal British Columbia0.230.21−0.0211.209
Haida Gwaii0.190.190.0911.186
Kodiak Island0.240.180.086NA
Lower Naas Rivers0.220.21−0.0281.21
Lower Skeena River0.230.21−0.0321.211
Middle Skeena River0.230.22−0.0551.216
Montague Island0.190.180.1081.182
North Alaska0.220.21−0.0251.209
North Oregon0.230.20.0031.204
Olympic Peninsula0.20.190.0721.19
South Alaska0.20.190.0501.194
South Oregon0.180.180.1281.178
Upper Naas Rivers0.230.23−0.1171.228
Upper Skeena River0.240.22−0.0791.22
Vancouver Island0.210.20.0281.199
Washington0.20.190.0741.189
Washington Straits0.220.20.0101.202
Publisher’s Note: MDPI stays neutral with regard to jurisdictional claims in published maps and institutional affiliations.

