Article

Litter Decomposition of Qinghai Spruce (Picea crassifolia) Is Dependent on Mn Concentration in the Qilian Mountains, Northwest China

State Key Laboratory of Grassland Agro-Ecosystems, College of Pastoral Agriculture Science and Technology, Lanzhou University, Lanzhou 730020, China
*
Author to whom correspondence should be addressed.
Forests 2022, 13(9), 1418; https://doi.org/10.3390/f13091418
Submission received: 3 August 2022 / Revised: 29 August 2022 / Accepted: 31 August 2022 / Published: 3 September 2022
(This article belongs to the Special Issue Trace Elements Biogeochemical Cycling in Forests Ecosystem)

Abstract

:
The factors determining litter decomposition incorporated into C and nutrient cycles were examined as part of a broader study investigating the biogeochemical cycle in forest ecosystems. Litter was collected from five altitudes of Qinghai spruce (Picea crassifolia) woodland stands in the Qilian Mountains and placed in litterbags. These litterbags were installed at the crown center (CC) and crown edge (CE) at different altitudes in Qinghai spruce forests during the growing season to study the effect of litter substrate quality on litter decomposition. Results indicate that at varying altitudes in the growing season, the initial mass loss rate and initial decomposition rate of Qinghai spruce litter showed a nonlinear relationship with altitude. The Olson exponential regression equation showed that the decomposition coefficient (k) was the largest at 3050 m (k = 0.709), and the decomposition coefficient (k) was the smallest at 3250 m (k = 0.476). Meanwhile, the initial decomposition rate was highly correlated with initial litter Ca and Mn concentrations. At the CC and CE at different altitudes in the growing season, the initial mass loss rate of CE was significantly higher than that of CC (p < 0.01), and the initial decomposition rate of CE was markedly faster than that of CC (p < 0.01). The Olson exponential regression equation showed that CE’s decomposition coefficients (k) were larger than those of CC. The initial decomposition rate of CE was highly correlated with initial litter C and Mn concentrations. However, the initial decomposition rate at CC was independent of the litter substrate quality. Finally, we realize that litter decomposition in the early stages is not ultimately determined by a single common factor, but rather the result of multiple factors working together in different orders and strengths. The results lay a foundation for understanding the process and mechanism of litter decomposition in the alpine mountain forest ecosystem and further understanding the structure and function of the ecosystem.

1. Introduction

With the intensification of environmental changes such as global warming and nitrogen (N) deposition, the forest ecological, vegetation community, species composition, and the stoichiometry of plants themselves have changed significantly, resulting in the corresponding changes in the quantity and quality of litter input [1,2]. This breaks the balance between ecosystem carbon (C) input–loss and significantly affects the ecosystem C and nutrient cycle processes [3,4,5]. However, research shows that under a given site and climate conditions, litter decomposition is related primarily to the initial properties (i.e., chemical and physical) of the litter [6,7]. The litter properties that affect litter decomposition are often referred to as litter substrate quality. However, this concept can be subdivided into three categories, (i) C sources, (ii) nutrients, and (iii) “modifiers” (i.e., heavy metals) [8,9].
Litter is the general name for organic matter produced by the withering and falling of plant roots, stems, leaves, flowers, fruits, and other parts after the completion of metabolic activities [10]. Forests, grasslands, wetlands, and other ecosystems contain a large amount of litter. Compared with other vegetation types, the amount of litter produced by forests is huge, and mainly leaf litter (accounting for about 51.4%–65.1%) [10,11]. Litter decomposition has usually been related to the main nutrients such as N and phosphorus (P), both of which were considered to limit the microbial decomposition of litter [12]. Other elements, such as kalium (K), are also important factors affecting microbial reproductive and metabolic activities [13]. In the late stage of decomposition, with the consumption of more easily degradable carbohydrates, the C-source of litter may change, and lignin degradation dominates the decomposition process [14,15]. Therefore, the limiting factors may also change with the higher N concentrations, inhibiting the formation of the ligninase system in many white-rot fungi [16]. As a cofactor in the synthesis of the lignin-degrading enzyme, manganese (Mn) has a relatively close relationship between its content and lignin degradation in the late stage of litter decomposition [9,17]. Consequently, in addition to the former (i, ii) “litter substrate quality” study, we should also focus on the latter field [18]. This has not been reported in the study of the Qilian Mountains area in the past.
As a tall mountain range in Northwest China, the Qilian Mountains play a critical and irreplaceable role in regional climate regulation, water conservation, and biodiversity conservation [19]. Qinghai spruce (Picea crassifolia) is a constructive arbor species and dominant species in the Qilian Mountains area (accounts for approximately 76% of forests in the Qilian Mountains), forming a stable top community [19,20]. Its leaf litter decomposition is an important process of the C and nutrient cycles in the Qilian Mountains forests ecosystem. The effects of leaf litter composition, soil physical and chemical properties, and ecological environment change on its decomposition have attracted researchers’ attention [19,21]. However, there is a lack of research on the relationship between trace elements and litter decomposition. For this purpose, we collected leaf litter of fresh fallen from Qinghai spruce woodland at five altitudes in the Qilian Mountains, thus obtaining samples that varied in chemical components, and incubated all collected fallen leaves in situ in the field.

2. Materials and Methods

2.1. Site Description

The Qilian Mountains are located in the intersection zone of the Tibetan, Mengxin, and Loess Plateaus [20]. Our study was carried out in the small Tianlaochi catchment (36°20′–38°26′ N, 95°45′–101°03′ E) in the Sidalong nature reserve of Qilian Mountains National Park. It has an area of ~12.8 km2 and an altitude of 2600–4450 m. The annual average temperature is 0.6 °C, and the extreme maximum temperature is 12.1 °C and generally occurs in July. The extreme minimum temperature is –13.1 °C and usually occurs in January. The annual average precipitation is 326–539 mm, and the seasonal distribution of rainfall is uneven; rainfall is mainly concentrated from May to September of the year, accounting for 84.2% of the annual precipitation. In the study area, the temperature decreases with the increase in altitude. For every 100 m increase in altitude, the temperature decreases by ~0.58 °C, and the precipitation increases with the increase in altitude. The annual average potential evaporation is 1066 m, the annual average number of sunshine hours is 1892.6 h, and the annual average relative humidity is 59%. The site is characterized by a typical continental alpine and semi-humid mountain climate. The climatic characteristics are short and humid in summer (May to September) and long and cold in winter (October to May next year) [22]. In this area, the soil types mainly include mountain gray cinnamon soil, mountain gray calcium soil, and subalpine meadow soil. The forest is mainly a natural secondary forest, with dense shrubs, providing a good habitat for wildlife. The forest coverage rate is about 65%. The main trees are Qinghai spruce and Qilian juniper (Juniperus przewalskii); the shrubs are mainly Potentilla fruticosa, Caragana jubata, Salix gilashanica, etc.; and the herbs are mainly Elymus nutans, Caum cari, Poa pratensis, etc. Qinghai spruce forest accounts for 25.39% of the land area in the study area and is distributed on the north slope at an altitude of 2600–3540 m [20,23]. It is mainly the moss Qinghai spruce forest community. Under the forest, a moss layer is developed. The moss layer and litter form a thick ground cover layer, which is a typical feature of the Qinghai spruce forest ecosystem in the Qilian Mountains [19]. Five sample plots are arranged along the altitude in Qinghai spruce forest in the study area. In the sample plots, the canopy closure is 0.42–0.76, the litter thickness is 2.06–4.94 cm, the soil bulk density is 0.28–0.43 g·cm−3, the soil porosity is 40.43–66.79%, and the pH is 6.87–7.83 [24]. See Figure 1 for the specific information on the sample plots.

2.2. Sample Collection and Preparation

In early May 2021, Qinghai spruce leaf litter was collected from 5 altitude sample sites (i.e., 2850 m, 2950 m, 3050 m, 3150 m, and 3250 m). Litter was collected using five collectors per site installed 1 m above ground level. All sample sites were predominantly Qinghai spruce woodlands.
Litterbags were constructed from nylon mesh fabric measuring 15 cm × 15 cm, with 1 mm mesh on the upper and lower surface to allow access by fungal hyphae in the soil but also to prevent loss of sample material [25]. Each litterbag was filled with 15 g oven-dried (85 °C) to constant weight whole Qinghai spruce leaf litter. A total of 120 litterbags were designed (5 altitudes × 2 crown positions × 3 replicates × 4 times of sampling).
In each of the original 5 altitude sample sites, six subplots (1 m × 1 m) were randomly set as the sampling area of this experiment. Each altitude study sample site was divided into crown edge (CE) and crown center (CC) sample areas according to the crown position. On 15 May 2021, the prepared litterbag was placed flat on the site where the vegetation and other substances on the soil surface had been removed, and the litterbag was fixed with toothpicks. The initial characteristics of litter are shown in Table 1.

2.3. Processing Litterbags

The first sampling was conducted in mid-June 2021, and then samples were collected once a month. By mid-September 2021, a total of 4 samples were collected (June–September represents the growing season), and 3 litterbags were taken from each sample plot each time. The collected samples of litterbags were put into sterile polyethylene self-sealing bags that had been sterilized at a high temperature and placed in a refrigerator for temporary storage. After the return to the laboratory, the visible residues (plants and soil animals) outside the litterbags were immediately removed and put into the oven (35 °C) for 2 days. Then, the litterbag was carefully cut, and the Qinghai spruce leaf litter was poured out and placed on clean white paper. Tweezers were used to carefully remove other invading residues from the sample. The remaining Qinghai spruce leaf litter was placed in an envelope bag and placed in an oven (85 °C) for 2 days. After 2 days, the litterbag was immediately taken out from the oven and weighed (±0.001 g).

2.4. Chemical Analysis

The initial Qinghai spruce leaf litter from 5 altitude sample plots was dried (85 °C), crushed, and sieved (100 mesh). The element analyzer EA3000 (Milan, Italy) was used to analyze the concentration of C and N. Then, the litter samples were digested (3 h, 20~25 °C) with sulfuric acid [26]. A Perkin Elmer 4300DV ICP-OES (Milan, Italy) was used to analyze the concentration of P, Ca, and Mn. Finally, lignin was analyzed by acid-detergent fiber digestion [27].

2.5. Data Analysis

According to the weight of continuous sampling, the litter mass loss rate (L,%) is calculated as follows [19]:
L = M 0     M t M 0 × 100 %  
The decomposition rate (D, g·day−1) is calculated according to the following formula [19]:
D = M 0     M t t  
The formula for litter mass remaining rate (R,%) [28] is as follows:
R = M t M 0 × 100 %  
where L represents litter loss rate (%), D represents litter decomposition rate (g·day−1), R represents litter remaining rate (%), Mt represents the remaining litter dry mass in litterbag at the t-th sampling (g), M0 represents the initial litter dry mass (g), and t is the time interval between sampling and setting out.
The Olson index model is commonly used for litter decomposition rate [29], and the formula is as follows:
y = a e k t  
where y represents the litter remaining rate (%), k represents the decomposition coefficient, a represents the fitting parameter, and t represents the litter decomposition time (days).
Decomposition half-life (50% decomposition):
t 0.5 =   ln 0.5 / ( k )  
Decomposition turnover period (95% decomposition):
t 0.95 = ln 0.05 / ( k )  

2.6. Statistical Analysis

Excel 2019 was used for data storage and statistics, and R version 4.1.0 (Ross Ihaka and Robert Gentleman, University of Auckland, New Zealand) was used to perform parametric tests on the data; data that did not conform to the normal distribution and the homogeneity of variance test were converted. R version 4.1.0 was used for drawing, all data in tables and figures were expressed as mean ± standard error, and significant differences were expressed with different capital and lowercase letters. Then, correlation analysis, one-way ANOVA, and multi-comparisons were performed using R version 4.1.0.

3. Results

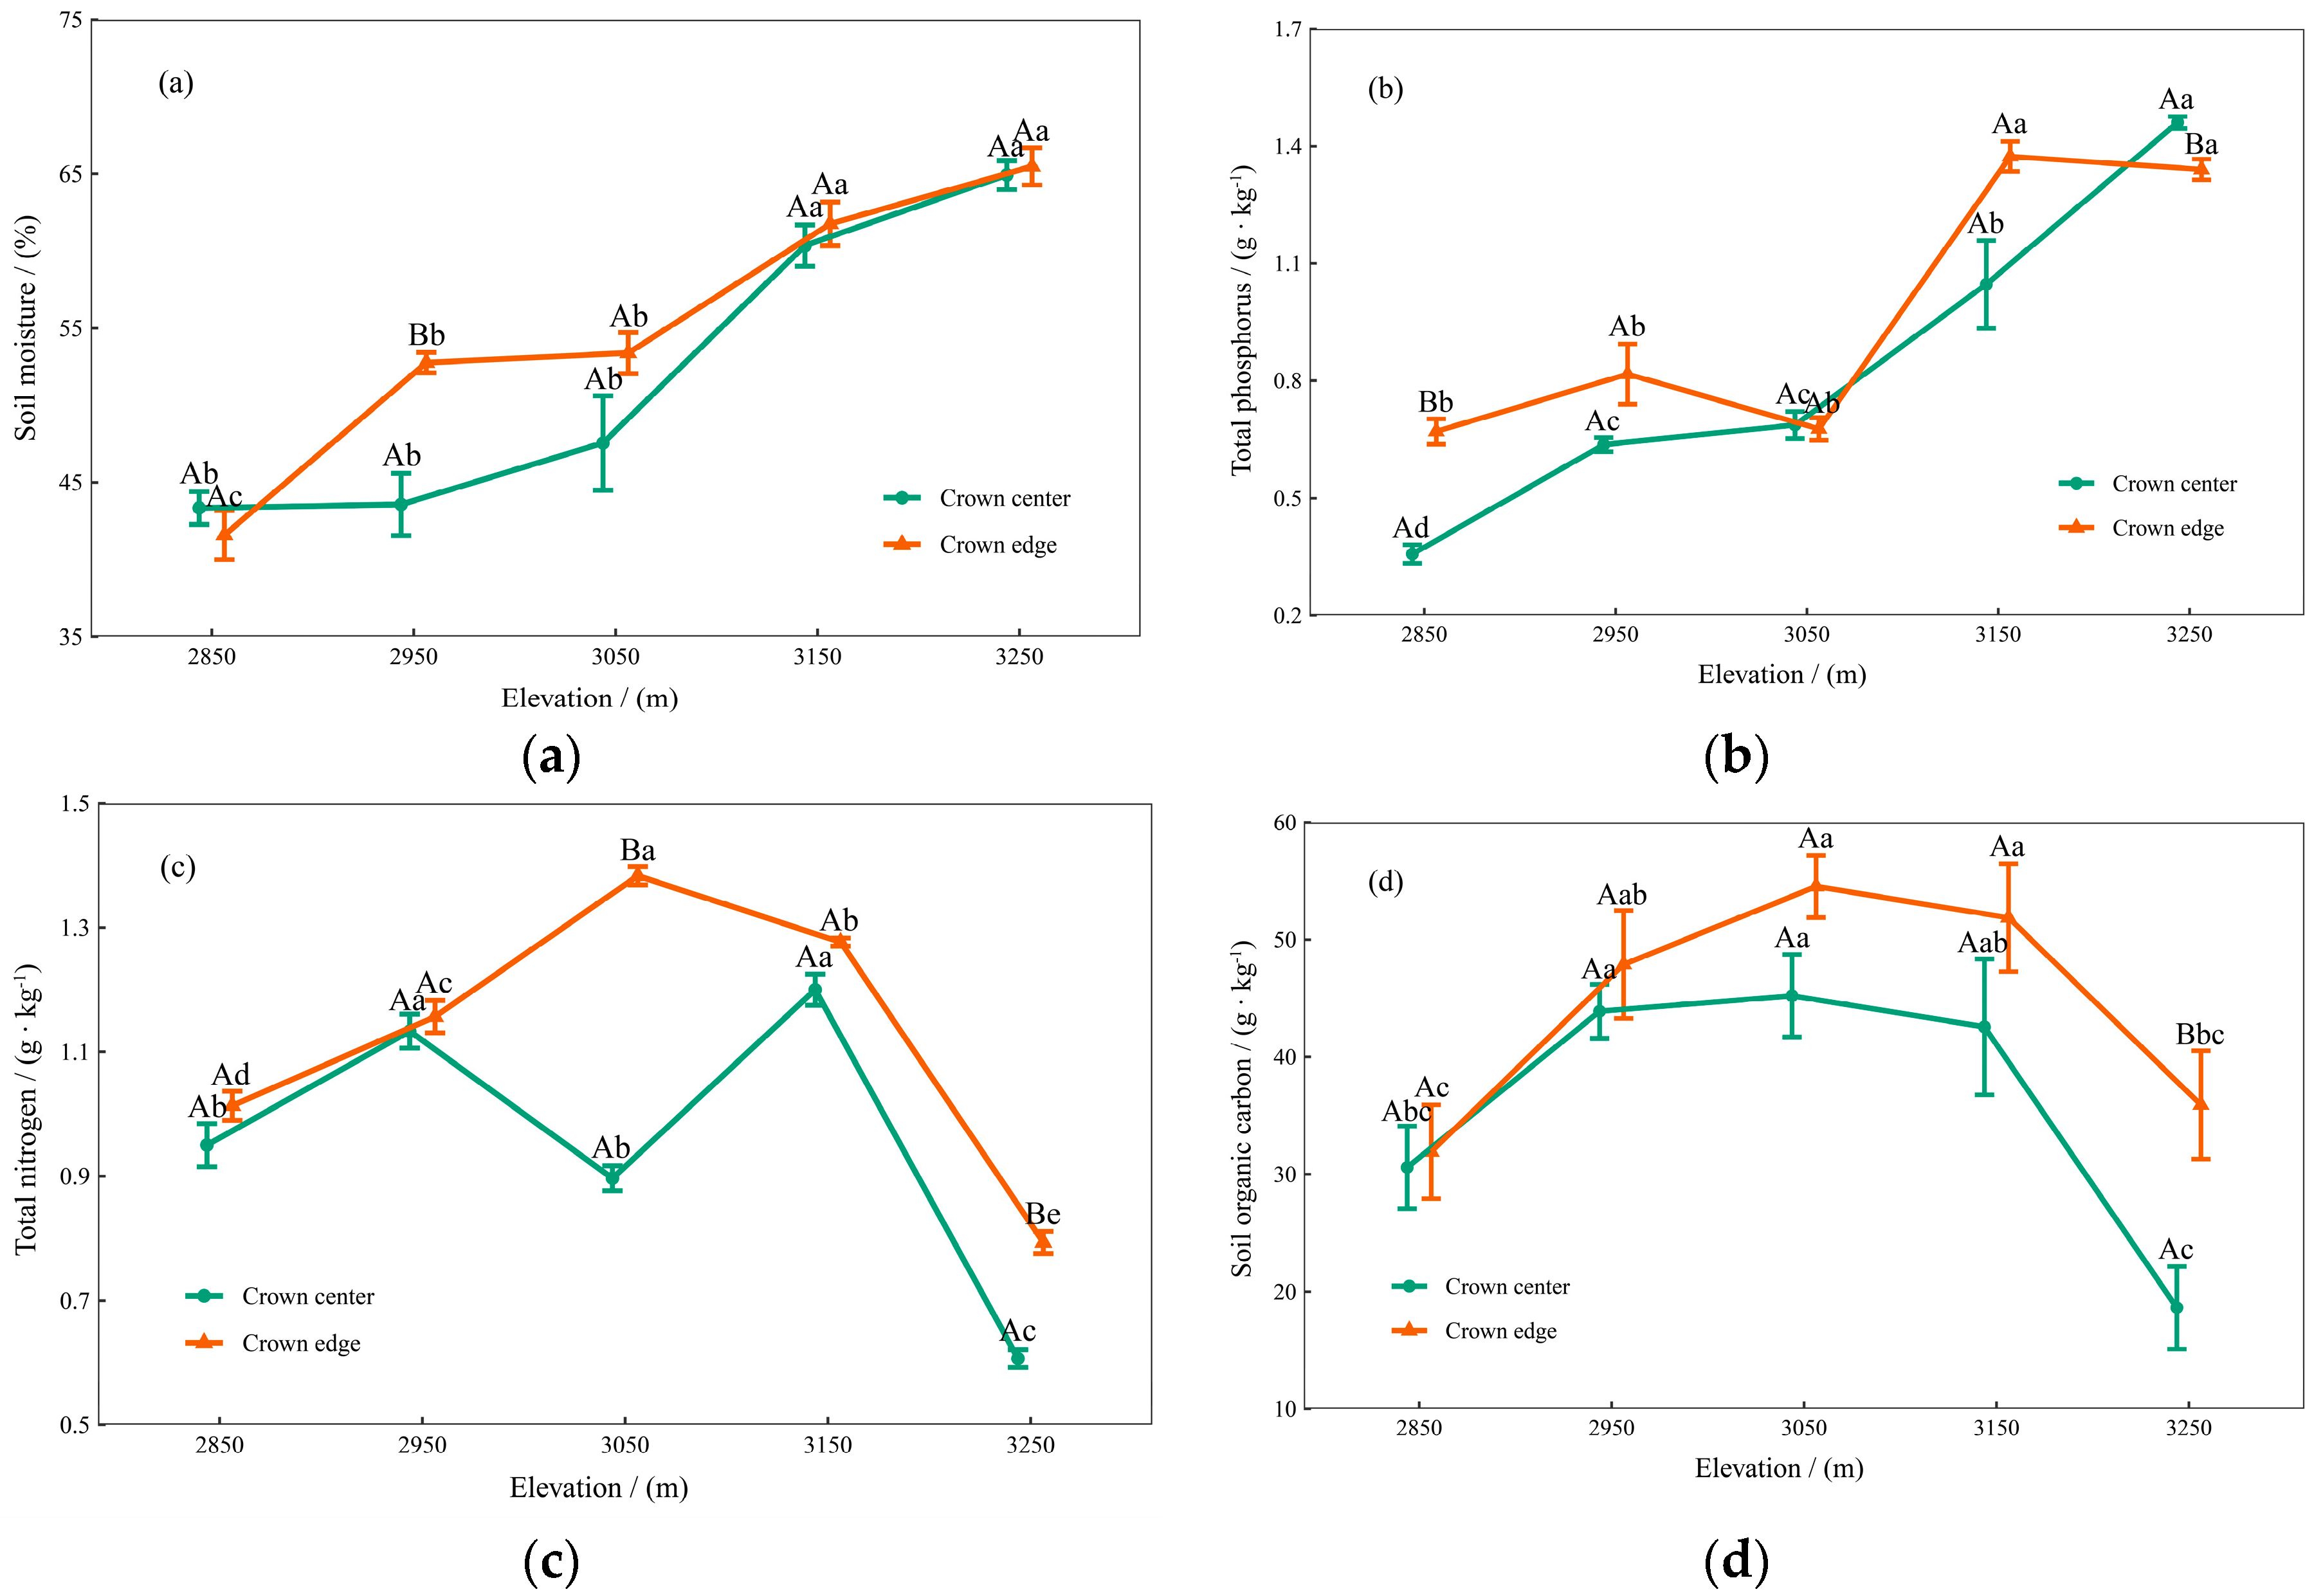
3.1. Soil Physical and Chemical Properties

The results of the soil’s physical and chemical properties showed that, in general, soil moisture (SM) and total phosphorus (TP) increased with the increase in altitude (Figure 1a,b), total nitrogen (TN) and soil organic carbon (SOC) showed a trend of “first increase–then decrease” with the increase in altitude (Figure 1c,d), and CE was higher than CC (Figure 1).

3.2. Initial Chemical Composition of Qinghai Spruce Leaf Litter

Ca concentration ranged between 6.49 and 9.31 mg·g−1, with site 3250 m having the lowest (6.49 mg·g−1) and 3050 m having the highest (9.31 mg·g−1) (Table 1). The initial litter Mn concentration was 0.73~2.37 mg·g−1, with site 3250 m having the lowest (0.73 mg·g−1). The highest litter Mn concentration (2.37 mg·g−1) was found at site 3050 m. Similarly, N concentrations were also inconsistent between sites, with concentrations ranging between 10.17 and 13.16 mg·g−1. Litter from site 3250 m possessed a very low N concentration (10.17 mg·g−1). Sites with high N concentrations were 3050 m (13.16 mg·g−1) and 3150 m (12.96 mg·g−1). However, contrary to Ca, Mn, and N, the initial litter P concentration ranged between 1.20 and 1.39 mg·g−1. The litter from the 3050 m (1.20 mg·g−1) and 3150 m (1.22 mg·g−1) sites possessed the lowest P concentrations. Sites with high P concentrations were 3250 m (1.39 mg·g−1), 2850 m (1.36 mg·g−1), and 2950 m (1.31 mg·g−1). The initial litter C concentrations ranged between 503.40 and 520.48 mg·g−1. The litter with the lowest C concentration came from site 3050 m (503.40 mg·g−1), and the highest from 3250 m (520.48 mg·g−1) and 3150 m (518.24 mg·g−1). Lignin concentration increased slowly with the increase in altitude, ranging from 274.38 mg·g−1 (2850 m) to 312.69 mg·g−1 (3250 m). There was a wide range for the C/N ratio (38.27–51.26) in the initial litter, with sites 3050 m (38.27) and 3150 m (39.98) having the lowest. The highest litter eco-stoichiometric ratio C/N (51.26) was found at site 3250 m. The litter eco-stoichiometric ratio C/P ranged between 375.54 and 423.87, with site 3250 m having the lowest (375.54) and 3150 m having the highest (423.87). The litter eco-stoichiometric ratio lignin/N ranged between 22.50 and 30.77, with site 3050 m having the lowest (22.50) and 3250 m having the highest (30.77).
There were clear relationships between the initial chemical components when values from all sites were cross-correlated (Figure 2). The initial litter N concentration covaried negatively with P (p < 0.01) but positively with Ca and Mn concentrations (p < 0.001). The initial litter Ca concentration covaried negatively with P (p < 0.001) but positively with Mn concentration (p < 0.001). The initial litter Mn concentration covaried negatively with P (p < 0.01). The initial litter C concentration covaried positively with P concentration (p < 0.05).

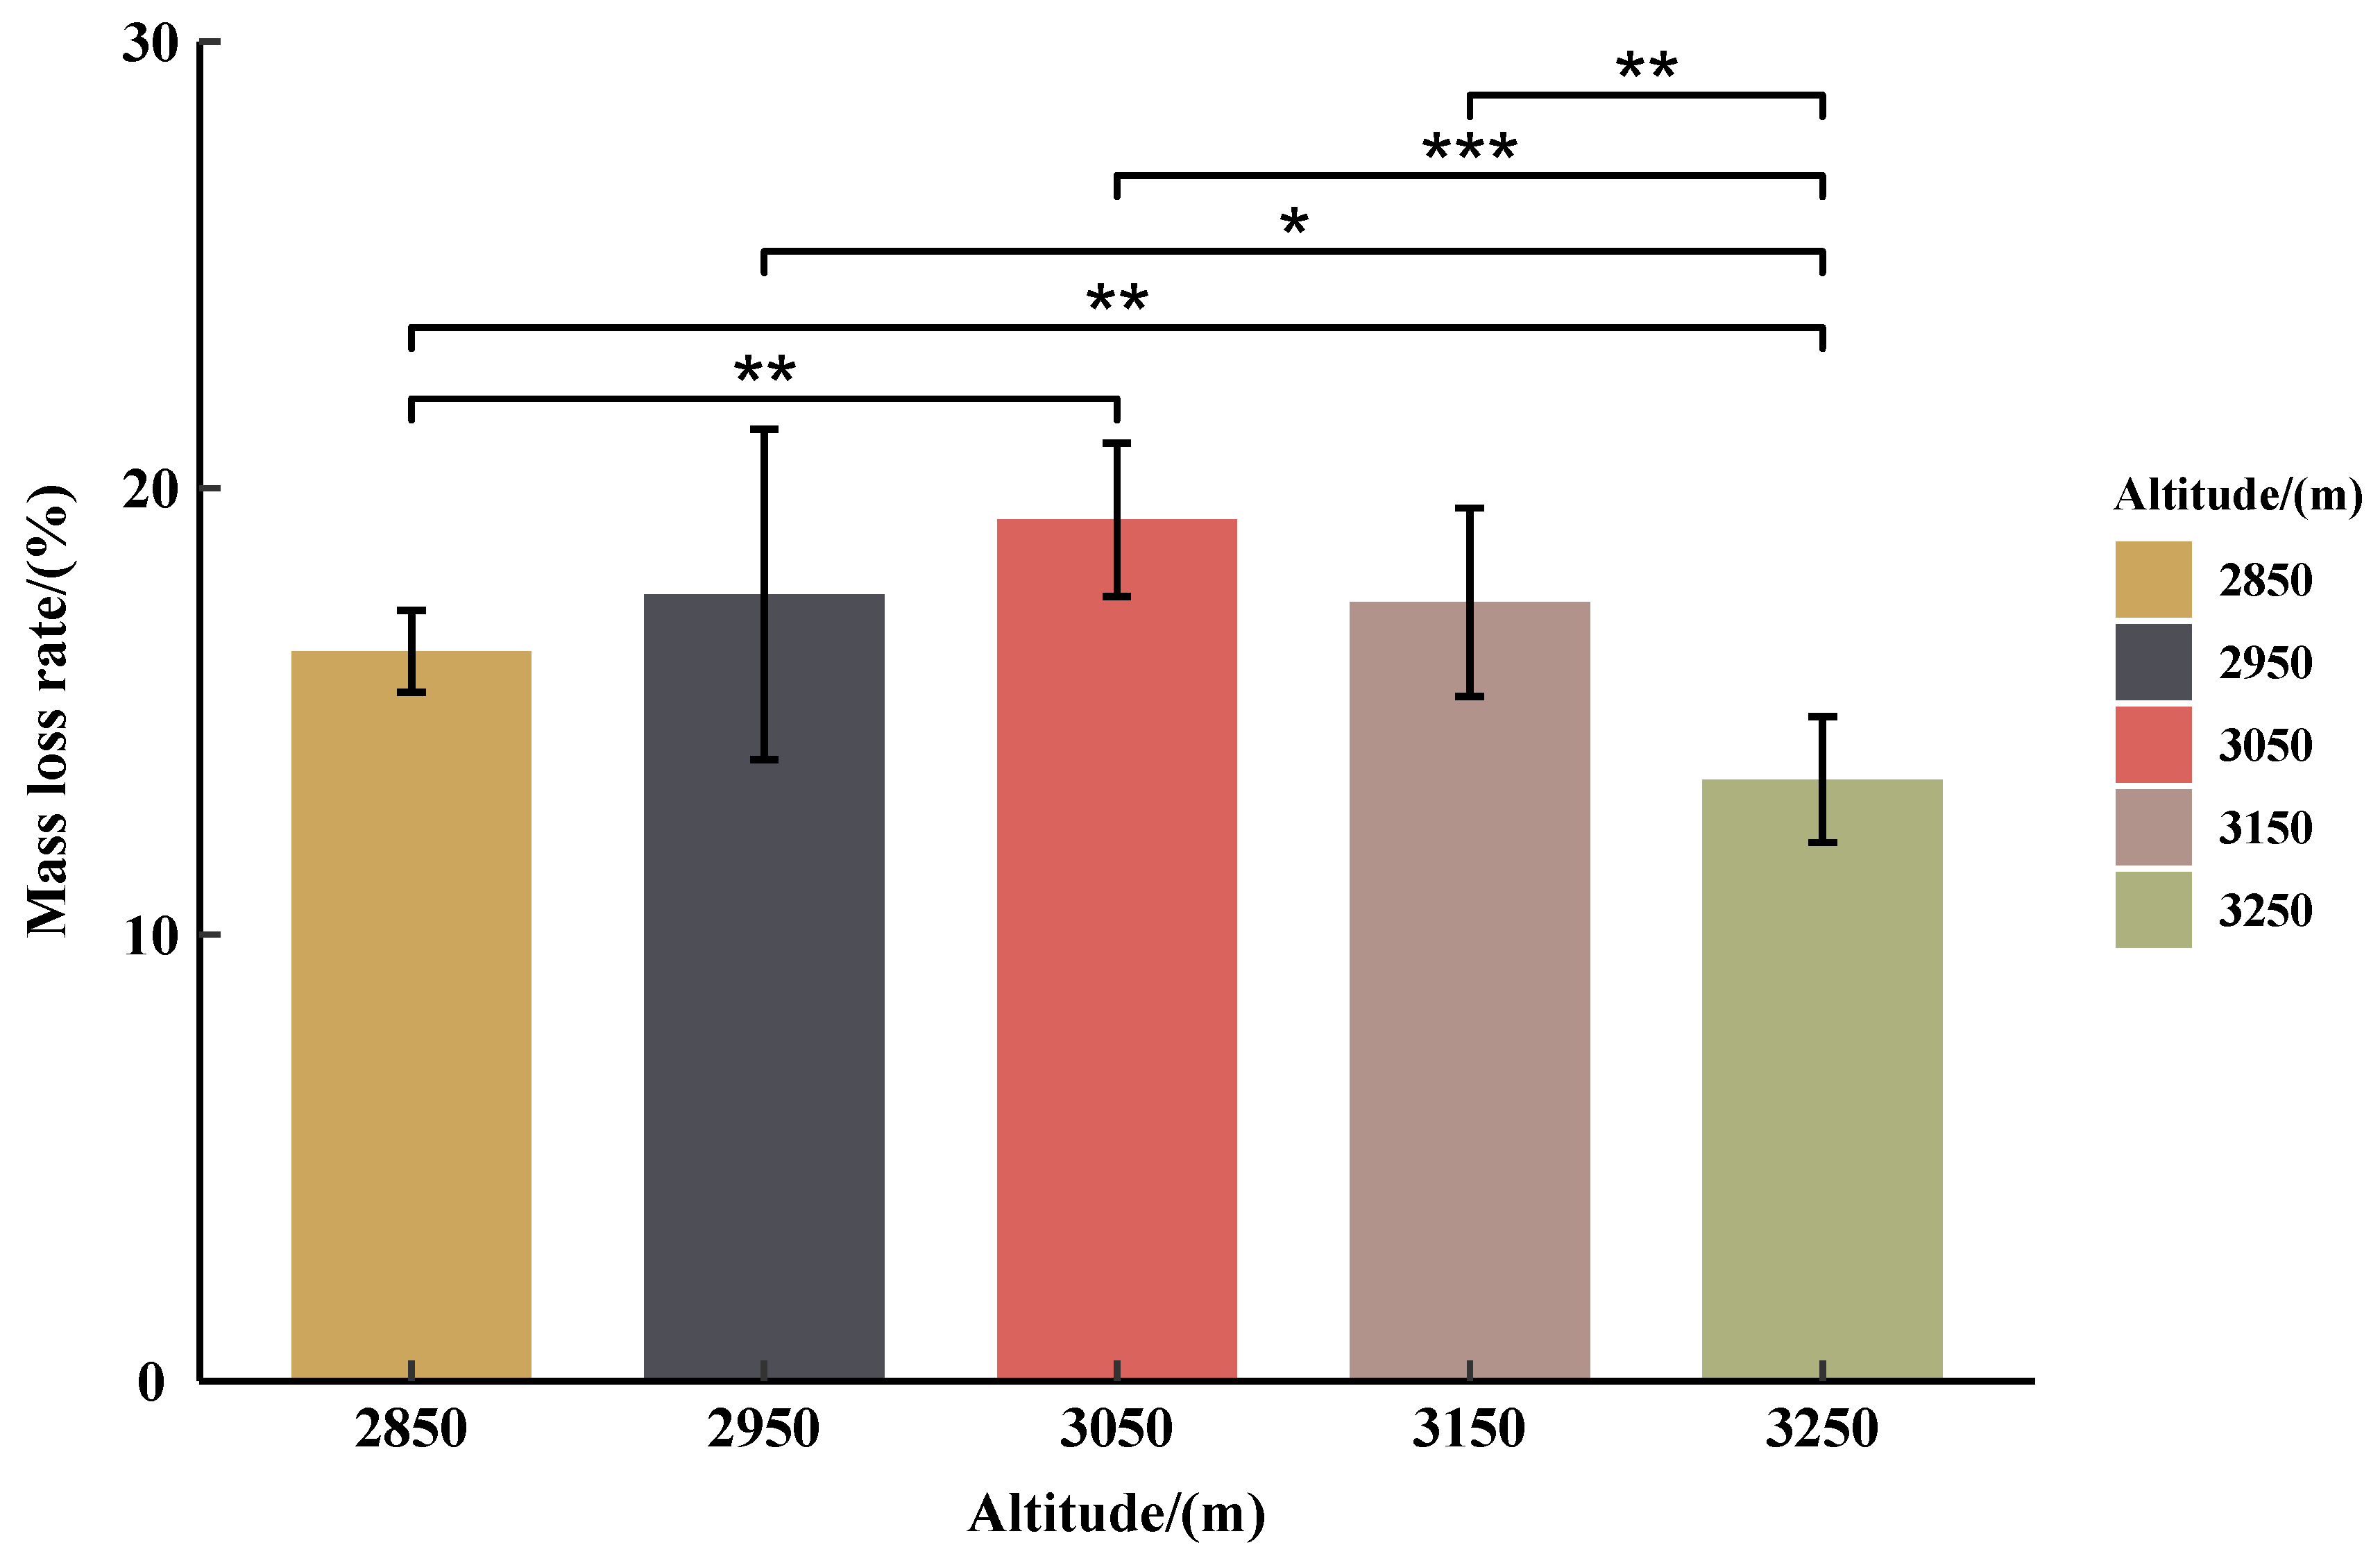
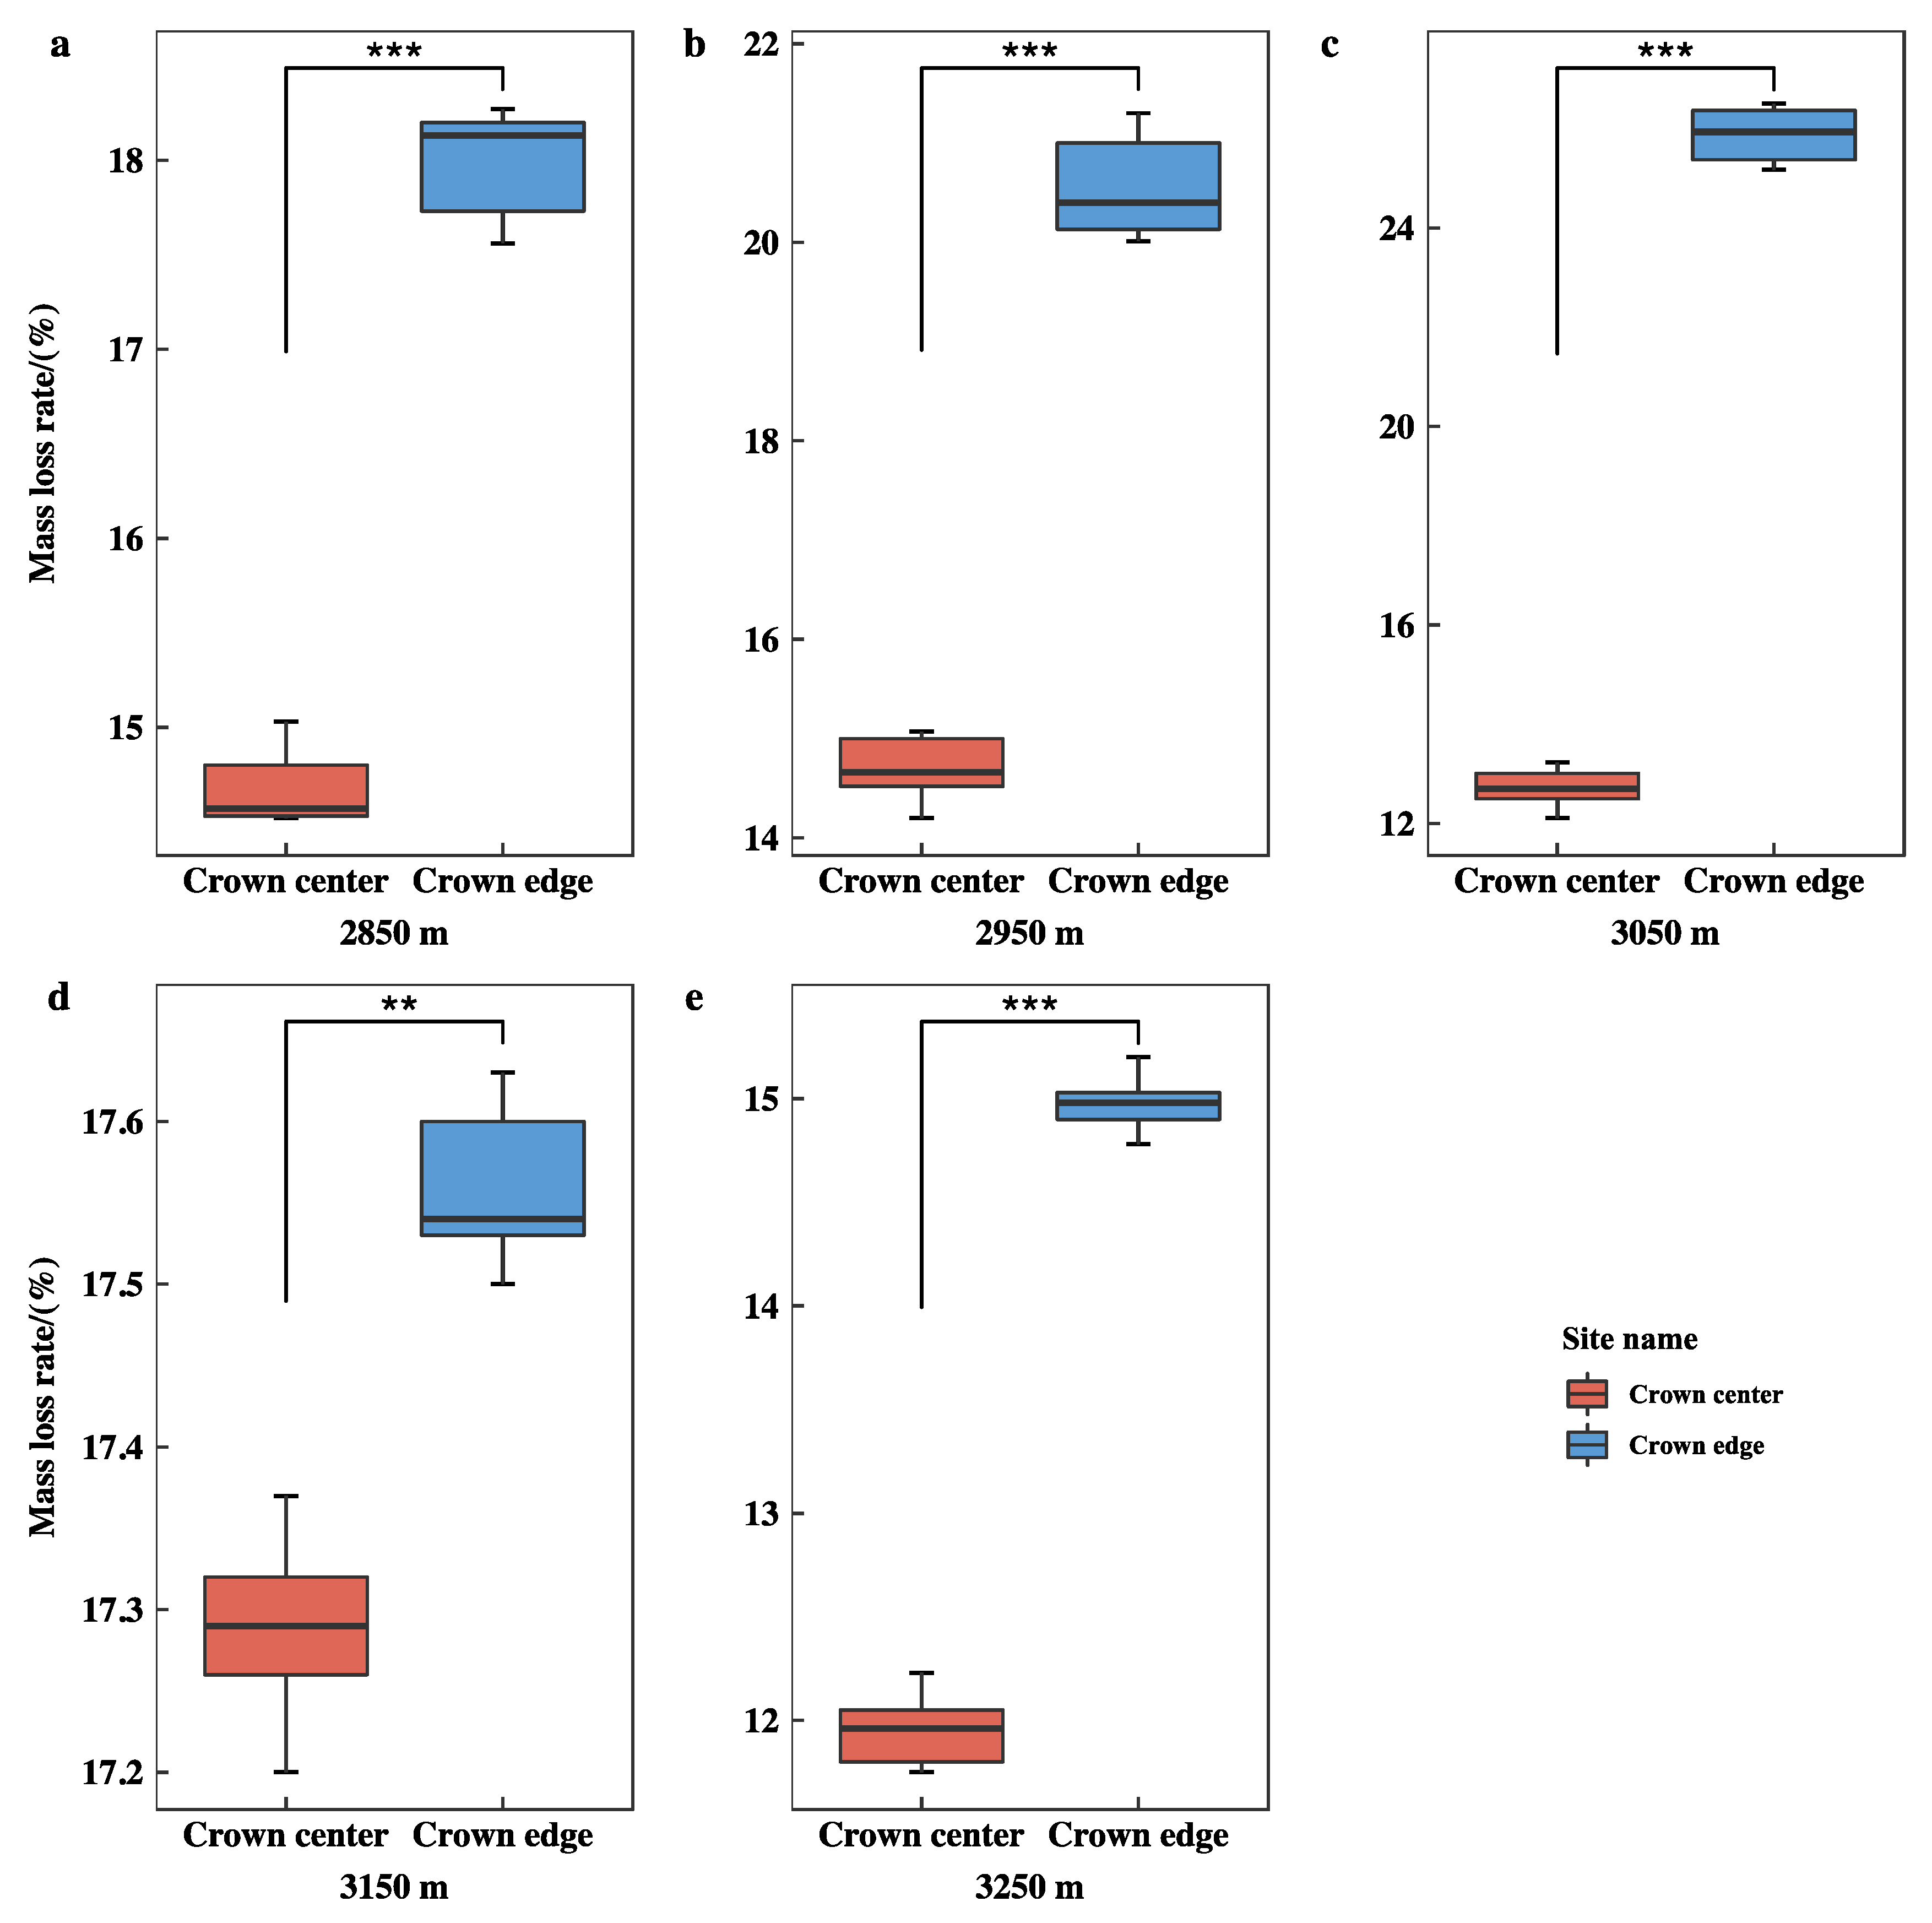
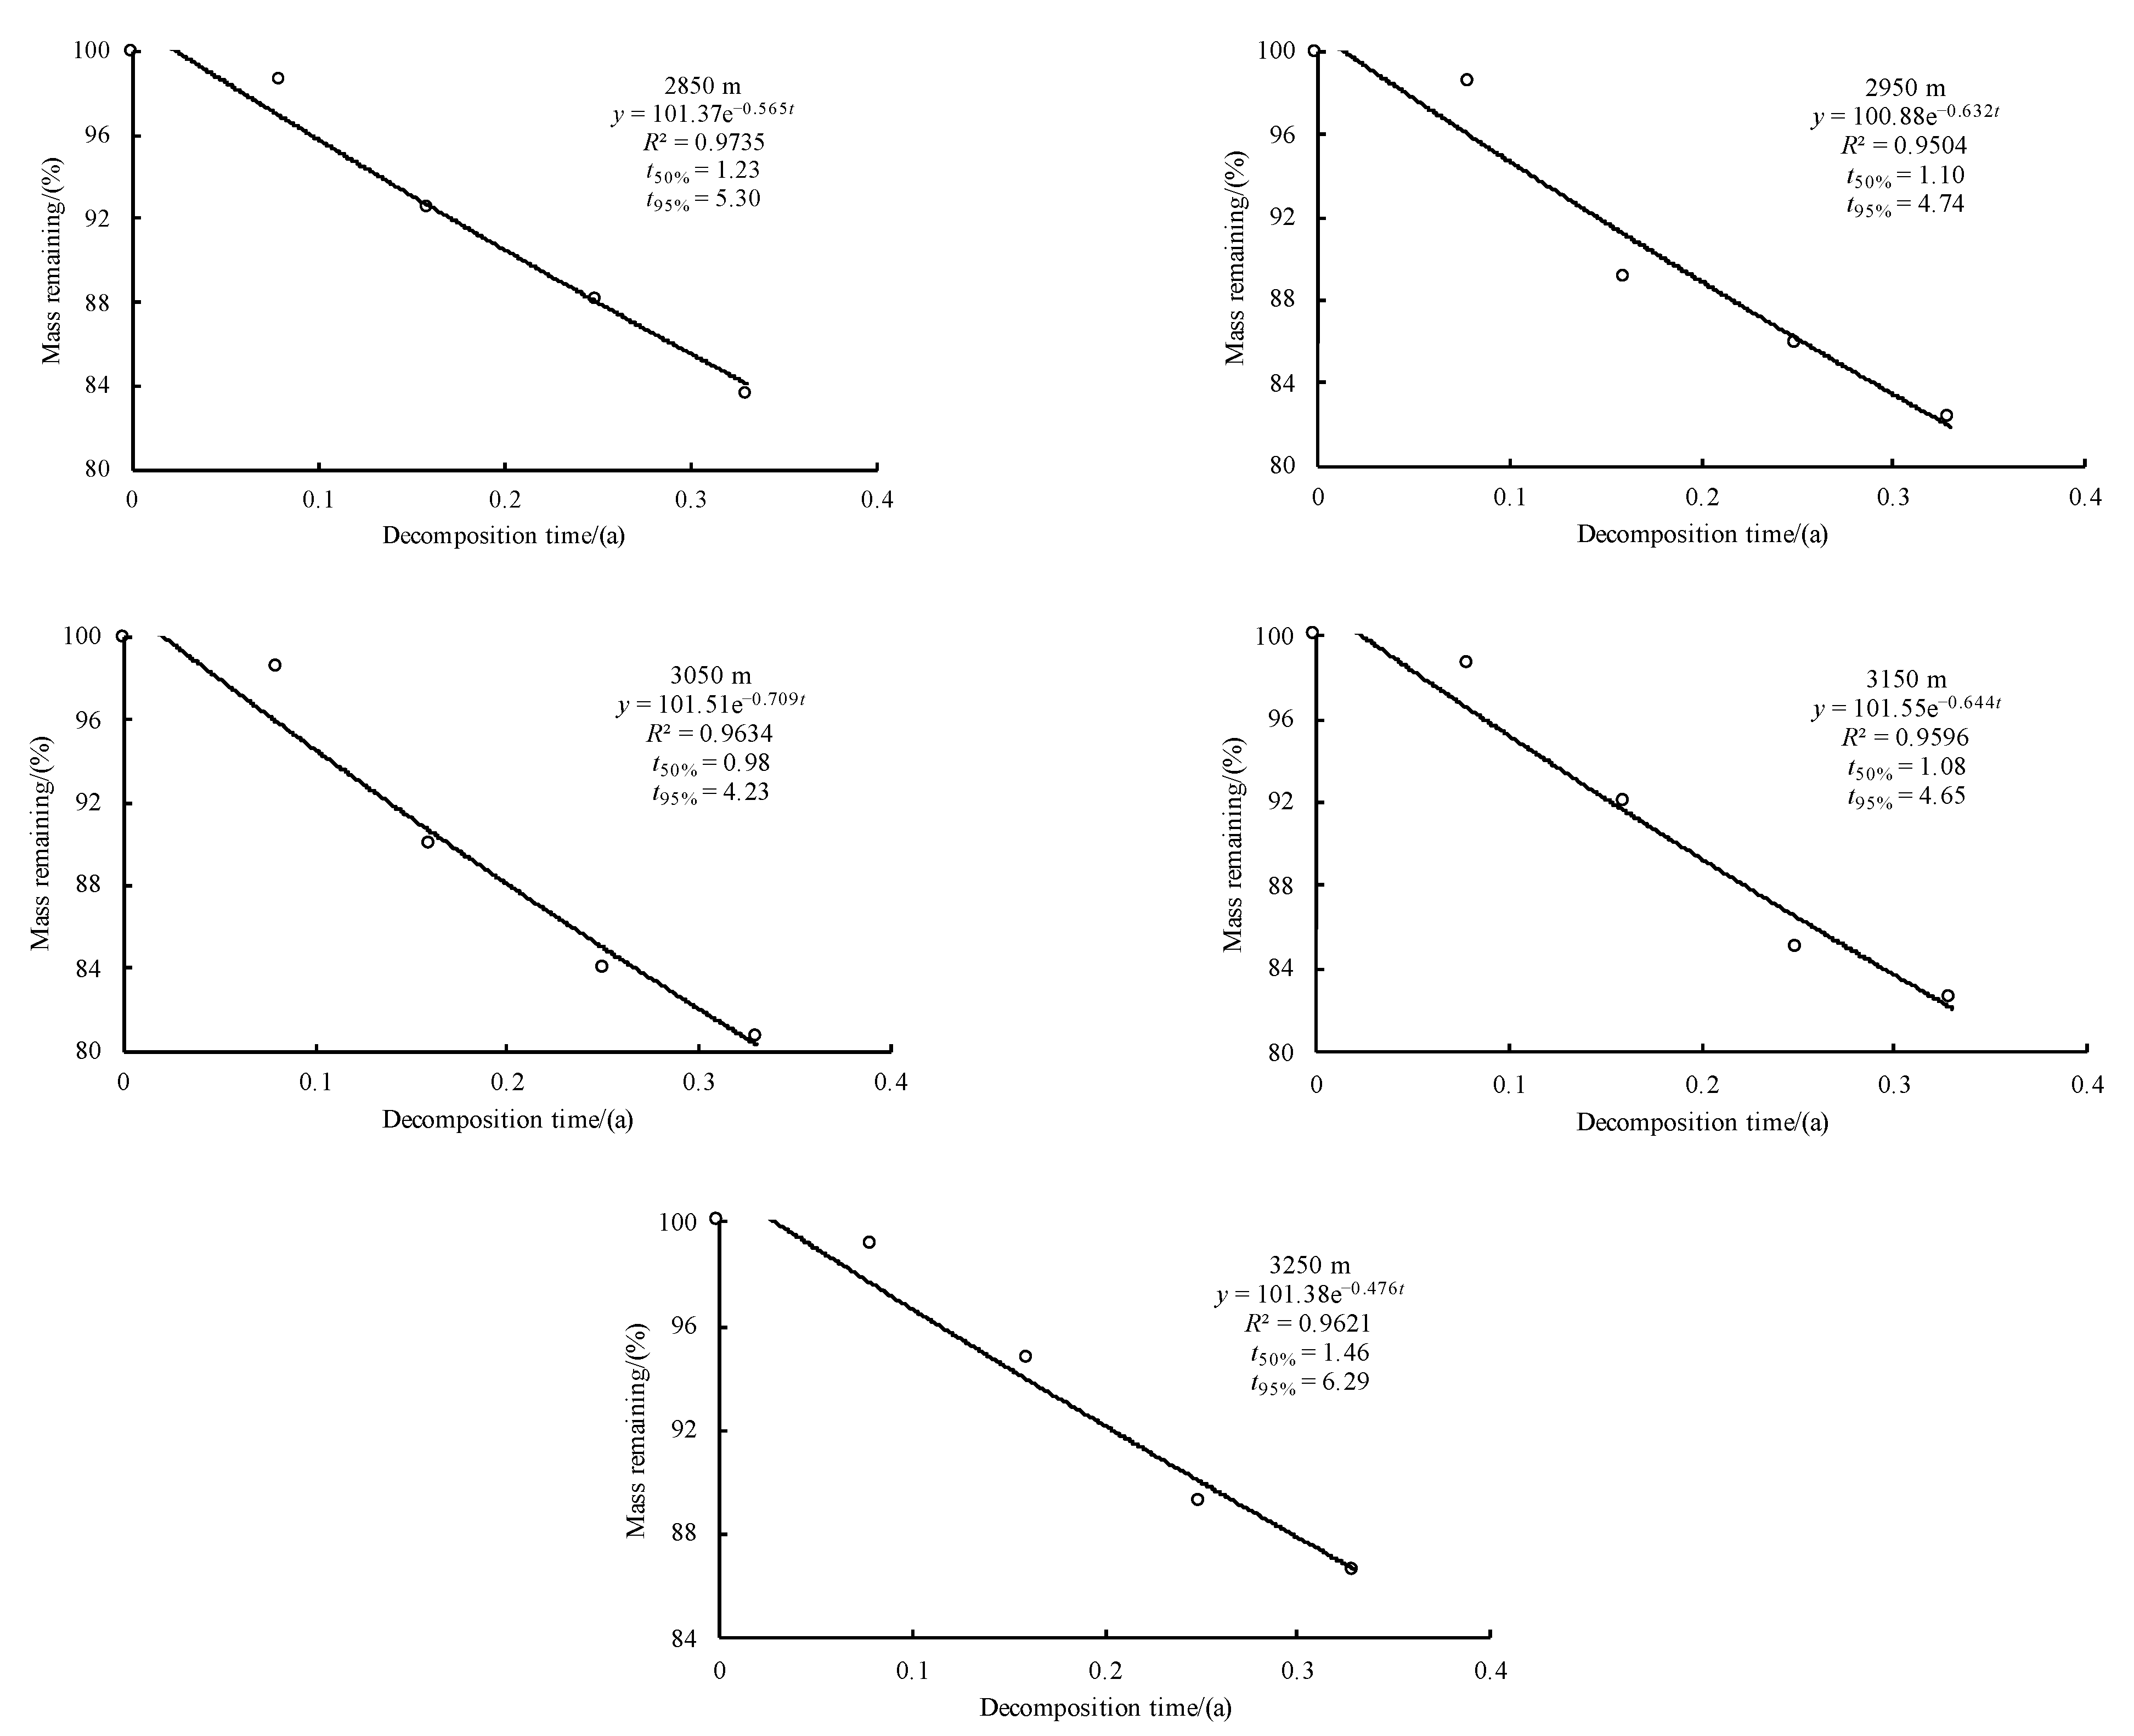
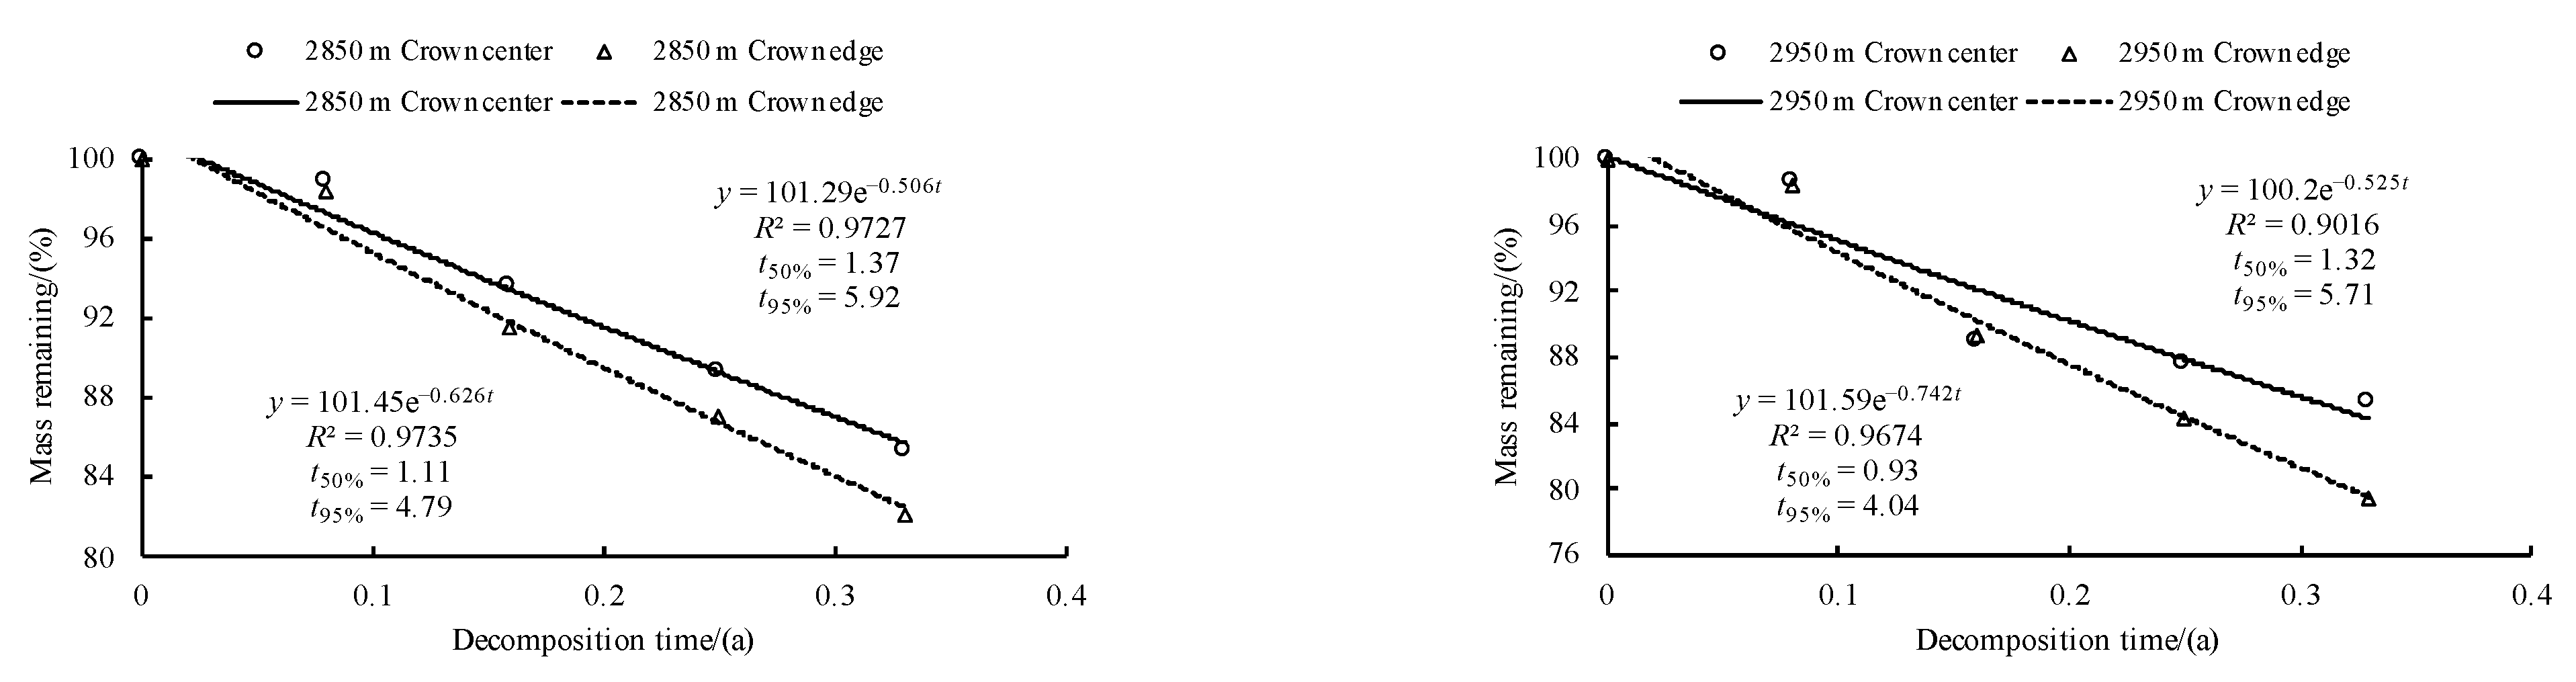
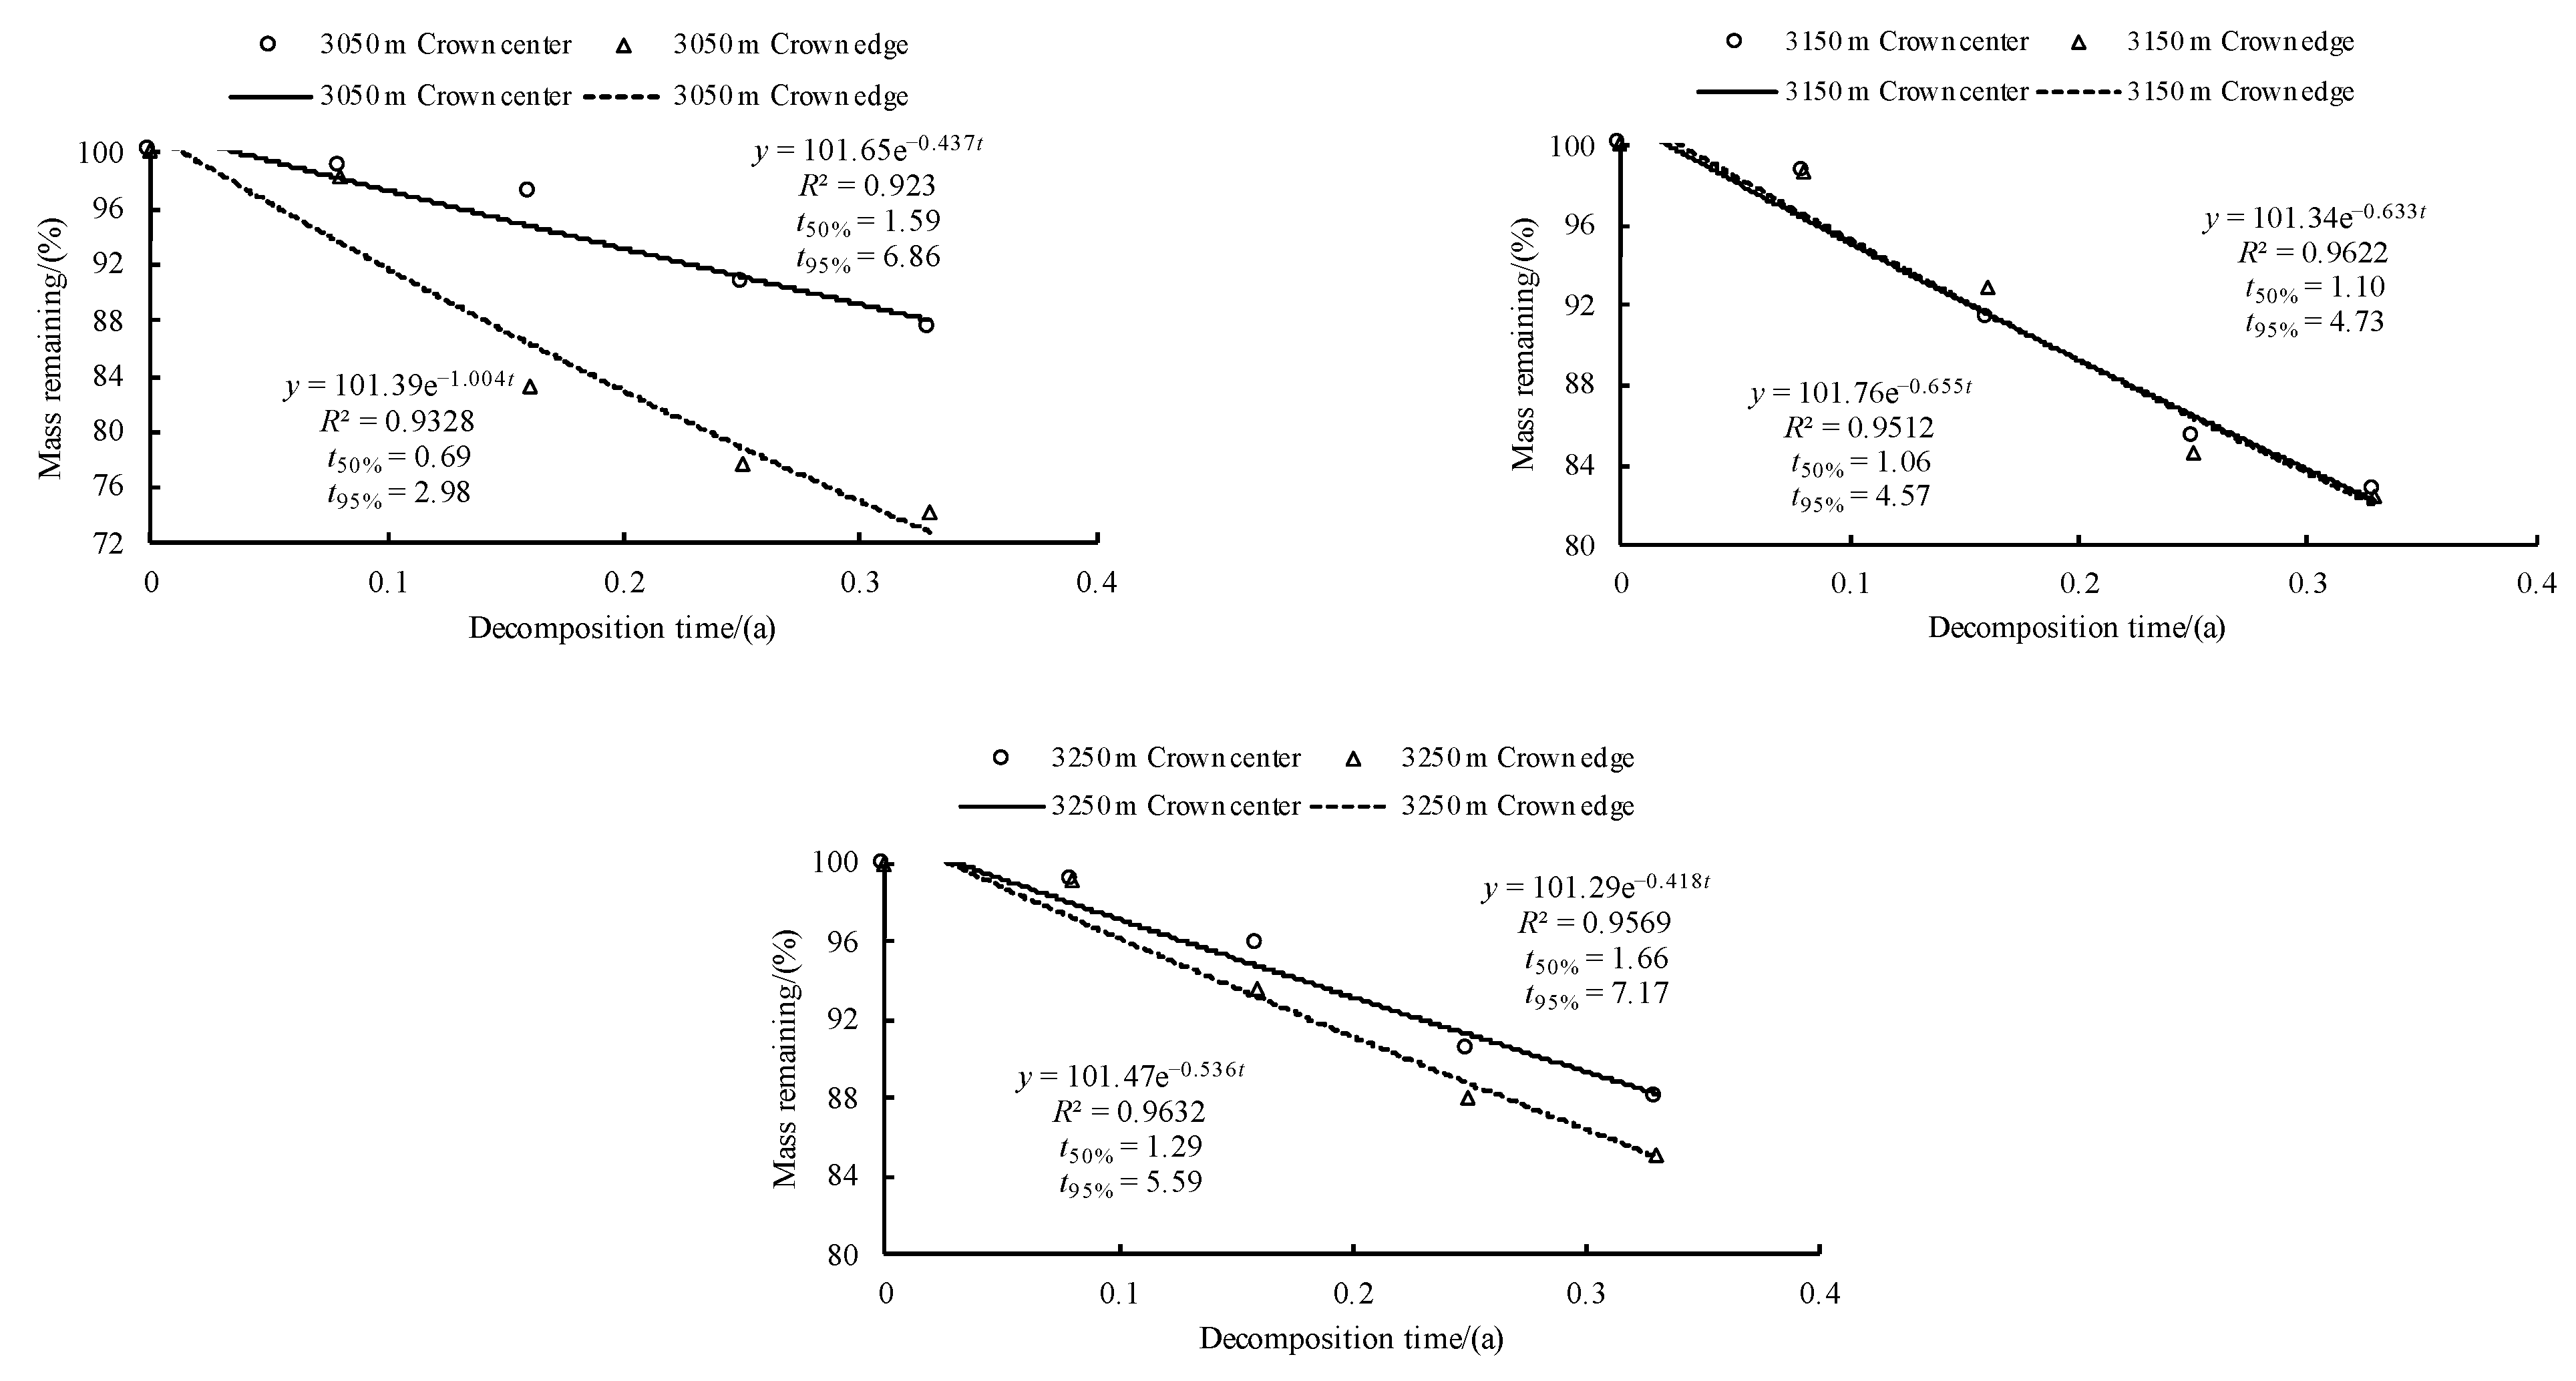
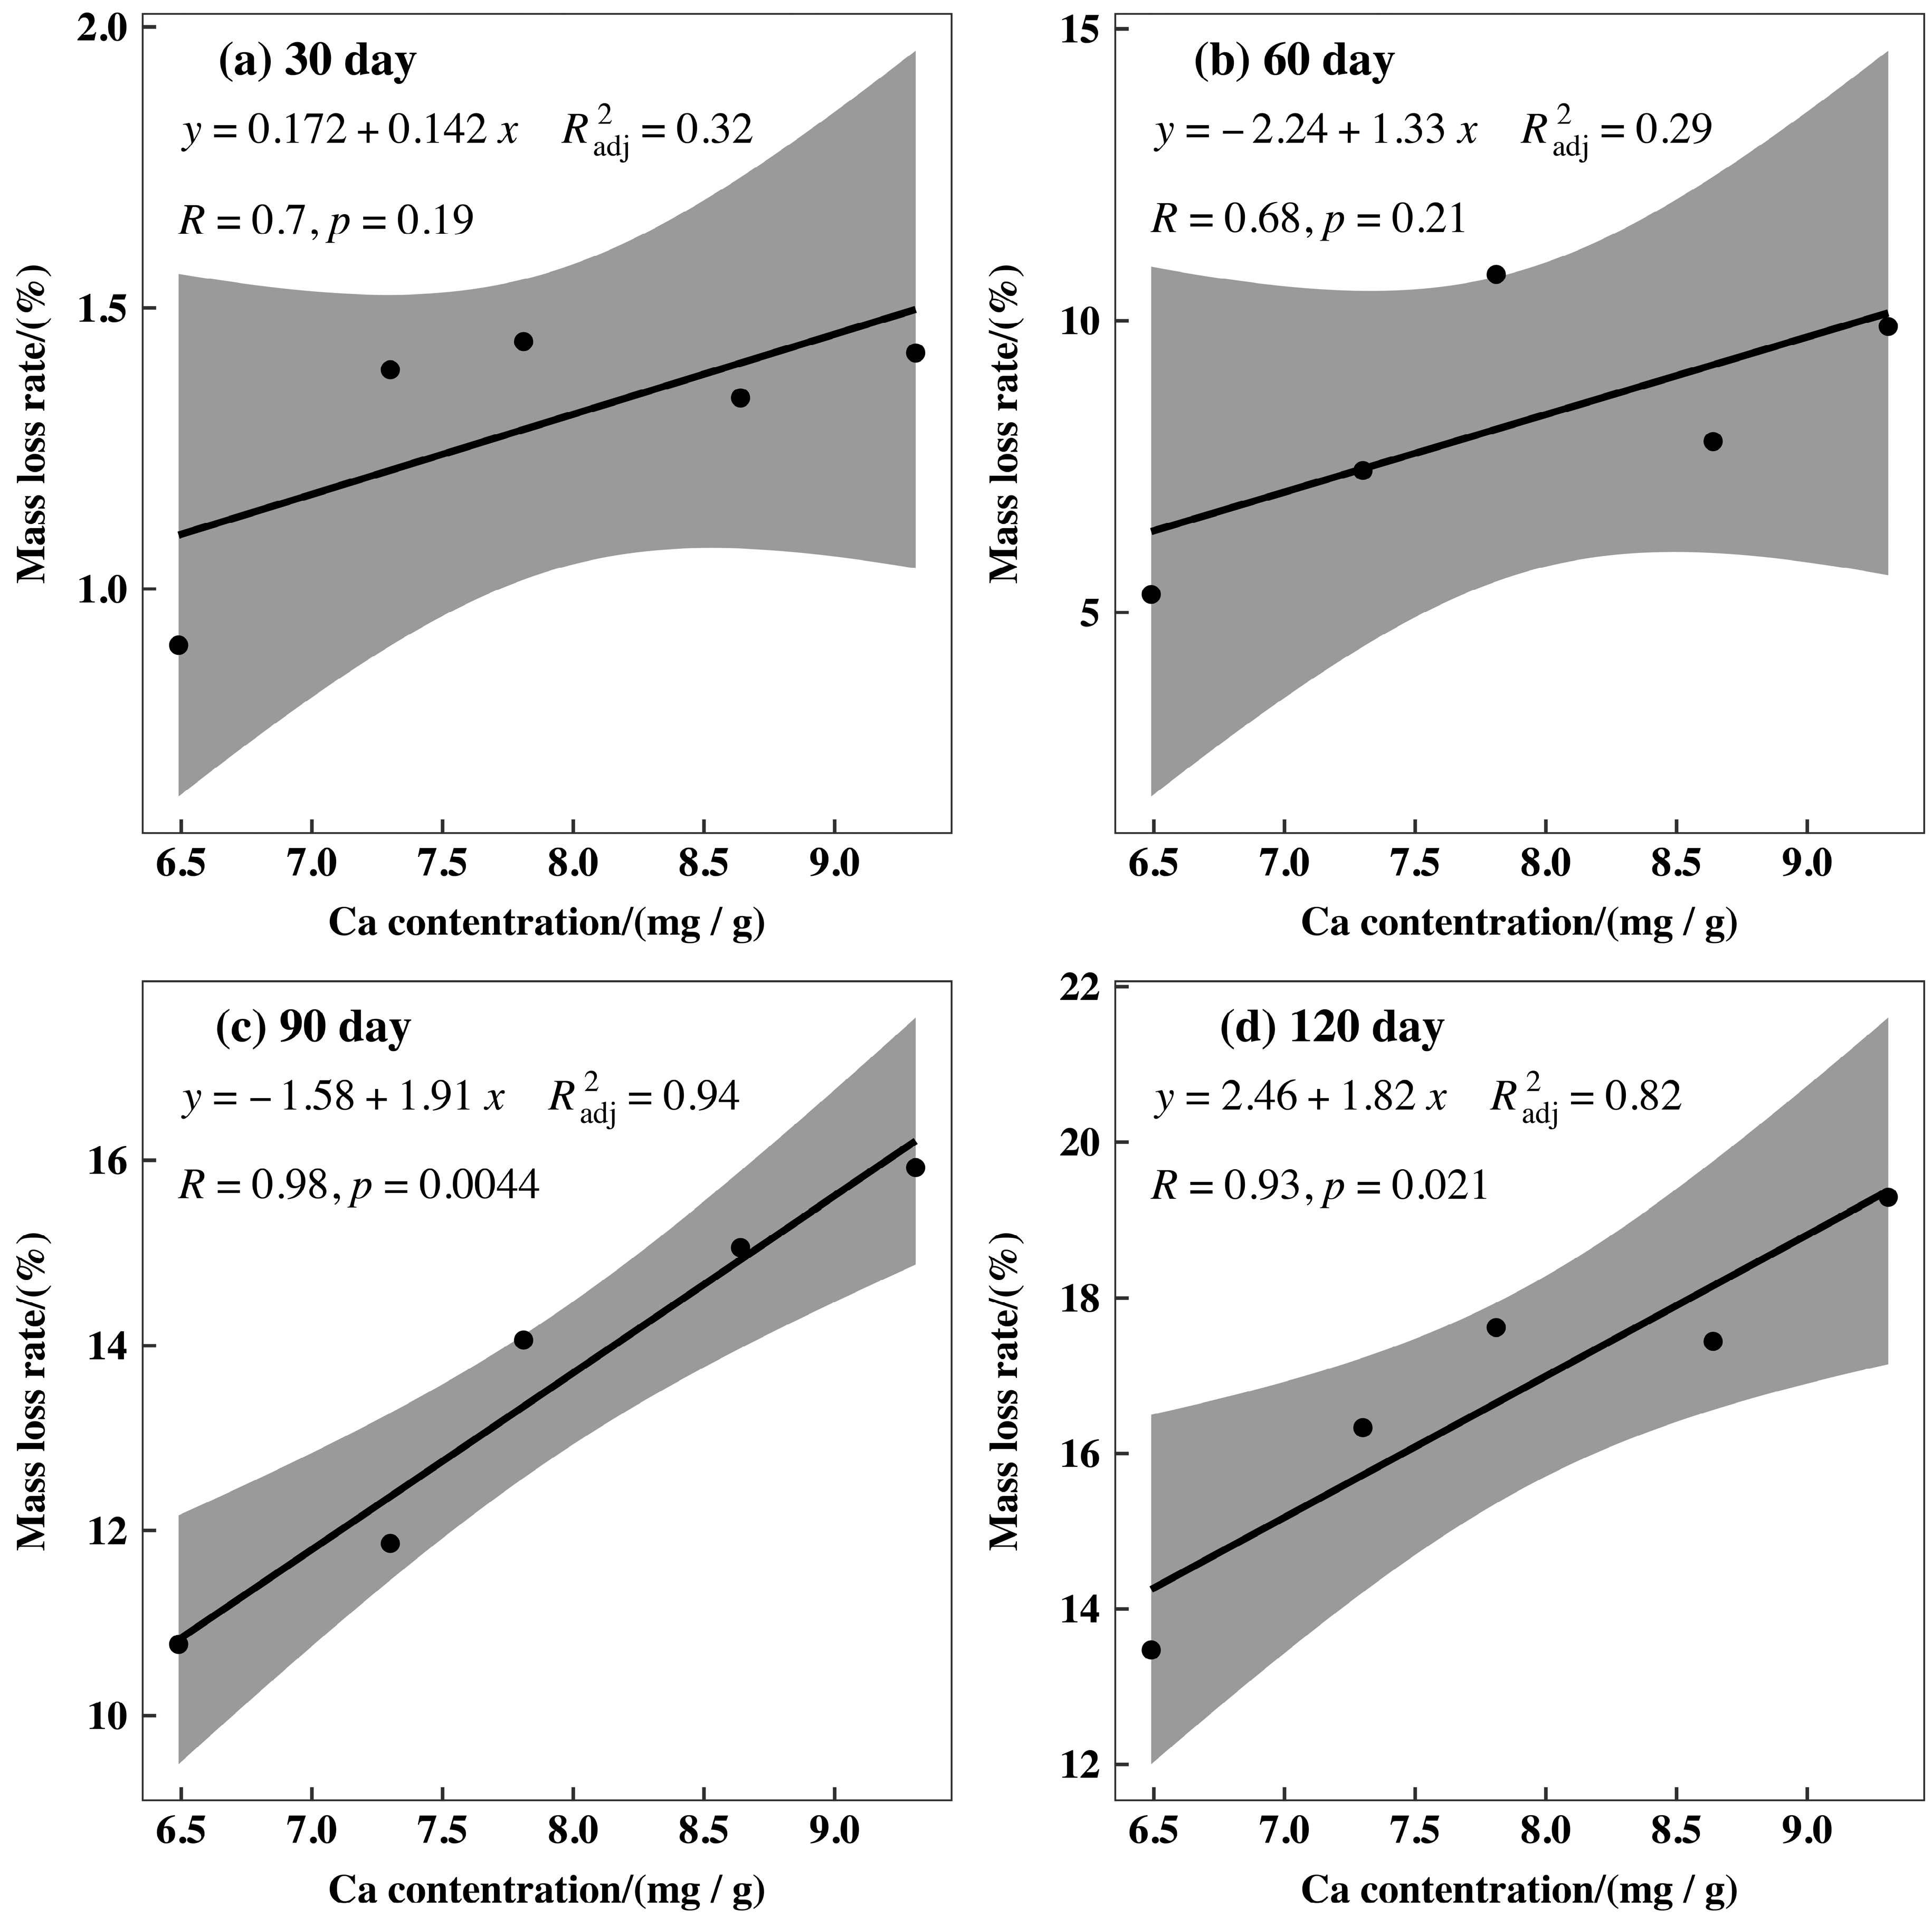
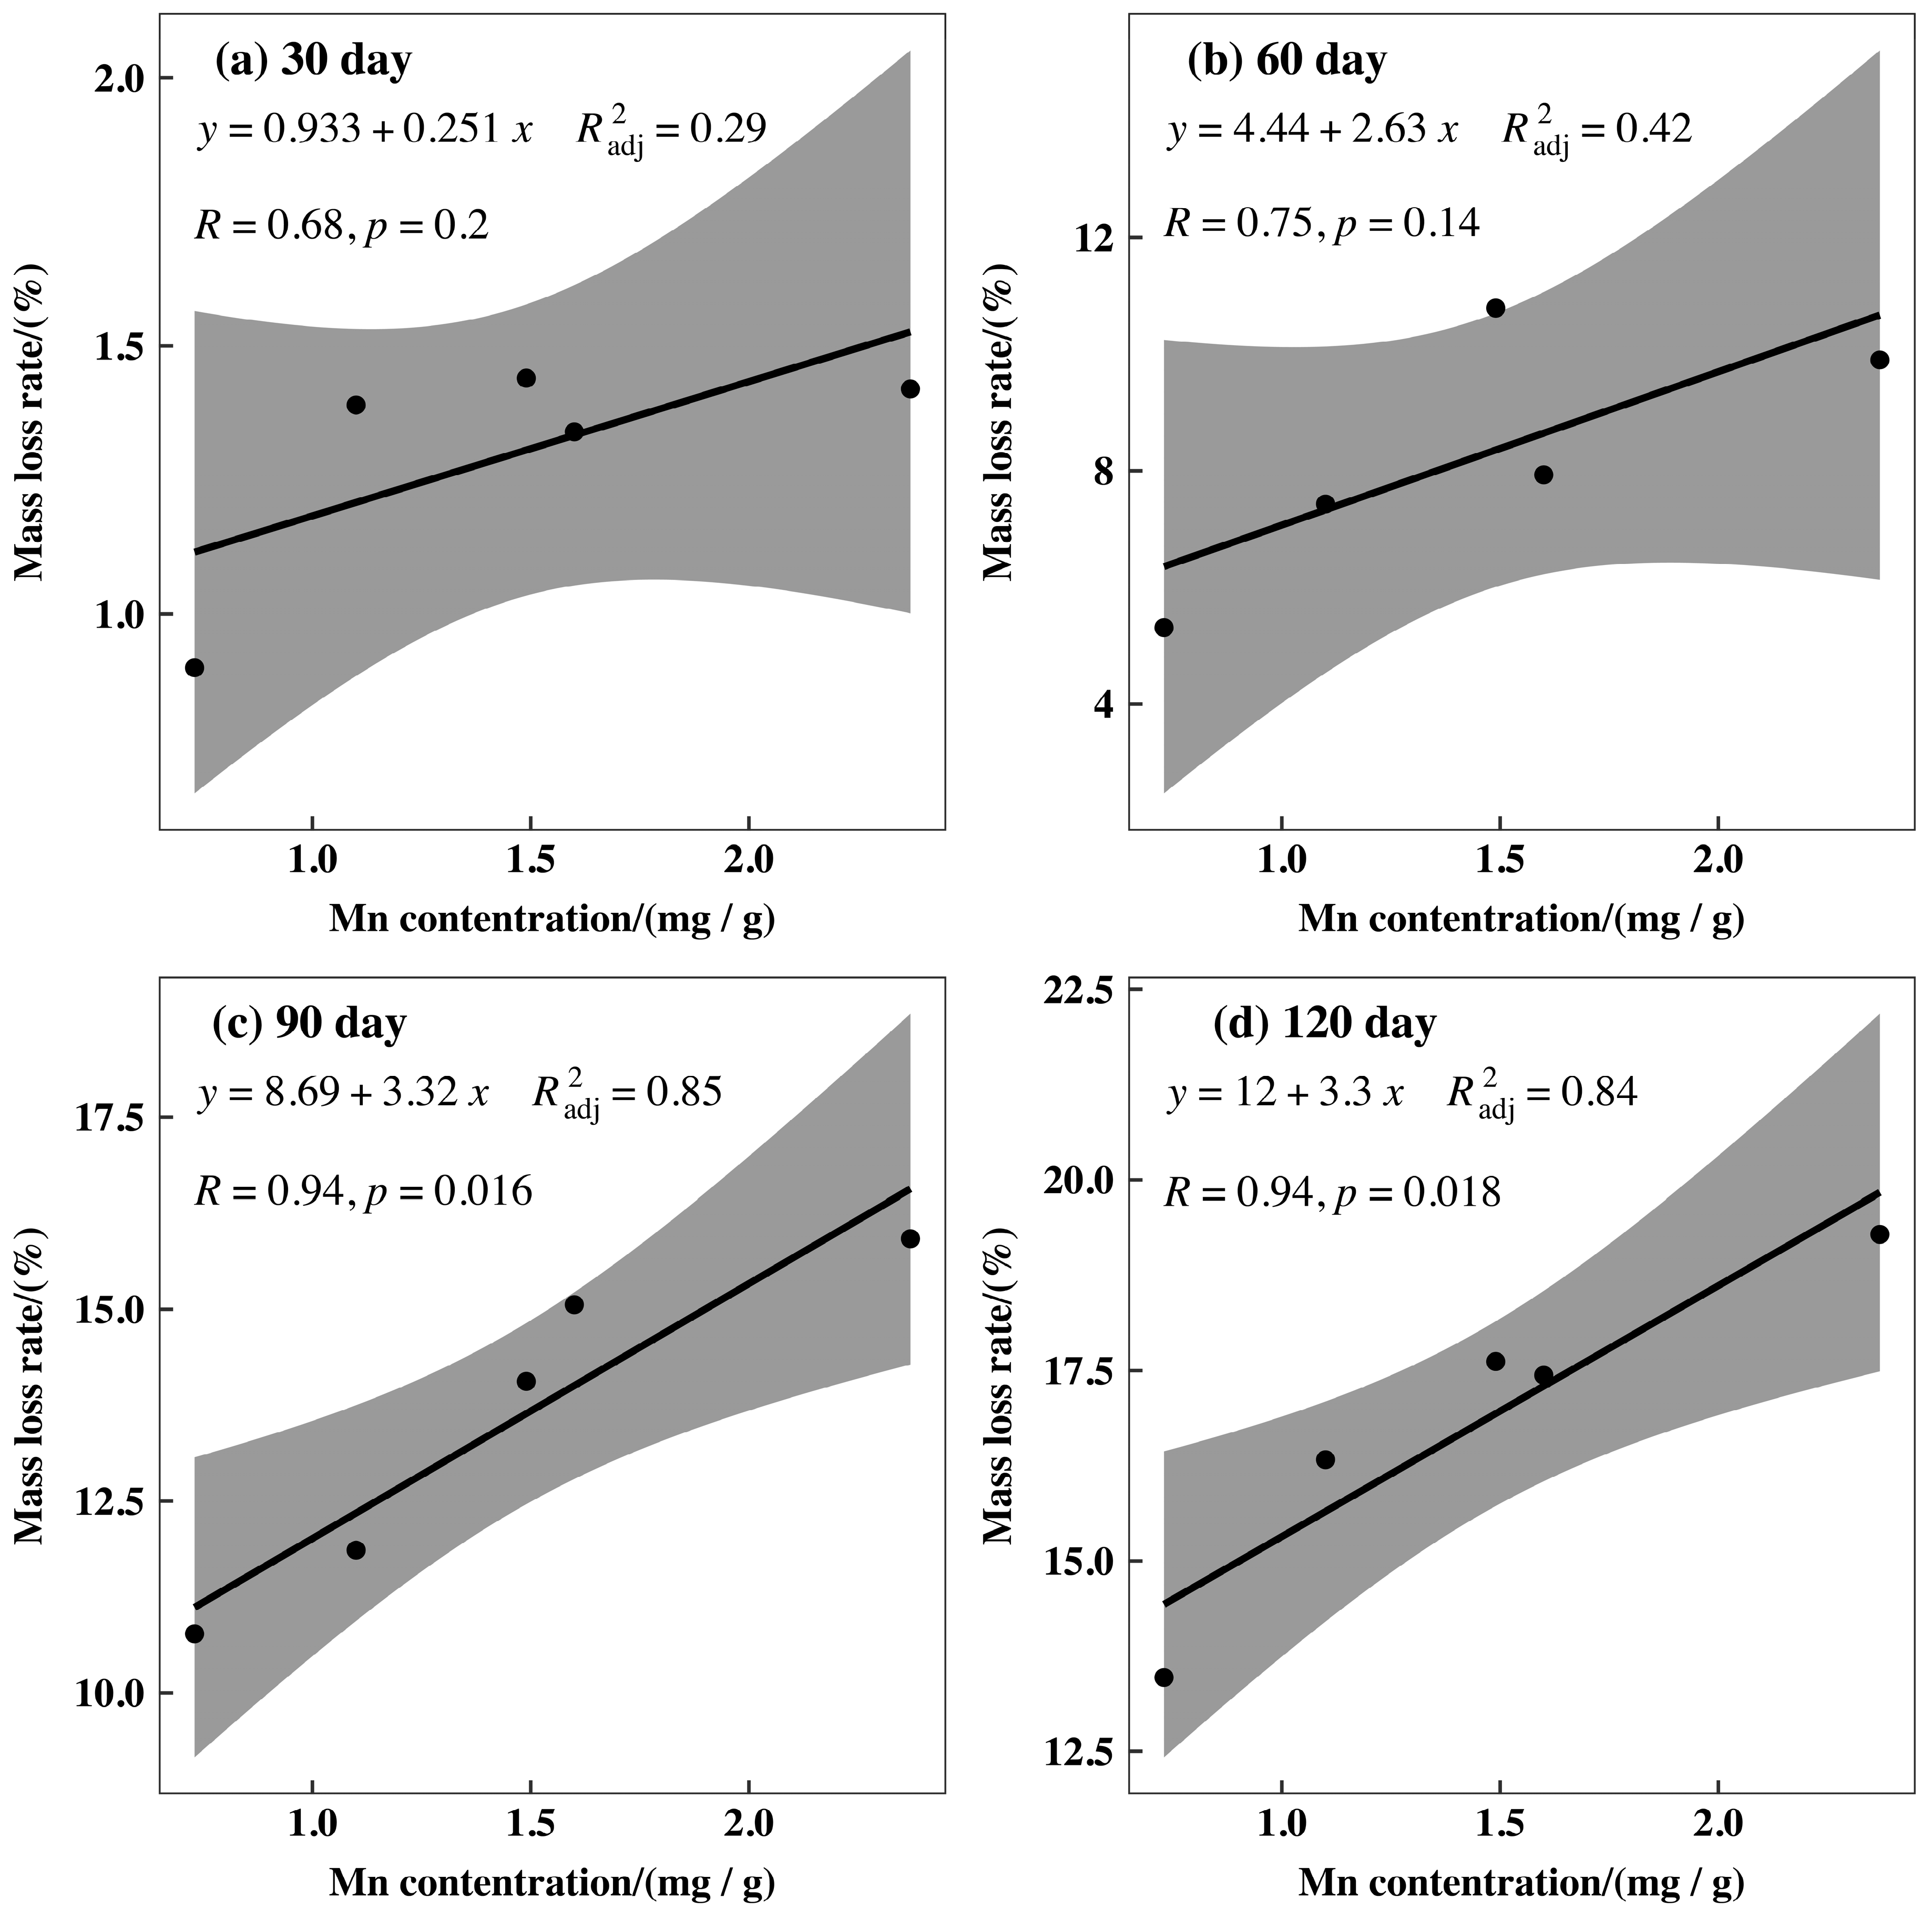
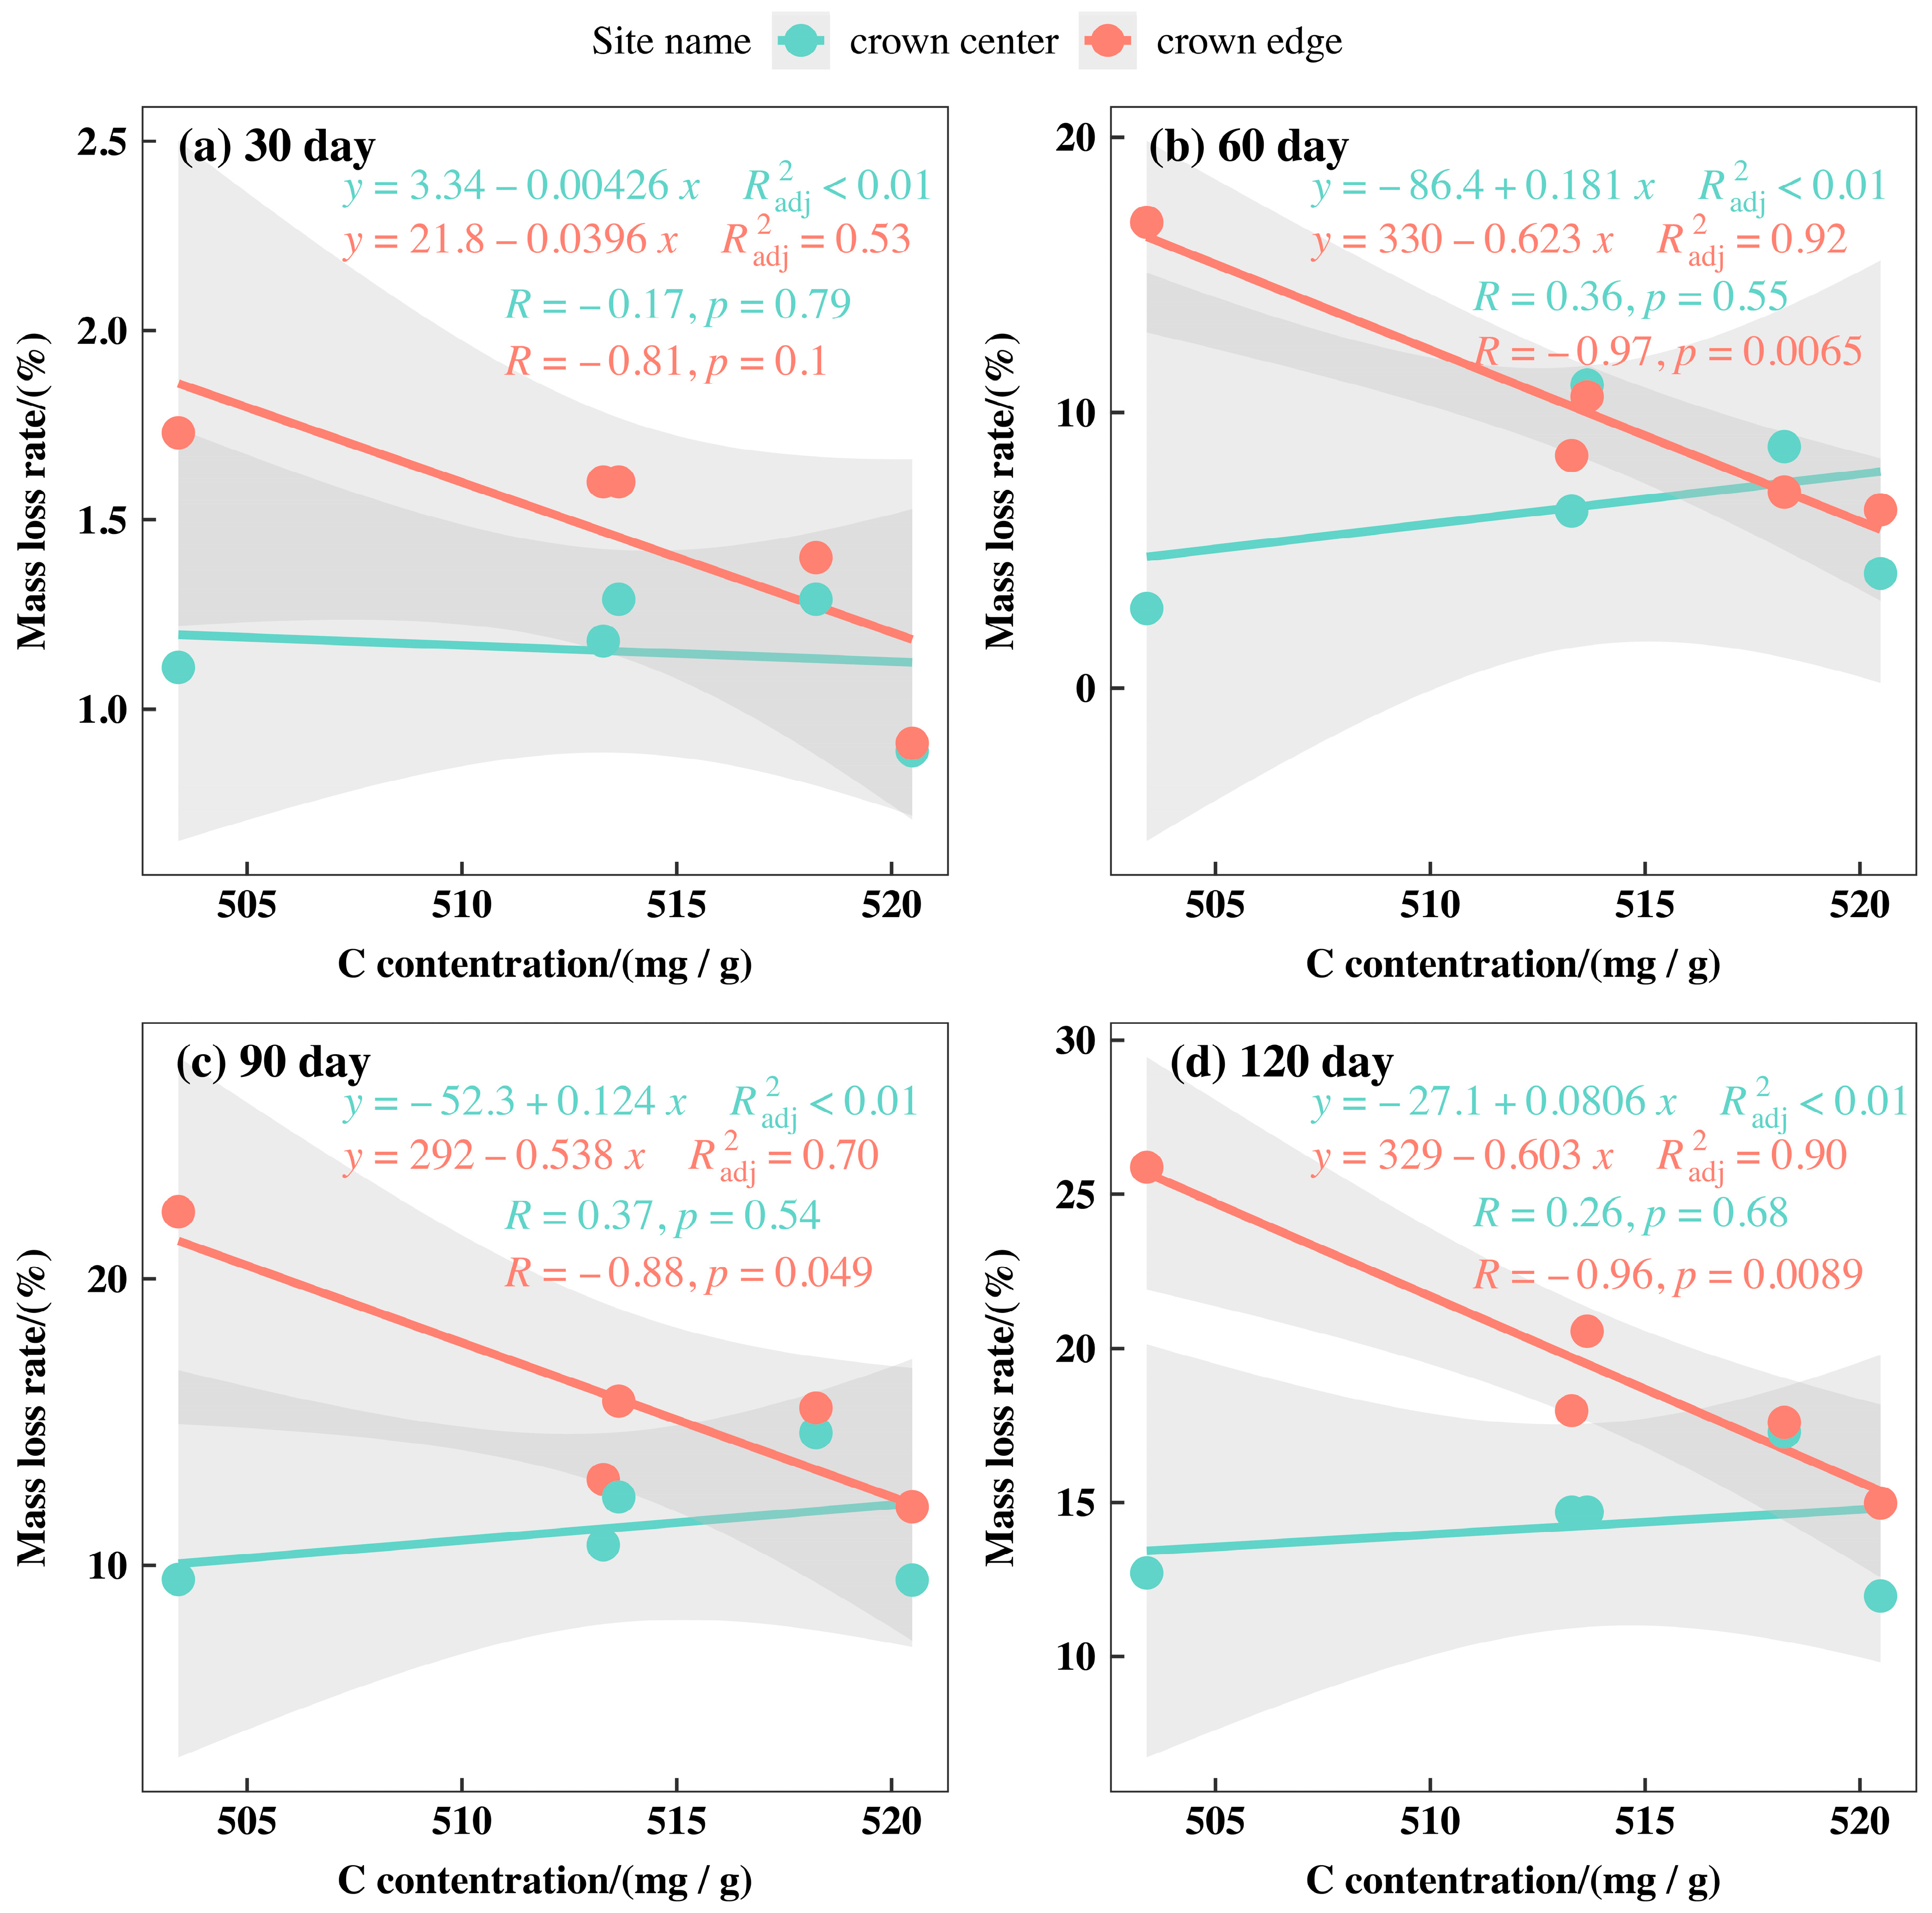
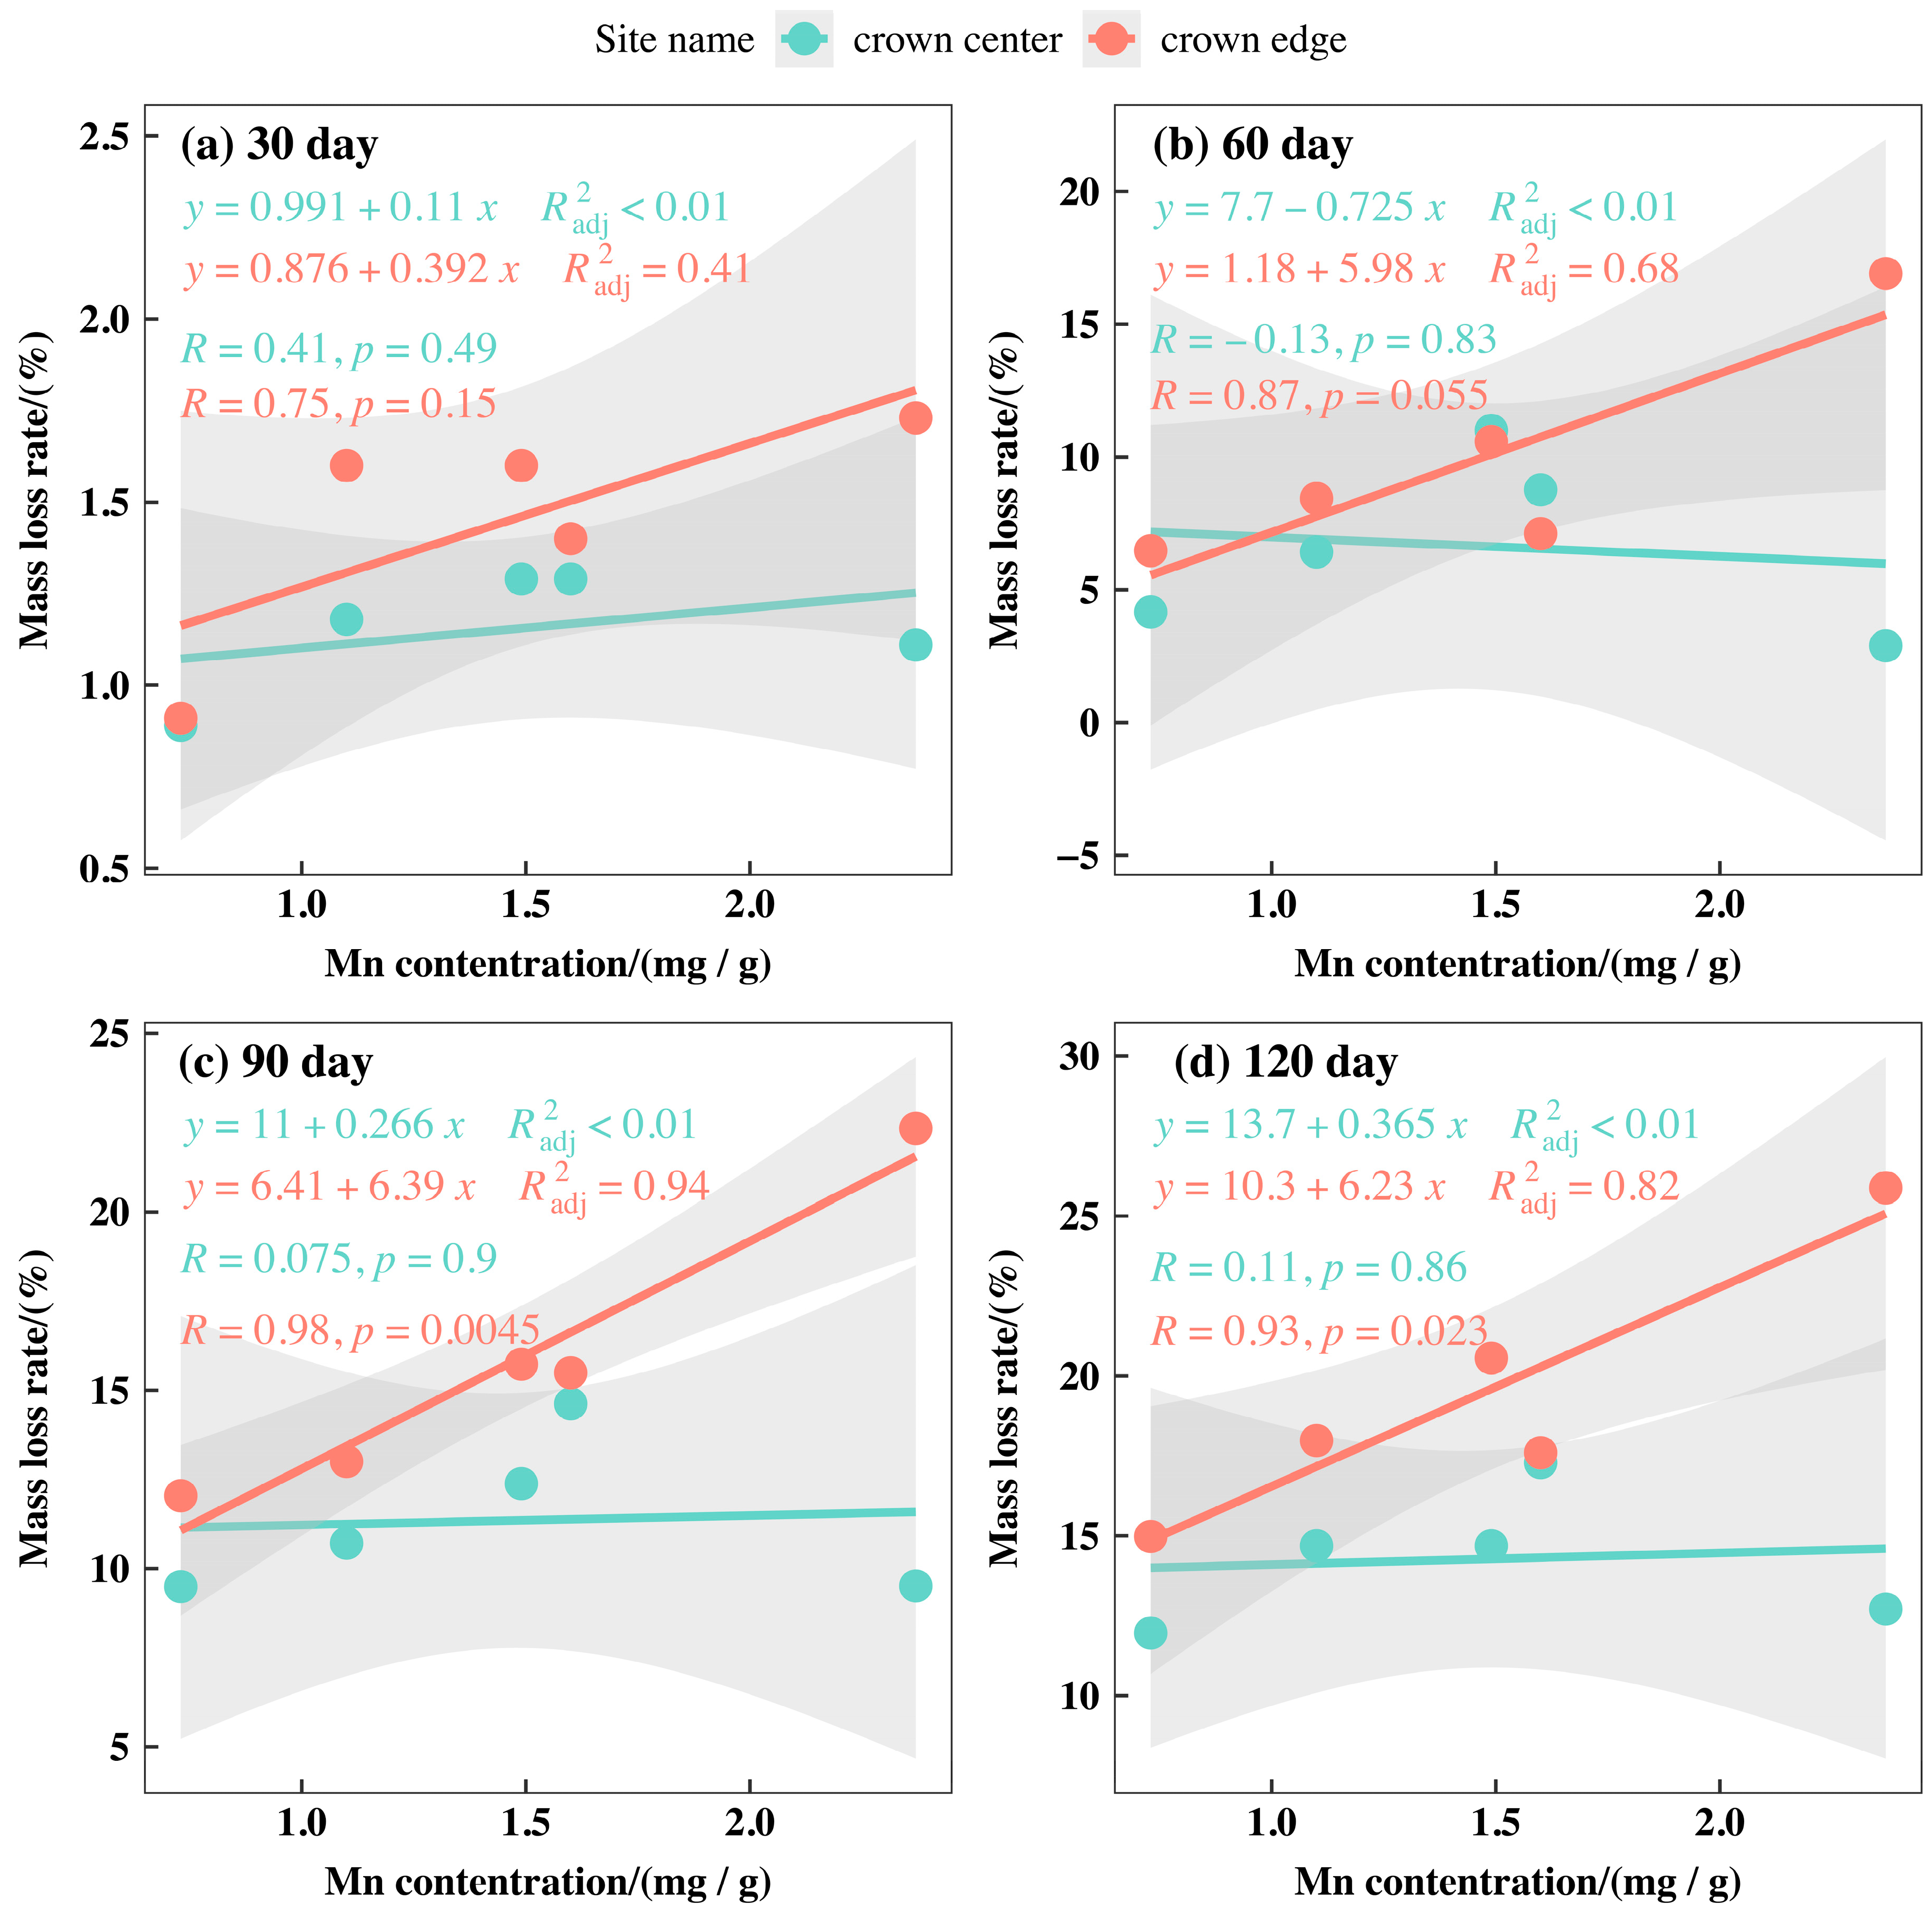
3.3. Initial Mass Loss Rates (%) of Qinghai Spruce Leaf Litter

In this study, we distinguished spatial differences in decomposition behavior. For the Qinghai spruce leaf litter at different altitudes, the initial litter mass loss rate was nonlinearly related to altitudes; that is, with the increase in altitude, the initial litter mass loss rate increases firstly and then decreases (Figure 3). The order of initial litter mass loss rate was 3050 m (19.29%) > 2950 m (17.62%) > 3150 m (17.44%) > 2850 m (16.33%) > 3250 m (13.47%). Meanwhile, 3050 m was significantly higher than 2850 m and 3250 m (p < 0.01), 2850 m and 3150 m were significantly higher than 3250 m (p < 0.01), and 2950 m was significantly higher than 3250 m (p < 0.05). Furthermore, the initial litter mass loss rate of CE was significantly higher than that of CC at all altitudes (Figure 4, p < 0.01).

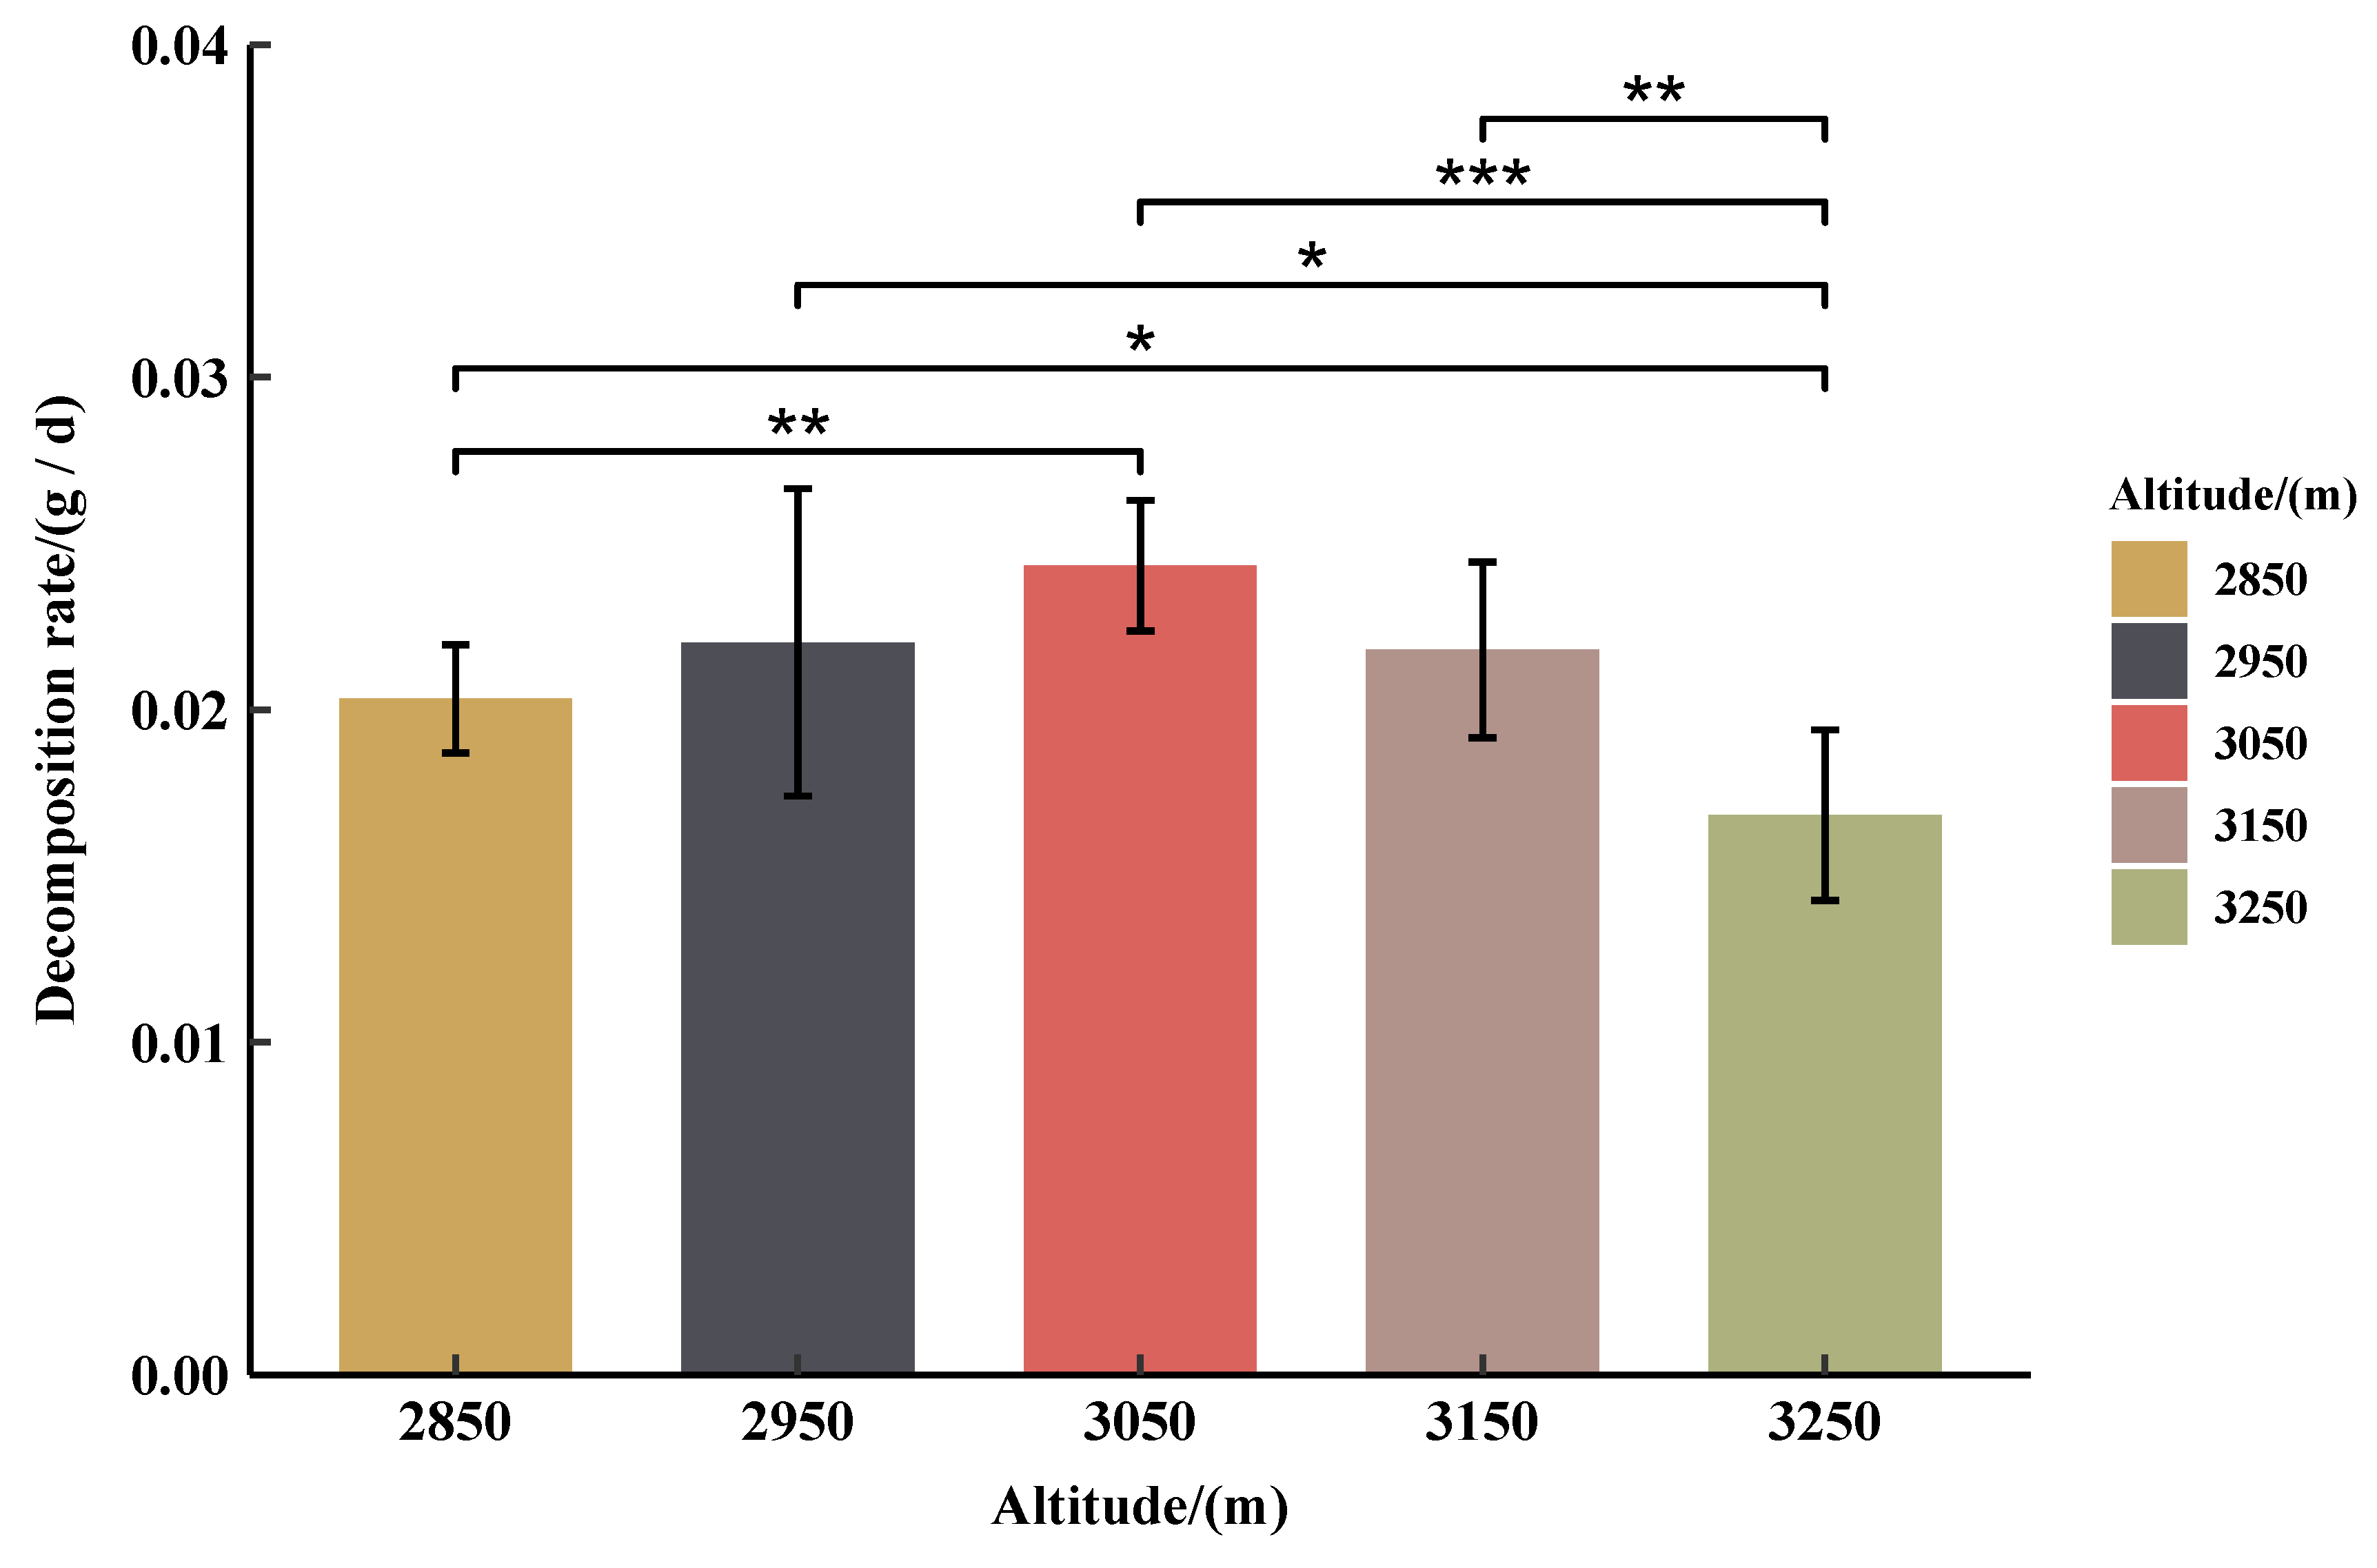
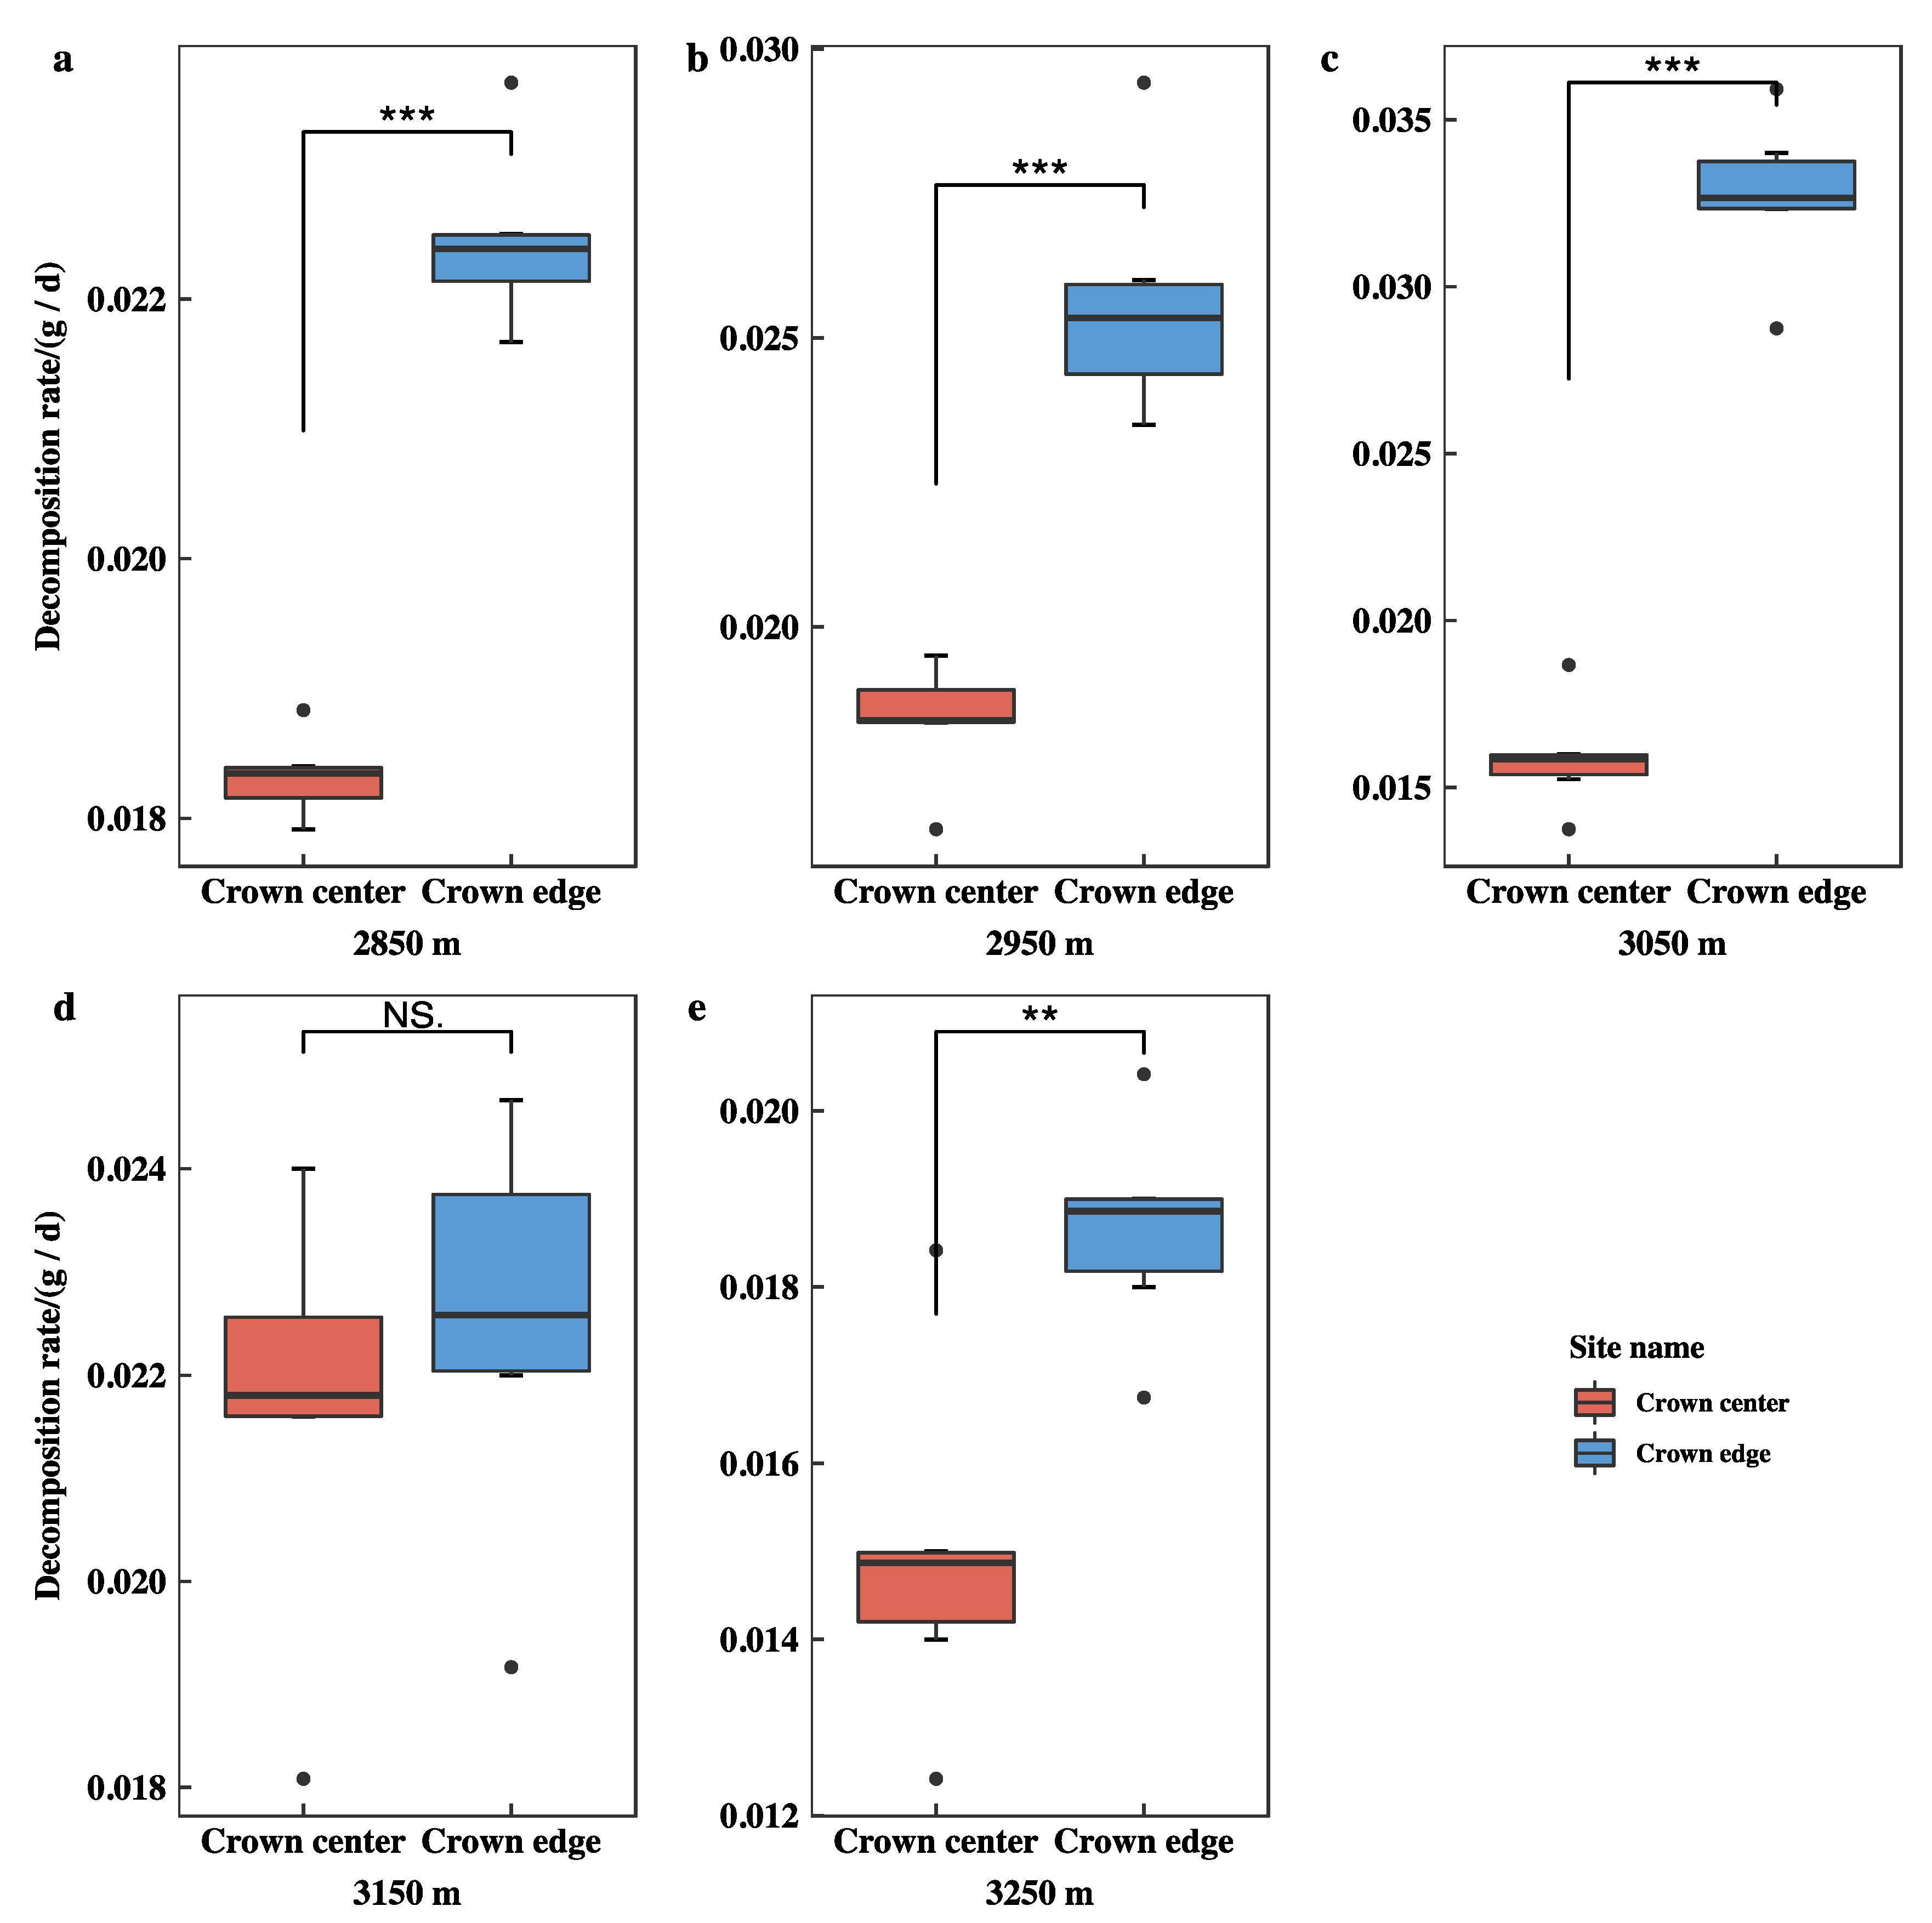
3.4. Initial Decomposition Rates (g·day−1) of Qinghai Spruce Leaf Litter

As with the initial mass loss rate, for the leaf litter of Qinghai spruce woodland at different altitudes, the initial decomposition rate was nonlinearly related to altitudes; that is, with the increase in altitude, the initial decomposition rate increases firstly and then decreases (Figure 5). The order of initial litter decomposition rate was 3050 m (0.024 g·day−1) > 2950 m (0.022 g·day−1) > 3150 m (0.021 g·day−1) > 2850 m (0.020 g·day−1) > 3250 m (0.017 g·day−1). Meanwhile, 3050 m was significantly higher than 2850 m and 3250 m (p < 0.01), 3150 m was significantly higher than 3250 m (p < 0.01), and 2850 m and 2950 m were significantly higher than 3250 m (p < 0.05).
The litter decomposition was a dynamic process. According to the Olson exponential regression equation of litter remaining rate y (1-D) with time t, the time t50% required for half (50%) of litter decomposition and t95% required for 95% of litter decomposition were estimated (Figure 6). It can be seen that the fitting effect of the exponential regression equation was good, and R2 was between 0.9504 and 0.9735. The decomposition rate from large to small was k3050 (0.709) > k3150 (0.644) > k2950 (0.632) > k2850 (0.565) > k3250 (0.476). The time required for half decomposition (t50%) from low altitude to high was 1.23, 1.10, 0.98, 1.08, and 1.46a, and the time required for 95% decomposition (t95%) was 5.30, 4.74, 4.23, 4.65, and 6.29a.
Furthermore, the initial decomposition rates of CC and CE were different at different altitudes (Figure 7). The initial decomposition rate of CE was significantly faster than that of CC (Figure 7a–c,e, p < 0.01), except that 3150 m CC and CE were not significant (Figure 7d, p > 0.05).
According to the exponential regression equation of litter remaining rate y (1-D) with time t, the time t50% is required for half (50%) of litter decomposition, and t95% is required for 95% of litter decomposition under CC and CE at different altitudes were estimated (Figure 8). It can be seen that the fitting effect of the exponential regression equation was good, with R2 ranging from 0.9016 to 0.9735. The decomposition rate of CC from large to small was k3150 (0.633) > k2950 (0.525) > k2850 (0.506) > k3050 (0.437) > k3250 (0.418), and the decomposition rate of CE from large to small was k3050 (1.004) > k2950 (0.742) > k3150 (0.655) > k2850 (0.626) > k3250 (0.536). The decomposition rate of CE was faster than that of CC at all altitudes. From 2850 m to 3250 m, the time (t50%) required to decompose half of CC was 1.37, 1.32, 1.59, 1.10, and 1.66a, and the time (t95%) required to decompose 95% was 5.92, 5.71, 6.86, 4.73, and 7.17a; the time (t50%) required to decompose half of CE was 1.11, 0.93, 0.69, 1.06, and 1.29a, and the time (t95%) required to decompose 95% was 4.79, 4.06, 2.98, 4.57, and 5.59a.

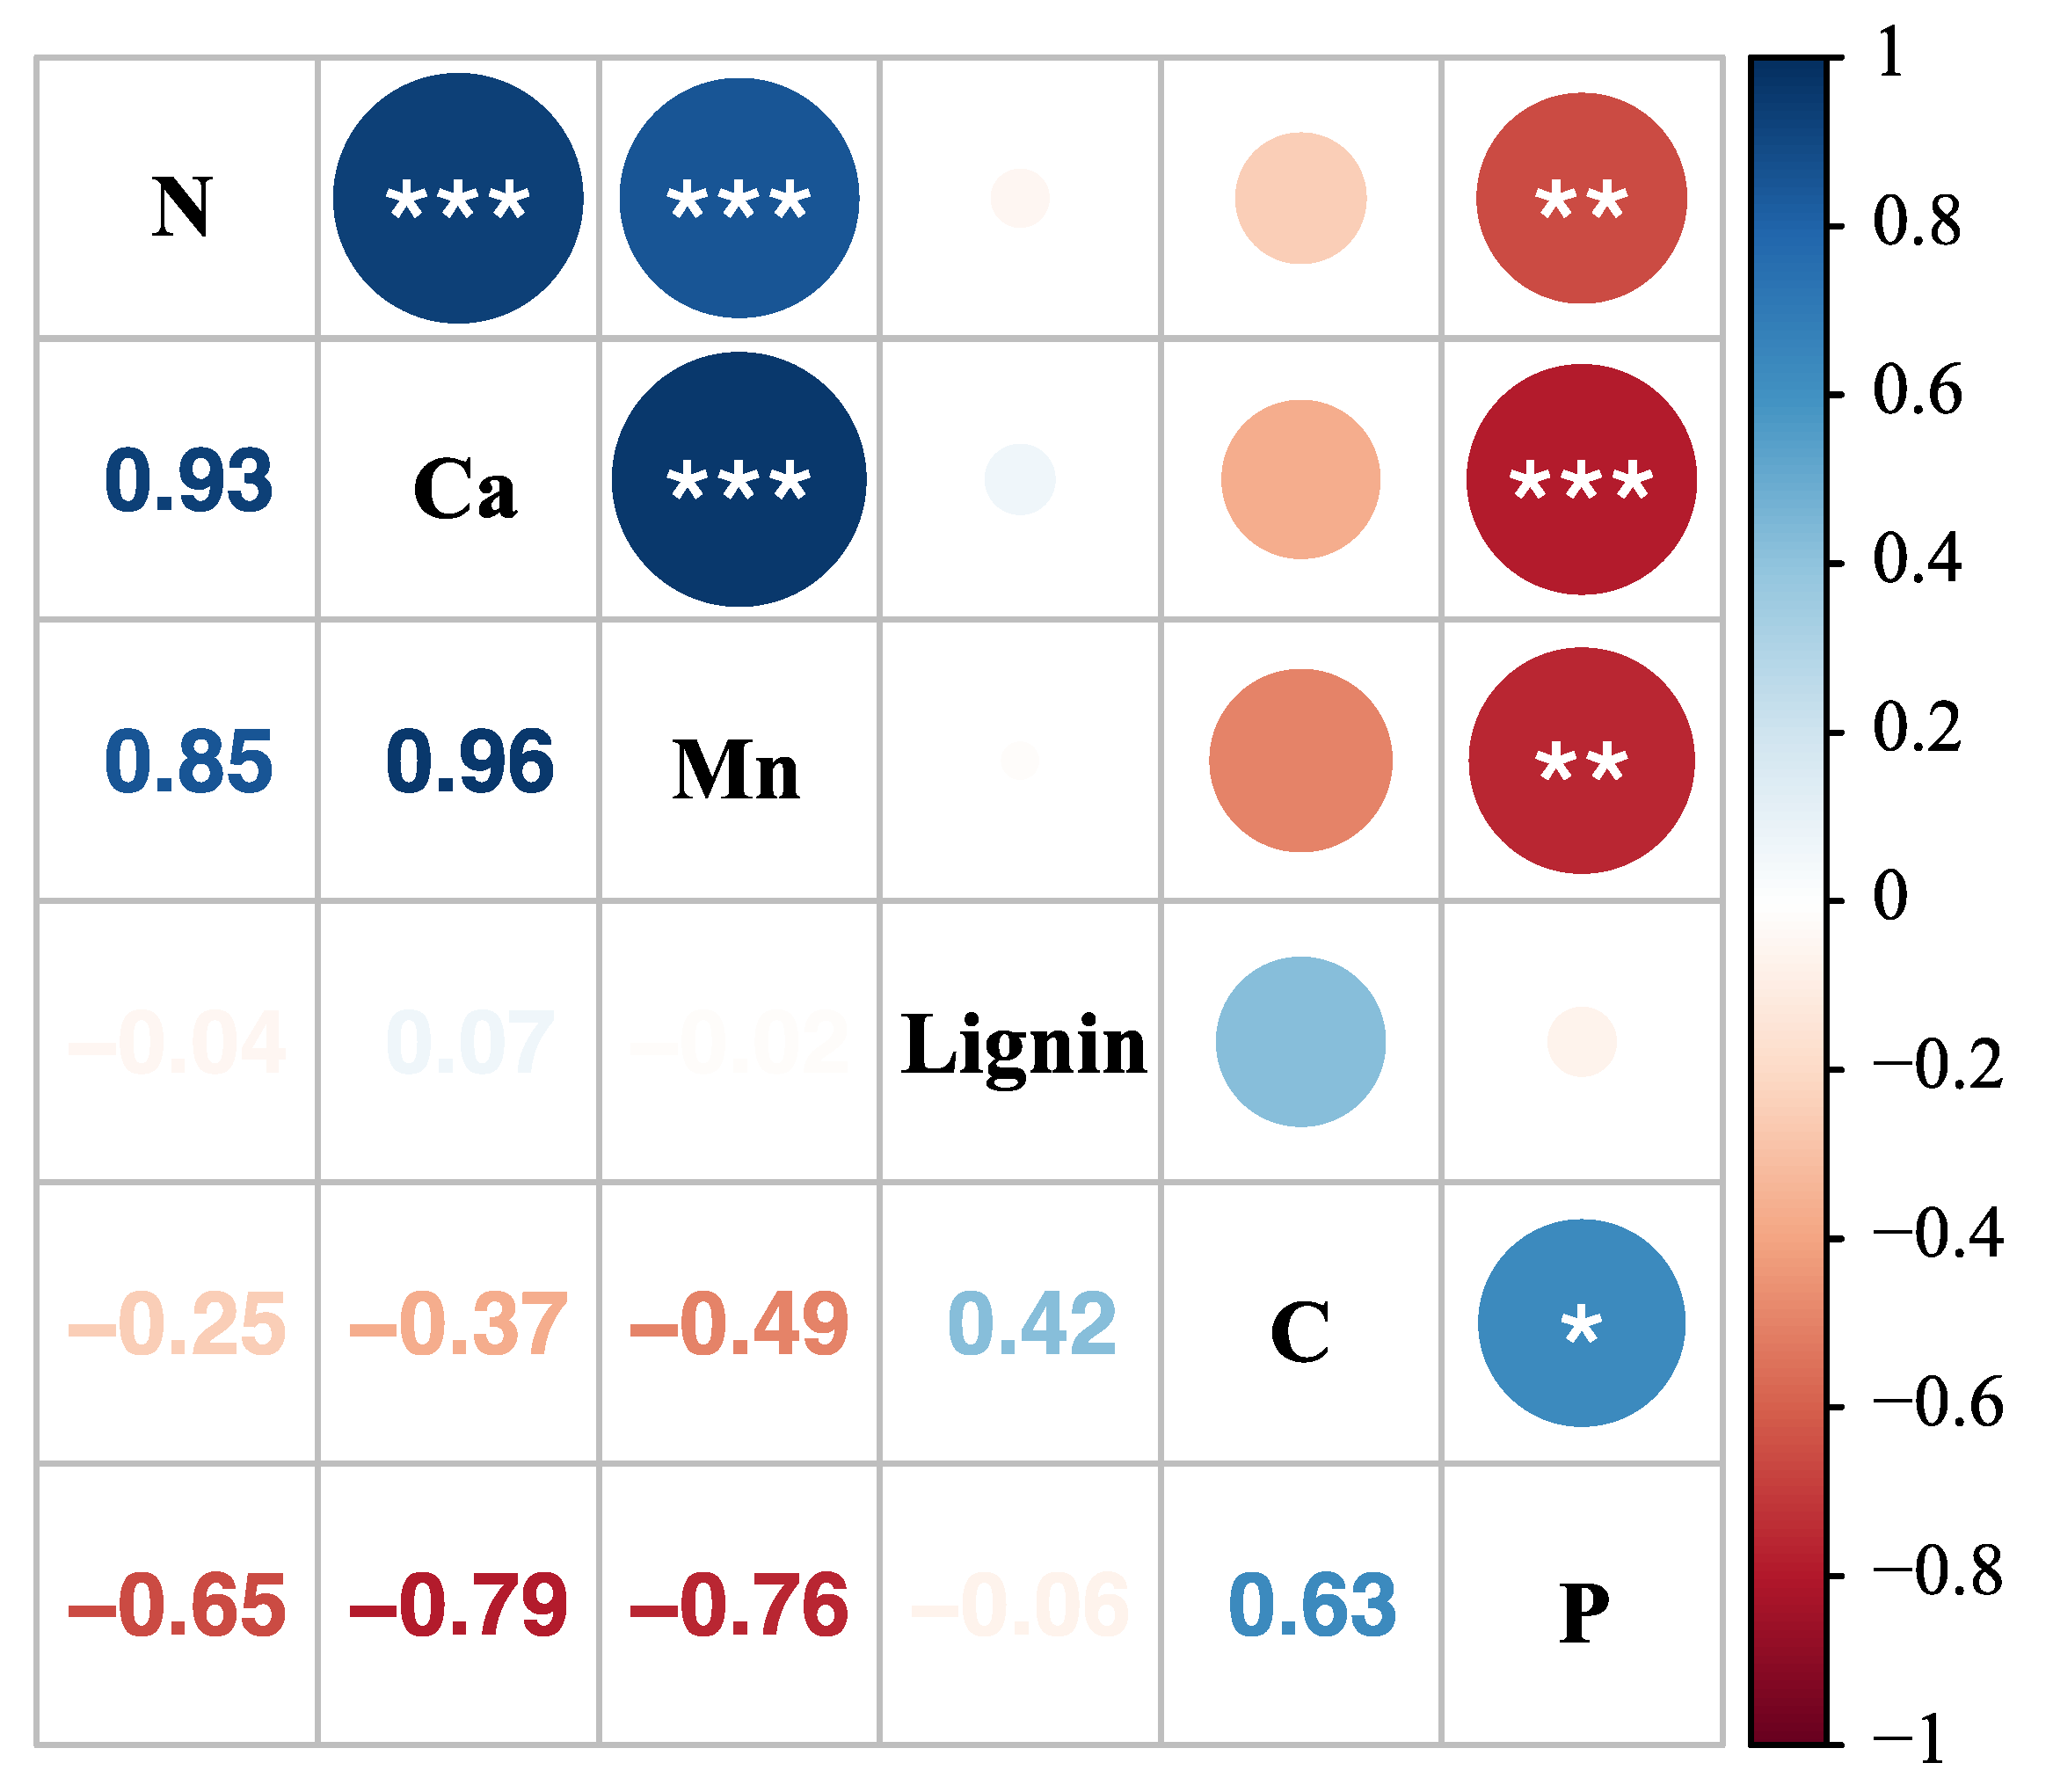
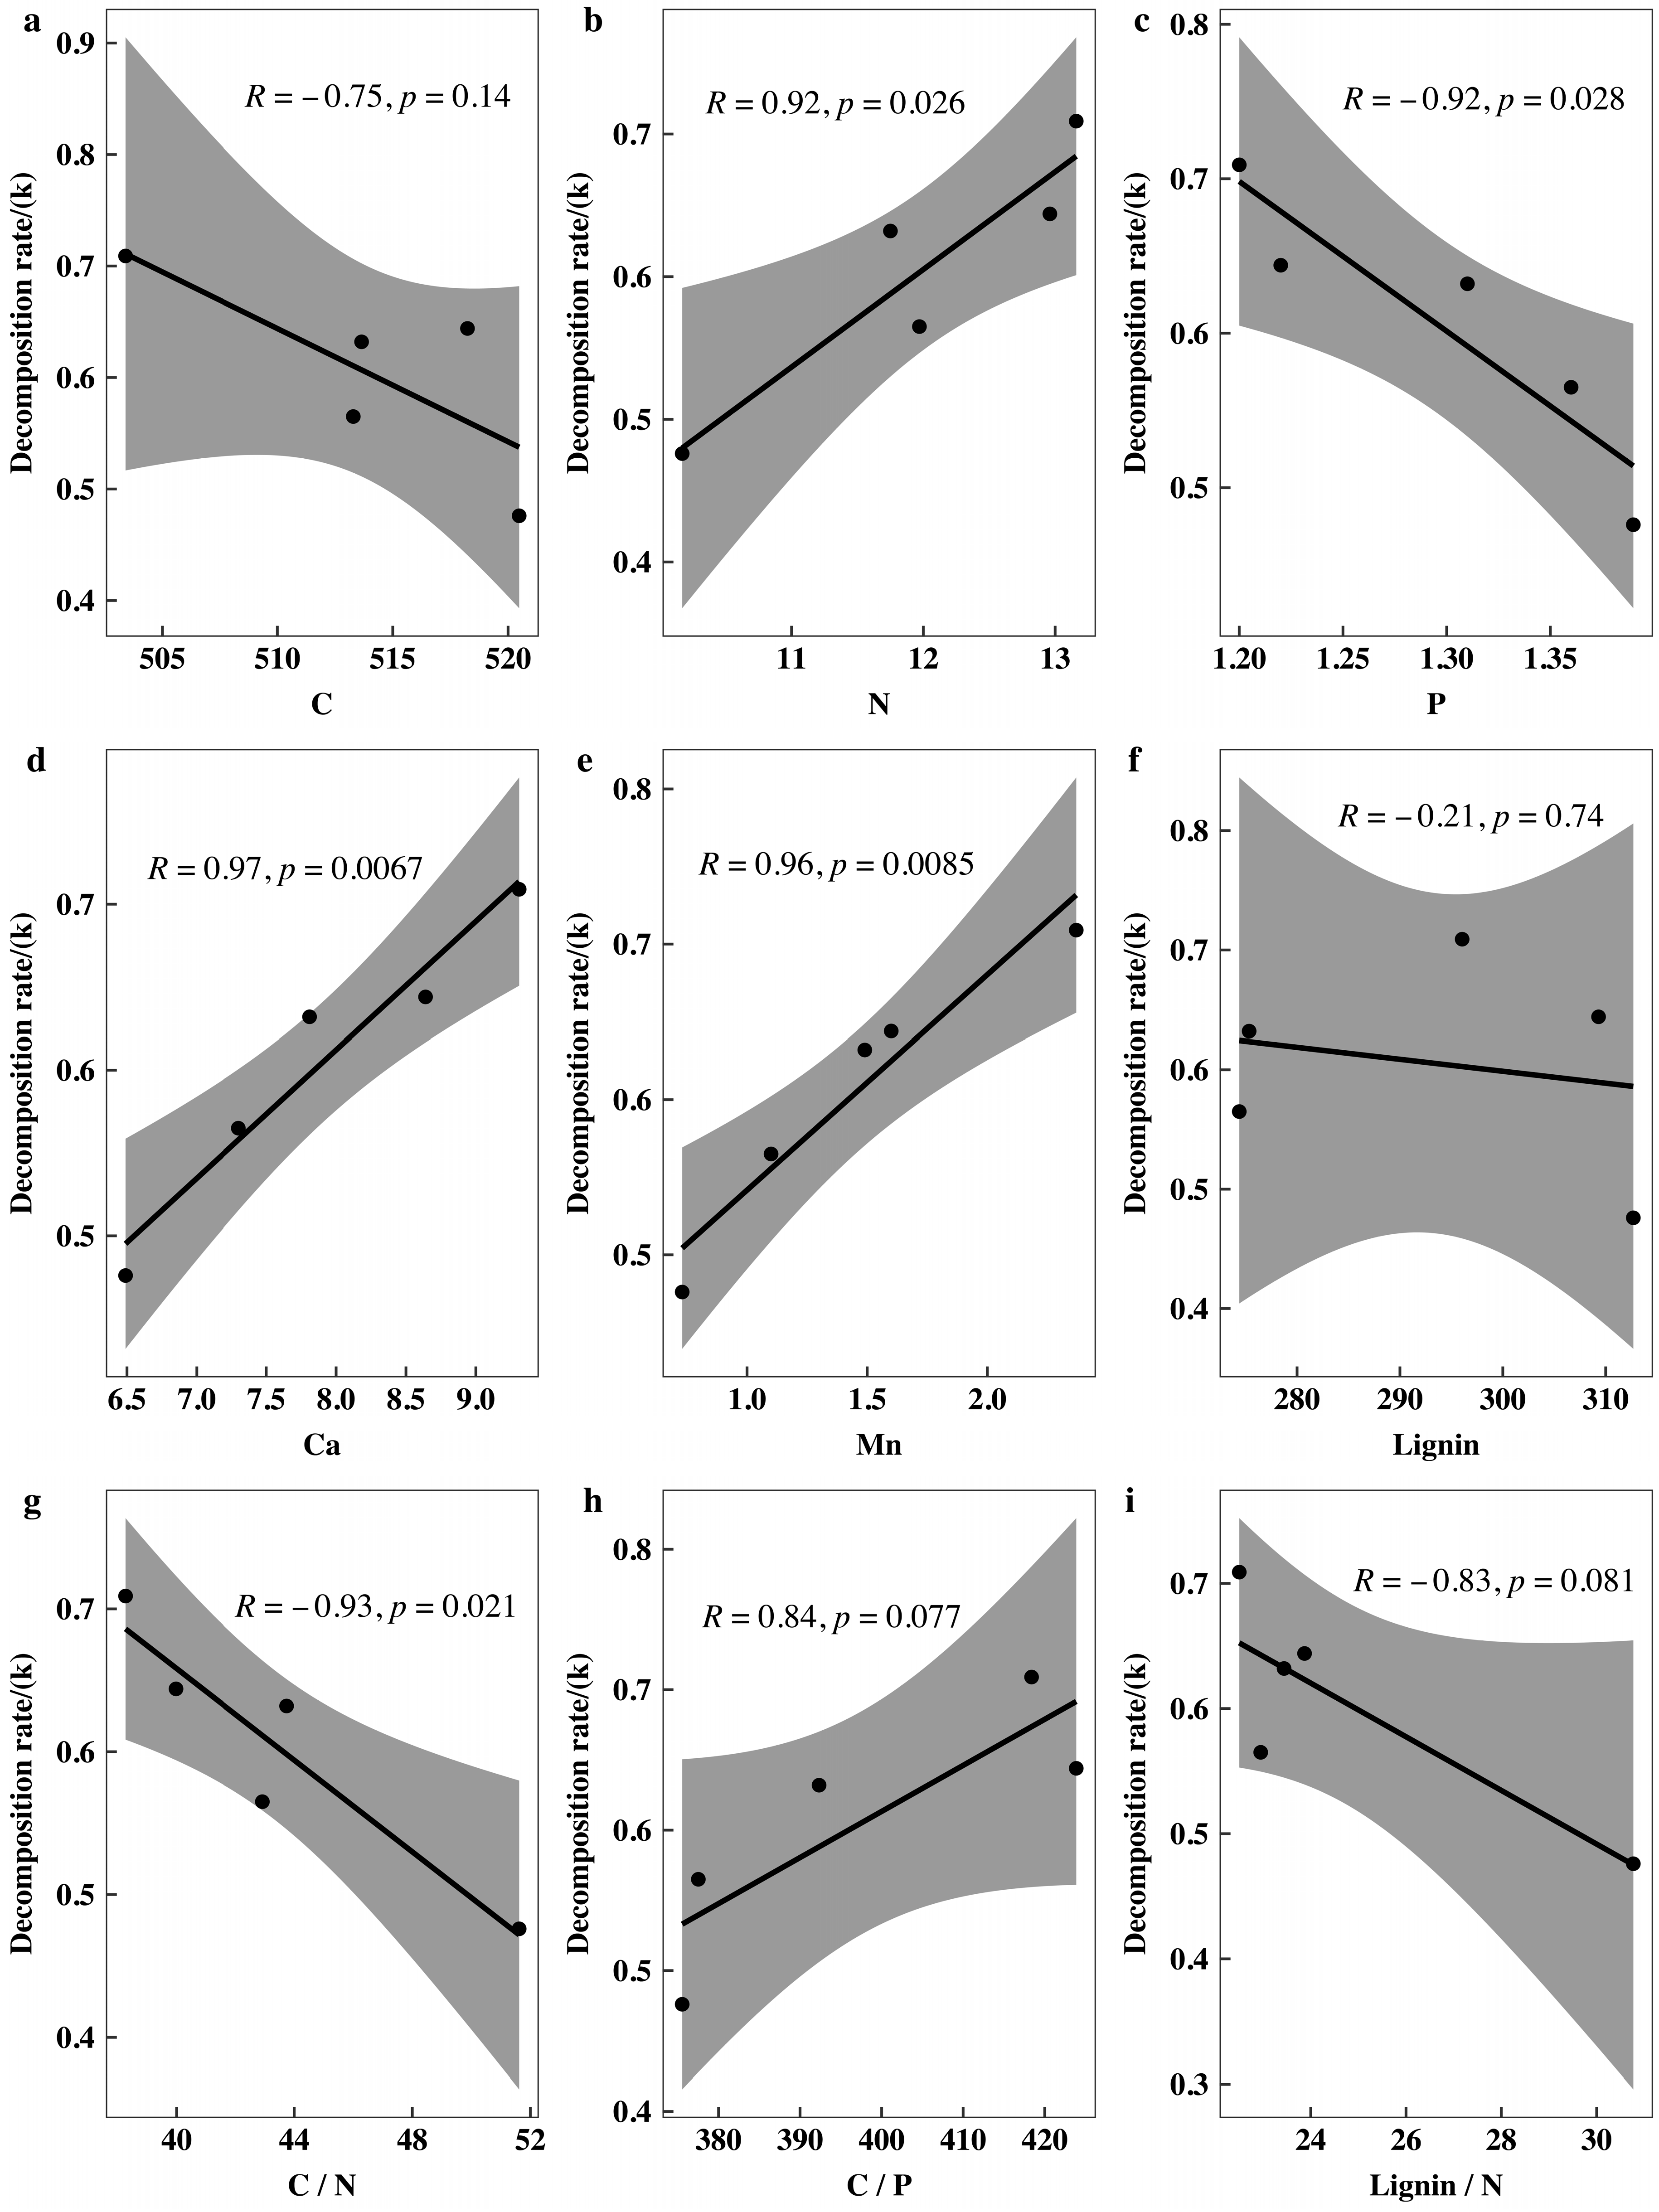
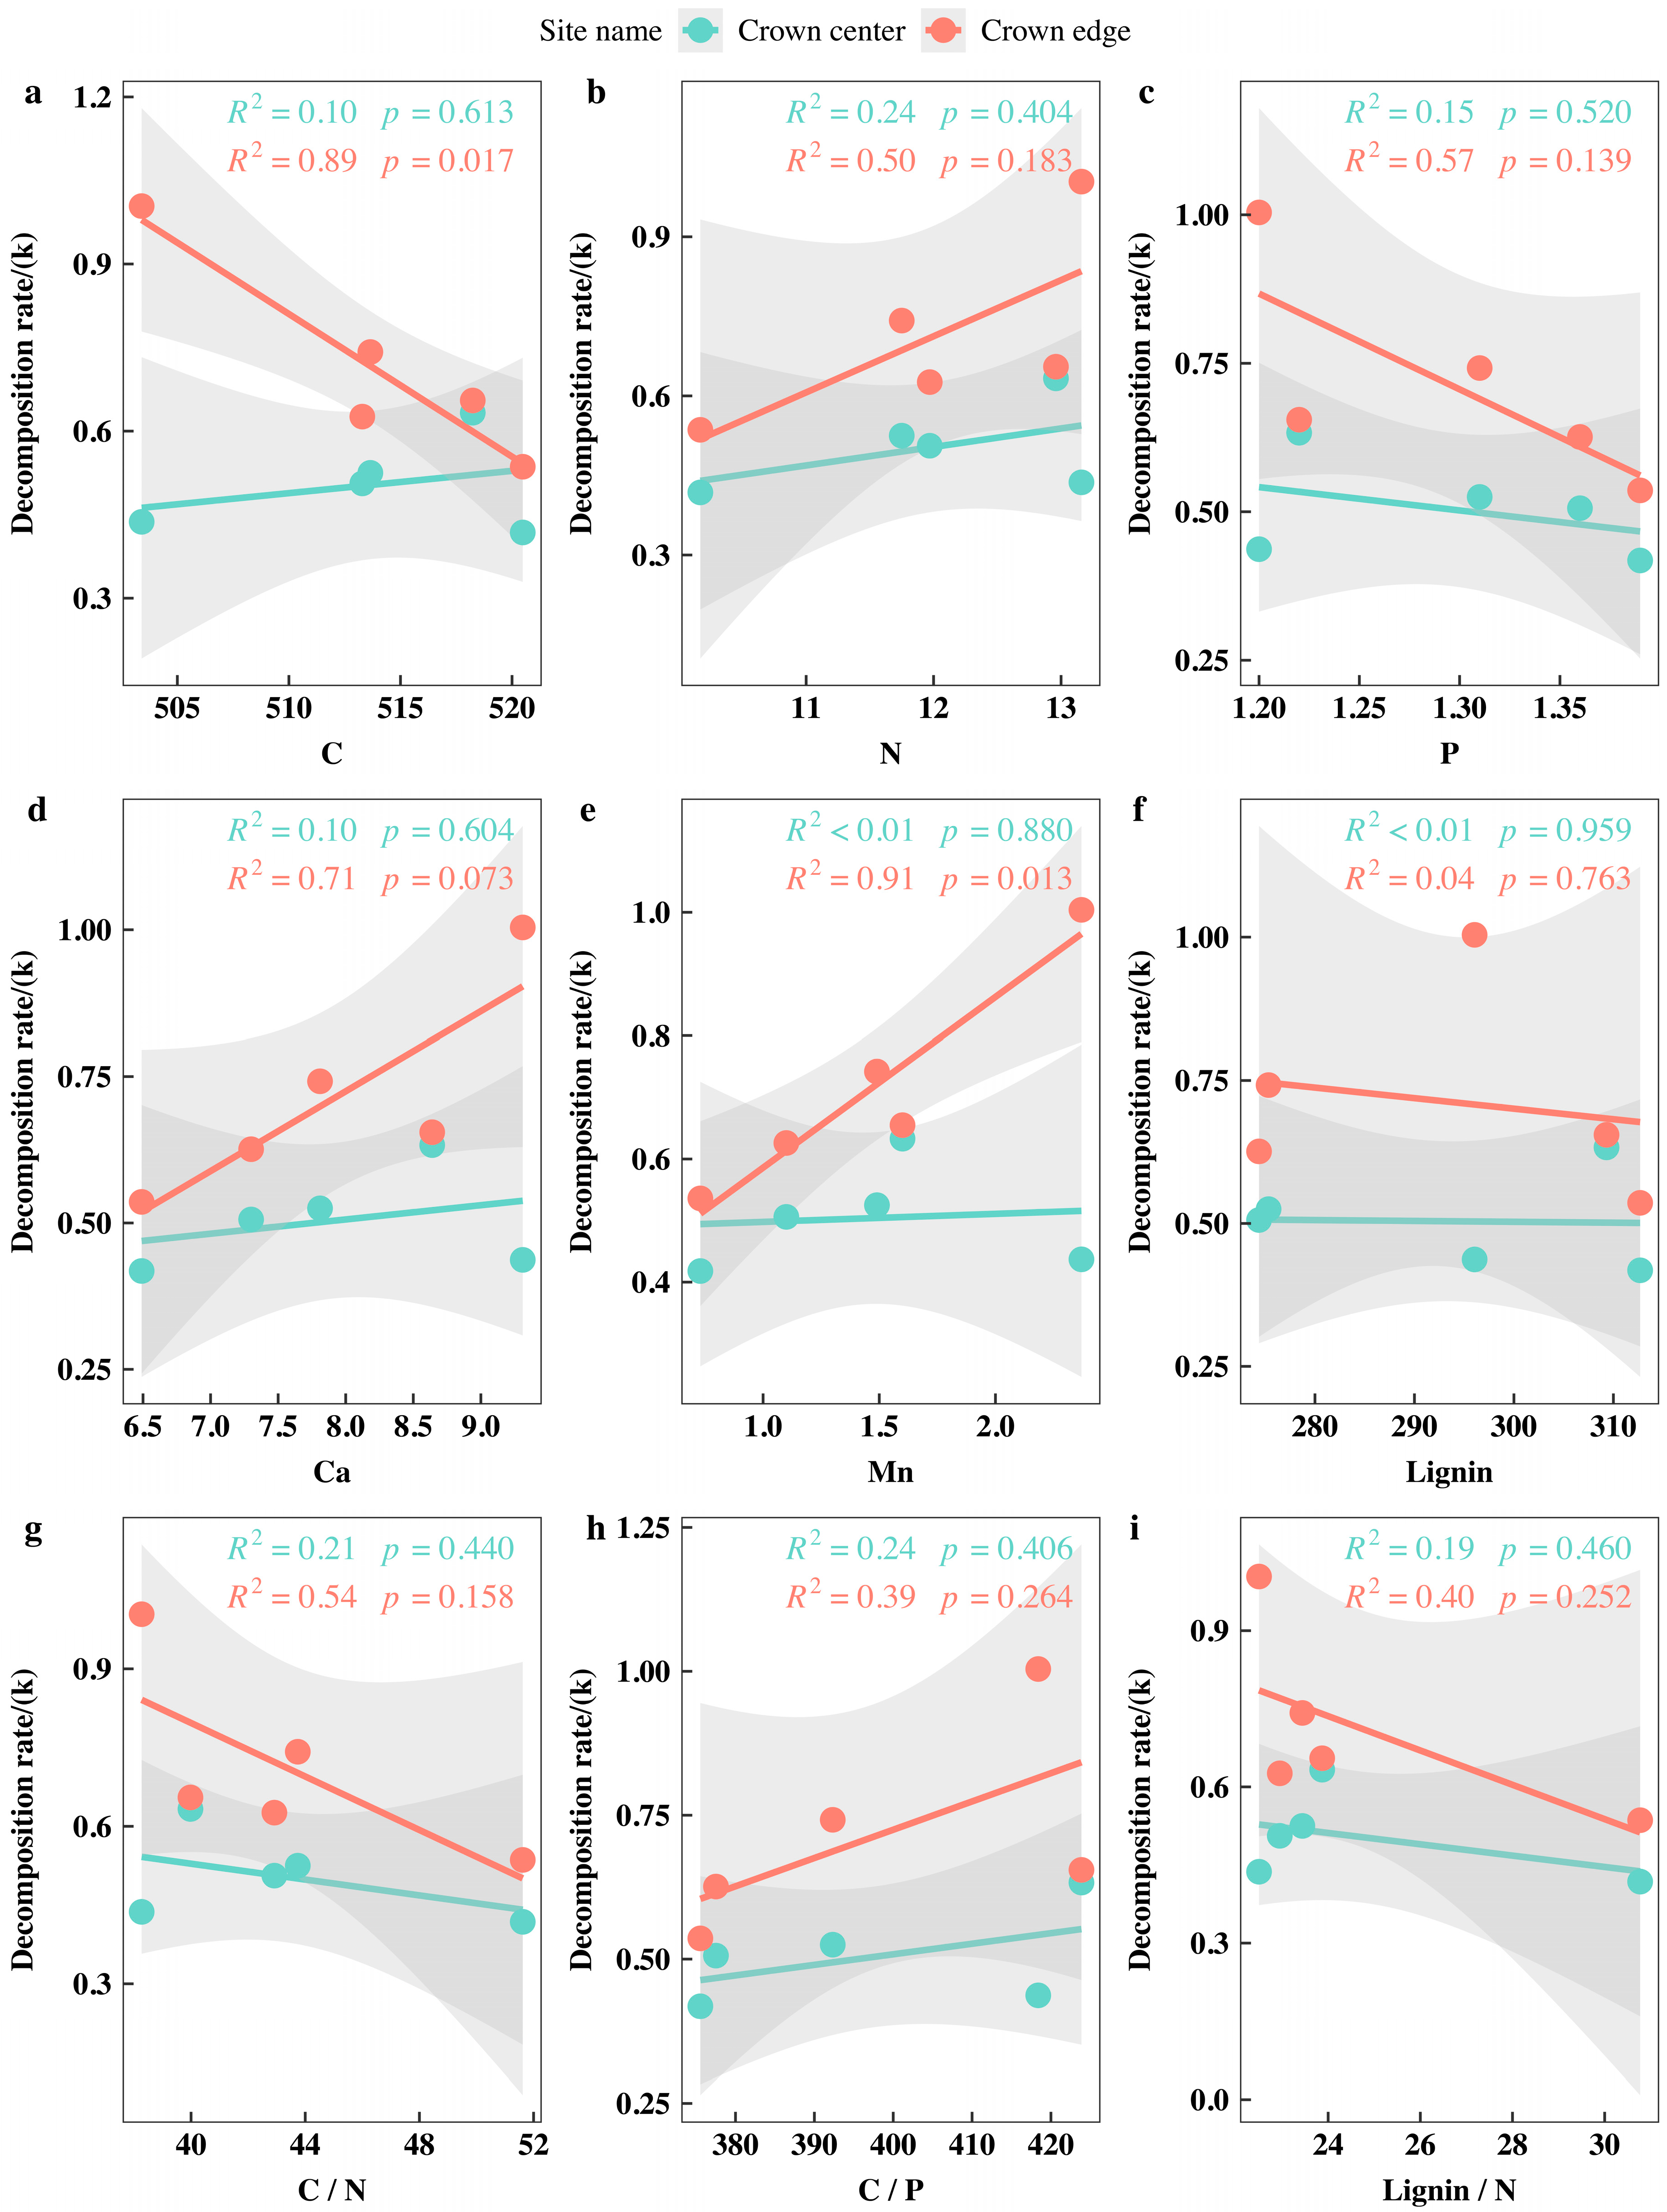
3.5. Correlations between the Initial Nutrient and Lignin Concentrations and Eco-Stoichiometric Ratios and the Initial Decomposition Rate (k)

The results indicate that the most significant correlations between initial nutrient values and initial decomposition rates (k) were the initial litter Ca and Mn concentrations (Figure 9d,e, p < 0.01), although relationships were also significant for N, P, and the eco-stoichiometric ratio C/N (Figure 9b,c,g, p < 0.05). Initial litter C and lignin concentrations, as well as the eco-stoichiometric ratios C/P and lignin/N, were not correlated significantly with initial decomposition rates (Figure 9a,f,h,i, p > 0.05). The relationships between initial litter N, Ca, and Mn concentrations, as well as the eco-stoichiometric ratio C/P, and initial decomposition rates were positive, whereas the relationships of initial decomposition rate with C, P, lignin, and the eco-stoichiometric ratios C/N and lignin/N were negative.
With Ca concentration having the most statistically significant correlation with the initial litter decomposition rate, it was possible to correlate the mass loss (%) at different time points for all sites to initial litter Ca concentration (Figure 10). The R2 of initial Ca concentration was low and not significant (p > 0.05) for samples taken at 30 and 60 days (Figure 10a,b), but the R2 value increased and was extremely significant (p < 0.01) for the 90-day samples when the accumulated mass loss had increased to the range 10.77%–15.92% (Figure 10c). Thereafter, the R2 value decreased, but it was relatively high and was significant (p < 0.05) for the 120-day samples when the accumulated mass loss had increased to the range 13.47%–19.29% (Figure 10d).
With Mn concentration having the most statistically significant correlation with the initial litter decomposition rate, it was possible to correlate the mass loss (%) at different time points for all sites to initial litter Mn concentration (Figure 11). The R2 of initial Mn concentration was low and not significant (p > 0.05) for samples taken at 30 days (Figure 11a), but the R2 value increased and was not significant (p > 0.05) for the 60-day samples when the accumulated mass loss had increased to the range 5.31%–10.79% (Figure 11b). Thereafter, the R2 value increased and was significant (p < 0.05) for the 90- and 120-day samples when the accumulated mass loss had increased (Figure 11c,d).
The results showed that the most significant correlation between the initial nutrient value and the initial decomposition rate (k) was found for the initial litter C and Mn concentrations at CE (Figure 12a,e, p < 0.05). The relationship between C concentration and initial decomposition rate was negative, and the relationship between Mn concentration and initial decomposition rate was positive, but there was no significant correlation at CC (Figure 12a,e, p > 0.05). The initial litter N, P, Ca, and lignin concentrations, as well as the eco-stoichiometric ratios C/N, C/P, and lignin/N, were not correlated significantly with initial decomposition rates, whether at CE or CC (Figure 12b–d,f,g–i, p > 0.05). However, Ca concentration gave a significance level of p = 0.073 at CE (Figure 12d). At CE, the relationship between the N and Ca concentrations, as well as the eco-stoichiometric ratio C/P, and the initial decomposition rate was positive (Figure 12b,d,h), while the relationship between the initial decomposition rate and P, lignin, and the eco-stoichiometric ratios C/N and lignin/N was negative (Figure 12c,f,g,i). At CC, the relationship between the C, N, Ca, and Mn concentrations, as well as the eco-stoichiometric ratio C/P, and the initial decomposition rate was positive (Figure 12a,b,d,e,h), while the relationship between the initial decomposition rate and P, lignin, the eco-stoichiometric ratios C/N and lignin/N was negative (Figure 12c,f,g,i).
With C concentration having the most statistically significant correlation with the initial decomposition rate of CE litter, it was possible to correlate the mass loss (%) at different time points for all CE and CC sites to initial litter C concentration (Figure 13). At CE, the R2 of initial C concentration was low and not significant (p > 0.05) for samples taken at 30 days (Figure 13a), but the R2 value increased and was significant (p < 0.05) for the 60-, 90-, and 120-day samples when the accumulated mass loss had increased (Figure 13b–d). However, at CC, the R2 < 0.01 and not significant (p > 0.05) for the samples collected at 30, 60, 90, and 120 days (Figure 13).
With Mn concentration having the most statistically significant correlation with the initial decomposition rate of CE litter, it was possible to correlate the mass loss (%) at different time points for all CE and CC sites to initial litter Mn concentration (Figure 14). At CE, the R2 of initial Mn concentration was low and not significant (p > 0.05) for samples taken at 30 and 60 days (Figure 14a,b), but the R2 value increased and was significant (p < 0.05) for the 90- and 120-day samples when the accumulated mass loss had increased (Figure 14c,d). However, at CC, the R2 < 0.01 and not significant (p > 0.05) for the samples collected at 30, 60, 90, and 120 days (Figure 14).

4. Discussion

4.1. Initial Nutrient Concentration

Figure 2 shows a weak negative correlation between C and Ca concentrations (R = −0.37). The C concentrations ranged from 503.40 to 520.48 mg·g−1, which indicates a maximum difference of 17.08 mg·g−1 between C concentrations, an amount that corresponds to and can be explained by the variation in the nutrients, of which Ca is a major one. We also found a weak positive correlation between C and lignin concentrations (R = 0.42, Figure 2), which we must assume was due to the fact that lignin is richer in C than the cellulosic components of the litter. Additionally, there was a significant positive correlation between C and P concentrations (p < 0.05). The reason may be that C and P dominate the plant cytoskeleton’s structure and life’s metabolic activities [30,31,32]. However, there was a significant negative correlation between N and P concentrations (p < 0.01). The above two results were in exact opposite agreement with Davey (2007), who reported this correlation from 20 common oaks (Quercus robur) [9].
The range of litter nutrient concentrations for each site enabled the characterization of a unique nutrient fingerprint for each site [9]. Leaf litter from site 3250 m had some of the lowest concentrations of N, Ca, and Mn but the highest concentrations of C, P, and lignin (Table 1). Litter from site 3050 m had some of the highest nutrient concentrations (Table 1), which indicates a more fertile soil (Figure 1). Therefore, litter from this site should have a high rate of decay, regardless of Mn and Ca concentrations (Figure 5 and Figure 6). In this study, the 3050 m site is a mid-altitude place with the best hydrothermal combination. Due to its location, the soil at the 3050 m site had a higher N concentration (Figure 1c), which might explain the high N concentration in the fallen leaves from Qinghai spruce at this site. At 3050 m, leaf litter Ca and Mn concentrations were relatively high (Table 1). At all locations, Ca and Mn showed a significant positive correlation with N (p < 0.001, Figure 2), and Ca showed a significant positive correlation with Mn (p < 0.001, Figure 2). However, Ca and Mn were significantly negatively correlated with P (p < 0.001, Figure 2). This highlights the view that, in response to changing leaf N and P status, differences in leaf mineral concentration Qinghai spruce from different altitudes are highly spatially specific. Furthermore, changes in soil pH may also induce mobility of Mn [9], resulting in differences in litter Mn concentration.

4.2. Initial Mass Loss Rates

The mass loss rates for Qinghai spruce leaf litter in this study were comparable to other findings on rates of Qinghai spruce litter decomposition. For instance, Li et al. (2021) also reported between 13.42% and 19.67% mass loss after 415 days of incubation of litter at different altitudes [19].
Initial mass loss rates for Qinghai spruce leaf litter at different altitudes were related significantly to initial concentrations of N, P, Ca, and Mn and the eco-stoichiometric ratio C/N (p < 0.05, Figure 9b–e,g), but not significantly to C, lignin, or the eco-stoichiometric ratios C/P and lignin/N (p > 0.05, Figure 9a,f,h,i). The initial C and lignin concentrations and the eco-stoichiometric ratio lignin/N were found to have negative correlations with the initial mass loss rates, but the differences were not significant (p > 0.05). This can explain that lignin is degraded more slowly in relatively N-rich leaf litter than in simple, less complex substrates [33]. This means that the litter decomposition rate with high lignin content is low. This is supported by the observations that the initial Ca and Mn concentrations were related positively to mass loss rates in the measurements at 90 and 120 days, and the differences were significant (p < 0.05, Figure 10c,d and Figure 11c,d). Most litter decomposition studies showed that higher N concentrations are often related to higher degradation in the early stage [12]. Although based on a single point (Figure 2), a significant positive relationship was identified between N concentration and initial decomposition rate (p < 0.05, Figure 9). In addition, P concentration was negatively correlated with initial decomposition rates, and the differences were significant (p < 0.05, Figure 9), but this was contrary to a previous study result of Davey et al., which may be caused by the different characteristics of the study subjects [9].
Of the nutrients analyzed, Ca and Mn concentrations were most highly correlated with the initial mass loss rate, including the mass loss at 90 and 120 days (Figure 10c,d and Figure 11c,d). This could be due to the role of Mn as a cofactor in Mn-peroxidase, an enzyme in the ligninase system [9,17,34], and Ca was a nutrient for decomposers. The fact that lignin concentration was negatively correlated with initial mass loss rates supports the positive relationship with Mn concentration. Mn-peroxidase is important for the degradation of humification products such as humic acid, fulvic acid, and humin [35]. It appears that the presence of Mn stimulates the production of Mn-peroxidase, which in turn stimulates litter decomposition. Similarly, similar phenomena were found in the study on CC and CE at different altitudes. The initial mass loss rate of Qinghai spruce leaf litter at CE was related significantly to the initial litter C and Mn concentrations (p < 0.05, Figure 12a,e), but not significantly to N, P, Ca, lignin, the eco-stoichiometric ratios of C/N, C/P, and lignin/N (p > 0.05, Figure 12b–d,f–i). However, the correlation coefficient (R2 = 0.71) between the initial Ca concentration and the initial mass loss rate was higher, but the difference was not significant (p > 0.05, Figure 12d). The initial mass loss rate of Qinghai spruce leaf litter at CC was not related significantly to the initial concentrations of C, N, P, Ca, Mn, and lignin or the eco-stoichiometric ratios C/N, C/P, and lignin/N (p > 0.05, Figure 12). The results shown in Figure 10b, Figure 11b, Figure 13b, and Figure 14b show also that the relationship between mass loss and Ca, Mn, and C concentrations improved after 60 days, with a stronger moderating effect on mass loss. Meanwhile, we realize that litter decomposition in the early stages is not ultimately determined by a single common factor, but rather the result of multiple factors working together in different orders and strengths [36,37]. The fact that Mn concentration is related to initial decomposition rates implies that lignin degradation is already essential in the early stages of decomposition. However, at the initial stage of this study, lignin did not show an overly strong correlation (Figure 9f and Figure 12f). Thus, Qinghai spruce litter decomposition does not appear to follow the three-stage model; that is, litter decomposition is related to N and P concentrations in the early stages, and in the late stages, the rate may be related to the degradation of lignin [38].
Reports show that Mn concentration is positively related to the decomposition of litter (broad-leaved trees) [39]. However, this is the first time that an effect of Mn has been reported for coniferous Qinghai spruce litter.

5. Conclusions

In this study, we studied the decomposition of Qinghai spruce leaf litter (with differences in substrate quality). Litter decomposition may be related to initial Mn concentration, which means that the degradation of lignin may have begun before the decomposition of cellulose compounds. Meanwhile, the decomposition of Qinghai spruce leaf litter was also related to initial C and Ca concentrations, which shows that in the Qinghai spruce forest ecosystems, the rate of litter decomposition is not ultimately determined by a common factor, but rather a multi-factor combination.

Author Contributions

Data curation, data analysis, writing—original draft preparation, J.G.; sampling collection, data curation, data analysis, B.Z.; sampling collection, J.T. and X.Z.; software, Y.T.; methodology, writing—reviewing and editing, funding acquisition, C.Z. All authors have read and agreed to the published version of the manuscript.

Funding

This work was financed by the Natural Science Foundation of Gansu Province, China (20JR5RE645) and the Forestry and Grassland Science and Technology Project of Gansu Province (2021kj072).

Institutional Review Board Statement

Not applicable.

Informed Consent Statement

Not applicable.

Data Availability Statement

All data are available within the article.

Acknowledgments

Thanks are extended to Bilian Zhou, Junkai Tian, and Xinning Zhao, who provided very helpful field support during the research process of the study. We thank Yuan Tang, who provided very useful software support in the data processing stage. We are grateful to Chuanyan Zhao for providing constructive feedback on the manuscript.

Conflicts of Interest

The authors declare no conflict of interest.

References

  1. Xu, S.; Liu, L.L.; Sayer, E.J. Variability of above-ground litter inputs alters soil physicochemical and biological processes: A meta-analysis of litterfall-manipulation experiments. Biogeosciences 2013, 10, 5245–5272. [Google Scholar] [CrossRef]
  2. Liu, X.; Lin, T.C.; Vadeboncoeur, M.A.; Yang, Z.; Chen, S.; Xiong, D.; Xu, C.; Li, Y.; Yang, Y. Root litter inputs exert greater influence over soil C than does aboveground litter in a subtropical natural forest. Plant Soil 2019, 444, 489–499. [Google Scholar] [CrossRef]
  3. Liu, X.; Zhang, Y.; Han, W.; Tang, A.; Shen, J.; Cui, Z.; Vitousek, P.; Erisman, J.W.; Goulding, K.; Christie, P.; et al. Enhanced nitrogen deposition over China. Nature 2013, 494, 459–462. [Google Scholar] [CrossRef] [PubMed]
  4. Sun, T.; Dong, L.; Mao, Z. Simulated atmospheric nitrogen deposition alters decomposition of ephemeral roots. Ecosystems 2015, 18, 1240–1252. [Google Scholar] [CrossRef]
  5. Maroušek, J.; Trakal, L. Techno-economic analysis reveals the untapped potential of wood biochar. Chemosphere 2022, 291, 133000. [Google Scholar] [CrossRef]
  6. Mcclaugherty, C.A.; Pastor, J.; Aber, J.D.; Melillo, J.M. Forest litter decomposition in relation to soil nitrogen dynamics and litter quality. Ecology 1985, 66, 266–275. [Google Scholar] [CrossRef]
  7. Upadhyay, V.P.; Singh, J.S. Nitrogen dynamics of decomposing hardwood leaf litter in a central himalayan forest. Soil Biol. Biochem. 1985, 17, 827–830. [Google Scholar] [CrossRef]
  8. Swift, M.J.; Heal, O.W.; Anderson, J.M. Decomposition in terrestrial ecosystems. Stud. Ecol. 1979, 5, 2772–2774. [Google Scholar] [CrossRef]
  9. Davey, M.P.; Berg, B.; Emmett, B.A.; Rowland, P. Decomposition of oak leaf litter is related to initial litter Mn concentrations. Can. J. Bot. 2007, 85, 16–24. [Google Scholar] [CrossRef]
  10. Krishna, M.P.; Mohan, M. Litter decomposition in forest ecosystems: A review. Energy Ecol. Environ. 2017, 2, 1–14. [Google Scholar] [CrossRef]
  11. Hu, Y.; Wu, F.; Wu, Q.; Kang, Z.; Yue, K.; Yang, Y.; Ni, X. Seasonal variations of non-structural carbohydrates in fresh litters of three dominant tree species in subtropical forests. Acta Ecol. Sin. 2022, 42, 1–10. [Google Scholar] [CrossRef]
  12. Berg, B.; Mcclaugherty, C. Plant Litter: Decomposition, Humus Formation, Carbon Sequestration; Springer: Heidelberg/Berlin, Germany, 2013. [Google Scholar] [CrossRef]
  13. Wang, Y.; Wang, H.; He, J.; Feng, X. Iron-mediated soil carbon response to water-table decline in an alpine wetland. Nat. Commun. 2017, 8, 15972. [Google Scholar] [CrossRef] [PubMed]
  14. Saito, Y.; Tsuchida, H.; Matsumoto, T.; Makita, Y.; Kawashima, M.; Kikuchi, J.; Matsui, M. Screening of fungi for decomposition of lignin-derived products from Japanese cedar. J. Biosci. Bioeng. 2018, 126, 573–579. [Google Scholar] [CrossRef] [PubMed]
  15. Ma, C.; Yin, X.; Kou, X.; Wang, Z.; Li, X.; Jiang, Y.; Wang, H.; Bernard, E.C. Effects of soil fauna on cellulose and lignin decomposition of plant litter in the Changbai Mountain, China. Environ. Entomol. 2019, 48, 592–602. [Google Scholar] [CrossRef]
  16. Eriksson, K.E.; Blanchette, R.A.; Ander, P. Microbial and Enzymatic Degradation of Wood and Wood Components; Springer: Heidelberg/Berlin, Germany, 1990. [Google Scholar] [CrossRef]
  17. Steffen, K.T.; Cajthaml, T.; Snajdr, J.; Baldrian, P. Differential degradation of oak (Quercus petraea) leaf litter by litter-decomposing basidiomycetes. Res. Microbiol. 2007, 158, 447–455. [Google Scholar] [CrossRef] [PubMed]
  18. Jia, B.R. Litter decomposition and its underlying mechanisms. Chinese J. Plant Ecol. 2019, 43, 648–657. [Google Scholar] [CrossRef]
  19. Li, N.; Zhao, C.; Hao, H.; Zang, F.; Chang, Y.; Wang, H.; Yang, J. Decomposition and its nutrients dynamic of Qinghai spruce leaf litter with elevation gradient in Qilian Mountains. Acta Ecol. Sin. 2021, 41, 4493–4502. [Google Scholar] [CrossRef]
  20. Zang, F.; Wang, H.; Zhao, C.; Nan, Z.; Wang, S.; Yang, J.; Li, N. Atmospheric wet deposition of trace elements to forest ecosystem of the Qilian Mountains, northwest China. Catena 2021, 197, 104966. [Google Scholar] [CrossRef]
  21. Li, N.; Zhao, C.; Zang, F.; Yang, J.; Hao, H.; An, J.; Zhang, M. Degradation dynamics of lignocellulose in the litterfall of Picea crassifolia in the Qilian Mountains. J. Lanzhou Univ. (Nat. Sci.) 2021, 57, 483–490. [Google Scholar] [CrossRef]
  22. Xie, H.; Ma, W.; Zhao, C.; Gao, Y.; Wang, Q.; Ge, H.; Lin, M.; Huang, H. Effects of litter and moss on soil respiration in a spruce forest in the Qilian Mountains, Qinghai. Acta Ecol. Sin. 2017, 37, 1379–1390. [Google Scholar] [CrossRef]
  23. Peng, S.; Zhao, C.; Xu, Z.; Ashiq, M.W. Restoration and conservation potential of destroyed Qinghai spruce (Picea crassifolia) forests in the Qilian Mountains of northwest China. Mitig. Adapt. Strat. Glob. Change 2016, 21, 153–165. [Google Scholar] [CrossRef]
  24. Gu, J.; Zhou, B.; Han, H.; Zhao, C. Temporal and spatial changes of microbial biomass in litter decomposition early process in Qinghai spruce (Picea crassifolia) forests. Acta Ecol. Sin. 2022, 43. [Google Scholar] [CrossRef]
  25. Briones, M.J.I. Soil fauna and soil functions: A jigsaw puzzle. Front. Environ. Sci. 2014, 2, 1–22. [Google Scholar] [CrossRef]
  26. Allen, S.E.; Grimshaw, H.M.; Parkinson, J.A.; Quarmby, C. Chemical analysis of ecological materials. J. Appl. Ecol. 1974, 13, 565–604. [Google Scholar] [CrossRef]
  27. Rowland, A.P.; Roberts, J.D. Lignin and cellulose fractions in decomposition studies using acid detergent fibre methods. Commun. Soil Sci. Plant Anal. 1994, 25, 269–277. [Google Scholar] [CrossRef]
  28. Wen, H.; Fu, H.; Guo, D. Influence of nitrogen addition on Stipa bungeana and Heteropappus altaicus litter decomposition and nutrient release in a steppe located on the Loess Plateau. Acta Ecol. Sin. 2017, 37, 2014–2022. [Google Scholar] [CrossRef]
  29. Olson, J.S. Energy storage and the balance of producers and decomposers in ecological systems. Ecology 1963, 44, 322–331. [Google Scholar] [CrossRef]
  30. Barantal, S.; Schimann, H.; Fromin, N.; Hattenschwiler, S. C, N and P fertilization in an Amazonian rainforest supports stoichiometric dissimilarity as a driver of litter diversity effects on decomposition. Proc. R. Soc. B 2014, 281, 20141682. [Google Scholar] [CrossRef]
  31. Liu, J.; Fang, X.; Deng, Q.; Han, T.; Huang, W.; Li, Y. CO2 enrichment and N addition increase nutrient loss from decomposing leaf litter in subtropical model forest ecosystems. Sci. Rep. 2015, 5, 7952. [Google Scholar] [CrossRef]
  32. Zhu, W.; Wang, J.; Zhang, Z.; Ren Fei Chen, L.; He, J. Changes in litter quality induced by nutrient addition alter litter decomposition in an alpine meadow on the Qinghai-Tibet Plateau. Sci. Rep. 2016, 6, 34290. [Google Scholar] [CrossRef]
  33. Berg, B.; Ekbohm, G. Litter mass-loss rates and decomposition patterns in some needle and leaf litter types. Long-term decomposition in a Scots pine forest. VII. Can. J. Bot. 1991, 69, 1449–1456. [Google Scholar] [CrossRef]
  34. Hatakka, A. Biodegradation of lignin. In Biopolymers, Vol. 1. Lignin, Humic Substances and Coal; Hofman, M., Stein, A., Eds.; Wiley: Weinheim, Germany, 2001; pp. 129–180. [Google Scholar] [CrossRef]
  35. Steffen, K.T.; Hatakka, A.; Hofrichter, M. Degradation of humic acids by the litter-decomposing basidiomycete Collybia dryophila. Appl. Environ. Microbiol. 2002, 68, 3442–3448. [Google Scholar] [CrossRef] [PubMed]
  36. Cornelissen, J.H.C. An experimental comparison of leaf decomposition rates in a wide range of temperate plant species and types. J. Ecol. 1996, 84, 573–582. [Google Scholar] [CrossRef]
  37. Prescott, C.E. Do rates of litter decomposition tell us anything we really need to know? For. Ecol. Manag. 2005, 220, 66–74. [Google Scholar] [CrossRef]
  38. Berg, B.; Matzner, E. Effect of N deposition on decomposition of plant litter and soil organic matter in forest systems. Environ. Rev. 1997, 5, 1–25. [Google Scholar] [CrossRef]
  39. Berg, B.; McClaugherty, C.; Virzo De Santo, A.; Johnson, D. Humus buildup in boreal forests: Effects of litter fall and its N concentration. Can. J. For. Res. 2011, 31, 988–998. [Google Scholar] [CrossRef]
Figure 1. Soil physical and chemical properties of each study plot. The changes in soil moisture (a), total phosphorus (b), total nitrogen (c), and soil organic carbon (d) in study sample areas. Notes: Capital letters express significance between CC and CE; lowercase letters indicate significance between altitudes (t-test, p < 0.05) [24].
Forests 13 01418 g001
Figure 2. Pearson’s correlation coefficient (r) between the initial chemical components of Qinghai spruce leaf litter (mg·g−1 DM) at different altitudes. Notes: Values are from bulk litter of each site. n = 15. *, p < 0.05; **, p < 0.01; ***, p < 0.001.
Forests 13 01418 g002
Figure 3. Initial mass loss rate (%) of Qinghai spruce leaf litter at different altitudes in the growing season. Notes: Values are from bulk litter of each site. n = 30. *, p < 0.05; **, p < 0.01; ***, p < 0.001.
Forests 13 01418 g003
Figure 4. Initial mass loss rate (%) of Qinghai spruce leaf litter from CC and CE at different altitudes in the growing season. (a) Represents the initial mass loss rate (%) of Qinghai spruce leaf litter in 2850m CC and CE plots. (b) Represents the initial mass loss rate (%) of Qinghai spruce leaf litter in 2950m CC and CE plots. (c) Represents the initial mass loss rate (%) of Qinghai spruce leaf litter in 3050m CC and CE plots. (d) Represents the initial mass loss rate (%) of Qinghai spruce leaf litter in 3150m CC and CE plots. (e) Represents the initial mass loss rate (%) of Qinghai spruce leaf litter in 3250m CC and CE plots. Notes: Values are from bulk litter of CC and CE sites. n = 5. **, p < 0.01; ***, p < 0.001.
Forests 13 01418 g004
Figure 5. Initial decomposition rate (g·day−1) of Qinghai spruce leaf litter at different altitudes in the growing season. Notes: Values are from bulk litter of each site. n = 30. *, p < 0.05; **, p < 0.01; ***, p < 0.001.
Forests 13 01418 g005
Figure 6. Decomposition model of Qinghai spruce leaf litter at different altitudes in the growing season.
Forests 13 01418 g006
Figure 7. Initial decomposition rate (g·day−1) of Qinghai spruce leaf litter from CC and CE at different altitudes in the growing season. (a) Represents the initial decomposition rate of Qinghai spruce leaf litter in 2850m CC and CE plots. (b) Represents the initial decomposition rate of Qinghai spruce leaf litter in 2950m CC and CE plots. (c) Represents the initial decomposition rate of Qinghai spruce leaf litter in 3050m CC and CE plots. (d) Represents the initial decomposition rate of Qinghai spruce leaf litter in 3150m CC and CE plots. (e) Represents the initial decomposition rate of Qinghai spruce leaf litter in 3250m CC and CE plots. Notes: Values are from bulk litter of CC and CE sites. n = 5. NS., p > 0.05; **, p < 0.01; ***, p < 0.001.
Forests 13 01418 g007
Figure 8. Decomposition model of Qinghai spruce leaf litter from CC and CE at different altitudes in the growing season.
Forests 13 01418 g008aForests 13 01418 g008b
Figure 9. Relationships between the initial concentrations of some major nutrients, lignin, and eco-stoichiometric ratios in leaf litter (mg·g−1 DM) taken from different altitude Qinghai spruce sites shown with the initial decomposition rate (k). (a) The relationship between C concentration and the initial decomposition rate of litter. (b) The relationship between N concentration and the initial decomposition rate of litter. (c) The relationship between P concentration and the initial decomposition rate of litter. (d) The relationship between Ca concentration and the initial decomposition rate of litter. (e) The relationship between Mn concentration and the initial decomposition rate of litter. (f) The relationship between lignin concentration and the initial decomposition rate of litter. (g) The relationship between eco-stoichiometric ratio C/N and the initial decomposition rate of litter. (h) The relationship between eco-stoichiometric ratio C/P and the initial decomposition rate of litter. (i) The relationship between eco-stoichiometric ratio lignin/N and the initial decomposition rate of litter.
Forests 13 01418 g009
Figure 10. Linear relationships between initial litter Ca concentration and accumulated mass loss for each sampling day. (a) The linear relationship between initial litter Ca concentration and accumulated mass loss in 30 days. (b) The linear relationship between initial litter Ca concentration and accumulated mass loss in 60 days. (c) The linear relationship between initial litter Ca concentration and accumulated mass loss in 90 days. (d) The linear relationship between initial litter Ca concentration and accumulated mass loss in 120 days.
Forests 13 01418 g010
Figure 11. Linear relationships between initial litter Mn concentration and accumulated mass loss for each sampling day. (a) The linear relationship between initial litter Mn concentration and accumulated mass loss in 30 days. (b) The linear relationship between initial litter Mn concentration and accumulated mass loss in 60 days. (c) The linear relationship between initial litter Mn concentration and accumulated mass loss in 90 days. (d) The linear relationship between initial litter Mn concentration and accumulated mass loss in 120 days.
Forests 13 01418 g011
Figure 12. Relationships between the initial concentrations of some major nutrients, lignin, and eco-stoichiometric ratios in leaf litter (mg·g−1 DM) taken from different altitude CC and CE of Qinghai spruce sites shown with the initial decomposition rate (k). (a) The relationship between C concentration and the initial decomposition rate of litter. (b) The relationship between N concentration and the initial decomposition rate of litter. (c) The relationship between P concentration and the initial decomposition rate of litter. (d) The relationship between Ca concentration and the initial decomposition rate of litter. (e) The relationship between Mn concentration and the initial decomposition rate of litter. (f) The relationship between lignin concentration and the initial decomposition rate of litter. (g) The relationship between eco-stoichiometric ratio C/N and the initial decomposition rate of litter. (h) The relationship between eco-stoichiometric ratio C/P and the initial decomposition rate of litter. (i) The relationship between eco-stoichiometric ratio lignin/N and the initial decomposition rate of litter.
Forests 13 01418 g012
Figure 13. Linear relationships between initial litter C concentration and accumulated mass loss for each sampling day of CC and CE. (a) The linear relationship between initial litter C concentration and accumulated mass loss in 30 days. (b) The linear relationship between initial litter C concentration and accumulated mass loss in 60 days. (c) The linear relationship between initial litter C concentration and accumulated mass loss in 90 days. (d) The linear relationship between initial litter C concentration and accumulated mass loss in 120 days.
Forests 13 01418 g013
Figure 14. Linear relationships between initial litter Mn concentration and accumulated mass loss for each sampling day of CC and CE. (a) The linear relationship between initial litter Mn concentration and accumulated mass loss in 30 days. (b) The linear relationship between initial litter Mn concentration and accumulated mass loss in 60 days. (c) The linear relationship between initial litter Mn concentration and accumulated mass loss in 90 days. (d) The linear relationship between initial litter Mn concentration and accumulated mass loss in 120 days.
Forests 13 01418 g014
Table 1. Initial chemical composition of leaf litter (mg·g−1 dry mass (DM)) for each Qinghai spruce site (mean ± SE, level = 0.05).
Site (Altitude (m))Concentration (mg·g–1 DM)Eco-Stoichiometric Ratio
CNPCaMnLigninC/NC/PLignin/N
2850513.29 ± 3.66 ab11.97 ± 0.27 b1.36 ± 0.02 ab7.30 ± 0.12 d1.10 ± 0.08 c274.38 ± 1.75 c42.92 ± 0.68 b377.52 ± 3.34 c22.95 ± 0.40 b
2950513.65 ± 3.07 ab11.75 ± 0.16 b1.31 ± 0.03 b7.81 ± 0.11 c1.49 ± 0.03 b275.34 ± 1.53 c43.74 ± 0.32 b392.33 ± 5.85 bc23.44 ± 0.18 b
3050503.40 ± 2.44 b13.16 ± 0.29 a1.20 ± 0.01 c9.31 ± 0.15 a2.37 ± 0.10 a296.05 ± 3.37 b38.27 ± 0.66 c418.39 ± 3.03 ab22.50 ± 0.25 b
3150518.24 ± 6.49 a12.96 ± 0.23 a1.22 ± 0.03 c8.64 ± 0.21 b1.60 ± 0.08 b309.31 ± 2.87 a39.98 ± 0.21 c423.87 ± 4.94 a23.87 ± 0.29 b
3250520.48 ± 2.89 a10.17 ± 0.34 c1.39 ± 0.03 a6.49 ± 0.14 e0.73 ± 0.06 d312.69 ± 7.43 a51.26 ± 1.46 a375.54 ± 5.10 c30.77 ± 0.79 a
Notes: Values are from bulk litter from each site. Lowercase letters indicate the significance between the initial litter chemical components in different sites (t-test, p < 0.05) [24].
Publisher’s Note: MDPI stays neutral with regard to jurisdictional claims in published maps and institutional affiliations.

