Article

Variation in Water Uptake Dynamics of Dominant Wood Plants of Pinus taiwanensis Hayata Communities Based on Stable Isotopes

1
Lushan National Observation and Research Station of Chinese Forest Ecosystem, Key Laboratory of National Forestry and Grassland Administration on Forest Ecosystem Protection and Restoration of Poyang Lake Watershed, Jiangxi Agricultural University, Nanchang 330045, China
2
Jiangxi Lushan National Nature Reserve Administration, Jiujiang 332900, China
3
Key Laboratory of Soil and Water Conservation and Desertification Combating of Ministry of Education, Beijing Forestry University, Beijing 100083, China
*
Author to whom correspondence should be addressed.
Forests 2022, 13(8), 1336; https://doi.org/10.3390/f13081336
Submission received: 29 June 2022 / Revised: 5 August 2022 / Accepted: 17 August 2022 / Published: 22 August 2022

Abstract

:
Plant community formation is determined by plant competition, while the water uptake depth of vegetation is regarded as a critical factor in maintaining species coexistence under competition. However, the source variation of montane plant water uptake remains poorly understood, especially under the condition of climate change. We introduced stable hydrogen and oxygen isotopes to investigate the water uptake pattern of the trees and shrubs in a Pinus taiwanensis Hayata community in subtropical mountains. The results showed that the main sources of water uptake in plants varied with soil water content, due to variations in annual precipitation distribution. In July and September, under extremely wet conditions, the evergreen conifer species P. taiwanensis and the shrub Eurya muricata mainly absorbed water from the deep soil layer (40–80 cm, more than 70%). By contrast, the deciduous shrub Rhododendron dilatatum largely relied on upper soil water (0–40 cm, 75.4%) in July but the same deep water source in September. In August and the non-growing season (January), when soil moisture content was low, plants preferred surface layer soil water (0–20 cm, above 50%). In October, the soil water in the middle (20–40 cm) and deep layers (40–80 cm) were the main water source of the three plants. However, the plant water sources showed great difference between P. taiwanensis and shrubs in November: P. taiwanensis absorbed more water from the soil surface layers (89.5%), while R. dilatatum mainly took up surface soil water (54.2%) and E. muricata predominantly obtained water from surface soil water (49.6%) and the deep soil layer (39.3%). These findings suggest that the water uptake of dominant woody plants in a P. taiwanensis community has great plasticity, and its water uptake depth varies with soil water content. In addition, these co-existing species generally absorbed water from similar soil layers in the P. taiwanensis community and exhibited a hydrological niche overlap, indicating a very possible competition between species in future water-limited conditions caused by climate change.

1. Introduction

Water is the main limiting factor in the distribution and development of terrestrial ecosystems [1,2]. Climate brings a series of impacts and challenges to terrestrial ecosystems in the context of globalization characterized by climate warming and precipitation pattern change [3]. Comparatively, mountain ecosystems are more sensitive to global change, as well as being more susceptible and having more difficulty recovering [4,5]. Montane ecosystems are sentinels of the response of ecosystems to global change. The study of water sources and utilization characteristics of montane forest ecosystems is of great significance for understanding and shaping the evolution of the global water cycle in the background of climate change.
Montane coniferous forests are of particular importance to the local hydrological cycle because of their important effects on rainfall interception, redistribution, soil water storage, evapotranspiration, and runoff [6,7]. A reduction of available water for montane vegetation will result in damage to the health of these forests and an increase in the incidence of forest fires, which then affects the annual water budget [8,9,10,11]. Montane environments are highly heterogeneous and anisotropic in soil and bedrock geology. Often, there are large differences in soil depths and resulting subsurface storage capacities due to complex terrain and glacially formed landscape features, which impact available water during the growing season [12,13,14]. The root structure of montane forests is highly dependent on this subsurface structure, with limited root depth due to shallow soils, or with limited access to groundwater due to bedrock fractures. Many studies have explored the relationship between root water uptake and rooting depth in horizontal landscapes [15,16,17,18], but few have investigated these processes of different species within montane forest communities.
Stable isotope analyses of plant xylem water and various potential water sources make it possible to identify the problems concerning plant water uptake [19,20,21,22,23]. By contrasting the isotopic characteristics of each source, many of these studies concluded that plant roots accessed water from a variety of sources [24]. For example, subalpine trees, Abies lasiocarpa (Subalpine fir) and Picea engelmannii (Engelmann spruce) in the Canadian Rocky Mountains absorb water from different water sources, based on seasons and their corresponding availability [24]. Isotopically different vegetation water of co-existing species has also indicated niche segregation of water uptake in mixed stands [25,26].
Due to limited growing season length and groundwater availability, montane forests heavily rely on limited soil moisture to maintain evapotranspiration [24,27,28,29]. Existing literature suggests that the coexistence of fir and spruce forests is also a rare phenomenon in the future due to increasing droughts and decreasing soil water storage. This water limitation restricts tree-line advancement to higher elevations and finally the forest population growth [24]. Current research on montane forest species mainly focused on physiological and biological differences arising from altitude, climate [30,31], and species management [32]; however, there is little on evapotranspiration and water use in montane coniferous forests. The P. taiwanensis forest is a typical montane coniferous forest ecosystem in a subtropical region, which plays an extremely important role in ecological hydrology. Facing the challenge of climate change, the water use strategy toward different species (P. taiwanensis, E. muricata, and R. dilatatum) in community affects their coexistence and succession. Therefore, to improve the current incomplete understanding of water use in subtropical montane forests, this study was designed to identify and describe water use in montane forests based on hydrogen and oxygen stable isotope analysis and finally achieve three main objectives: (1) to determine the montane forest water source in rainy and dry seasons; (2) to distinguish the relative source water contribution of the xylem water of different species in a P. taiwanensis community by using Bayesian mixed model; and (3) to evaluate hydrological niche partitioning of different species with respect to resource use in the long term.

2. Materials and Methods
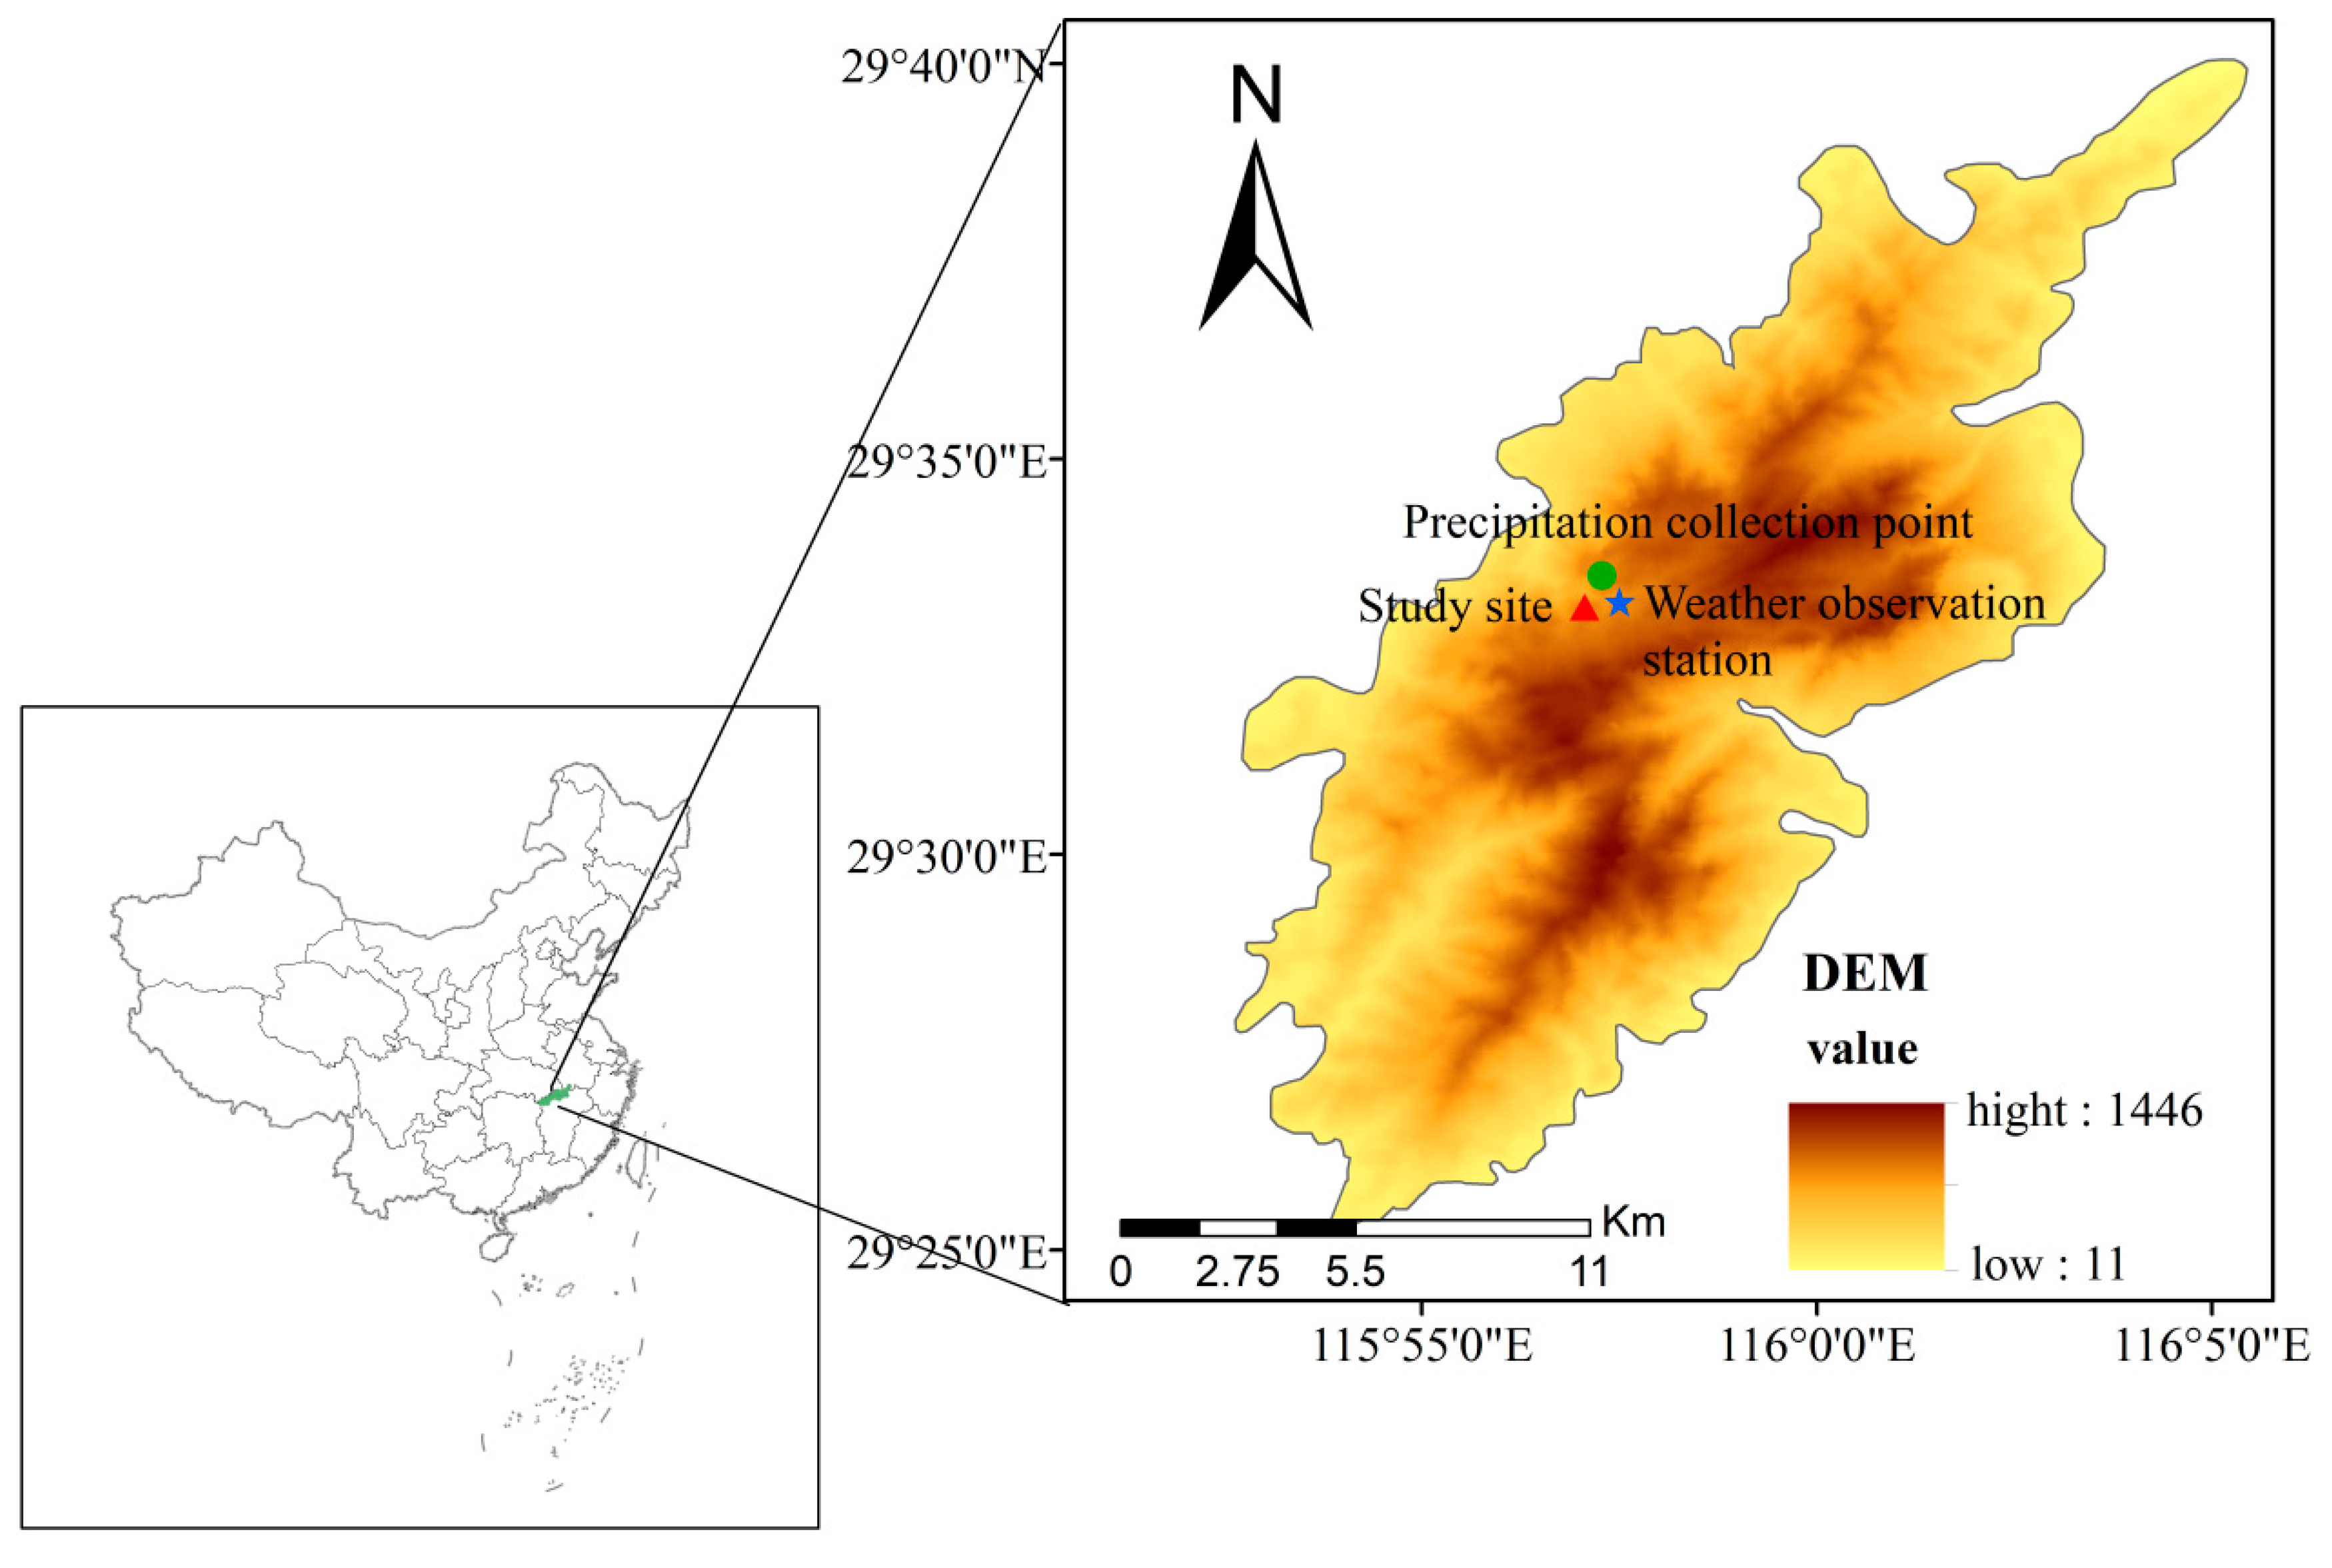
2.1. Study Site

This study was conducted at the Lushan Forest Ecosystem Positioning Observation Station of the China Terrestrial Ecosystem Research Network (CTERN) in Lushan Nature Reserve, Jiujiang City, Jiangxi Province, China (Figure 1) (115°51′~116°07′ E, 29°30′~29°41′ N), with elevations ranging from 30 to 1474 m [33]. It is a subtropical monsoon climate region, with an average annual temperature of 11.6 °C and an average annual precipitation of 2070 mm. According to Chen et al. [34], the rainfall in Lushan was mainly in the rainy season (April to September, 1486.71 mm). The Lushan frost period lasts up to 150 days, with an annual average of 191 foggy days.
Lushan is located in the vast plain of the middle and lower reaches of the Yangtze River, and surrounded by Poyang Lake. Complex terrain and special climatic conditions contribute to richly bio-diversified habitats [35]. At the low altitude (50–600 m) of Lushan Mountain are evergreen forests, dominated by a considerable number of Fagaceae tree species, with some shrubs and evergreen woodland species; at the middle and high altitudes (600–1100 m) are the dominated vegetation including Moso bamboo, P. taiwanensis, and Cryptomeria japonica (L. f.) D. Don (introduced about 50 years ago; at higher elevations (>1100 m) are only sporadic woody broadleaf and conifers species, most of which are deciduous shrubs [33,35]. Although coniferous forests are at medium and high altitudes, there grow the most representative coniferous species of Cryptomeria japonica and Pinus taiwanensis yet [36]. Within the depth interval of 0–80 cm of the soil profile, the soil bulk density ranges from 0.83 to 1.45 g/cm3 and increases with depth, while the soil porosity ranges from 42.17% to 60.24% and decreases with depth. The soil texture is silty clay loam, with an average organic matter content of 36.32 g/kg. Originating from afforestation in barren hills, Lushan Mountain is poor in soil and barren in rock [37].

2.2. Experimental Design and Sample Collection

Three 10 m × 10 m fixed plots (29°33′31″ N, 115°57′46″ E) of a P. taiwanensis community were selected at the altitude of 1096 m in Lushan Mountain. These plots for each species were close to each other to ensure that the microenvironment of each plot was consistent, including soil condition and micro-geomorphology. Three tree species in this typical community were selected as our research objects, evergreen and main species Pinus taiwanensis, evergreen shrub species Eurya muricata and deciduous shrub Rhododendron dilatatum. Among them, R. dilatatum is the species with a growth period from March to November. Detailed information is shown in Table 1 and Figure 1. All the plants studied herein are three representative specimens collected and preserved in JXAU (Tree Herbarium in College of Forestry, Jiangxi Agricultural University), first identified in the wild by Dr. M. Tang, a teacher of plant taxonomy from the College of Forestry of Jiangxi Agricultural University and then confirmed by checking ‘Flora of China’ in terms of their species identity.
In order to verify the variation in the seasonal water sources of plants, we selected the typical months in rainy and dry seasons in the Lushan area for continuous sampling in 2020. The sampling time is from July to December 2020, during which sampling was suspended in December due to heavy snow but continued in January of the following year as a supplement. During each sampling, three P. taiwanensis sample trees with anaverage height and diameter at breast height (and not affected by artificial interference) were chosen and then three mature and suberized branches with a length of 2–5 cm and a diameter of 0.2–0.5 cm were selected from each tree [38]. E. muricata and R. dilatatum were selected from the sample trees and obtained under the same procedure. Soil samples were selected from the same land growing the sample trees. There were five layers of soil samples (0–10, 10–20, 20–40, 40–60, 60–80 cm) (due to fertile soil and more diverse rock types in the deep layer). The collected soil samples were divided into two parts, one for drying method (drying at 105 °C for 24 h, respectively) to determine moisture content, and the other for rapid cryopreservation after sealing with parafilm [39]. The particle size distribution of the soil is shown in Table 2, soil particle size was measured using a Malvern Mastersizer 3000 (Malvern Panalytical, London, UK) laser diffractometer.

2.3. Sample Analysis and Calculation

Meteorological data acquisition was based on the fixed meteorological observation tower, which was established at Lushan Forest Ecosystem Positioning Observation Station, 0.5 km away from the sample site and China Meteorological Data Network (https://data.cma.cn/, 15 January 2021, Lushan Station). A polyethylene plastic bottle and funnel were used to collect precipitation, and a plastic ball was put on the funnel to prevent rainwater from evaporation. Precipitation samples were collected at Lushan Guling Protection Station, 3 km away from the sample site, and rainfall was collected at 8:00 (Beijing Time) every day from June to November, with a final total of 48 samples collected. The collected precipitation samples were immediately packed in 30 mL plastic bottles. All the isotope samples were sealed with parafilm after collection, and quickly transported back to the laboratory with refrigerators or ice bags. Plants, soil samples, and precipitation were all in cryopreservation at −4 °C.
Soil moisture content samples were processed by the drying method, and then immediately taken back to the laboratory every month, with a final total of 90 samples. According to the Nielson classification system, a coefficient of variation, CV, between 10% and 100% is medium, CV ≤ 10% is weak, and CV ≥ 100% is strong [40]. Thus, the coefficient of variation was calculated as:
C V = ( Standard deviation Average value ) × 100 %
In our study, the FAO Penman–Monteith method was adopted to estimate the potential evapotranspiration in Lushan Mountain, specifically expressed as [41]:
E T P = 0.408 Δ ( R n G ) + γ 900 T a + 27 u 2 V P D Δ + γ ( 1 + 0.34 u 2 )
where ETP is the reference potential evapotranspiration (mm/d), Rn is the net radiation [MJ/(m·d)], G is the soil heat flux [MJ/(m·d)], γ is the psychrometer constant, Ta is the daily average air temperature at 2 m (°C), u2 is the wind speed at 2 m (m/s), VPD is vapor pressure deficit (kpa), and Δ is the slope of the vapor pressure curve (kpa/p).
Soil water and plant xylem water were extracted using a cryogenic vacuum distillation system (LI-2000, LICA United Technology Limited, Beijing, China) to yield samples of soil water and twig xylem water (water extraction rate of ~99%) for stable isotopic analysis. The low temperature extraction of soil and plant samples lasted more than 2.5 h to ensure a complete removal [42,43]. Prior to this, we removed the phloem of three plants in order to avoid isotopic fractionation of xylem water and contamination by isotopic enriched water, respectively. After extraction, the obtained water (1–2 mL) was filtered (0.22 μm), and hydrogen and oxygen isotope analysis was performed using an elemental analyzer (Thermo Scientific Flash 2000 HT) coupled with an isotope ratio mass spectrometer (IRMS, Delta v Advantage) with a total of 144 samples. Briefly, the filtered water sample was transferred into a 1.5 mL glass bottle and loaded into the sample tray of the autosampler AS-300. A microinjector (0.5 μL, Thermo Scientific) on the autosampler automatically aspirated 0.2 μL of the water sample and injected it into the pyrolysis furnace of the elemental analyzer. Then, water rapidly reacted at a high temperature of 1380 °C to generate H2 and CO. The H2 and CO were driven by a He gas flow with a flow speed of 110 mL/min, which were dehydrated by a desiccant and separated by chromatographic column. Finally, hydrogen and oxygen isotopic composition analysis was carried out in an isotope ratio mass spectrometer. Extracting water from plant tissues using cryogenic vacuum distillation can co-distill organic materials (e.g., ethanol and methanol), but that would not affect the measurement results of the IRMS method, respectively [42]. In addition, high-purity CO, H2, and CO were introduced as reference gases at the initial stage of analysis of each sample during sample measurement. Then, the standard materials with known δ2H and δ18O were used to calibrate the δ value of the reference gas and then use the calibrated δ value of the reference gas to calibrate the δ value in the sample. Data processing and analysis were performed by Isodat 3.0 software (Thermo Scientific, Waltham, MA, USA). Regularly collected rainwater was also filtered and measured in the machine, with a total of 48 (June to November) [44], an analysis error δD of less than 0.4‰, and δ18O of less than 0.15‰. The measured hydrogen and oxygen isotope ratio in water samples is a thousand difference from the standard average oceanic water (SMOW), which is expressed as [45]:
δ X = ( R s a m p l e / R s t a n d a r a 1 ) × 1000
where Rsample and Rstandard represent the isotope ratio of the samples and the Vienna Standard Mean Ocean Water, respectively.
The isotope composition characteristics of different water sources were analyzed by mathematical statistics. When plants had multiple potential water sources, the isotope characteristics of lignified branches of plants were the mixture of isotope characteristics of multiple water sources [46]. The intersection between the vertical line of the xylem water isotope and the horizontal line of the soil water isotope could roughly determine the water source of the plant [47]. However, this graphical inference method was used as a preliminary judgment of the main water sources of plants. To quantify the proportion of soil water contribution to plants, the MixSIAR Bayesian mixing model was used in this calculation, since it integrated uncertainties related to multiple sources and discrimination factors [48]. The xylem isotope values δD and δ18O of three trees species were used as mixture data inputs into MixSIAR, meantime, the averages and standard errors of isotope values (δD and δ18O) from various soils layers (0–10, 10–20, 20–40, 40–60, and 60–80 cm) were used as source data and input into MixSIAR. The source data had no concentration dependence. Individual effects as a random occurrence were included in all analyses. The discrimination data were set to zero for both δD and δ18O because isotopic fractionation did not occur during plant water uptake, such as isotopic characteristics and available sources, the details of which are provided in Wang et al. [42]. Besides, the model was also adopted to examine the δD and δ18O values of the three potential xylem water sources, namely, the surface soil layer (0–20 cm), middle soil layer (20–40 cm), and deep soil layer (40–80 cm), thus reducing experimental error and increasing the accuracy of calculation [42]. For the convenience of subsequent description and comparison, we also define the upper soil layer (0–40 cm) and used it uniformly throughout the text, respectively.
All data analyses in this paper were analyzed in the SPSS 16.0 software, which was developed by Norman H. Nie, C. Hadlai (Tex) Hull and Dale H. Bent. at Stanford University (IBM/SPSS, Chicago, IL, USA), and the differences in soil moisture content between soil layers and between months were all analyzed with One-way ANOVA, and multiple comparisons were performed by Duncan’s method. Before ANOVA analysis, the data were tested for normal distribution and homogeneity of variance, and the results showed that the data met the requirement of variance test. Calculation of the moisture source was performed in R studio 3.5.0, and our mapping was done in Origin 2017.

3. Results

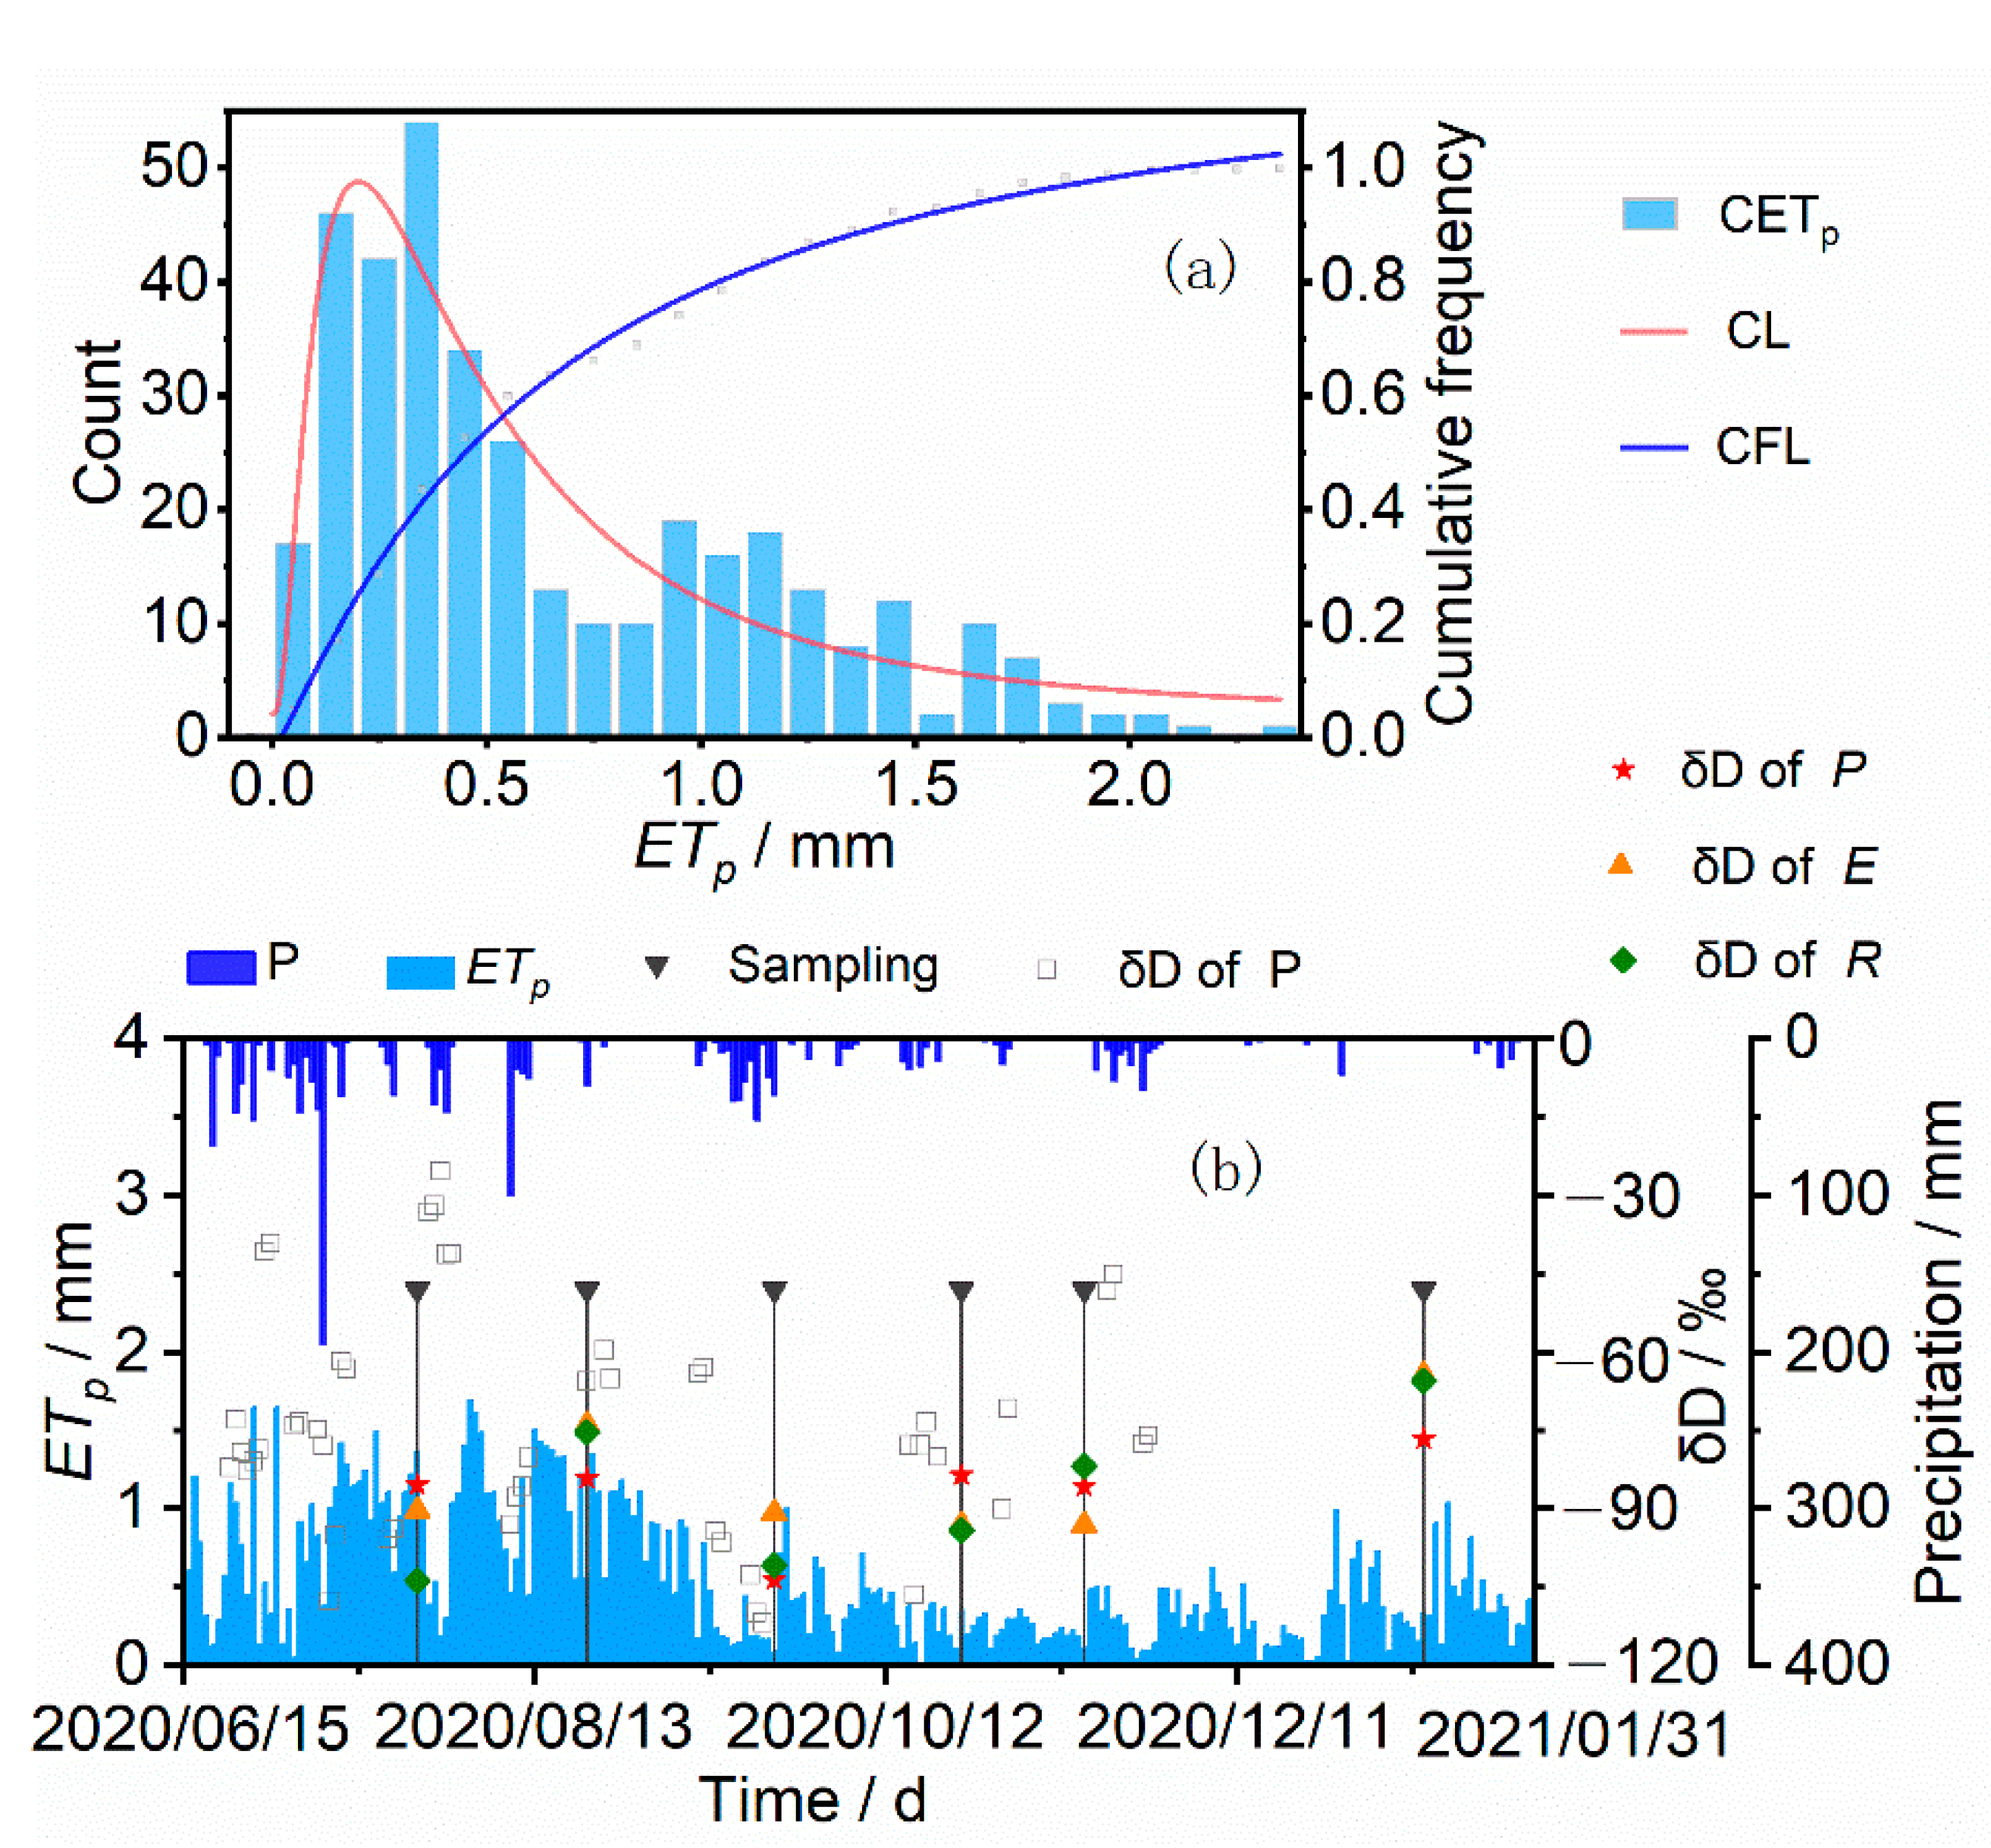
3.1. Variations of Rainfall and Soil Water Content

The distribution of precipitation was uneven throughout the whole year of 2020, with the rainfall of 2732.0 mm, 777.0 mm more than the mean annual rainfall (1955–2020), and the average temperature of 12.51 °C. The maximum rainfall happened on 8 July 2020, exactly 194.8 mm, and the maximum monthly rainfall occurred in July, 145.8% of the average in the same month of the previous years. Moreover, the rainfall in September increased to 104.8% of the amount in the same period of last year. By contrast, the average maximum air temperature appeared in August (23.08 °C) (Figure 2).
The potential evapotranspiration (ETp) range of Lushan Mountain in 2020 was 0.02–2.34 mm, and 50% of the daily ETp was less than 0.4 mm/d. The frequency accumulation curve of potential evapotranspiration also shows that in Lushan occurred a considerable number of low evaporative water consumptions in the year (Figure 3a). Combining the results in the sampling periods of isotopic precipitation, soil and plants, we found that high ETp mainly occurred in the rainy season, while low ETp mostly appeared in the low temperature dry season (Figure 3b). It is worth noting that even in high temperature and rainy seasons, the potential evapotranspiration reached close to 0 mm.
During this study period, there was no significant change of soil moisture content in the P. taiwanensis community. However, the changes of water content in different soil layers were different, and the variation of surface soil moisture content was the most dramatic, ranging from 33.40% to 62.73%. The coefficient of variation (CV) in different soil layers fluctuated between 5.41% and 26.22%, and the least variation was in the middle layer (10–60 cm). The soil water content decreased with soil depth, the largest difference of soil water content among soil layers was in July, and the smallest was in August (Figure 4).

3.2. Isotopic Composition of Rainfall, Soil Water and Plant Water

We collected precipitation samples from each precipitation event from June to November, and obtained the local metric water line (LMWL) (δD = 6.07δ18O + 8.42) (Figure 5). The slope and intercept were both lower than the global metric water line (GMWL) (δD = 8δ18O + 10) [49]. The soil water evaporation line (δD = 5.77δ18O − 12.95) was below the LMWL, which indicates that precipitation fractionates isotopic compositions in varying degrees due to the different evaporation.
The isotopic values of precipitation varied significantly during the sampling periods, ranging in δD from −111.93 to −25.39‰, with the average of −74.02‰, and in δ18O from −19.71 to −9.87‰, with the mean value of −13.58‰, correspondingly.
The variation of isotopic values was similar in soil water to that in precipitation, ranging in δD from −130.28 to −48.15‰, with the average of −95.24‰ and in δ18O from −19.24 to −6.43‰, with the average of −14.26‰, respectively. Additionally, the variation range of δD and δ18O in plant water was from −16.71 to −8.24‰ and from −112.72‰ to −64.18‰ correspondingly, while the average value was −12.50 and −87.11‰, respectively (Figure 5).

3.3. Relationship between Isotopic Compositions in Soil and Xylem Water

The isotopic composition of soil water at different depths was affected by early precipitation, while the deep soil water was affected by earlier precipitation (Figure 6). In July and September with abundant rainfall, there was a great variation on isotopic composition in the 0–80 cm soil layer, and the δD value of soil water increased with the soil depth (Figure 6a,c). The change trend in δD of soil water was consistent among August, October, November and January of following year, while δD of upper soil water (0–40 cm) was always higher than that of the lower soil horizons due to different evaporation. Specifically, in August, δD of soil water decreased with soil depth in the 0–40 cm soil layer but increased with the soil depth in the 40–80 cm soil layer (Figure 6b), while in October and November (Figure 6d,e), the isotopic value of soil water demonstrated a downward trend toward depletion in the 0–60 cm layer but an upward trend toward enrichment in the 60–80 cm layer. In contrast, the isotopic value of soil water slightly changed in the 40–80 cm soil layer but drastically decreased with the soil depth in the 0–40 cm layer. The δD values of soil water ranged from −130.28‰ to −48.15‰ during our study period.
There were no significant differences (p > 0.05) between the respective δDs of P. taiwanensis, E. muricata, and R. dilatatum from July to January, suggesting that plants absorbed soil water primarily from the same depths. Xylem water δDs of three species in August, November, and January were broadly similar to that of soil water at the 0–20 cm depth (Figure 6b,e,f). In July and September, the intersection point of the isotope characteristic line between the stem water and soil profile of P. taiwanensis and E. muricata was below 40 cm (Figure 6a,c). However, the main water sources of R. dilatatum were slightly different in July, and the intersection was near the soil layer of 20–40 cm. Besides, in September, its intersection was similar to that of P. taiwanensis and E. muricata. In October, the water used sources of the three plants remained similar, with the intersection between 10 and 40 cm soil layers (Figure 6d).

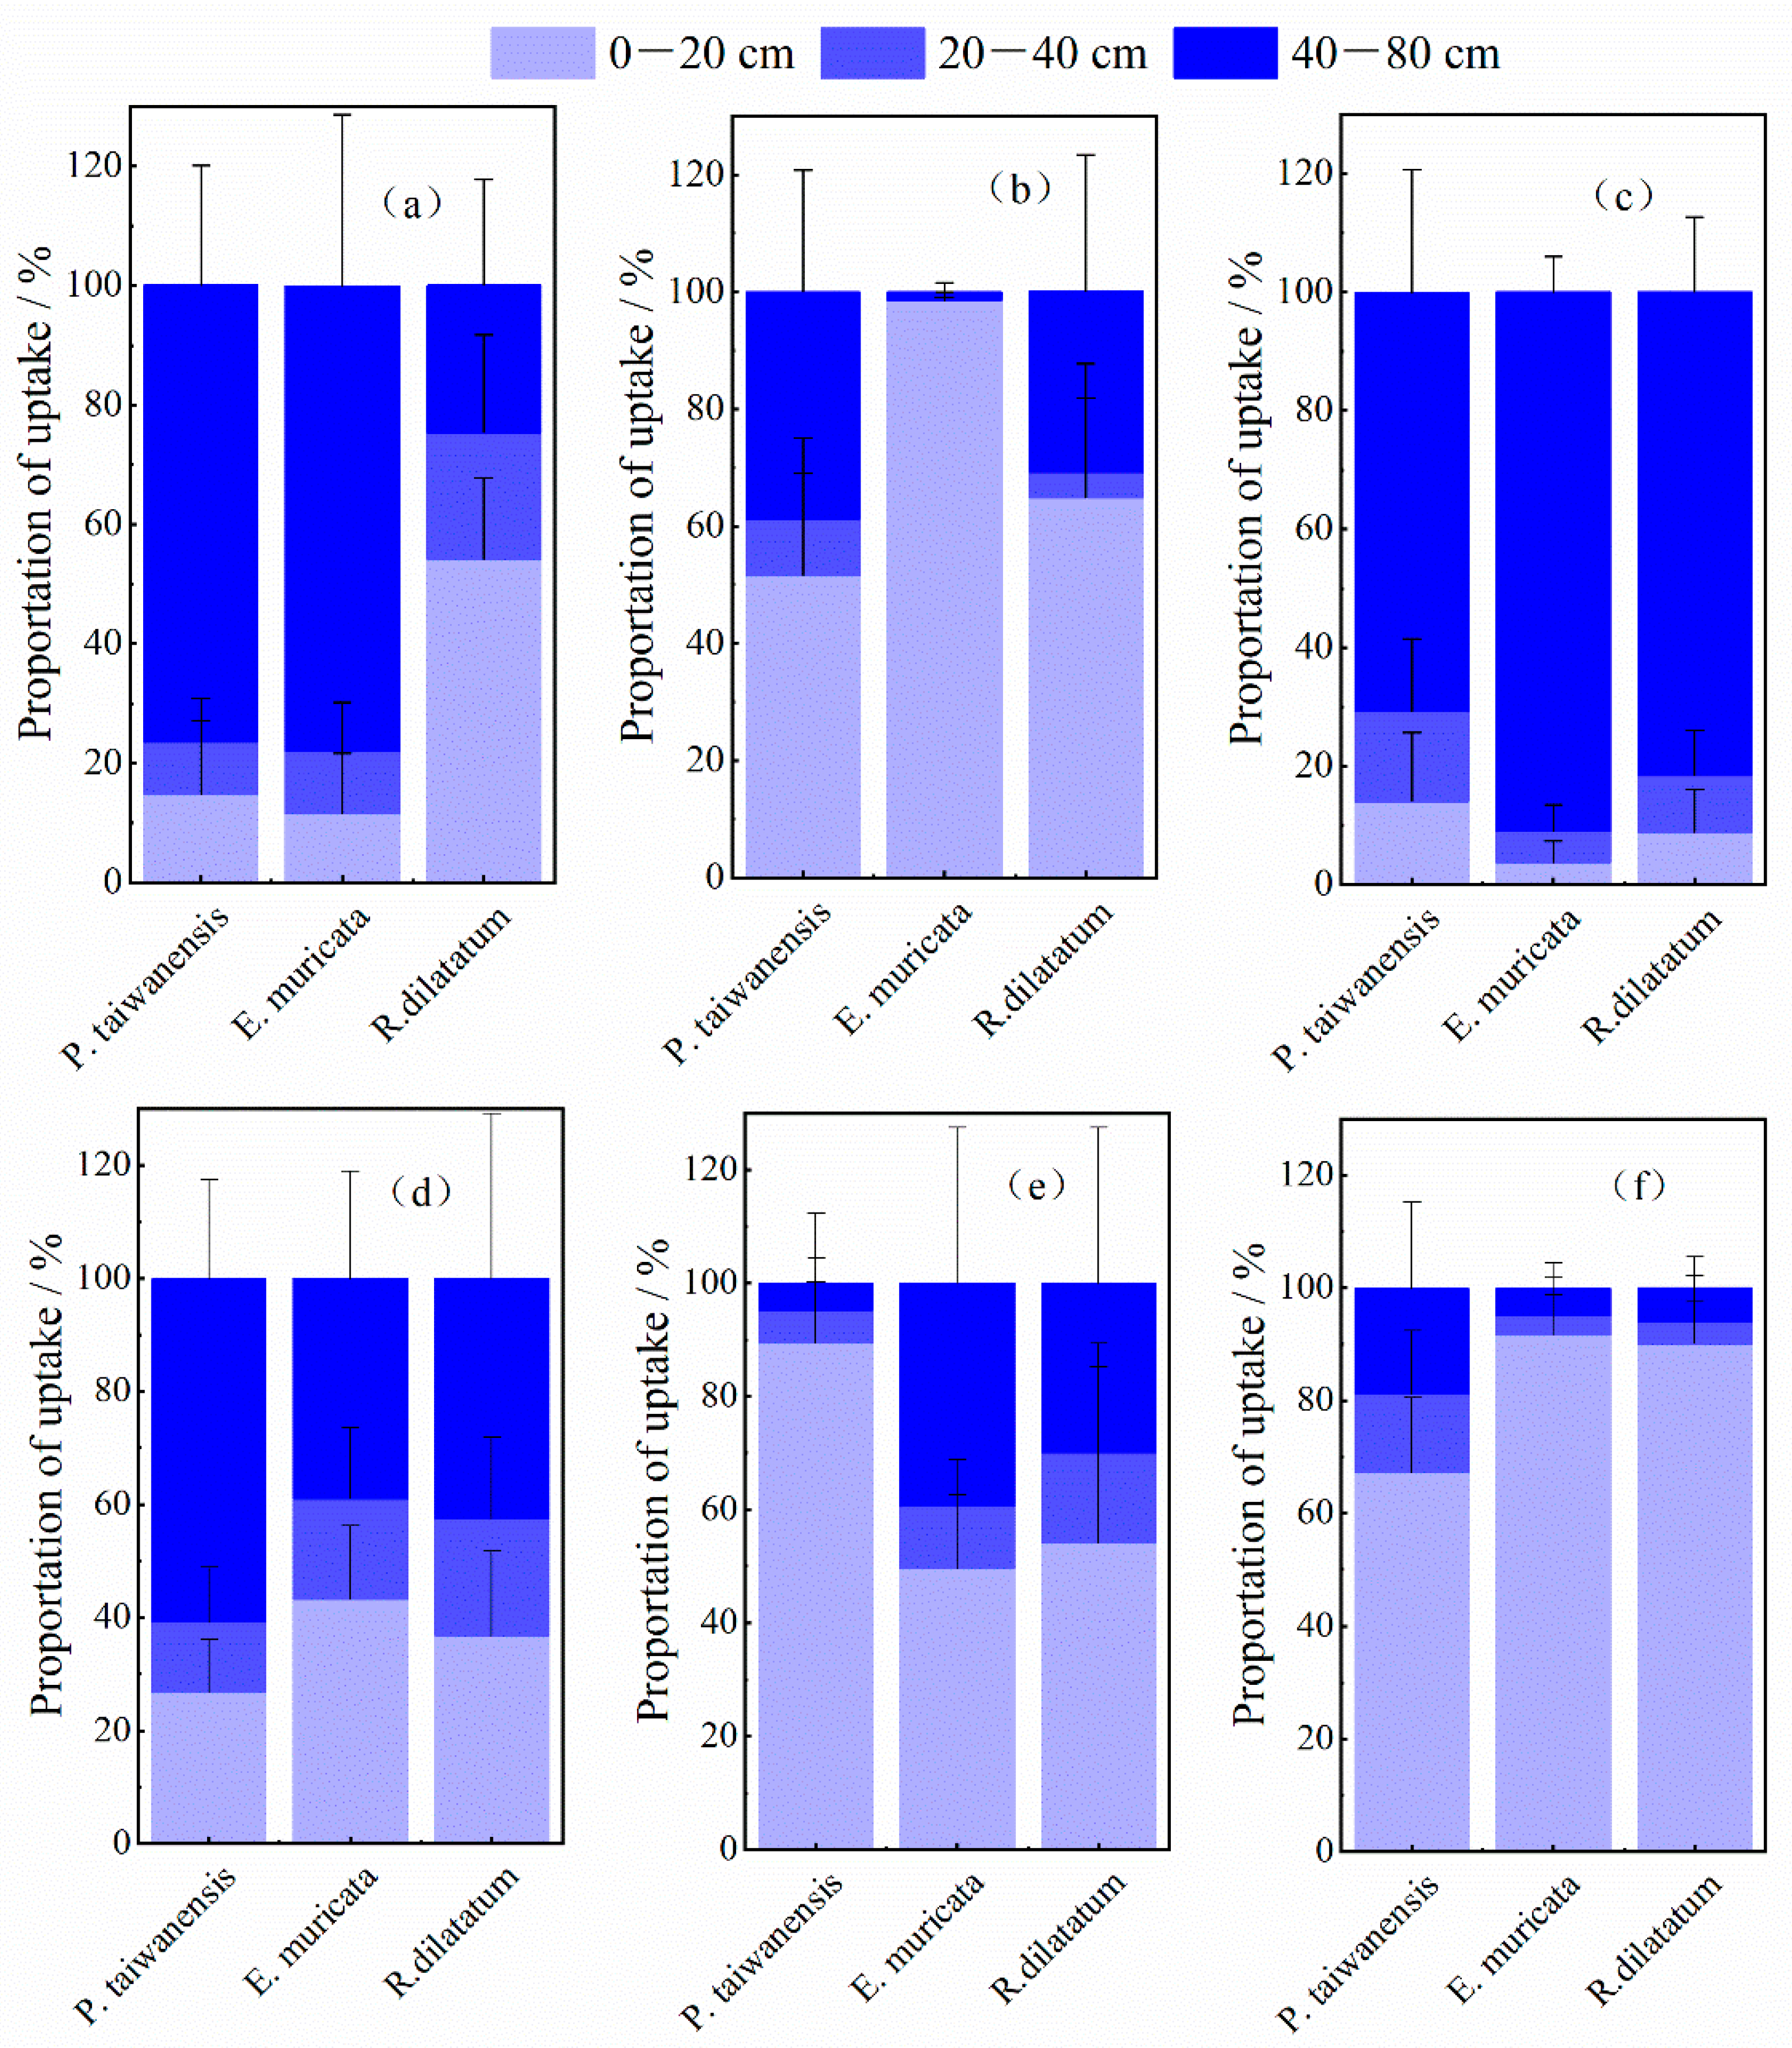
3.4. Water Uptake Patterns of P. taiwanensis and Understory Shrub Species

The contribution ratios of the three potential soil water sources (0–20, 20–40, and 40–80 cm) to plant water uptake are shown in Figure 7, with significant differences between different months. In the months with extremely abundant rainfall (July and September), the evergreen conifer species P. taiwanensis and the evergreen shrub E. muricata mainly absorbed water from the deep soil layer (all more than 70%). By contrast, the deciduous shrub R. dilatatum strongly relied on upper soil water (75.4%) in July, and took up the same deep water source in September.
The surface soil water (0–20 cm) became the main source of the three species in August and January of the following year, when the precipitation decreased, compared with that in the same month of the previous years. When the precipitation in October was compared with that in the same period of the previous years, it was found that the soil water in the deep layers (40–80 cm) was the main water source of the three plants. Moreover, the greatest difference in water source between P. taiwanensis and shrubs occurred in November, when the precipitation increased slightly, compared with that in the same period of the previous years, and the contribution of 0–20 cm soil water to the three tree species (P. taiwanensis, E. muricata, and R. dilatatum) were 89.5%, 49.6%, and 54.2% and the contribution of deep soil water to the two shrubs were 39.3% and 29.9%, respectively.

4. Discussion

4.1. Water Use Patterns of Main Arbor and Shrub Species in P. taiwanensis Community

Based on this study, we found that there were monthly dynamic changes of water use in P. taiwanensis, E. muricata, and R. dilatatum during the study period. In the rainy months (July to September), plants generally preferred absorbing water from the deep soil layer (40–80 cm), except in August. They preferred the surface soil layer (0–20 cm) in August and the months with less rainfall (October to January of the next year). It should be noted that the results of the seasonal water use pattern conflicts with those from most previous studies in subtropical and humid regions, which found that plants generally had shallow roots and absorbed topsoil water [50]. Particularly, plants absorbed deep water during the rainy season, which might be attributed to the low rainfall and plant water consumption. On the one hand, during this season, rainfall was extremely abundant, 70% higher than the monthly average in the previous decades, and the soil moisture content was then kept in a state of supersaturation for a long time because of continuous rain (Figure 2). Accordingly, plants had to endure water logging stress, which resulted in the decrease of the surface root activity [51,52,53]. Since the flooding stress on the deep root was reduced due to the better water conductivity of sandy deep soil (Table 2), plants then turned to this deep soil water. On the other hand, trees have the capability of storing water [54], and releasing less water by transpiration on the continuous rainy days [55,56]. A total of 50% of ETp in 2020 was smaller than 0.4 mm/d, according to Figure 3a; the distribution of ETp, and the average ETp in the early period of our sampling time (7d) was 0.5 mm/d according to Figure 3b, indicating a very low water consumption of plant transpiration (which might be attributed to the inclusion of plant transpiration in the ETp). It was inferred that early rainwater was still stored in branches in the late samplings. Then, the isotopic characteristics of stem water demonstrated a consistency with earlier precipitation, which replenished the deep soil water by infiltration (Figure 3). Overall, these two factors together contribute to the deep soil water use of plants in the months with extremely abundant rainfall. Comparatively, plants still preferred surface layer soil water (0–20 cm) in August with normal rainfall. These results confirmed the previous studies about subtropical coniferous plantation that trees tapped shallower soil water sources (0–10 cm) during the wet season [47,57].
Furthermore, this study also revealed that plants increasingly absorbed surface layer soil water (0–20 cm) in the early and middle periods of the dry season (October to January). When the precipitation was compared with that in previous years (Figure 2, October), it was found that soil water in deep layers (40–80 cm) was the main source of the three plants, and the contribution of 0–20 cm soil water to the three tree species (P. taiwanensis, E. muricata, and R. dilatatum) more than 50% in November and January. A similar pattern was also found by Muñoz-Villers et al. [57] in Tropical montane cloud forests, whose study demonstrated that the increase in shallow soil water uptake across investigated species was related to the reduction of transpiration. In central Panama, Schwendenmann et al. [26] uncovered that the deciduous species Cedrela odorata showed the lowest daily transpiration rate and consistent use of shallow soil water in the dry season. Then, they concluded that the water use strategy might be related to the availability of soil water and that enough surface soil water and root biomass might be conducive to plant transpiration [26,58,59]. The study of Deng et al. [60] in Beijing’s mountain areas revealed that P. orientalis preferred upper soil moisture in the dry seasons as long as the supply met the demand. Combining all the previously mentioned, this study suggested that the three tree species could flexibly shift their water sources from shallow soil water to deep soil water according to soil water availability and water requirements.

4.2. Dynamic Niche Partitioning in Water Uptake among P. taiwanensis Community

The main water sources of P. taiwanensis, E. muricata, and R. dilatatum in our study were not always consistent among different months. Specifically, R. dilatatum or P. taiwanensis used different water sources from those of the other two tree species in July and November, which could be attributed to the roots “niche differentiation”, the alleviation of water competition, and the horizontal segregation of water absorption between species during the wet period, although a replenishment of water supply occurred along the vertical axis during the dry period [61]. Dynamic niche partitioning in root water uptake facilitated efficient water use in the more richly diverse grassland plant communities [62]. Xu et al. [63] found that the dominant coniferous forest species, the middle and associated species in southwest China had complementary and changing water use strategies. However, the way to absorb water from similar soil layers by co-existing species tends to show hydrological niche overlap and then causes competition in water-limited conditions [47]. Wang et al. [42] investigated three typical plants (Stipa bungeana, Artemisia gmelinii, and Vitex negundo) in the Loess Plateau and found that there was little difference in the main water sources of the three native plants during the growing season. Similarly, Zhang et al. [64] studied the water use pattern of two dominant species of shrubs, C. korshinskii and R. soongorica, and found that the source was basically in competition in each month. They proposed that the tree species of the same dominant class in the ecosystem had similar water sources, which is consistent with the discovery of Nie et al. [65] in the subtropical karst area of China. Thus, it can be concluded that in an artificial coniferous forest ecosystem with a single advantage, the water use patterns of arbors and shrubs are flexibly and complementarily coordinated.

5. Conclusions

In this study, a stable isotope was introduced to distinguish the sources of water uptake among the dominant species in a P. taiwanensis community. Our results suggested that the plants could switch their water uptake depth to adapt to soil moisture conditions in different periods. In the growing season (July to October), when the surface soil water content was extremely abundant, the dominant species in a P. taiwanensis community mainly absorbed water from the deep soil layer (40–80 cm), but turned to absorb surface soil water (0–20 cm) when the content lowered. The surface soil water (0–20 cm) became the main sources of the three species in November and January of the following year. These findings indicated that excessive shallow soil water supply would lead to a decrease of shallow root activity and then the deep soil water uptake of plants. In addition, the water uptake of dominant woody plants in P. taiwanensis community has great plasticity and the water uptake depth varies with soil water availability. The changing water use pattern of vegetation in a community is beneficial for adaptation to the wet environment, but the same hydrological niche might result in water competition in future climate change.

Author Contributions

Data curation, L.W.; investigation, Y.P., T.B. and Q.Z.; visualization, L.W.; writing—original draft, L.W.; writing—review and editing, W.D., Y.L., X.L., L.Z. and G.J. All authors have read and agreed to the published version of the manuscript.

Funding

This research was supported by the National Natural Science Foundation of China (W.D., NSFC: 31860236) and the Jiangxi Provincial Forestry Science and Technology Innovation Special Project (Y.L., 201808).

Data Availability Statement

The data presented in this study are available on request from the corresponding author. The data are not publicly available due to privacy concerns as well as pro-prietary ownership.

Acknowledgments

We would like to show our gratitude to M. Tang from the College of Forestry, Jiangxi Agricultural University for his great help in identifying plants for us and to Jiangxi Lushan National Nature Reserve Administration for permitting us to collect plant materials.

Conflicts of Interest

We declare that we have no financial and personal relationships with other people or organizations that can inappropriately influence our work; there is no professional or other personal interest of any nature or kind in any product, service and/or company that could be construed as influencing the position presented in, or the review of, the manuscript entitled “Variation in water uptake dynamics of dominant wood plants of Pinus taiwanensis communities based on stable isotopes”.

References

  1. Huang, L.; He, B.; Chen, A.; Wang, H.; Liu, J.; Lű, A.; Chen, Z. Drought Dominates the Interannual Variability in Global Terrestrial Net Primary Production by Controlling Semi-Arid Ecosystems. Sci. Rep. 2016, 6, 24639. [Google Scholar] [CrossRef] [Green Version]
  2. Jolly, W.M.; Cochrane, M.A.; Freeborn, P.H.; Holden, Z.A.; Brown, T.J. Climate-Induced Variations in Global Wildfire Danger from 1979 to 2013. Nat. Commun. 2015, 6, 7537. [Google Scholar] [CrossRef]
  3. Pedrono, M.; Locatelli, B.; Ezzine-de-Blas, D.; Pesche, D.; Morand, S.; Binot, A. Impact of Climate Change on Ecosystem Services. In Climate Change and Agriculture Worldwide; Torquebiau, E., Ed.; Springer: Dordrecht, The Netherlands, 2016; pp. 251–261. ISBN 978-94-017-7460-4. [Google Scholar]
  4. Halada, L. Ecosystem Services of Mountains: An Urgent Research Area; ALTERNet: Brussels, Belgium, 2010. [Google Scholar]
  5. Huber, R.; Bugmann, H.; Buttler, A.; Rigling, A. Sustainable Land-Use Practices in European Mountain Regions under Global Change: An Integrated Research Approach. Ecol. Soc. 2013, 18, 37. [Google Scholar] [CrossRef] [Green Version]
  6. Fang, X.; Pomeroy, J.W. Diagnosis of Future Changes in Hydrology for a Canadian Rockies Headwater Basin. Hydrol. Earth Syst. Sci. 2020, 24, 2731–2754. [Google Scholar] [CrossRef]
  7. Pomeroy, J.; Fang, X.; Ellis, C. Sensitivity of Snowmelt Hydrology in Marmot Creek, Alberta, to Forest Cover Disturbance. Hydrol. Processes 2012, 26, 1891–1904. [Google Scholar] [CrossRef]
  8. Carroll, C.; Knapp, A.K.; Martin, P.H. Dominant Tree Species of the Colorado Rockies Have Divergent Physiological and Morphological Responses to Warming. For. Ecol. Manag. 2017, 402, 234–240. [Google Scholar] [CrossRef]
  9. Harder, P.; Pomeroy, J.W.; Westbrook, C.J. Hydrological Resilience of a Canadian Rockies Headwaters Basin Subject to Changing Climate, Extreme Weather, and Forest Management. Hydrol. Processes 2015, 29, 3905–3924. [Google Scholar] [CrossRef]
  10. Kelsey, K.C.; Redmond, M.D.; Barger, N.N.; Neff, J.C. Species, Climate and Landscape Physiography Drive Variable Growth Trends in Subalpine Forests. Ecosystems 2017, 21, 125–140. [Google Scholar] [CrossRef]
  11. Carroll, R.W.; Huntington, J.L.; Snyder, K.A.; Niswonger, R.G.; Morton, C.; Stringham, T.K. Evaluating Mountain Meadow Groundwater Response to Pinyon-Juniper and Temperature in a Great Basin Watershed. Ecohydrology 2017, 10, e1792. [Google Scholar] [CrossRef]
  12. Christensen, C.W.; Hayashi, M.; Bentley, L.R. Hydrogeophysical Survey of Groundwater Flow Pathways in an Alpine Headwater Basin. In Proceedings of the Near Surface Geoscience 2016—22nd European Meeting of Environmental and Engineering Geophysics, Strasbourg, France, 4–8 September 2016. [Google Scholar]
  13. Harrington, J.S.; Hayashi, M.; Kurylyk, B.L. Influence of a Rock Glacier Spring on the Stream Energy Budget and Cold-Water Refuge in an Alpine Stream. Hydrol. Processes 2017, 31, 4719–4733. [Google Scholar] [CrossRef]
  14. Hood, J.L.; Hayashi, M. Characterization of Snowmelt Flux and Groundwater Storage in an Alpine Headwater Basin. J. Hydrol. 2015, 521, 482–497. [Google Scholar] [CrossRef]
  15. Dubbert, M.; Caldeira, M.C.; Dubbert, D.; Werner, C. A Pool-Weighted Perspective on the Two-Water-Worlds Hypothesis. New Phytol. 2019, 222, 1271–1283. [Google Scholar] [CrossRef] [PubMed]
  16. Fan, Y.; Miguez-Macho, G.; Jobbágy, E.G.; Jackson, R.B.; Otero-Casal, C. Hydrologic Regulation of Plant Rooting Depth. Proc. Natl. Acad. Sci. USA 2017, 114, 10572–10577. [Google Scholar] [CrossRef] [Green Version]
  17. Schenk, H.J.; Jackson, R.B. Rooting Depths, Lateral Root Spreads and below-Ground/above-Ground Allometries of Plants in Water-Limited Ecosystems. J. Ecol. 2010, 90, 480–494. [Google Scholar] [CrossRef] [Green Version]
  18. West, A.G.; Dawson, T.E.; February, E.C.; Midgley, G.F.; Bond, W.J.; Aston, T.L. Diverse Functional Responses to Drought in a Mediterranean-Type Shrubland in South Africa. New Phytol. 2012, 195, 396–474. [Google Scholar] [CrossRef]
  19. Allen, S.T.; Kirchner, J.W.; Braun, S.; Siegwolf, R.T.W.; Goldsmith, G.R. Seasonal Origins of Soil Water Used by Trees. Hydrol. Earth Syst. Sci. 2019, 23, 1199–1210. [Google Scholar] [CrossRef] [Green Version]
  20. Bertrand, G.; Masini, J.; Goldscheider, N.; Meeks, J.; Lavastre, V.; Celle-Jeanton, H.; Gobat, J.-M.; Hunkeler, D. Determination of Spatiotemporal Variability of Tree Water Uptake Using Stable Isotopes (Δ18O, Δ2H) in an Alluvial System Supplied by a High-Altitude Watershed, Pfyn Forest, Switzerland. Ecohydrology 2014, 7, 319–333. [Google Scholar] [CrossRef]
  21. Brooks, J.R.; Barnard, H.R.; Coulombe, R.; Mcdonnell, J.J. Ecohydrologic Separation of Water between Trees and Streams in a Mediterranean Climate. Nat. Geosci. 2010, 3, 100–104. [Google Scholar] [CrossRef]
  22. Dawson, T.E.; Ehleringer, J.R. Streamside Trees That Do Not Use Stream Water. Nature 1991, 350, 335–337. [Google Scholar] [CrossRef]
  23. Goldsmith, G.R.; Lyssette, E.; Muoz-Villers, L.E.; Holwerda, F.; Mcdonnell, J.J.; Asbjornsen, H.; Dawson, T.E. Stable Isotopes Reveal Linkages among Ecohydrological Processes in a Seasonally Dry Tropical Montane Cloud Forest. Ecohydrology 2012, 5, 779–790. [Google Scholar] [CrossRef]
  24. Langs, L.E.; Petrone, R.M.; Pomeroy, J.W. A Δ18O and Δ2H Stable Water Isotope Analysis of Subalpine Forest Water Sources under Seasonal and Hydrological Stress in the Canadian Rocky Mountains. Hydrol. Processes 2020, 34, 5642–5658. [Google Scholar] [CrossRef]
  25. Rossatto, D.R.; da Silveira Lobo Sternberg, L.; Franco, A.C. The Partitioning of Water Uptake between Growth Forms in a Neotropical Savanna: Do Herbs Exploit a Third Water Source Niche? Plant Biol. 2013, 15, 84–92. [Google Scholar] [CrossRef] [PubMed]
  26. Schwendenmann, L.; Pendall, E.; Sanchez-Bragado, R.; Kunert, N.; Hölscher, D. Tree Water Uptake in a Tropical Plantation Varying in Tree Diversity: Interspecific Differences, Seasonal Shifts and Complementarity: Tree water uptake patterns in a tropical tree plantation. Ecohydrology 2015, 8, 1–12. [Google Scholar] [CrossRef]
  27. Langs, L.E.; Petrone, R.M.; Pomeroy, J.W. Subalpine Forest Water Use Behaviour and Evapotranspiration during Two Hydrologically Contrasting Growing Seasons in the Canadian Rockies. Hydrol. Processes 2021, 35, e14158. [Google Scholar] [CrossRef]
  28. Linderholm, H.W. Growing Season Changes in the Last Century. Agric. For. Meteorol. 2006, 137, 1–14. [Google Scholar] [CrossRef]
  29. Molotch, N.P.; Brooks, P.D.; Burns, S.P.; Litvak, M.; Monson, R.K.; McConnell, J.R.; Musselman, K. Ecohydrological Controls on Snowmelt Partitioning in Mixed-Conifer Sub-Alpine Forests. Ecohydrology 2009, 2, 129–142. [Google Scholar] [CrossRef]
  30. Smith, W.K.; Germino, M.J.; Johnson, D.M.; Reinhardt, K. The Altitude of Alpine Treeline: A Bellwether of Climate Change Effects. Bot. Rev. 2009, 75, 163–190. [Google Scholar] [CrossRef]
  31. Song, H.; Han, Q.; Zhang, S. Low-Altitude Boundary of Abies Faxoniana Is More Susceptible to Long-Term Open-Top Chamber Warming in the Eastern Tibetan Plateau. Front. Plant Sci. 2021, 12, 766368. [Google Scholar] [CrossRef]
  32. Duan, B.; Dong, T.; Zhang, X.; Zhang, Y.; Chen, J. Ecophysiological Responses of Two Dominant Subalpine Tree Species Betula Albo-Sinensis and Abies Faxoniana to Intra- and Interspecific Competition under Elevated Temperature. For. Ecol. Manag. 2014, 323, 20–27. [Google Scholar] [CrossRef]
  33. Liu, X.; Wang, L. Scientific Survey and Study of Biodiversity on the Lushan Nature Reserve in Jiangxi Province; Science Press: Beijing, China, 2010. [Google Scholar]
  34. Chen, Q.; Guo, J.; Li, C.; Wang, H.; Wu, C.; Deng, W.; Liu, Y.; Ye, Q.; Li, X. Variation characteristics of stable isotope in precipitation in Mount Lu area. J. Nat. Resour. 2019, 34, 1306–1316. [Google Scholar] [CrossRef]
  35. Liu, W.; Liao, L.; Liu, Y.; Wang, Q.; Murray, P.J.; Jiang, X.; Zou, G.; Cai, J.; Zhao, X. Effects of Phyllostachys Pubescens Expansion on Underground Soil Fauna Community and Soil Food Web in a Cryptomeria Japonica Plantation, Lushan Mountain, Subtropical China. J. Soils Sediments 2021, 21, 2212–2227. [Google Scholar] [CrossRef]
  36. Deng, W.; Guo, J.; Zou, Q.; Chen, Q.; Huang, J.; Lu, Y.; Liu, Y. Characteristics of the temporal and spatial distribution of the throughfall in Cryptomeria japonica forest in mount Lu. Acta Ecol. Sin. 2021, 41, 2428–2438. [Google Scholar]
  37. Yu, F.; Zhang, Z.; Chen, L.; Wang, J.; Shen, Z. Spatial Distribution Characteristics of Soil Organic Carbon in Subtropical Forests of Mountain Lushan, China. Environ. Monit. Assess. 2018, 190, 545. [Google Scholar] [CrossRef] [PubMed]
  38. Allen, S.T.; Kirchner, J.W.; Goldsmith, G.R. Predicting Spatial Patterns in Precipitation Isotope (δ 2 H and δ 18 O) Seasonality Using Sinusoidal Isoscapes. Geophys. Res. Lett. 2018, 45, 4859–4868. [Google Scholar] [CrossRef] [Green Version]
  39. Chang, E.; Li, P.; Li, Z.; Xiao, L.; Zhao, B.; Su, Y.; Feng, Z. Using Water Isotopes to Analyze Water Uptake during Vegetation Succession on Abandoned Cropland on the Loess Plateau, China. Catena 2019, 181, 104095. [Google Scholar] [CrossRef]
  40. Wang, M.; Chen, H.; Zhang, W.; Wang, K. Influencing Factors on Soil Nutrients at Different Scales in a Karst Area. Catena 2019, 175, 411–420. [Google Scholar] [CrossRef]
  41. Zhao, F.; Li, H.; Li, C.; Cai, Y.; Wang, X.; Liu, Q. Analyzing the Influence of Landscape Pattern Change on Ecological Water Requirements in an Arid/Semiarid Region of China. J. Hydrol. 2019, 578, 124098. [Google Scholar] [CrossRef]
  42. Wang, J.; Fu, B.; Lu, N.; Zhang, L. Seasonal Variation in Water Uptake Patterns of Three Plant Species Based on Stable Isotopes in the Semi-Arid Loess Plateau. Sci. Total Environ. 2017, 609, 27–37. [Google Scholar] [CrossRef]
  43. West, A.G.; Patrickson, S.J.; Ehleringer, J.R. Water Extraction Times for Plant and Soil Materials Used in Stable Isotope Analysis. Rapid Commun. Mass Spectrom. 2006, 20, 1317–1321. [Google Scholar] [CrossRef]
  44. Brinkmann, N.; Seeger, S.; Weiler, M.; Buchmann, N.; Eugster, W.; Kahmen, A. Employing Stable Isotopes to Determine the Residence Times of Soil Water and the Temporal Origin of Water Taken up by Fagus Sylvatica and Picea Abies in a Temperate Forest. New Phytol. 2017, 219, 1300–1313. [Google Scholar] [CrossRef] [Green Version]
  45. Xu, X.; Li, Y.; Tan, Z.; Guo, Q.; College of Water Resources Science and Engineering, Taiyuan University of Technology, Taiyuan 030024, China. Variations of water sources for a typical mesophyte vegetation in the Lake Poyang wetland using stable isotopes. J. Lake Sci. 2020, 32, 1749–1760. [Google Scholar] [CrossRef]
  46. Lyu, S.; Wang, J.; Song, X.; Wen, X. The Relationship of ΔD and Δ18O in Surface Soil Water and Its Implications for Soil Evaporation along Grass Transects of Tibet, Loess, and Inner Mongolia Plateau. J. Hydrol. 2021, 600, 126533. [Google Scholar] [CrossRef]
  47. Yang, B.; Wen, X.; Sun, X. Seasonal Variations in Depth of Water Uptake for a Subtropical Coniferous Plantation Subjected to Drought in an East Asian Monsoon Region. Agric. For. Meteorol. 2015, 201, 218–228. [Google Scholar] [CrossRef]
  48. Stock, B.C.; Semmens, B.X. Unifying Error Structures in Commonly Used Biotracer Mixing Models. Ecology 2016, 97, 2562–2569. [Google Scholar] [CrossRef] [PubMed]
  49. Craig, H. Isotopic Variations in Meteoric Waters. Science 1961, 133, 1702–1703. [Google Scholar] [CrossRef] [PubMed]
  50. Schenk, H.J.; Jackson, R.B. Mapping the Global Distribution of Deep Roots in Relation to Climate and Soil Characteristics. Geoderma 2005, 126, 129–140. [Google Scholar] [CrossRef]
  51. Muhammad, A.A. Waterlogging Stress in Plants: A Review. Afr. J. Agric. Res. 2012, 7, 1976–1981. [Google Scholar] [CrossRef]
  52. Pezeshki, S.R.; DeLaune, R.D. Soil Oxidation-Reduction in Wetlands and Its Impact on Plant Functioning. Biology 2012, 1, 196–221. [Google Scholar] [CrossRef] [Green Version]
  53. Ye, Y.; Tam, N.F.Y.; Wong, Y.S.; Lu, C.Y. Growth and Physiological Responses of Two Mangrove Species (Bruguiera Gymnorrhiza and Kandelia Candel) to Waterlogging. Environ. Exp. Bot. 2003, 49, 209–221. [Google Scholar] [CrossRef]
  54. Liu, Z.; Zhang, H.; Yu, X.; Jia, G.; Jiang, J. Evidence of Foliar Water Uptake in a Conifer Species. Agric. Water Manag. 2021, 255, 106993. [Google Scholar] [CrossRef]
  55. Wang, H.; Tetzlaff, D.; Soulsby, C. Hysteretic Response of Sap Flow in Scots Pine (Pinus sylvestris) to Meteorological Forcing in a Humid Low-energy Headwater Catchment. Ecohydrology 2019, 12, e2125. [Google Scholar] [CrossRef]
  56. Yan, B.; Mao, J.; Dickinson, R.E.; Thornton, P.E.; Shi, X.; Ricciuto, D.M.; Warren, J.M.; Hoffman, F.M. Modelling Tree Stem-water Dynamics over an Amazonian Rainforest. Ecohydrology 2020, 13, e2180. [Google Scholar] [CrossRef]
  57. Muñoz-Villers, L.E.; Holwerda, F.; Alvarado-Barrientos, M.S.; Geissert, D.R.; Dawson, T.E. Reduced Dry Season Transpiration Is Coupled with Shallow Soil Water Use in Tropical Montane Forest Trees. Oecologia 2018, 188, 303–317. [Google Scholar] [CrossRef]
  58. Abdallah, M.A.B.; Durfee, N.; Mata-Gonzalez, R.; Ochoa, C.G.; Noller, J.S. Water Use and Soil Moisture Relationships on Western Juniper Trees at Different Growth Stages. Water 2020, 12, 1596. [Google Scholar] [CrossRef]
  59. Mata-González, R.; Abdallah, M.A.B.; Ochoa, C.G. Water Use by Mature and Sapling Western Juniper (Juniperus Occidentalis) Trees. Rangel. Ecol. Manag. 2021, 74, 110–113. [Google Scholar] [CrossRef]
  60. Deng, W.; Jia, G.; Liu, Y.; Chen, Q.; Huang, J.; Wen, L.; Zhang, L.; Liu, X.; Jia, J.; Peng, S. Long-Term Study on the Seasonal Water Uptake of Platycladus Orientalis in the Beijing Mountain Area, Northern China. Agric. For. Meteorol. 2021, 307, 108531. [Google Scholar] [CrossRef]
  61. Huo, G.; Gosme, M.; Gao, X.; Dupraz, C.; Yang, J.; Zhao, X. Dynamics of Interspecific Water Relationship in Vertical and Horizontal Dimensions under a Dryland Apple-Brassica Intercropping System: Quantifying by Experiments and the 3D Hi-SAFe Model. Agric. For. Meteorol. 2021, 310, 108620. [Google Scholar] [CrossRef]
  62. Guderle, M.; Bachmann, D.; Milcu, A.; Gockele, A.; Bechmann, M.; Fischer, C.; Roscher, C.; Landais, D.; Ravel, O.; Devidal, S.; et al. Dynamic Niche Partitioning in Root Water Uptake Facilitates Efficient Water Use in More Diverse Grassland Plant Communities. Funct. Ecol. 2018, 32, 214–227. [Google Scholar] [CrossRef]
  63. Xu, Q.; Li, H.; Chen, J.; Cheng, X.; Liu, S.; An, S. Water Use Patterns of Three Species in Subalpine Forest, Southwest China: The Deuterium Isotope Approach. Ecohydrology 2011, 4, 236–244. [Google Scholar] [CrossRef]
  64. Zhang, Y.; Zhang, M.; Qu, D.; Duan, W.; Wang, J.; Su, P.; Guo, R. Water Use Strategies of Dominant Species (Caragana Korshinskii and Reaumuria Soongorica) in Natural Shrubs Based on Stable Isotopes in the Loess Hill, China. Water 2020, 12, 1923. [Google Scholar] [CrossRef]
  65. Nie, Y.; Chen, H.; Ding, Y.; Wang, K. Water Source Segregation along Successional Stages in a Degraded Karst Region of Subtropical China. J. Veg. Sci. 2018, 29, 933–942. [Google Scholar] [CrossRef]
Figure 1. Location of the study site.
Forests 13 01336 g001
Figure 2. Monthly variation of multiyear precipitation (1955–2020), temperature, and precipitation in 2020 in the study site.
Forests 13 01336 g002
Figure 3. Frequency distribution of potential evapotranspiration (ETp) are shown in Figure (a). CETp represents the frequency of ETp in each group, and each group is a sequential accumulation of 0.1 mm; CL represents fitted curve of CETp; CFL is frequency accumulation curve, respectively. In Figure (b), P is the daily precipitation; ETp is the potential evapotranspiration, and Sampling is the date of sampling. Isotopic values of precipitation (δD of P), P. taiwanensis (δD of P), E. muricata (δD of E) and R. dilatatum (δD of R) are also shown in Figure (b), respectively.
Forests 13 01336 g003
Figure 4. Monthly variation of water content during observation period. Mean and SD of three replicates are shown, and mean values with the same letter indicate no significant difference at p ≤ 0.05 level according to One-way ANOVA test. (af) respectively represent the chronological months from July to January of the following year.
Forests 13 01336 g004
Figure 5. Distribution of precipitation, soil water, and plant water δ18O—δD relationship. Local meteoric water lines (black line): δD = 6.07δ18O + 8.42 (n = 48, R2 = 0.47), soil water evaporation line (red line): δD = 5.77δ18O − 12.95 (n = 90, R2 = 0.82), and stem water content line (blue line): δD = 4.95δ18O − 25.18 (n = 54, R2 = 0.79), respectively.
Forests 13 01336 g005
Figure 6. Seasonal variations of δD in soil horizons (0–80 cm) and xylem water (vertical dash) from P. taiwanensis and understory shrub species. Error bars and column widths represent standard errors (N = 3). (af) represent the chronological months from July to January of the following year.
Forests 13 01336 g006
Figure 7. Seasonal variations in proportion of water uptake from different soil layers based on MixSIAR of P. taiwanensis, E. muricata and R. dilatatum. Error bars represent standard deviations (N = 3). (af) represent the chronological months from July to January of the following year.
Forests 13 01336 g007
Table 1. Information on sample plot and tree species.
Tree SpeciesNumber of Tree SpeciesProportion of Tree Numbers/%Average Tree Diameter/cmAverage Tree Height/m
P. taiwanensis17728.7815.9514.06
E. muricata315.045.372.82
R. dilatatum9214.964.23.47
Table 2. Soil particle size composition and maximum and minimum water holding capacity.
Soil Layer/cmClay Content/%Silt Content/%Sand Content/%Saturated Moisture Holding Capacity/%Field Moisture Holding Capacity/%
0–100.16 ± 0.03b9.14 ± 0.95b90.70 ± 0.98a78.47 ± 0.83a49.40 ± 5.78a
10–200.44 ± 0.02a15.43 ± 0.24a84.13 ± 0.27b74.77 ± 2.79a52.73 ± 4.59a
20–400.24 ± 0.10b10.76 ± 2.32b89.01 ± 2.42a66.57 ± 14.47a45.99 ± 6.44a
40–600.10 ± 0.07b7.19 ± 1.30b92.71 ± 1.36a58.56 ± 14.92a40.03 ± 7.64a
60–800.17 ± 0.04b8.57 ± 0.30b91.27 ± 0.33a51.24 ± 11.26a37.37 ± 6.04a
Note: clay: <0.002 mm, silt: 0.002–0.02 mm, sand: 0.02−2 mm. Single factor analysis method was used in the table, and Duncan method was used in multiple comparisons. Letter marking method: the same letter indicates no difference between soil layers, and different lowercase letters indicate difference between soil layers (p < 0.05, N = 3).
Publisher’s Note: MDPI stays neutral with regard to jurisdictional claims in published maps and institutional affiliations.

