Article

Morphophysiological Acclimation of Developed and Senescing Beech Leaves to Different Light Conditions

Department of Forest Ecosystems Protection, Faculty of Forestry, University of Agriculture in Krakow, Al. 29-Listopada 46, 31-425 Krakow, Poland
*
Author to whom correspondence should be addressed.
Forests 2022, 13(8), 1333; https://doi.org/10.3390/f13081333
Submission received: 17 July 2022 / Revised: 15 August 2022 / Accepted: 16 August 2022 / Published: 21 August 2022
(This article belongs to the Topic Plant Ecophysiology)

Abstract

:
Common beech is a shade-tolerant tree species that can adapt to varying light intensities at the level of whole plants, crown fragments, and individual leaves. The acclimation abilities of the morphological, physiological, and biochemical characteristics of beech leaves were experimentally determined in tree crowns for different levels of light availability. About 24% higher length, width, and area and about 35% higher thickness were recorded in the sun leaves compared with shade leaves. Lower and earlier maximum leaf pigment levels, a faster degradation of leaf pigments during senescence, and a higher chlorophyll a/b ratio were observed in fully sun-grown leaves compared with leaves growing deeper in the canopy. Changes in the intensity of oxidative stress and the differential ability of developing and senescing leaves to defend against this effect under different light conditions were determined. This resulted in a higher redox imbalance and faster senescence in the outer parts of the tree crowns. Due to higher ascorbic acid and glutathione content and slower activity loss of antioxidative enzymes involved in superoxide anion and hydrogen peroxide decomposition, better control over the redox balance, oxidative stress, and senescence induction was noted in the sun leaves.

1. Introduction

Light is critical for plant leaves as it plays a decisive role in determining their morphological, anatomical, and physiological characteristics. Parts of trees, in particular, assimilatory organs located in different parts of the crown, develop under different light conditions. Although they exhibit various biochemical and physiological features characteristic of their position in the crown, they can function normally under light intensities characteristic of their development [1]. Leaves present in the inner parts of the tree crown are prone to receiving reduced light intensity and consequently to changes in the spectral composition due to shading caused by leaves located in the outer parts. Light acts as a source of energy and related stimuli that determine the proper growth and development of plants. Photoreceptors such as phytochrome, cryptochrome, phototropin, and other related leaf characteristics, including leaf mass per unit area and photosynthetic rate per unit mass of chlorophyll, contribute to efficient light utilization. These enable plants to track changes in light signals, including light color, intensity, direction, and timing, as well as crown density, responding accordingly [2]. Based on acclimation to light intensities, plant leaves can be categorized as sun leaves and shade leaves. Leaves exhibit not only morphological and anatomical acclimation to different light intensities for their growth and development but also various biochemical and physiological characteristics that enable them to grow at specific light intensities.
Besides driving electron transport in photosynthesis, light energy also increases the production of reactive oxygen species (ROS) such as superoxide anion (O2), singlet oxygen (1O2), and hydrogen peroxide (H2O2); these ROS significantly extend the negative effects of the redox imbalance as well as the cellular capacity for reduction/oxidation (redox) regulation and signaling [3]. ROS are primarily formed in chloroplasts, mitochondria, and peroxisomes [4]. The preliminary source of O2 in photosynthesis is its light phase and the Mehler reaction in photosystem PS I [5,6]. Leaves growing under normal conditions possess an antioxidant system that scavenges excess ROS and ensures cellular redox balance. Superoxide anion and its protonated form (HO2) undergo a dismutation reaction catalyzed by superoxide dismutase (SOD), which results in the formation of H2O2. H2O2 can act as a substrate for reactions taking place at specific distances from its formation sites, which generate more reactive hydroxyl radicals (HO) from H2O2 or O2●− via Fenton and Haber–Weiss reactions [7]. Increased production of ROS or a decrease in the antioxidant capacity of cells, tissues, and organs leads to the formation of redox signals at the cell level due to the accumulation of ROS in organelles carrying out electron-transport-related processes (e.g., photosynthesis, respiration) [3]. Especially during autumn senescence, leaf growth under oxidative stress induced by biotic or abiotic factors results in an imbalance between increasing ROS formation and the antioxidant system’s ability to scavenge the ROS and protect cellular macromolecules from damage.
From a biochemical perspective, leaves growing in the shade adapt to reduced light intensity by means of their increased light absorption capacity. In most of the species, shade-grown leaves have higher chlorophyll content per unit of fresh weight compared with sun leaves [8]; however, this does not always translate to a higher chlorophyll content per unit of leaf area [1]. This is because the measure of chlorophyll content depends on light-intensity-related leaf thickness as it decides the intensity of light energy absorption by light-harvesting complexes. Sun leaves compensate for the higher chlorophyll content per unit fresh weight of shade leaves by their lower fresh weight per unit leaf area; thus, both leaf types show comparable chlorophyll content per unit area. The higher ability of shade leaves to utilize the limited light intensity is also supported by their higher chlorophyll b content and, thus the lower chlorophyll a/b ratio and the higher total chlorophyll content of light-harvesting complexes. The higher chlorophyll b proportion in the photosynthetic systems of shade leaves allows light utilization over a wider range of wavelengths. In leaves of plants growing in the shade and in leaves located in the shade part of the tree canopy, a higher percentage of assimilates are used for the formation of the leaf blade. These leaves are also characterized by a high leaf area ratio and specific leaf area; however, due to relatively few smaller palisade mesophyll cells per unit area, they are thin and have low leaf mass density.
Common beech (Fagus sylvatica L.) is an important deciduous species in the forests of Poland and Central Europe. This species exhibits different morphological, physiological, and genetic characteristics, which are related to the wide range of their occurrence in areas characterized by varied climatic conditions [9,10]. These diverse characteristics enable this species to adapt to various conditions. Beech shows typical features of a shade-tolerant tree species [11]. Due to the light tolerance of leaves in seedlings in the understory and shade canopy parts, beech can survive under stressful conditions caused by excess or deficiency of light. Sun leaves, in particular, are structurally and functionally acclimated to high light intensities; however, even in this type of leaves, excessive light intensity causes disturbances in the activity of the antioxidant system and affects the stability of the photosynthetic system due to the production of ROS by PSI and PSII. Compared with shade leaves, sun leaves exhibit accelerated senescence processes because of the differential and light-dependent cellular redox imbalance, displaying a steady state of photoinhibition [12].
Autumn senescence is one of the fundamental physiological and biochemical processes in the leaves of beech and other trees [13,14]. This process determines the end date of photosynthesis and accumulation of assimilates on the one hand and the beginning date and course of remobilization of storage compounds on the other hand [15]. Thus, the timing of induction and the rate of leaf senescence determine the lifespan of leaves and the accumulation of organic matter. Previous studies have confirmed the significant participation of ROS in the induction and control of the autumn senescence of beech leaves [10,16,17]. ROS formation is the earliest response of beech leaves to decreasing temperature and 13-h photoperiod, which determine leaf senescence and winter dormancy of beech [18]. One of the important environmental factors affecting the intensity of ROS formation, the activity of the antioxidant system, the redox balance of leaf cells, and the induction and course of the senescence process is a significant difference in light intensity from the optimal level for photosynthesis. This not only affects the characteristics of leaves located in the parts of the crown with different degrees of illumination but also has an influence on whole plants.
In connection with the decisive role of free radical theory in the induction and control of the course of autumn senescence of beech leaves and the participation of light in the generation and accumulation of ROS in senescing leaves, as found in an earlier study was undertaken to analyze the morphological and biochemical differences between sun and shade beech leaves. The analyses carried out make it possible to assess the biochemical mechanisms of maintaining the redox balance of leaves under different light conditions. In light of the identified mechanism of induction of autumn senescence of beech leaves, they should provide an answer to the basic question: what are the differences in the defense mechanisms of the studied types of leaves against excessive accumulation of ROS and disruption of the redox balance of cells? We tested the following hypothesis regarding the biochemical basis of beech leaf response to light conditions during autumn senescence: (a) higher light intensity for sun leaves induces greater ROS accumulation, chlorophyll degradation, and oxidative stress formation; (b) differential intensity of ROS accumulation in the sun and shade beech leaves (in terms of leaf type morphology and biochemistry) induces differences in redox imbalance and, according to the free radical theory of leaf senescence, determines the timing of induction, the course of leaf senescence and leaf lifespan; (c) ROS accumulation in leaf types increases the activity of the antioxidant system to the degree that depends on acclimation-induced biochemical changes in its activity at the level of low-molecular-weight antioxidants and the enzymatic system. Light-dependent production rates of ROS and the activity of the antioxidants system result in a spatial gradient of leaf senescence induction and progression proportional to changes in canopy light intensity. Confirming these hypotheses will make it possible to clarify the reason for the earlier induction of beech leaf senescence in the outer, fully illuminated part of the canopy and the gradual progression of this process toward the less illuminated leaves located inside the canopy.

2. Materials and Methods

2.1. Plant Material

This study was conducted on beech trees aged 23 years planted in rows on a research plot located in the Krzeszowice Forest District near Krakow (coordinates 50°06′15.2″ N, 19°39′48.0″ E). These beech trees were characterized by a lack of cover and this guaranteed uniform insolation to each individual. Meteorological conditions during the study years were determined from the data recorded by the meteorological station of the Institute of Meteorology and Water Management in Balice near Krakow.
Sun and shade leaves were collected from 60 beech trees in 2019 and 2020 on the following four dates: June 30, July 23, September 3, and October 2. The sun leaves were collected from the upper part of the crown, fully exposed to the sun. The shade leaves were collected from the lower shade part of the crown, characterized by approximately 40% less light intensity than the upper part of the crown. For biochemical analysis, 10 sun and shade leaves were frozen using liquid nitrogen and ground into powder. For dry weight measurements, 100 mg of leaf powder was dried for 72 h at 70 °C until a constant weight was achieved. To characterize the morphological parameters of the leaves, the following parameters were analyzed using 10 leaves for each tree: leaf length (LL, cm), leaf blade width (LW, cm), leaf perimeter (LP, cm), leaf area (LA, cm2), petiole length (PL, cm), leaf index (LI: LL/LW × 100), petiole index (PI: PL/LL × 100), and leaf thickness (LT, μm) [19]. Leaf thickness was measured for five leaves from each tree at four points on each leaf, and the average of these measurements was recorded. Measurements were made with a thickness gauge to the nearest 0.1 µm. The remaining parameters were determined using the WINFOLIA software, version 2014 (Regent Instruments Inc., Quebeck, QB, Canada). The digital images of leaves were captured using an Epson Perfection V800/850 flatbed scanner.

2.2. Biochemical Analyses

2.2.1. Leaf Pigments

Leaf pigments were extracted from the frozen leaf powder in 100% methanol cooled to 4 °C. The absorbance of the extract was read at the following wavelengths 666, 653, and 470 nm. Concentrations of chlorophyll and carotenoids were calculated using the Lichtenthaler and Wellburn equations [20], and the results were expressed in mg g1 DW. The chlorophyll a/b ratio and carotenoid/chlorophyll ratio were determined from the content of chlorophyll and carotenoids.

2.2.2. Oxidative Stress Parameters

Hydrogen Peroxide

Leaf H2O2 content was determined by peroxidase-mediated oxidation of Amplex Red chromogen (Sigma, St. Louis, MO, USA). Briefly, H2O2 was extracted from 50 mg of leaf powder in 50 mM sodium phosphate buffer (pH 7.4) containing 0.2% Triton X-100. The Amplex Red oxidation reaction was carried out by mixing 50 µL of supernatant and 50 µL of reaction mixture containing 0.1 mM Amplex Red (Cayman Chemical, Ann Arbor, MI, USA) and 0.2 U/mL horseradish peroxidase (Sigma, St. Louis, MO, USA) dissolved in sodium phosphate buffer (pH 7.4). The reaction was carried out at 30 °C in the dark for 30 min, and the absorbance was measured at 560 nm. The concentration of H2O2 was determined using a standard curve for H2O2 concentrations of 0–8 µM. The H2O2 content was expressed as µmol g−1 DW.

Thiobarbituric Acid-Reactive Substances

The degree of lipid peroxidation was determined by measuring thiobarbituric acid-reactive substances (TBARS) [21]. In this procedure, approximately 50 mg of frozen powder was shaken in 5% trichloroacetic acid (TCA), and then the supernatant was mixed with 20% TCA solution containing 0.5% thiobarbituric acid. The reaction was carried out for 30 min at 95 °C. To determine the TBARS content, absorbance at 532 nm was measured, from which nonspecific absorbance at 600 nm was subtracted. The TBARS content of leaves was calculated using an extinction coefficient of 155 mM−1 cm−1 and expressed as nmol g−1 DW.

2.2.3. The Activity of the Antioxidant System

Ascorbate and Dehydroascorbate

The content of reduced and total ascorbic acid (AsA) was analyzed in accordance with the method described by Gillespie and Ainsworth [22]. Briefly, the leaf powder was shaken with 6% TCA. To reduce the oxidized form of AsA and determine the total AsA content, 10 mM dithiothreitol (DTT) was added to the supernatant, and the sample was incubated for 20 min at 37 °C. Excess DTT was removed by adding 0.5% N-ethylmaleimide. The reaction was performed at 37 °C by adding a reaction mixture containing TCA, H3PO4, 2,2′-dipyridyl, and FeCl3 to the samples, and the absorbance was read at 525 nm. The AsA content was measured from a standard curve prepared for the concentrations of 0.15–10 mM. The content of the oxidized form of AsA was determined as the difference between the total and reduced contents of the compound.

Glutathione and Glutathione Disulfide

The total (reduced glutathione (GSH) + oxidized glutathione (GSSG)) and oxidized glutathione contents were determined using the method suggested by Rahman et al. [23]. Glutathione was extracted from leaf powder in 100 mM potassium phosphate buffer (pH 7.5) containing 5 mM EDTA, 0.6% sulfosalicylic acid, and 0.1% Triton X-100. The total glutathione content was determined using the DTNB (5,5′-dithio-bis-nitrobenzoic acid)–GR (glutathione reductase) recycling assay. The reaction progress was determined by measuring the changes in absorbance at 412 nm. The total glutathione content was calculated from a standard curve prepared for the concentrations of 0.4–26.0 μM GSH. The GSSG content was determined after the removal of GSH from the compound by reaction with 2-vinylpyridine. Excess 2-vinylpyridine was neutralized using triethanolamine. The GSSG content was determined from a standard curve prepared for the concentrations of 0.4–26.0 μM GSSG.

Extraction and Activity of Antioxidative Enzymes

Antioxidative enzymes were extracted by shaking 50 mg of leaf powder in enzyme-appropriate buffers at 4 °C. The leaf powder was then poured into the buffer in a ratio of 1:10 (w/v), and protein concentration was determined using the Bradford method with bovine serum albumin as the standard [24].

Catalase

Catalase (CAT) (EC 1.11.1.6) was extracted in 50 mM potassium phosphate buffer (pH 7.0) containing 5% (w/v) insoluble polyvinylpolypyrrolidone (PVPP), 2 mM ethylenediaminetetraacetic acid (EDTA), and 1 mM phenylmethylsulfonyl fluoride (PMSF). CAT activity was measured following the Aebi method [25]. The reaction mixture contained 50 mM potassium phosphate buffer (pH 7.0), 7.5 mM H2O2, and enzyme extract. The enzyme activity of the mixture was determined by measuring the disappearance of H2O2 at 240 nm using an extinction coefficient of 43.6 M−1 cm−1. The amount of enzyme used to catalyze the degradation of 1 µmol H2O2 min−1 mg−1 proteins was considered as the unit of enzyme activity.

Ascorbate Peroxidase

Ascorbate peroxidase (APX) (EC 1.11.1.11) was extracted in 50 mM potassium phosphate buffer (pH 6.8) containing 0.5% (v/v) Triton X-100, 5% PVPP, 1 mM PMSF, 2 mM EDTA, 1 mM DTT, and 1 mM AsA. APX activity was determined in a reaction mixture containing 50 mM phosphate buffer (pH 7.0) and enzyme extract. The reaction was initiated by adding 5 µL of 200 mM H2O2. The enzyme activity was determined by the decrease in absorbance at 290 nm due to enzymatic oxidation of AsA by H2O2 using an extinction coefficient of 2.86 mM−1 cm−1 as described by Murshed et al. [26].

Superoxide Dismutase

Superoxide dismutase (SOD) (EC 1.15.1.1) was extracted in 50 mM potassium phosphate buffer (pH 7.8) containing 0.5% (v/v) Triton X-100, 5% PVPP, 1 mM PMSF, and 2 mM diethylenetriamine-pentaacetic acid (DTPA). The activity of SOD was determined using WST-1 ((2-(4-iodophenyl)-3-(4-nitrophenyl)-5-(2,4-disulfo-phenyl)-2H-tetrazolium (Dojindo, Munich, Germany) by following the modified method of Peskin and Winterbourn [27]. Superoxide ion formation was induced by the reaction of hypoxanthine catalyzed by xanthine oxidase. The reaction mixture contained 50 mM phosphate buffer (pH 7.8), 0.1 mM DTPA, 0.1 mM hypoxanthine, 0.1 mM WST-1, 10 µg ml−1 CAT, 5 mU/mL xanthine oxidase, and enzyme extract diluted 2, 4, 8, and 16 times. WST-1 reduction was monitored by measuring absorbance at 450 nm. Inhibition of WST-1 reduction was expressed as the difference in WST-1 reduction between the control (100% reduction) and the reduction read for the sample. The enzyme unit was defined as the amount of enzyme required for 50% inhibition of WST-1 reduction determined in the control measurement.
All absorbance measurements were taken using a Synergy-2 Microplate Reader (Biotek, Winooski, VT, USA).

2.2.4. Data Analysis

All parameters tested were expressed as means ± standard errors (SE). Differences between leaf collection dates, leaf collection year (2019 vs. 2020), and leaf type (sun vs. shade) were considered as fixed factors. Changes in chlorophyll content were considered senescence markers. Changes in H2O2 content, TBARS content, and carotenoid/chlorophyll ratio were considered oxidative stress markers. Changes in the activity of the leaf antioxidant system were analyzed by measuring the total, reduced, and oxidized AsA and glutathione contents and the activity of CAT, APX, and SOD enzymes. Due to the observed deviations in the leaf morphological parameters from the normal distribution, the significance of differences between collection years and leaf type was analyzed using the nonparametric Mann–Whitney U test. Repeated measures ANOVA (RM-ANOVA), with the Tukey test for multiple-range analysis as a post hoc test, was used to analyze the biochemical parameters of leaves when the data satisfied the requirements of ANOVA. The differences were considered significant at p < 0.05. Prior to the analysis, the data were checked for normal distribution (Kolmogorov–Smirnov test, p < 0.05) and homogeneity of variance (Bartlett’s test) [28]. To demonstrate the relationships between the senescence markers (chlorophylls and carotenoids), the oxidative stress markers, and the antioxidative system activity, Pearson’s correlation analysis and principal component analysis (PCA) were performed. For PCA, the components with eigenvalues lower than one were discarded. To check whether the PCA was justified, the correlation coefficients between the variables were calculated; the Bartlett test was carried out; and the Kaiser–Meyer–Olkin (KMO) criterion was analyzed. All analyses were carried out, and graphs were plotted using Statistica software, version 13 (Statsoft Inc., Tulsa, OK, USA), and OriginPro 2022 (OriginLab Corp., Northampton, MA, USA).

3. Results

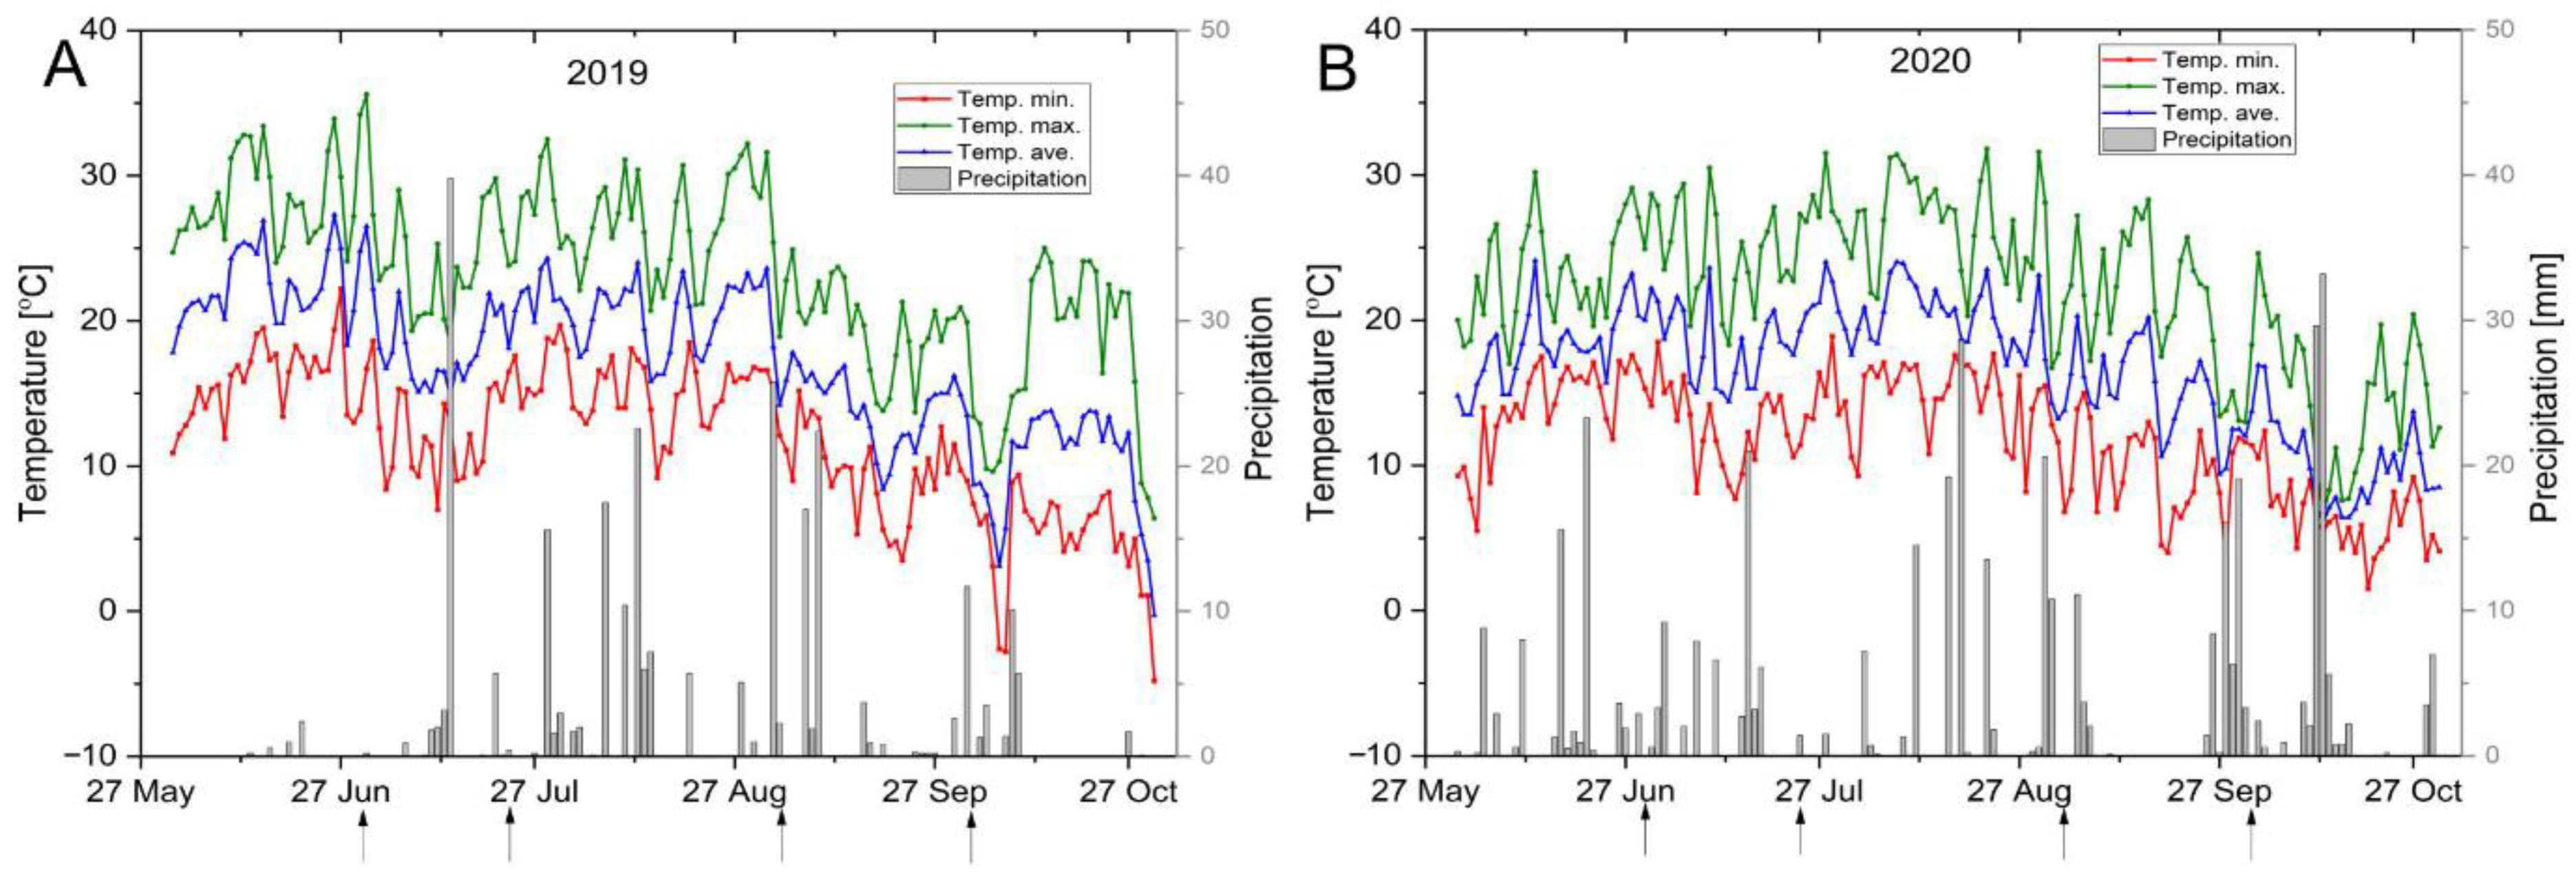
3.1. Climatic Conditions

The climatic conditions during the leaf collection period in 2019 and 2020 are shown in Figure 1A,B. The minimum, mean, and maximum temperature, amplitude, and amount of precipitation in June (2 weeks before the first leaf collection date), July, August, and September are presented in Table 1. Higher minimum, mean, and maximum temperatures were observed throughout the leaf collection period in 2019 than in 2020 (Figure 1A,B; Table 1). Similarly, the total precipitation in 2019 was about 77% of that in 2020.
During the leaf collection period, temperature patterns differed between 2019 and 2020. In 2020, more stable and mild temperature changes were observed, characterized by a uniform average temperature range of 18–23 °C in June, July, and August, followed by a mild decline in September. In 2019, similar average temperature patterns were observed in June, July, and August. However, there was a sudden decline from about 24 °C to about 15 °C in early September, which was sustained until the end of the leaf collection period. The mean temperature in June was more than 3 °C higher in 2019 compared with that in 2020. The mean temperature in July and August was similar in both years, whereas the temperature in September was 0.6 °C higher in 2020 due to the mild decline (Figure 1A,B). Based on the values of standard deviation and coefficient of variation, the variability of minimum, mean, and maximum temperature during the leaf collection period was found to be higher in 2019 than in 2020 (Table 1).

3.2. Morphological Features of Leaves

Significant differences in the studied traits were observed between sun and shade leaves (Table 2). In sun leaves, leaf length, width, and leaf area were significantly higher than in shade leaves (p < 0.001). Sun leaves showed about 22%–26% higher length and width and more than 50% higher total area in comparison to shade leaves. They were also found to be almost 35% thicker than shade leaves. The higher length, width, and area of sun leaves resulted in an approximately 36% higher leaf perimeter than that of shade leaves. However, sun leaves were characterized by less variation compared with shade leaves (Table 2). Despite significant differences in leaf length and width, both sun and shade leaves showed similar leaf index values and variability. Measurements revealed significantly longer petioles, which, combined with the higher leaf length, resulted in a significantly lower petiolar index in the sun leaves compared with shade leaves. Except for leaf perimeter and petiole index, all these traits showed higher variability (standard error and coefficient of variation) in sun leaves compared with shade leaves (Table 2).

3.3. Biochemical Analyses

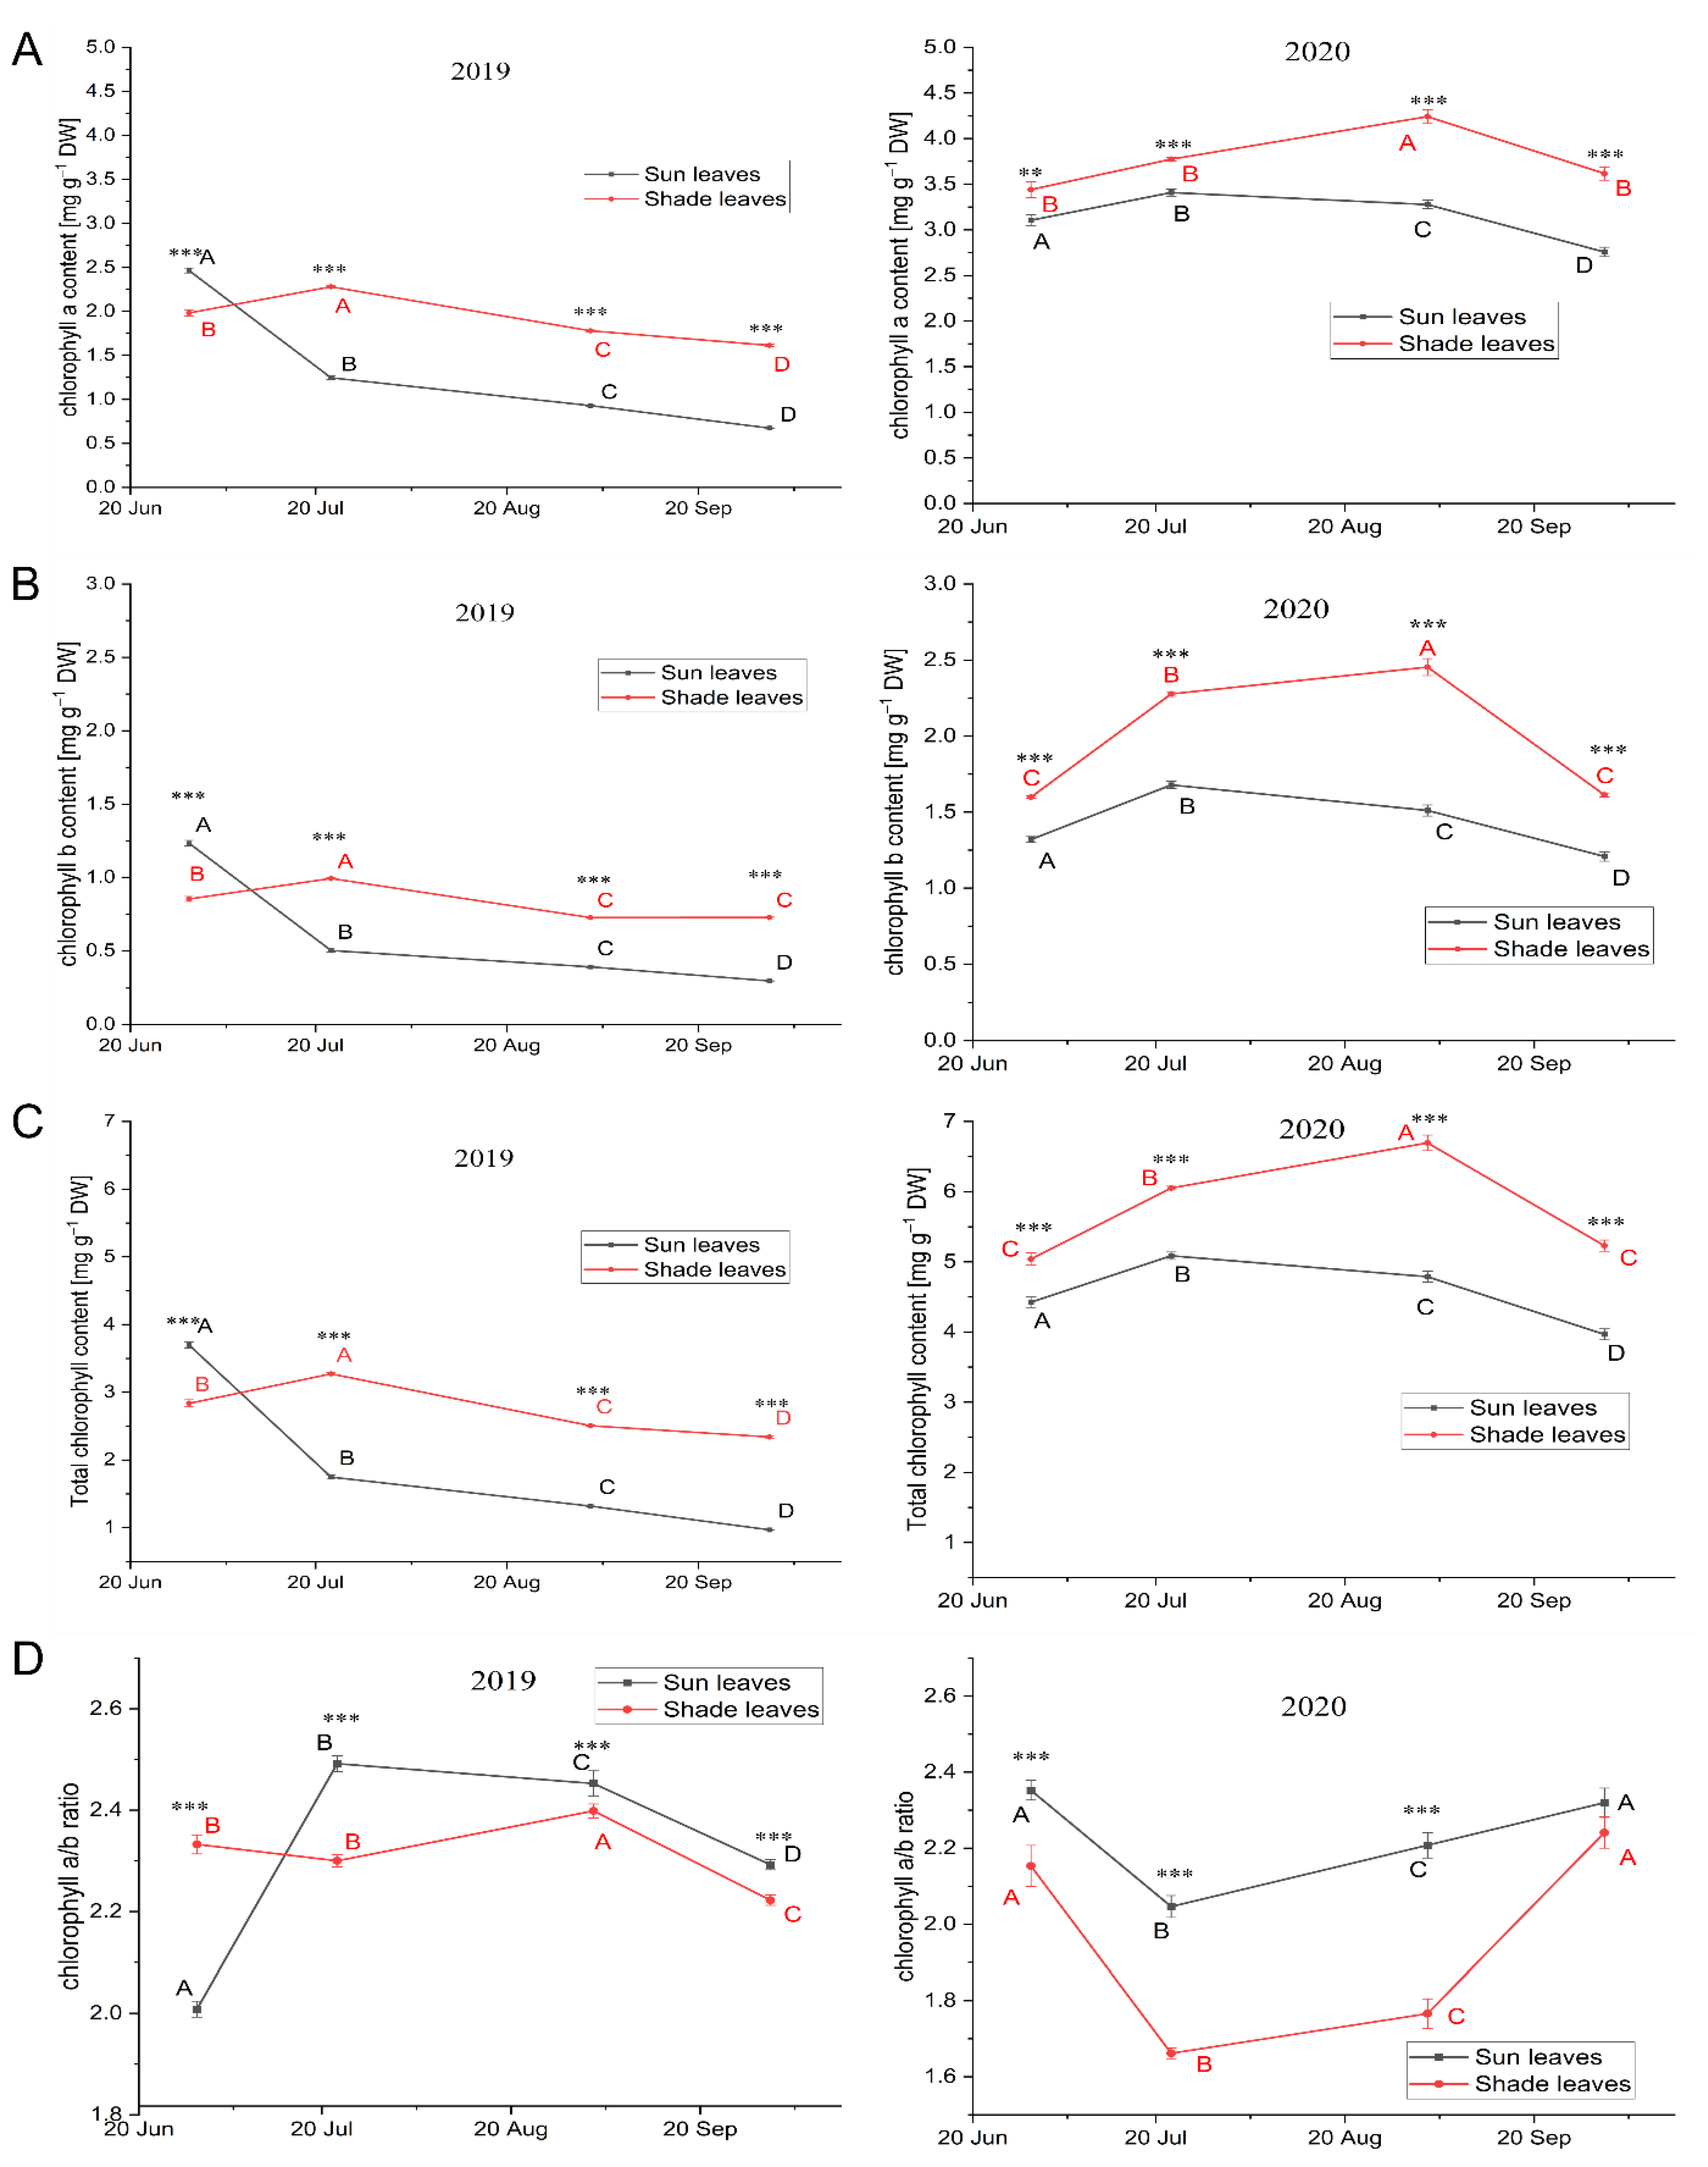
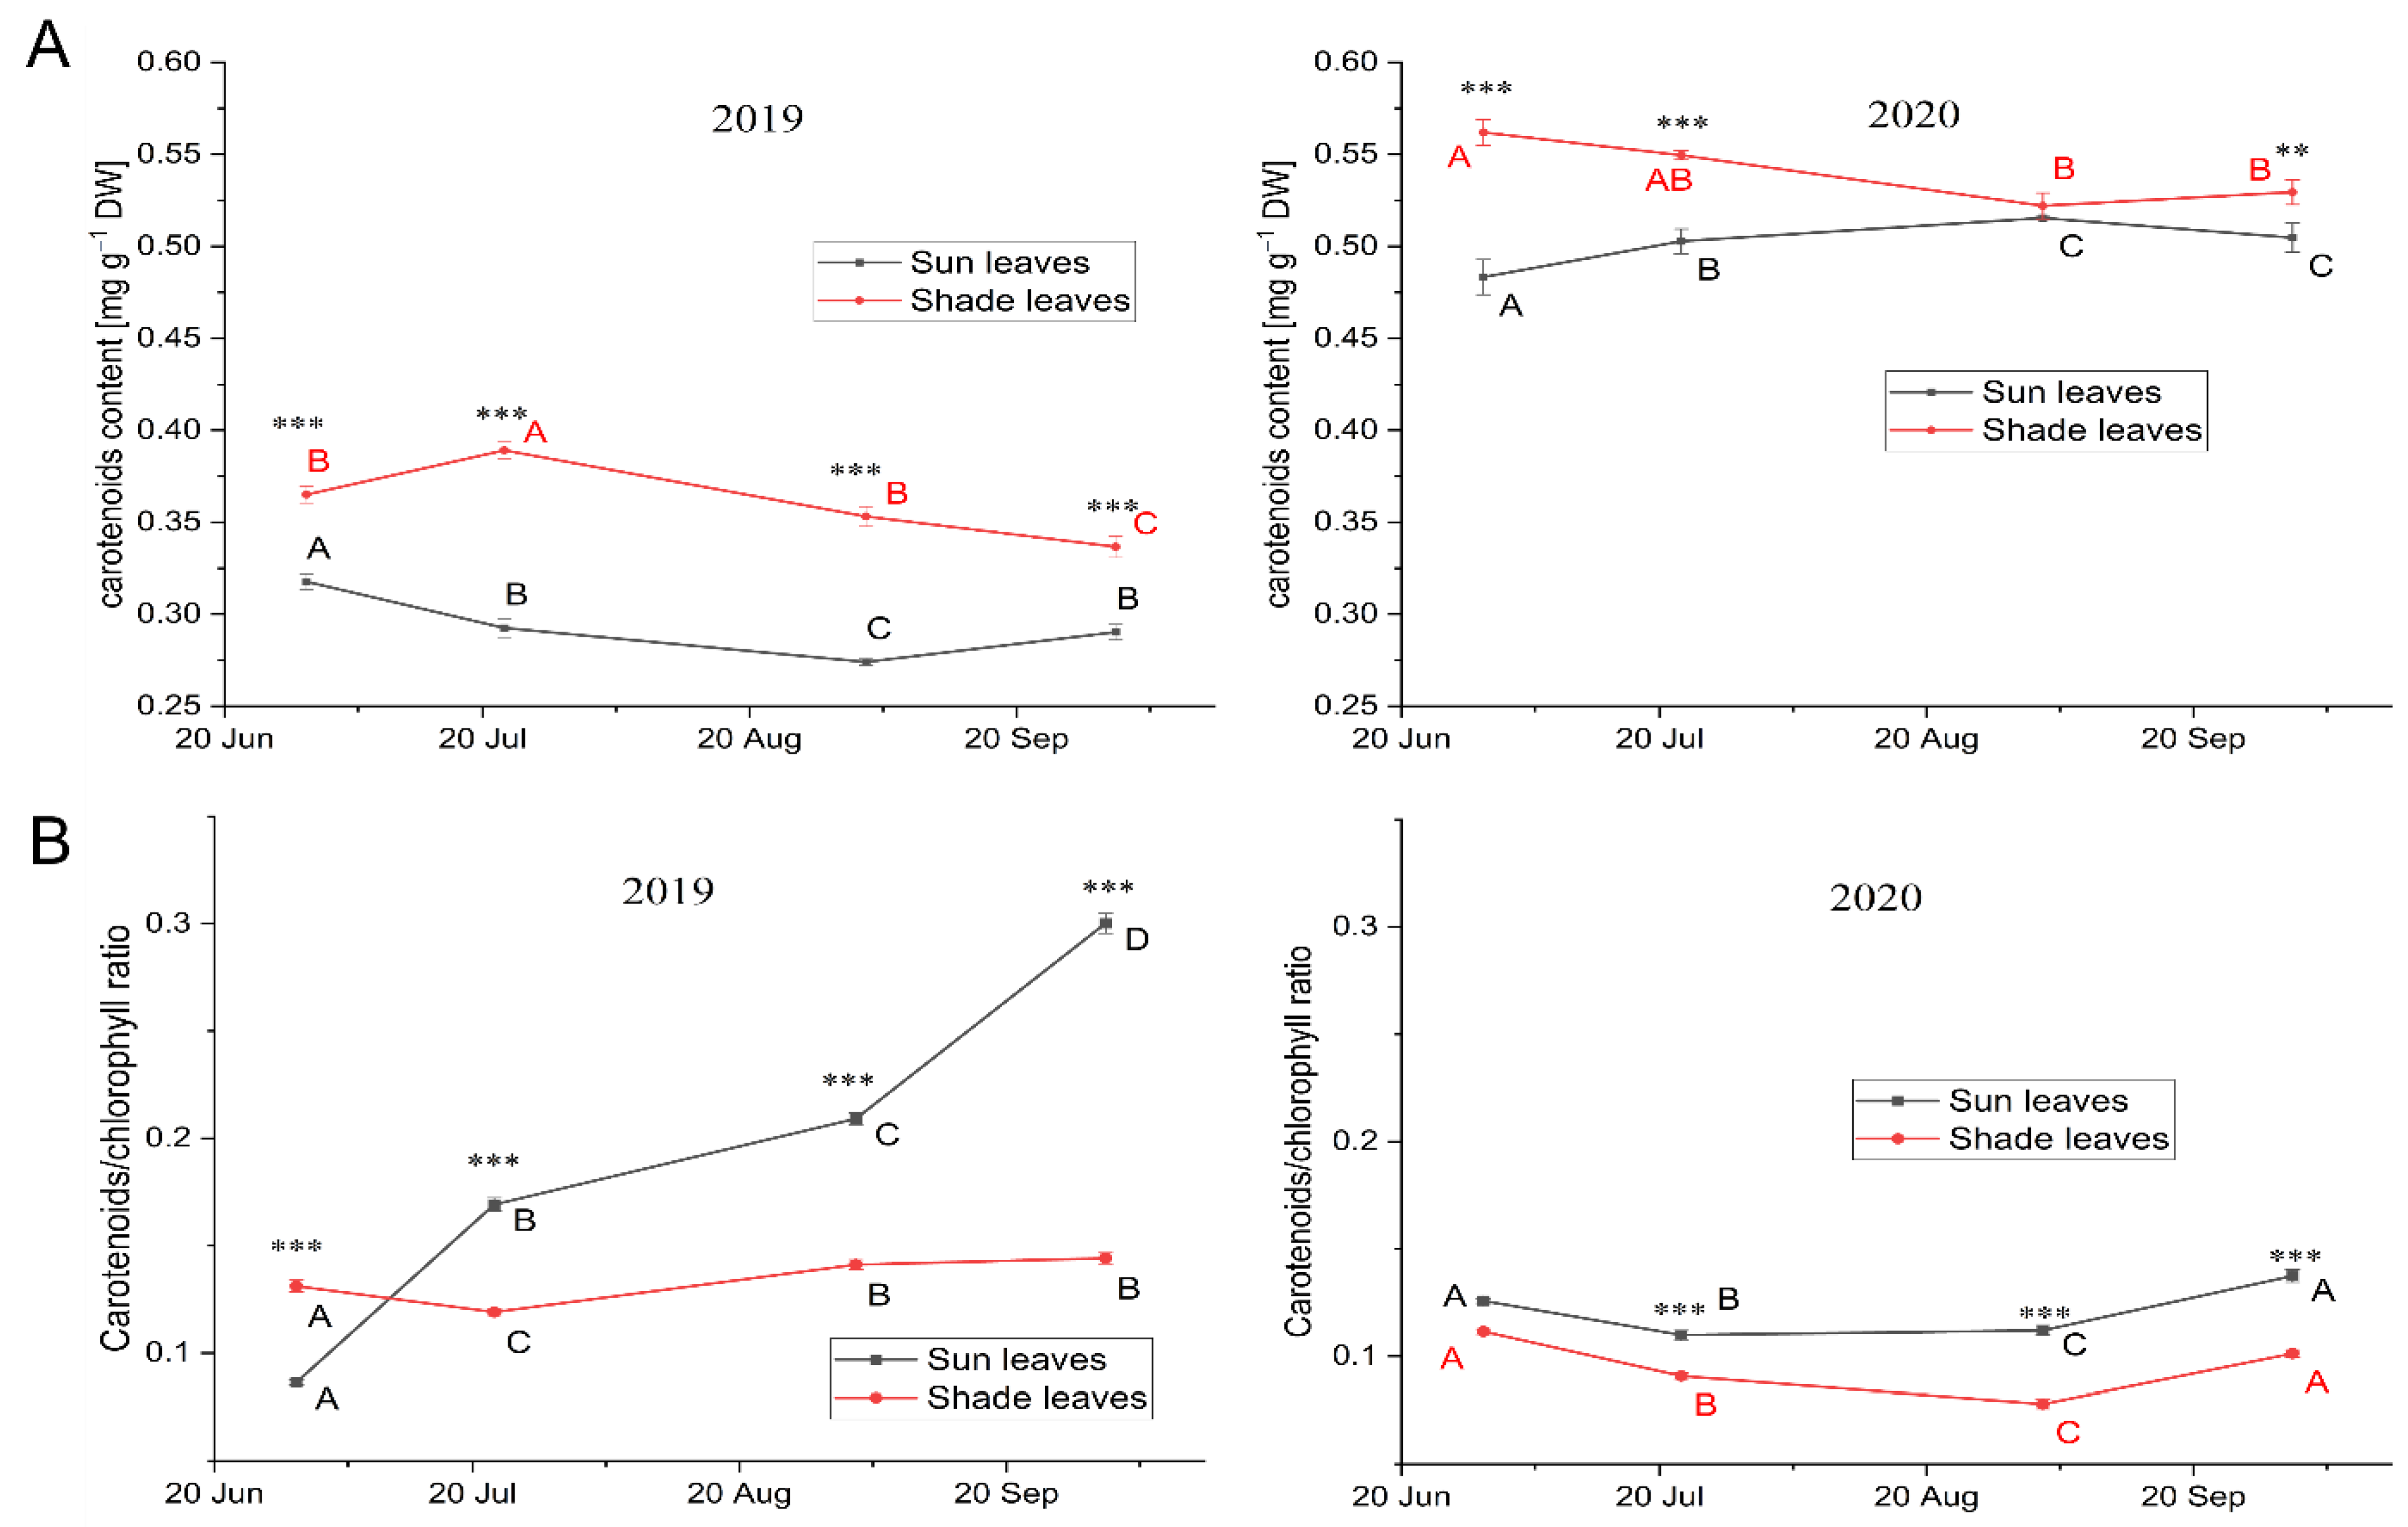
3.3.1. Leaf Pigment Content

In all leaf collection dates and vegetation periods, shade leaves had significantly higher contents of chlorophyll a, chlorophyll b, and total chlorophyll compared with sun leaves (Figure 2A–C). The time in which the maximum chlorophyll content was observed in leaves depended on leaf type and climatic conditions in a particular year. Shade leaves had the highest chlorophyll content on about 20 July 2019 and 3 September 2020, whereas for sun leaves, it was about 30 June 2019 and 20 July 2020. The occurrence of the maximum chlorophyll content was found to be delayed in 2020 relative to 2019 (Figure 2A–C). The fastest decline in the chlorophyll content was observed after the onset of leaf senescence in September in sun leaves. A comparison of the percent degradation of chlorophylls during the leaf collection period showed twice as fast chlorophyll degradation in the sun leaves compared with that of shade leaves (Figure 2A–C). The rate of chlorophyll a and chlorophyll b degradation was uneven and differentiated in a particular year and caused changes in the ratio of these two pigments. Although variability in the chlorophyll content did not allow interpreting the direction of changes of this index in a particular year characterized by specific thermal and precipitation conditions, its value was significantly lower in shade leaves for both vegetation periods, which denotes a higher proportion of chlorophyll b per unit mass of the pigment (Figure 2D).
A significantly higher carotenoid content was found in shade leaves than in sun leaves (Figure 3A). The carotenoid content depended on the climatic conditions of a given year. A significantly higher carotenoid content was found in 2020, which was characterized by a more stable temperature and higher precipitation (Table 1). A slight decrease in the carotenoid content was observed in shade leaves for most of the leaf collection period, regardless of the year of collection (Figure 3A). On the other hand, sun leaves showed a slight decrease in the carotenoid content in the year with higher variability in climatic conditions (2019) but a slight increase in 2020 which was characterized by more stable climatic conditions.

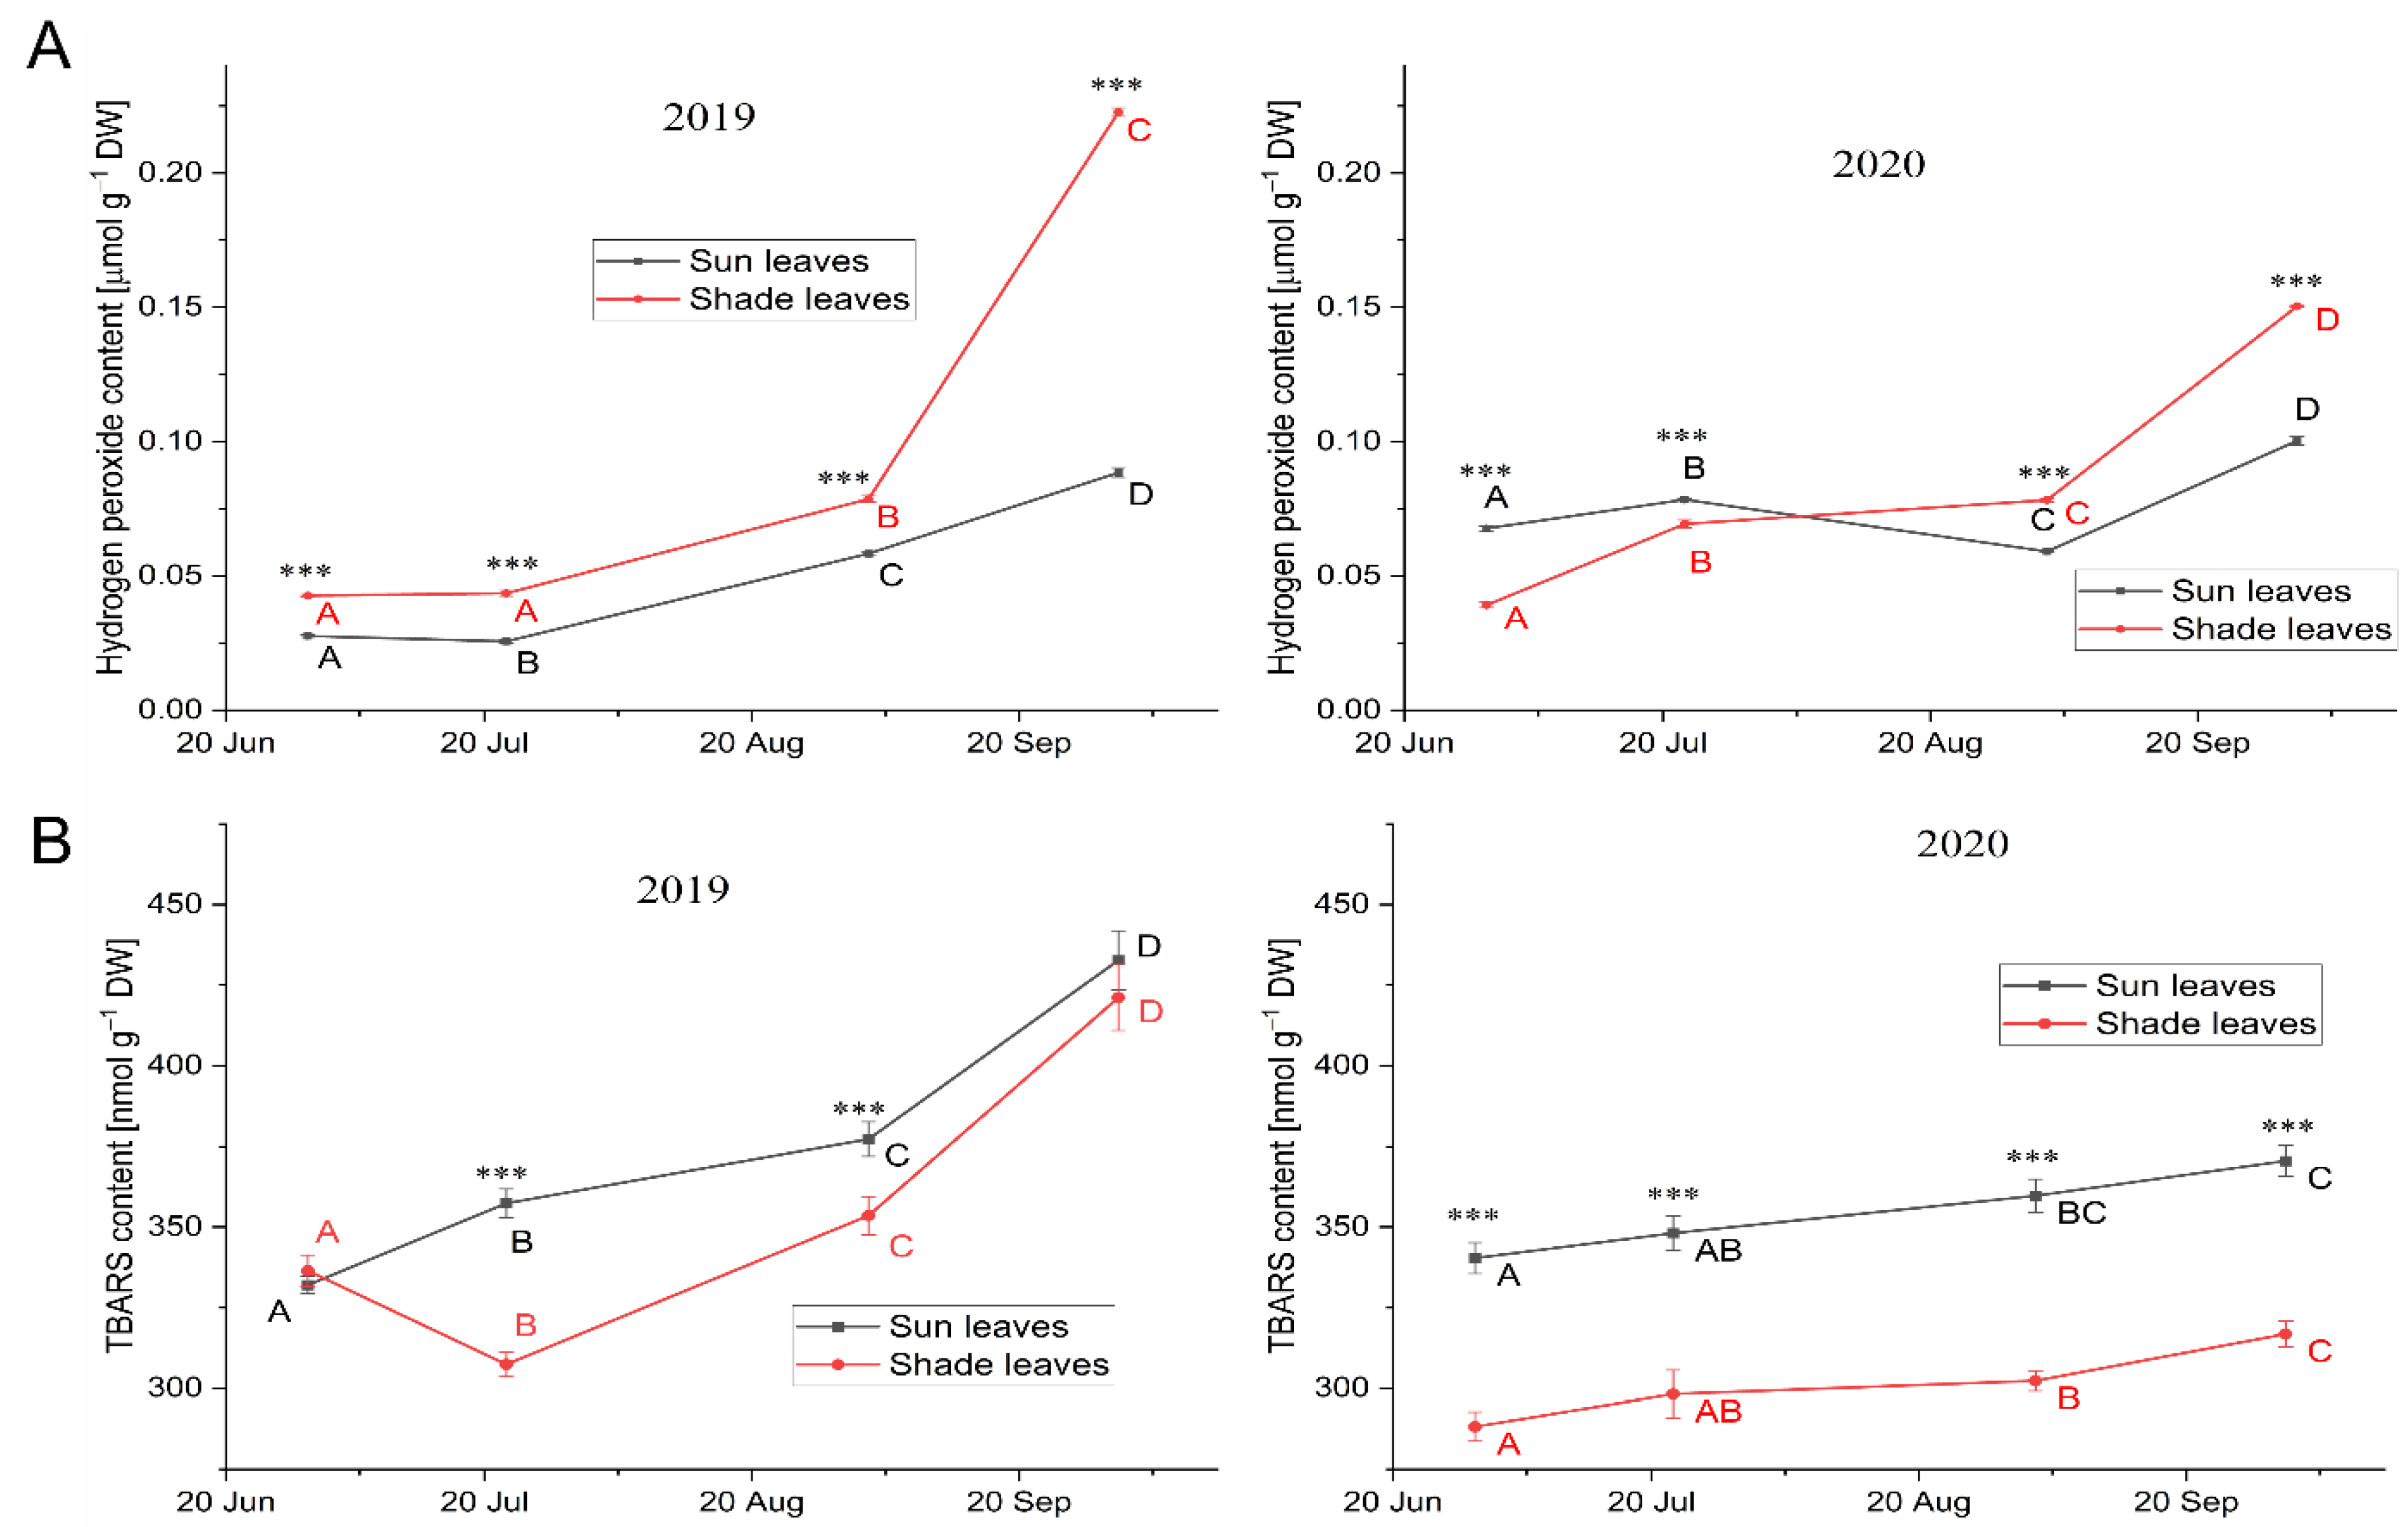
3.3.2. Oxidative Stress Markers

Changes in oxidative stress intensity were determined using the following biochemical parameters: carotenoid/chlorophyll ratio, H2O2 content, and TBARS content (Figure 3B and Figure 4A,B). The carotenoid/chlorophyll ratio was significantly higher in sun leaves, and the increase in the value of this index was greater in 2019, which was characterized by a higher temperature variability and less rainfall (Table 1; Figure 3B) to the extent that it even generated stress conditions. Shade leaves showed a significantly smaller increase in the carotenoid/chlorophyll ratio regardless of climatic conditions in leaf harvest years (Figure 3B).
Significantly higher H2O2 content was noticed in shade leaves during both growing periods (except for the initial period in 2020) (Figure 4A). The increase in the content of this compound was slow in both shade and sun leaves until early September, after which accelerated accumulation was observed in the former following the induction of leaf senescence. Sun leaves did not show an accelerated increase in the H2O2 content at the final stage of leaf collection (Figure 4A).
Throughout the leaf collection period, sun leaves showed a higher content of cell membrane lipid peroxidation products (TBARS; Figure 4B). In 2019, which was characterized by higher variability in thermal conditions and less precipitation, sun leaves showed a continuous increase in the TBARS content. However, shade leaves showed an increase in the TBARS content only from the end of July. In the next growing season (i.e., 2020), which was characterized by more stable climatic conditions, the increase in the TBARS content was slighter and slower compared with the previous growing season. However, in this case, sun leaves showed a higher content of TBARS than shade leaves.

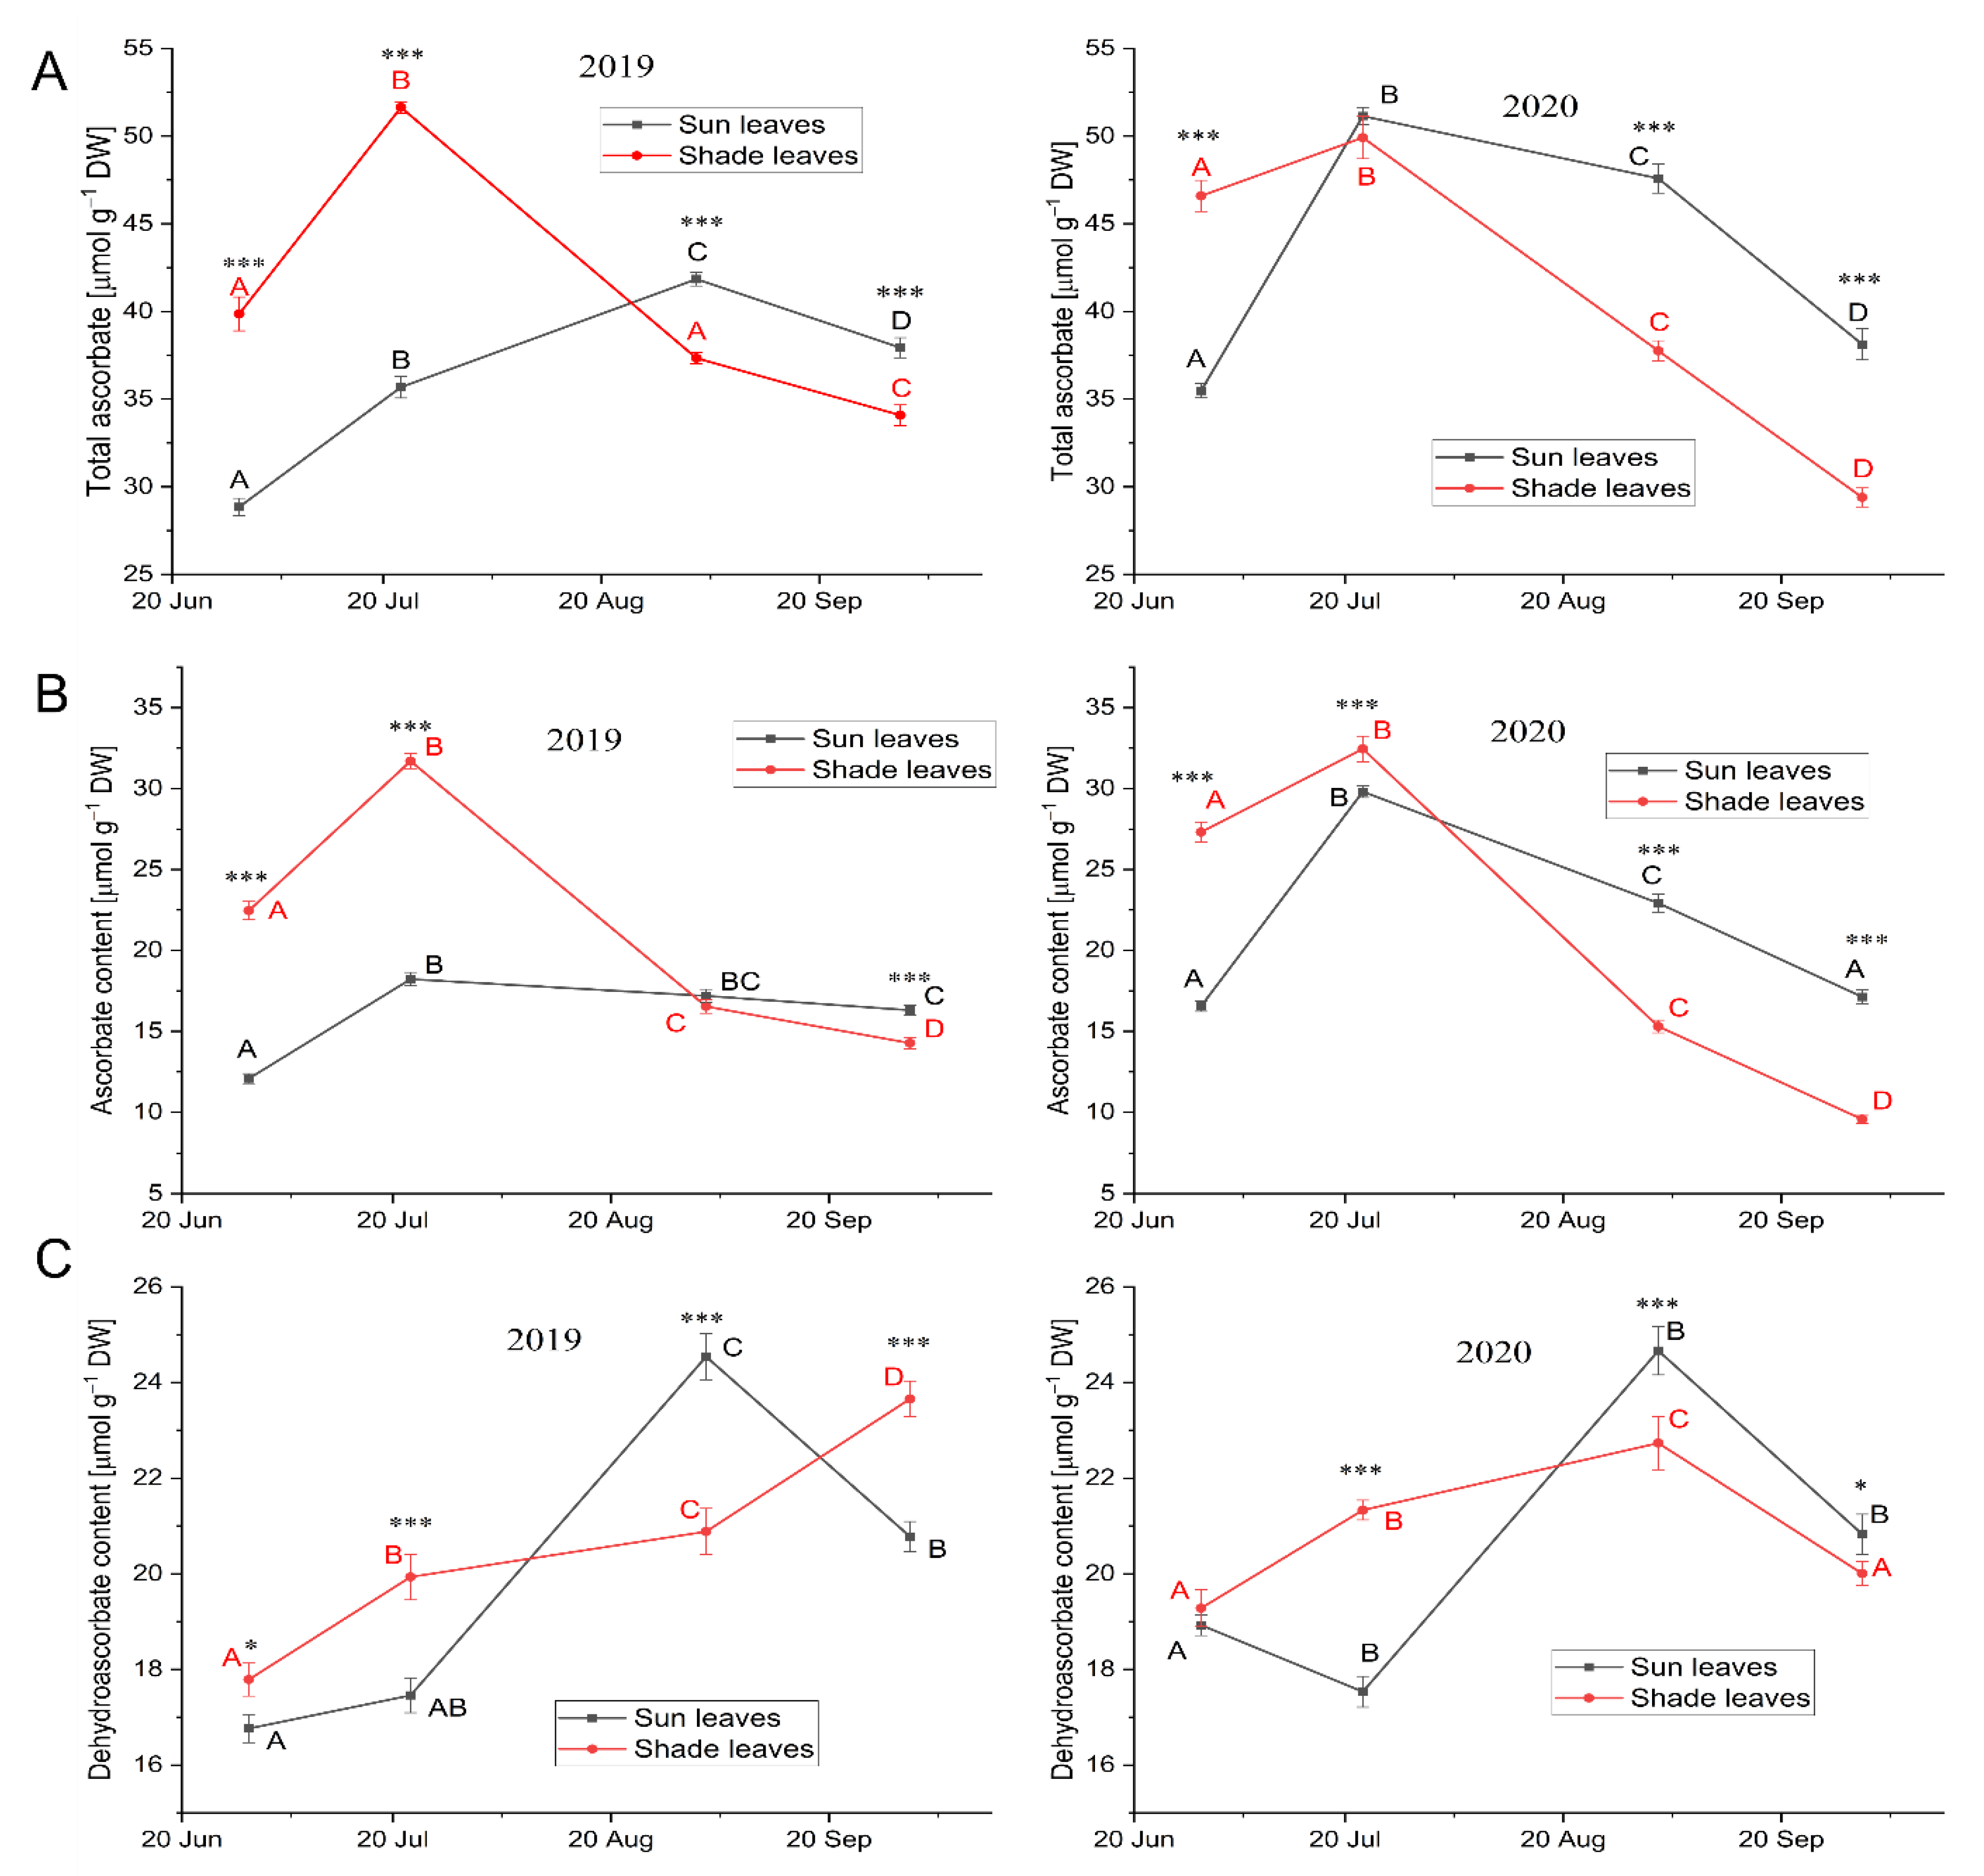
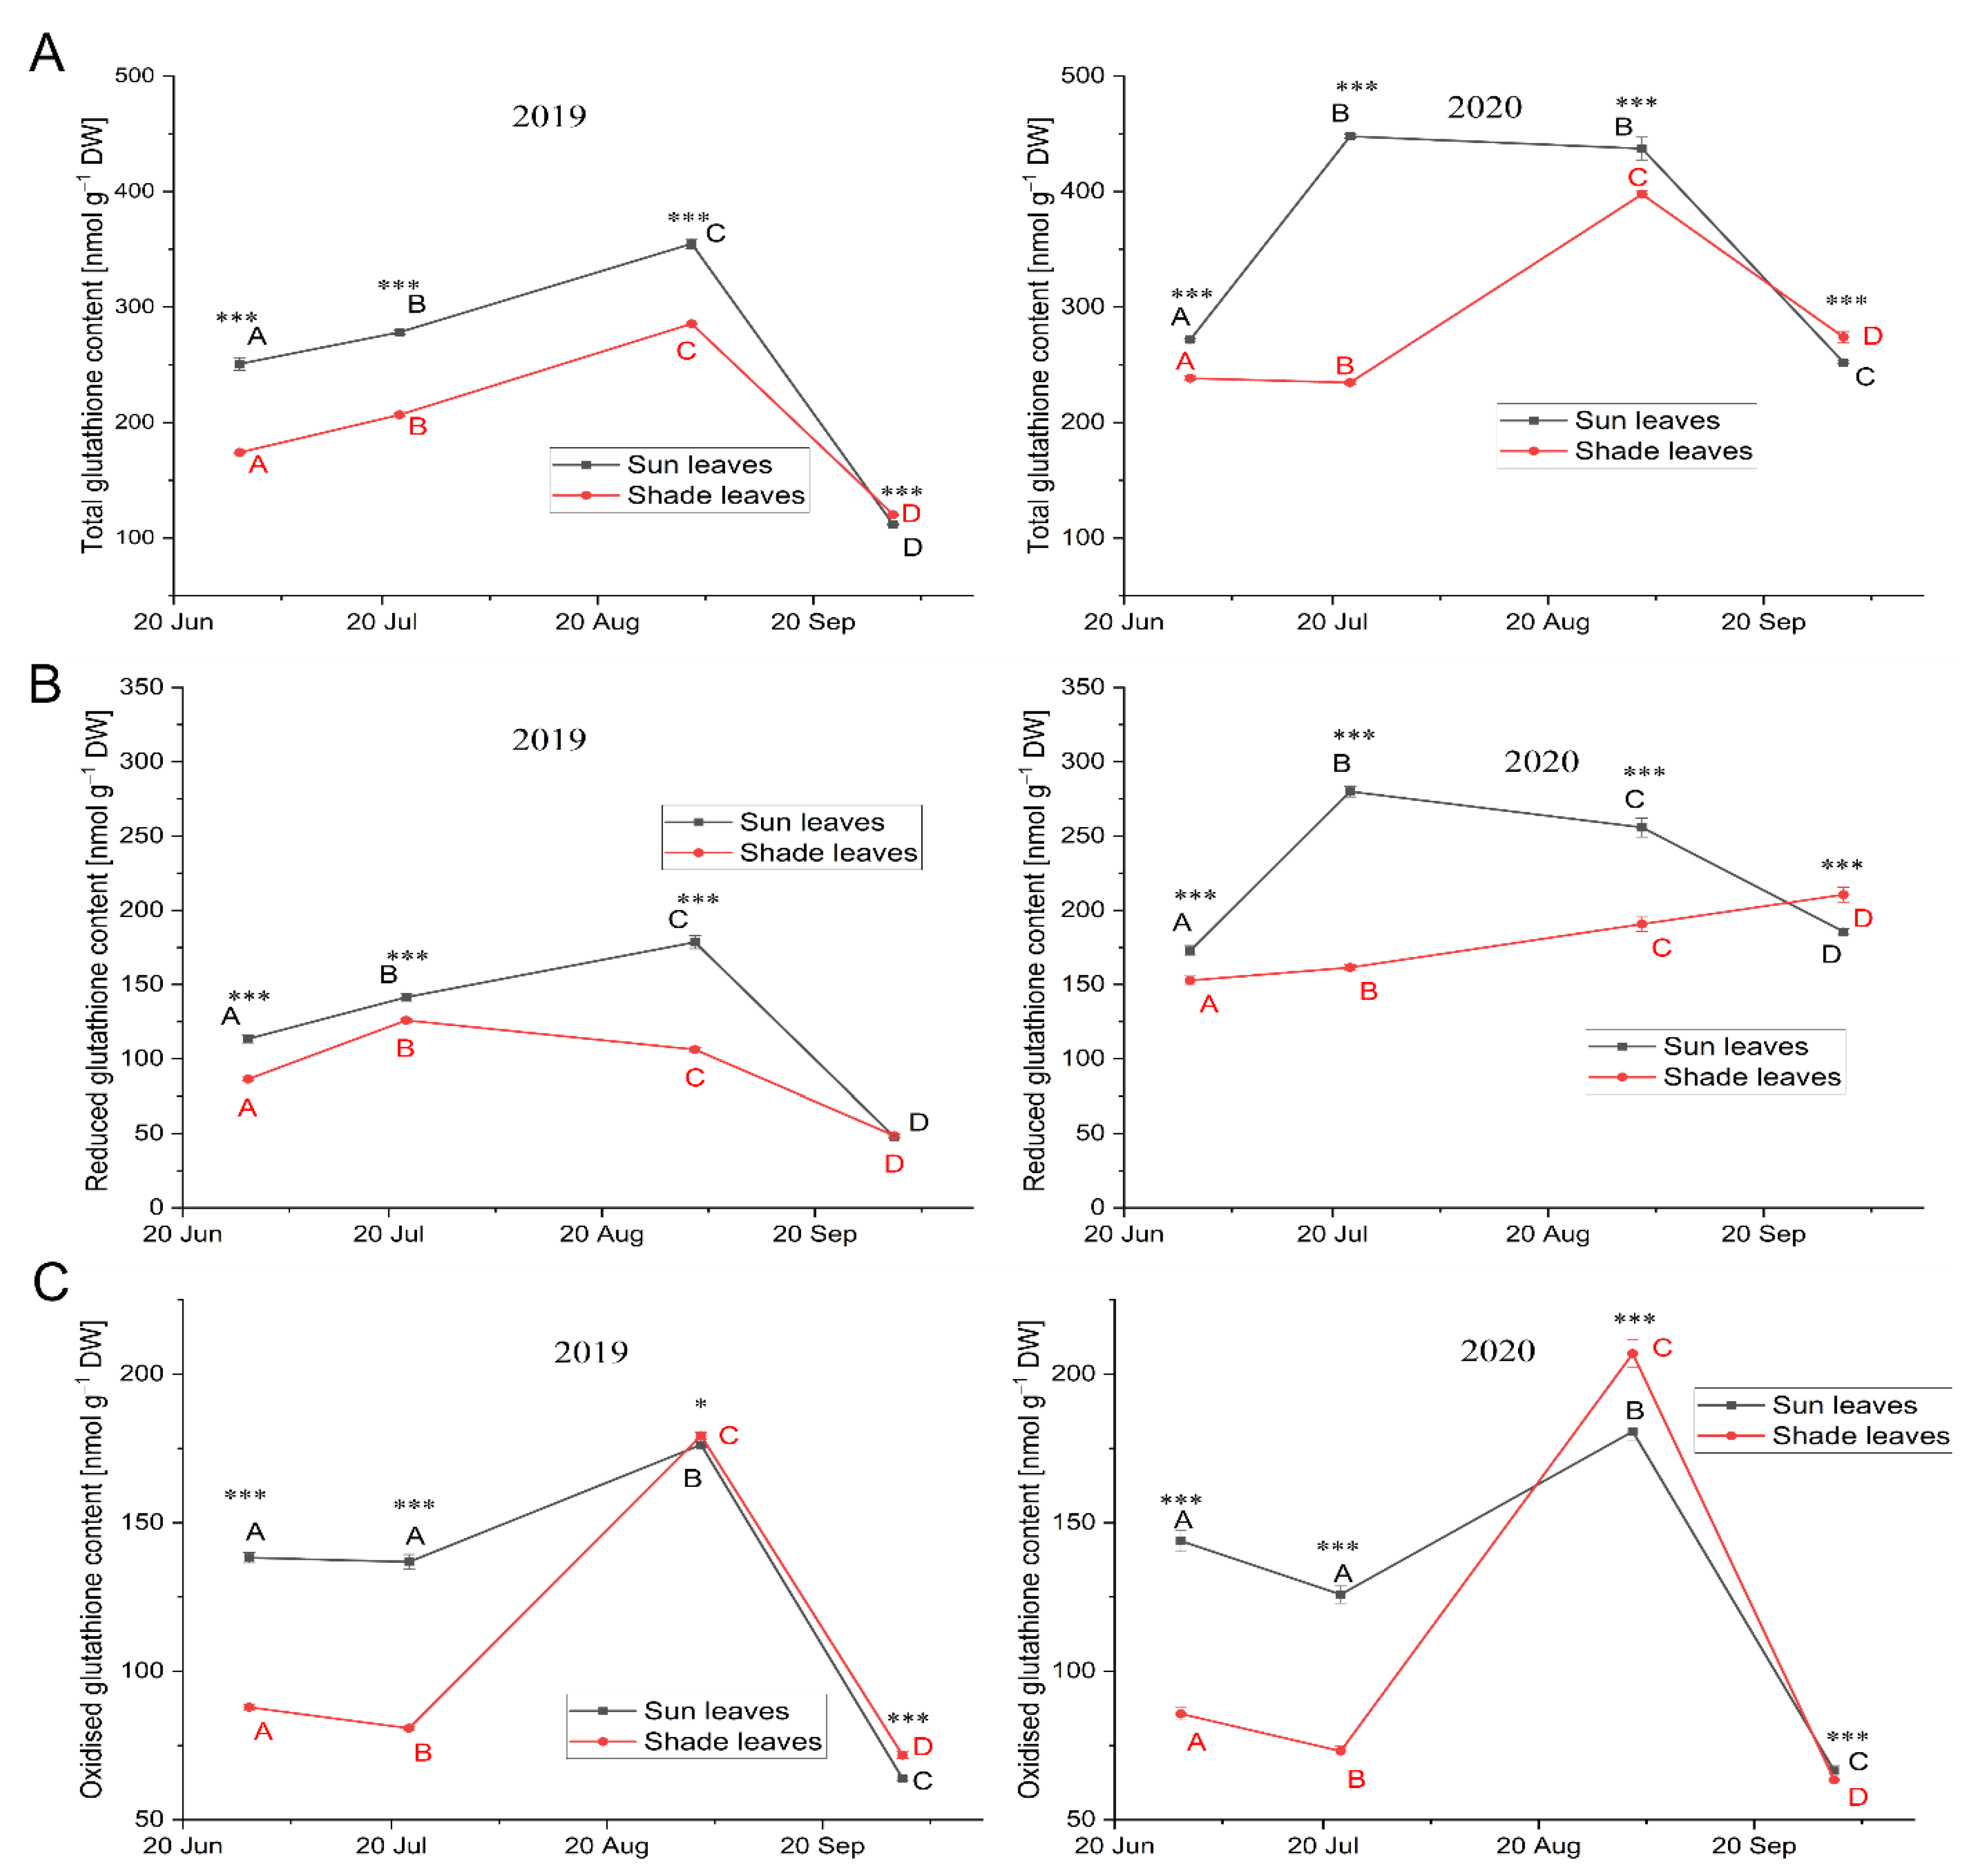
3.3.3. Low-Molecular-Weight Antioxidants

The biochemical response of leaves to the increase in the intensities of oxidative stress was characterized based on changes in the content of low-molecular-weight antioxidants (AsA and glutathione) and the activity of antioxidative enzymes (CAT, APX, and SOD). Initially, a significantly higher total AsA content was found in shade leaves than in sun leaves. For both leaf types, the maximum total AsA content was reached at the end of July (except for sun leaves in 2019), after which a continuous and more rapid decrease in the content was observed in shade leaves (Figure 5A). The cutoff date for changes in both total and reduced AsA content, which were associated with changes in the trend of minimum, average, and maximum temperature, was late August and early September. Leaves collected from sunlight parts of the crown showed maximum or similar contents at that time, whereas shade leaves showed a sudden decrease in the total AsA content. The reduced AsA content showed similar changes with respect to total AsA content in both years of the study (Figure 5B). During the study years, a sudden increase in the content of dehydroascorbic acid (DHA; the oxidized form of AsA) was observed in sun leaves, while a continuous slow increase was observed in shade leaves (Figure 5C). The increase in oxidative stress with a concomitant decrease in the reduced form of AsA resulted in a significantly higher increase in the proportion of DHA to total AsA in sun leaves (Figure 5C).
Compared with shade leaves, the total content of reduced and oxidized forms of glutathione was significantly higher in the sun leaves regardless of the climatic conditions of both years. The maximum glutathione content in both sun and shade leaves was reached in early September, followed by a decrease after induction of senescence (Figure 6A). A significantly higher and rapidly increasing content of reduced glutathione was observed in sun leaves compared with shade leaves (Figure 6B). This increase in the content of the reduced form of glutathione occurred until the beginning of September under the more variable climatic conditions of 2019 and until the end of July under the stable climatic conditions of 2020. Significantly higher content of the oxidized form of glutathione was observed in sun leaves during their growth period (July and August), followed by a sudden and higher increase in shade leaves collected at the beginning of the senescing process (Figure 6C). These mild changes in the content of the reduced glutathione resulted in an increase in the contribution of the oxidized form of this compound to the total glutathione content (Figure 6B,C).

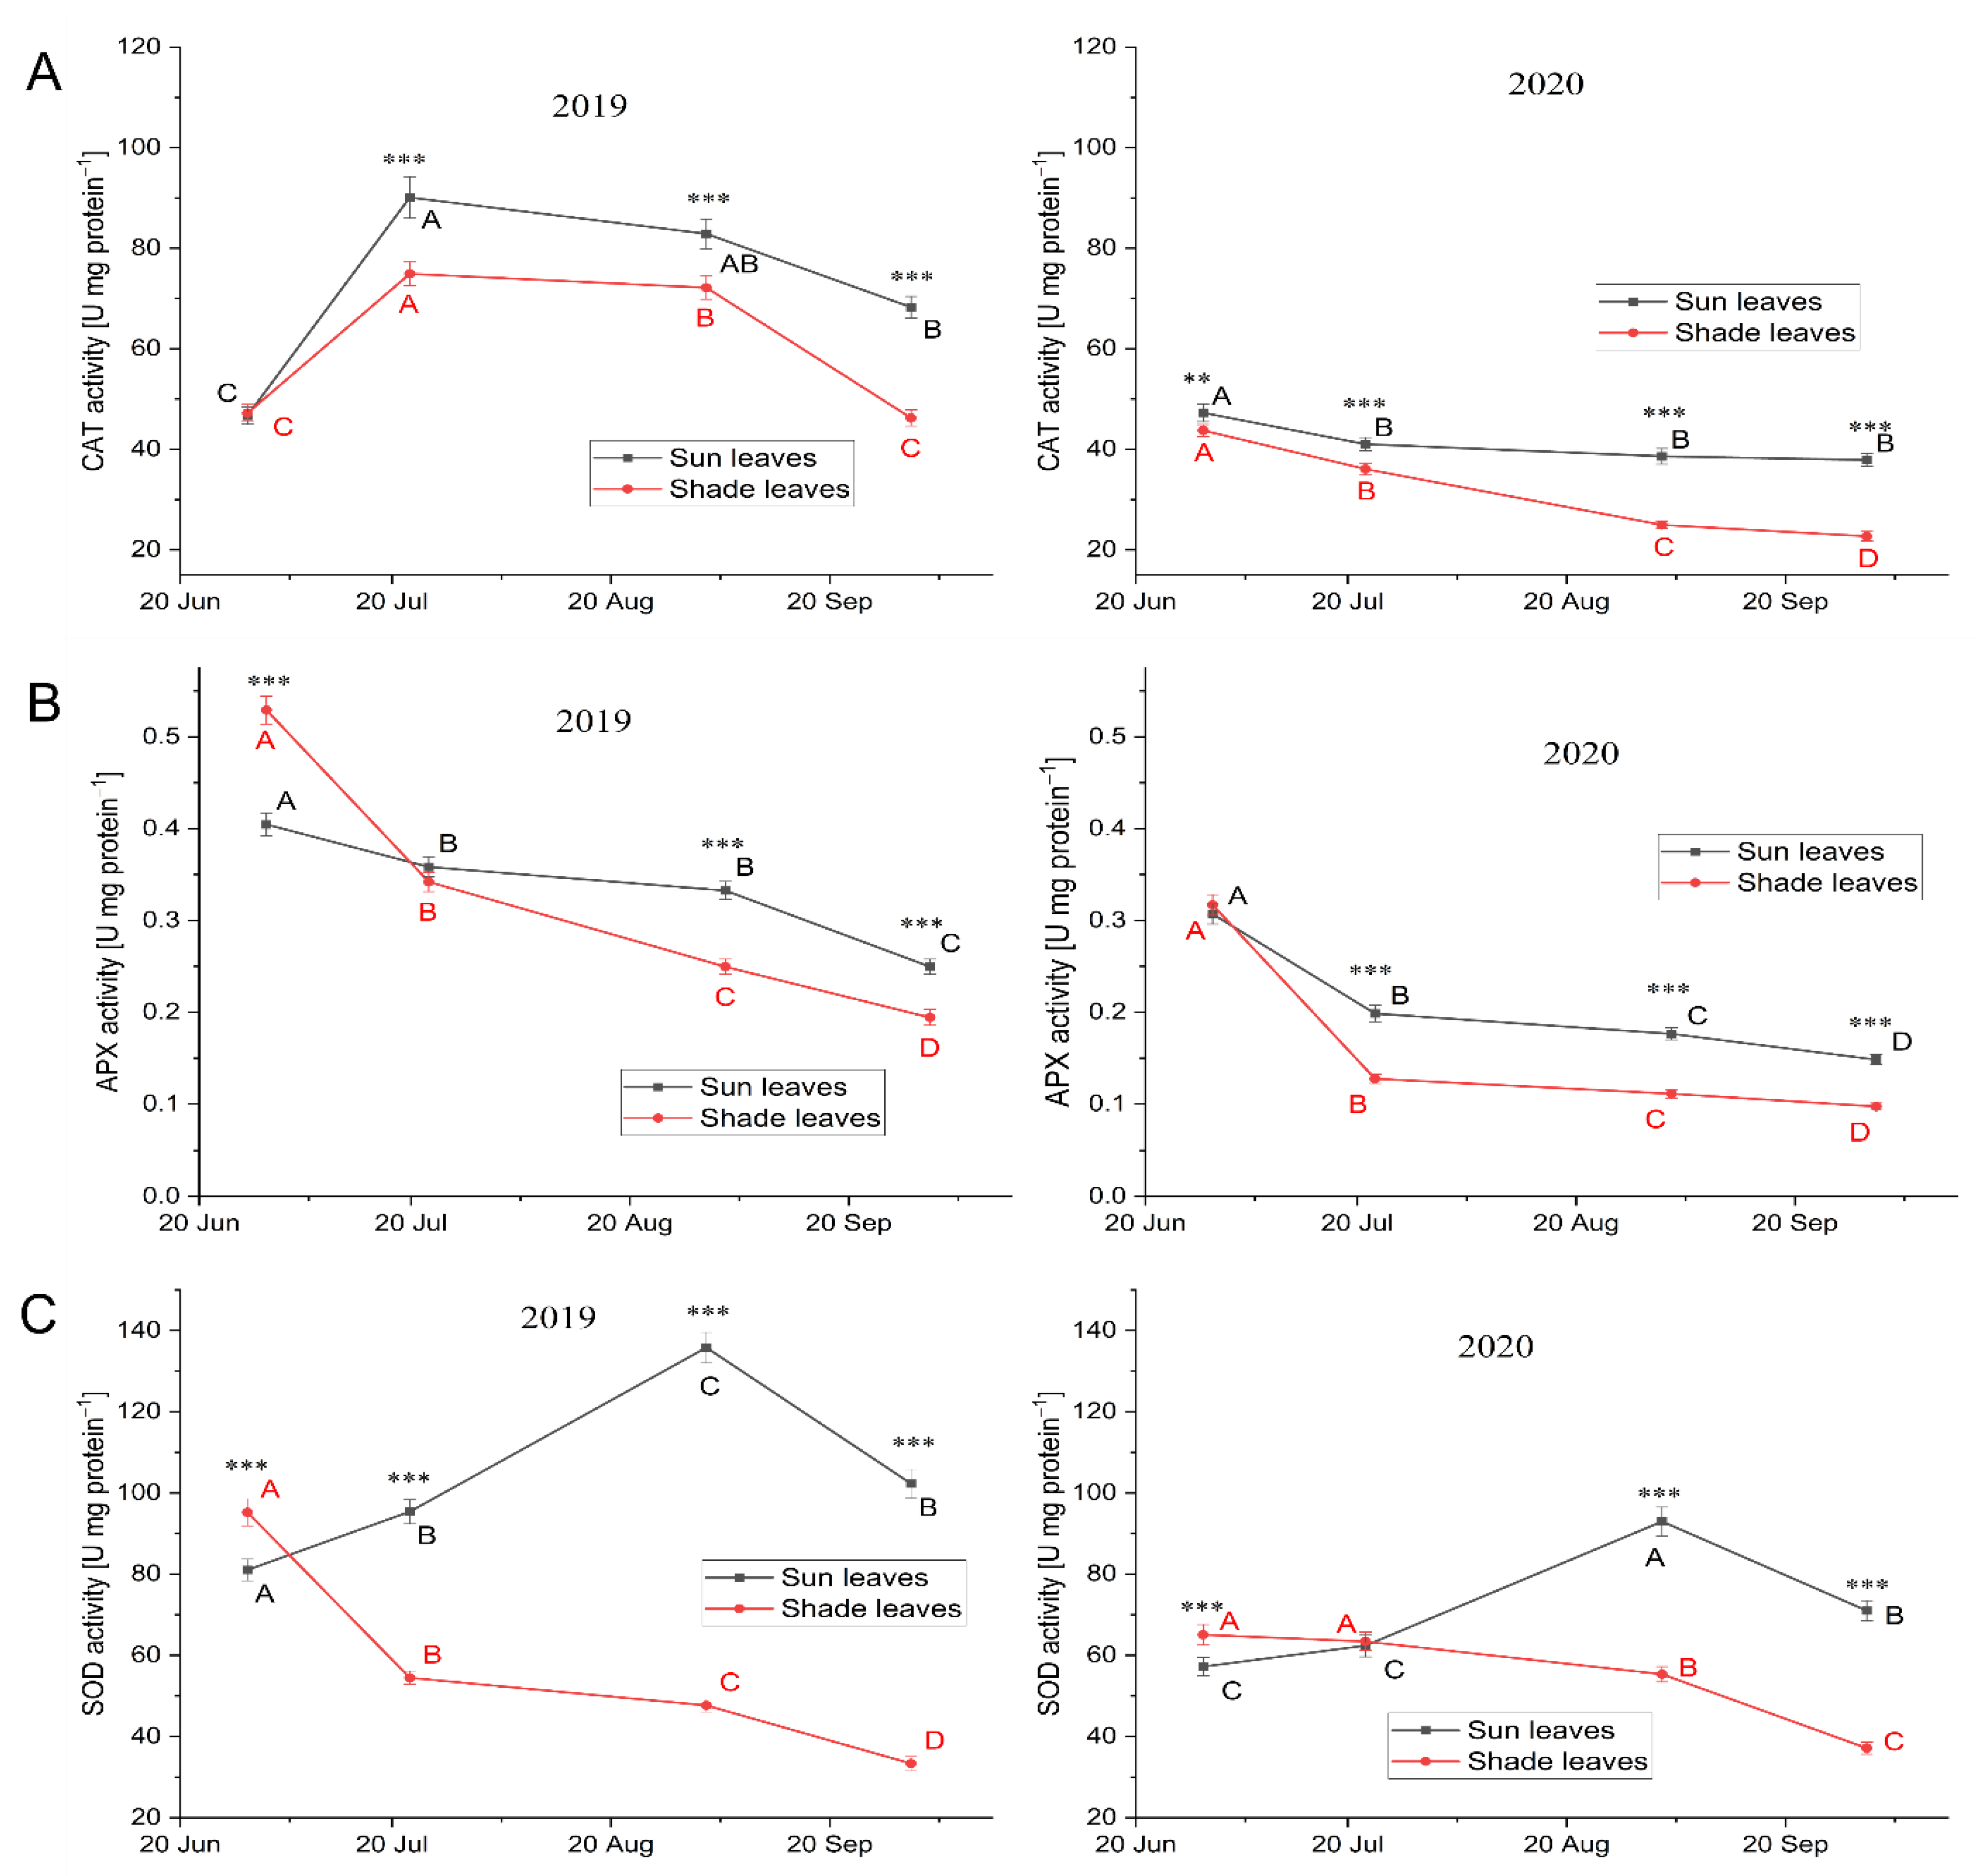
3.3.4. Antioxidative Enzymes

In both years, the activity of CAT, APX, and SOD was significantly higher in sun leaves (Figure 7). The activity of the antioxidative enzyme was found to be significantly higher in 2019, which was more thermally variable. A climate-dependent decrease in the activity of enzymes controlling H2O2 levels (CAT and APX) was observed during the beginning of the leaf collection period (except for CAT in 2019), with a higher decrease in activity in shade leaves. The highest difference in the pattern of activity changes between leaf types was found for SOD, which is responsible for the superoxide ion dismutation reaction (Figure 7C). In both years, an increase in the SOD activity was observed in sun leaves until early September, after which the enzyme activity decreased. The SOD activity increased at a particularly higher rate in the more thermally variable 2019 compared with 2020. A continuous and faster decrease in the SOD activity was noticed in shade leaves in the less climatically favorable 2019 (Figure 7C).

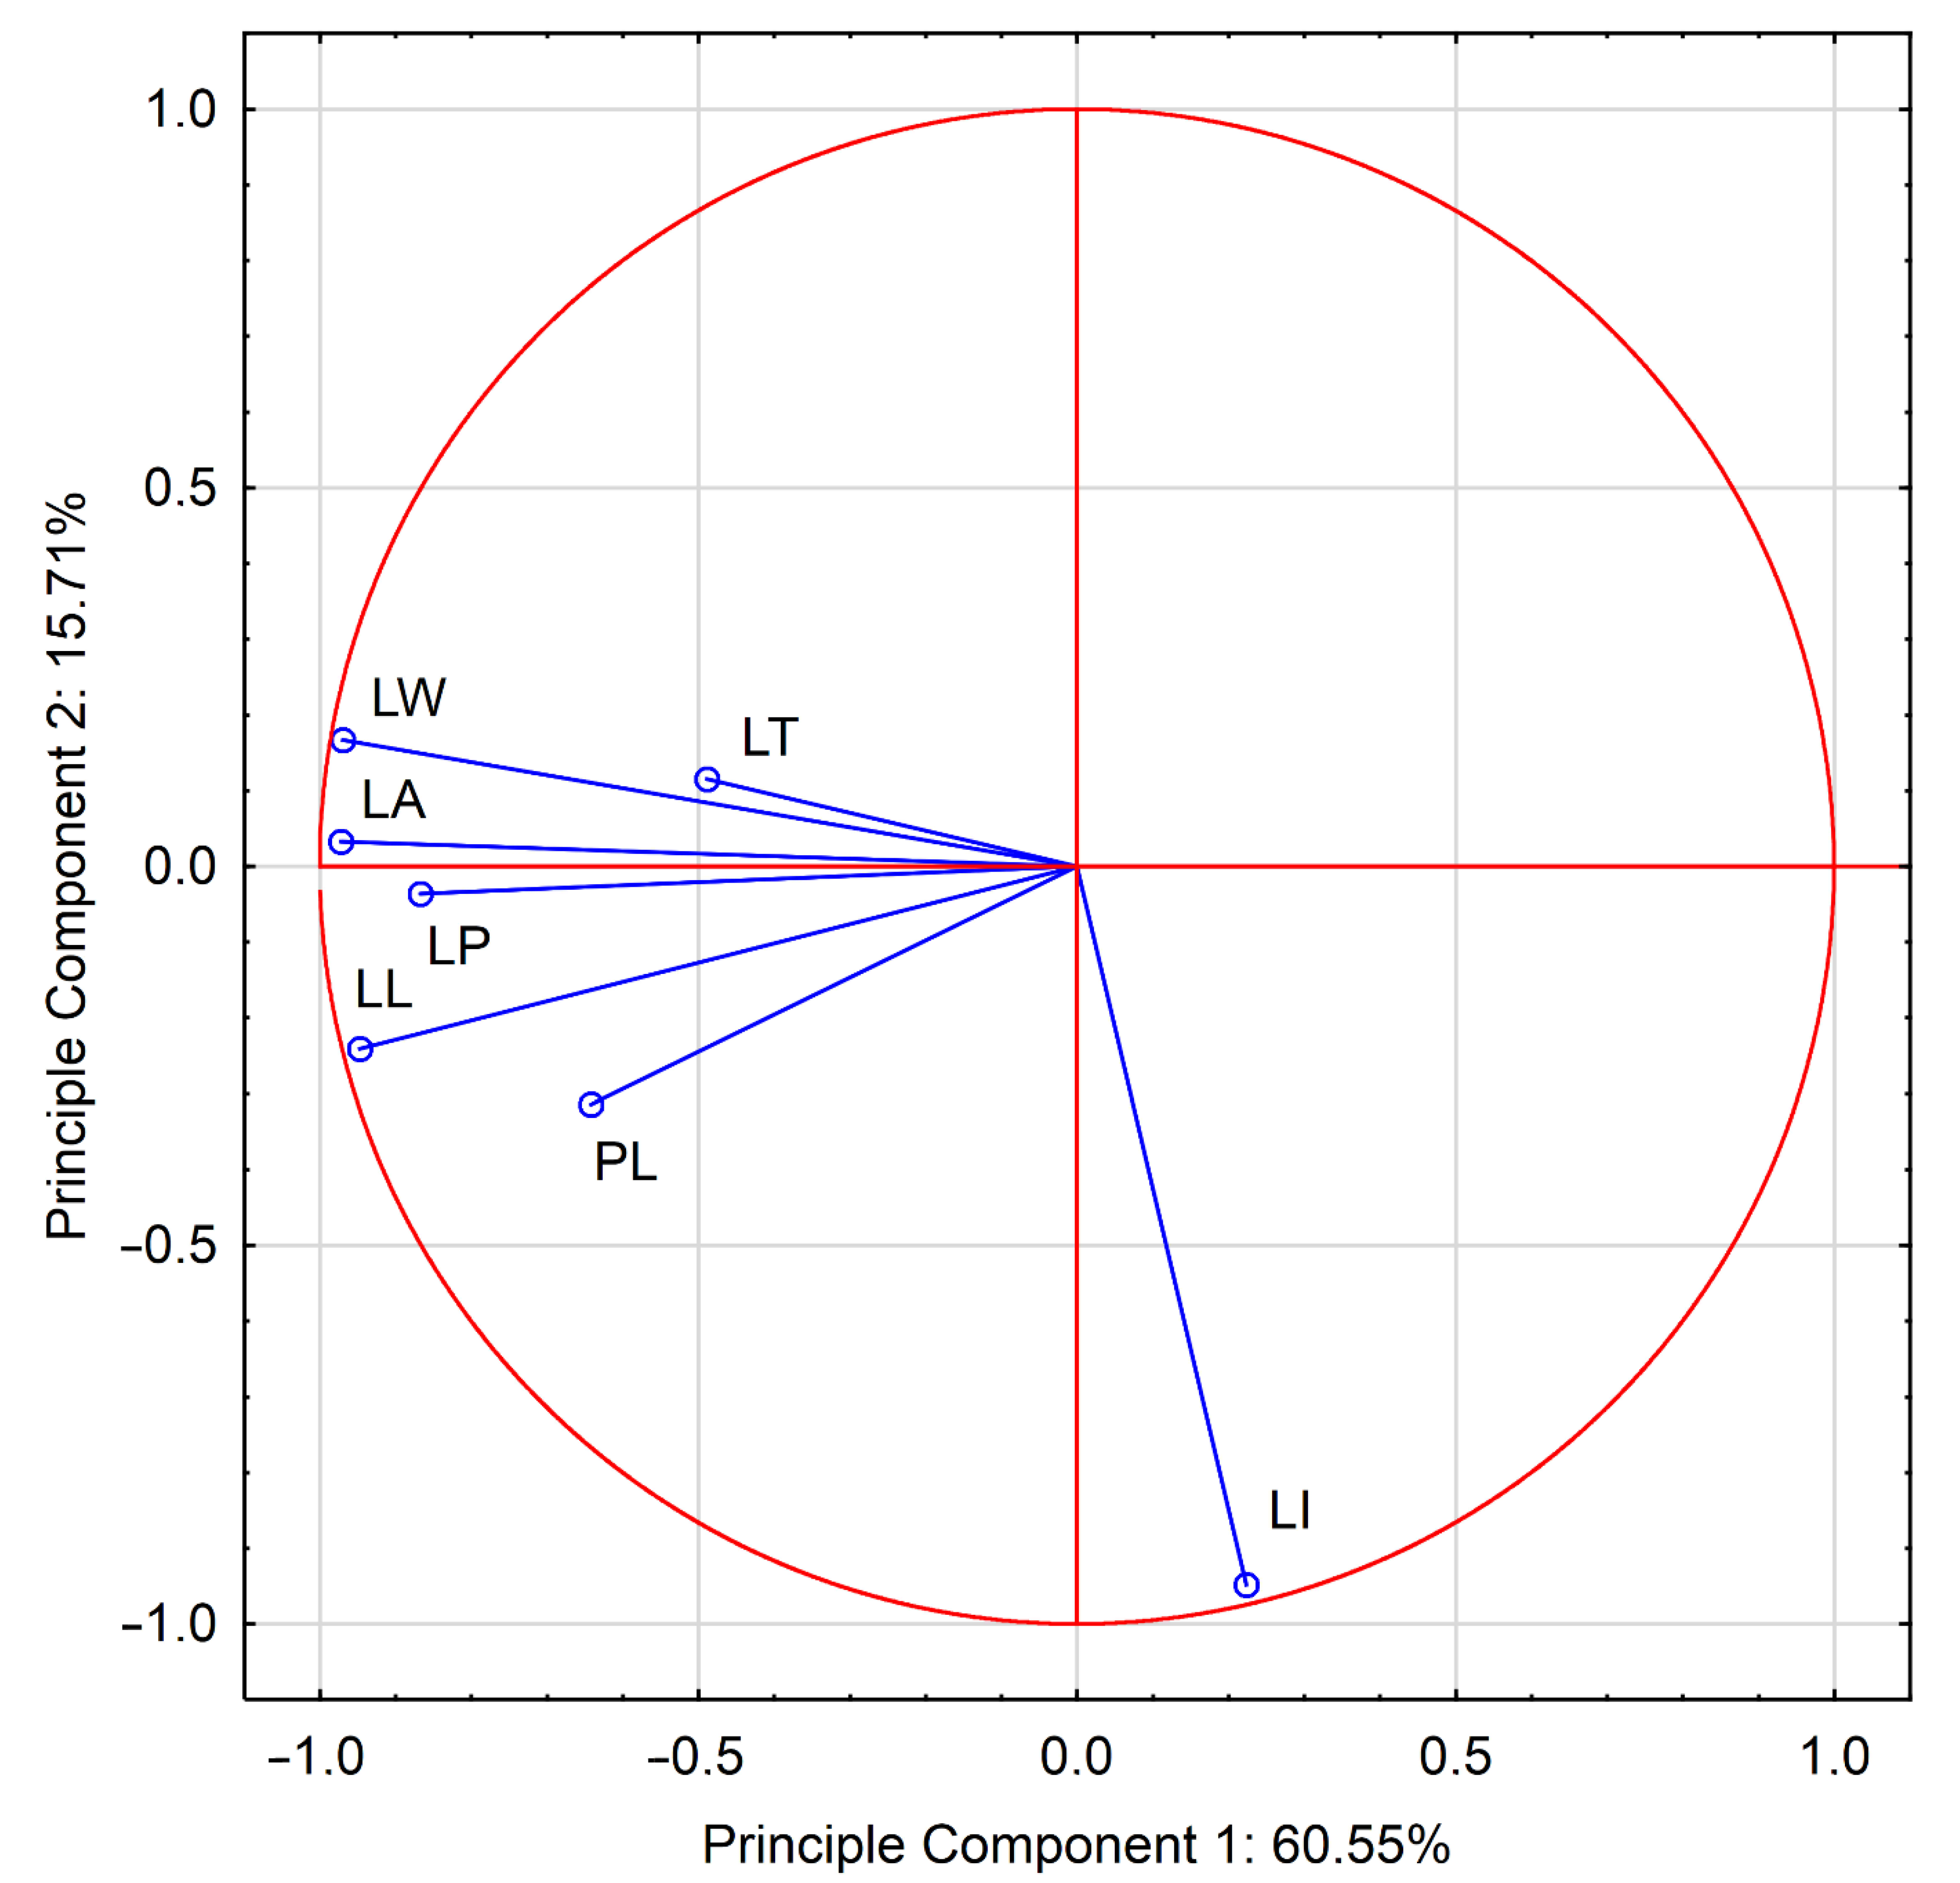
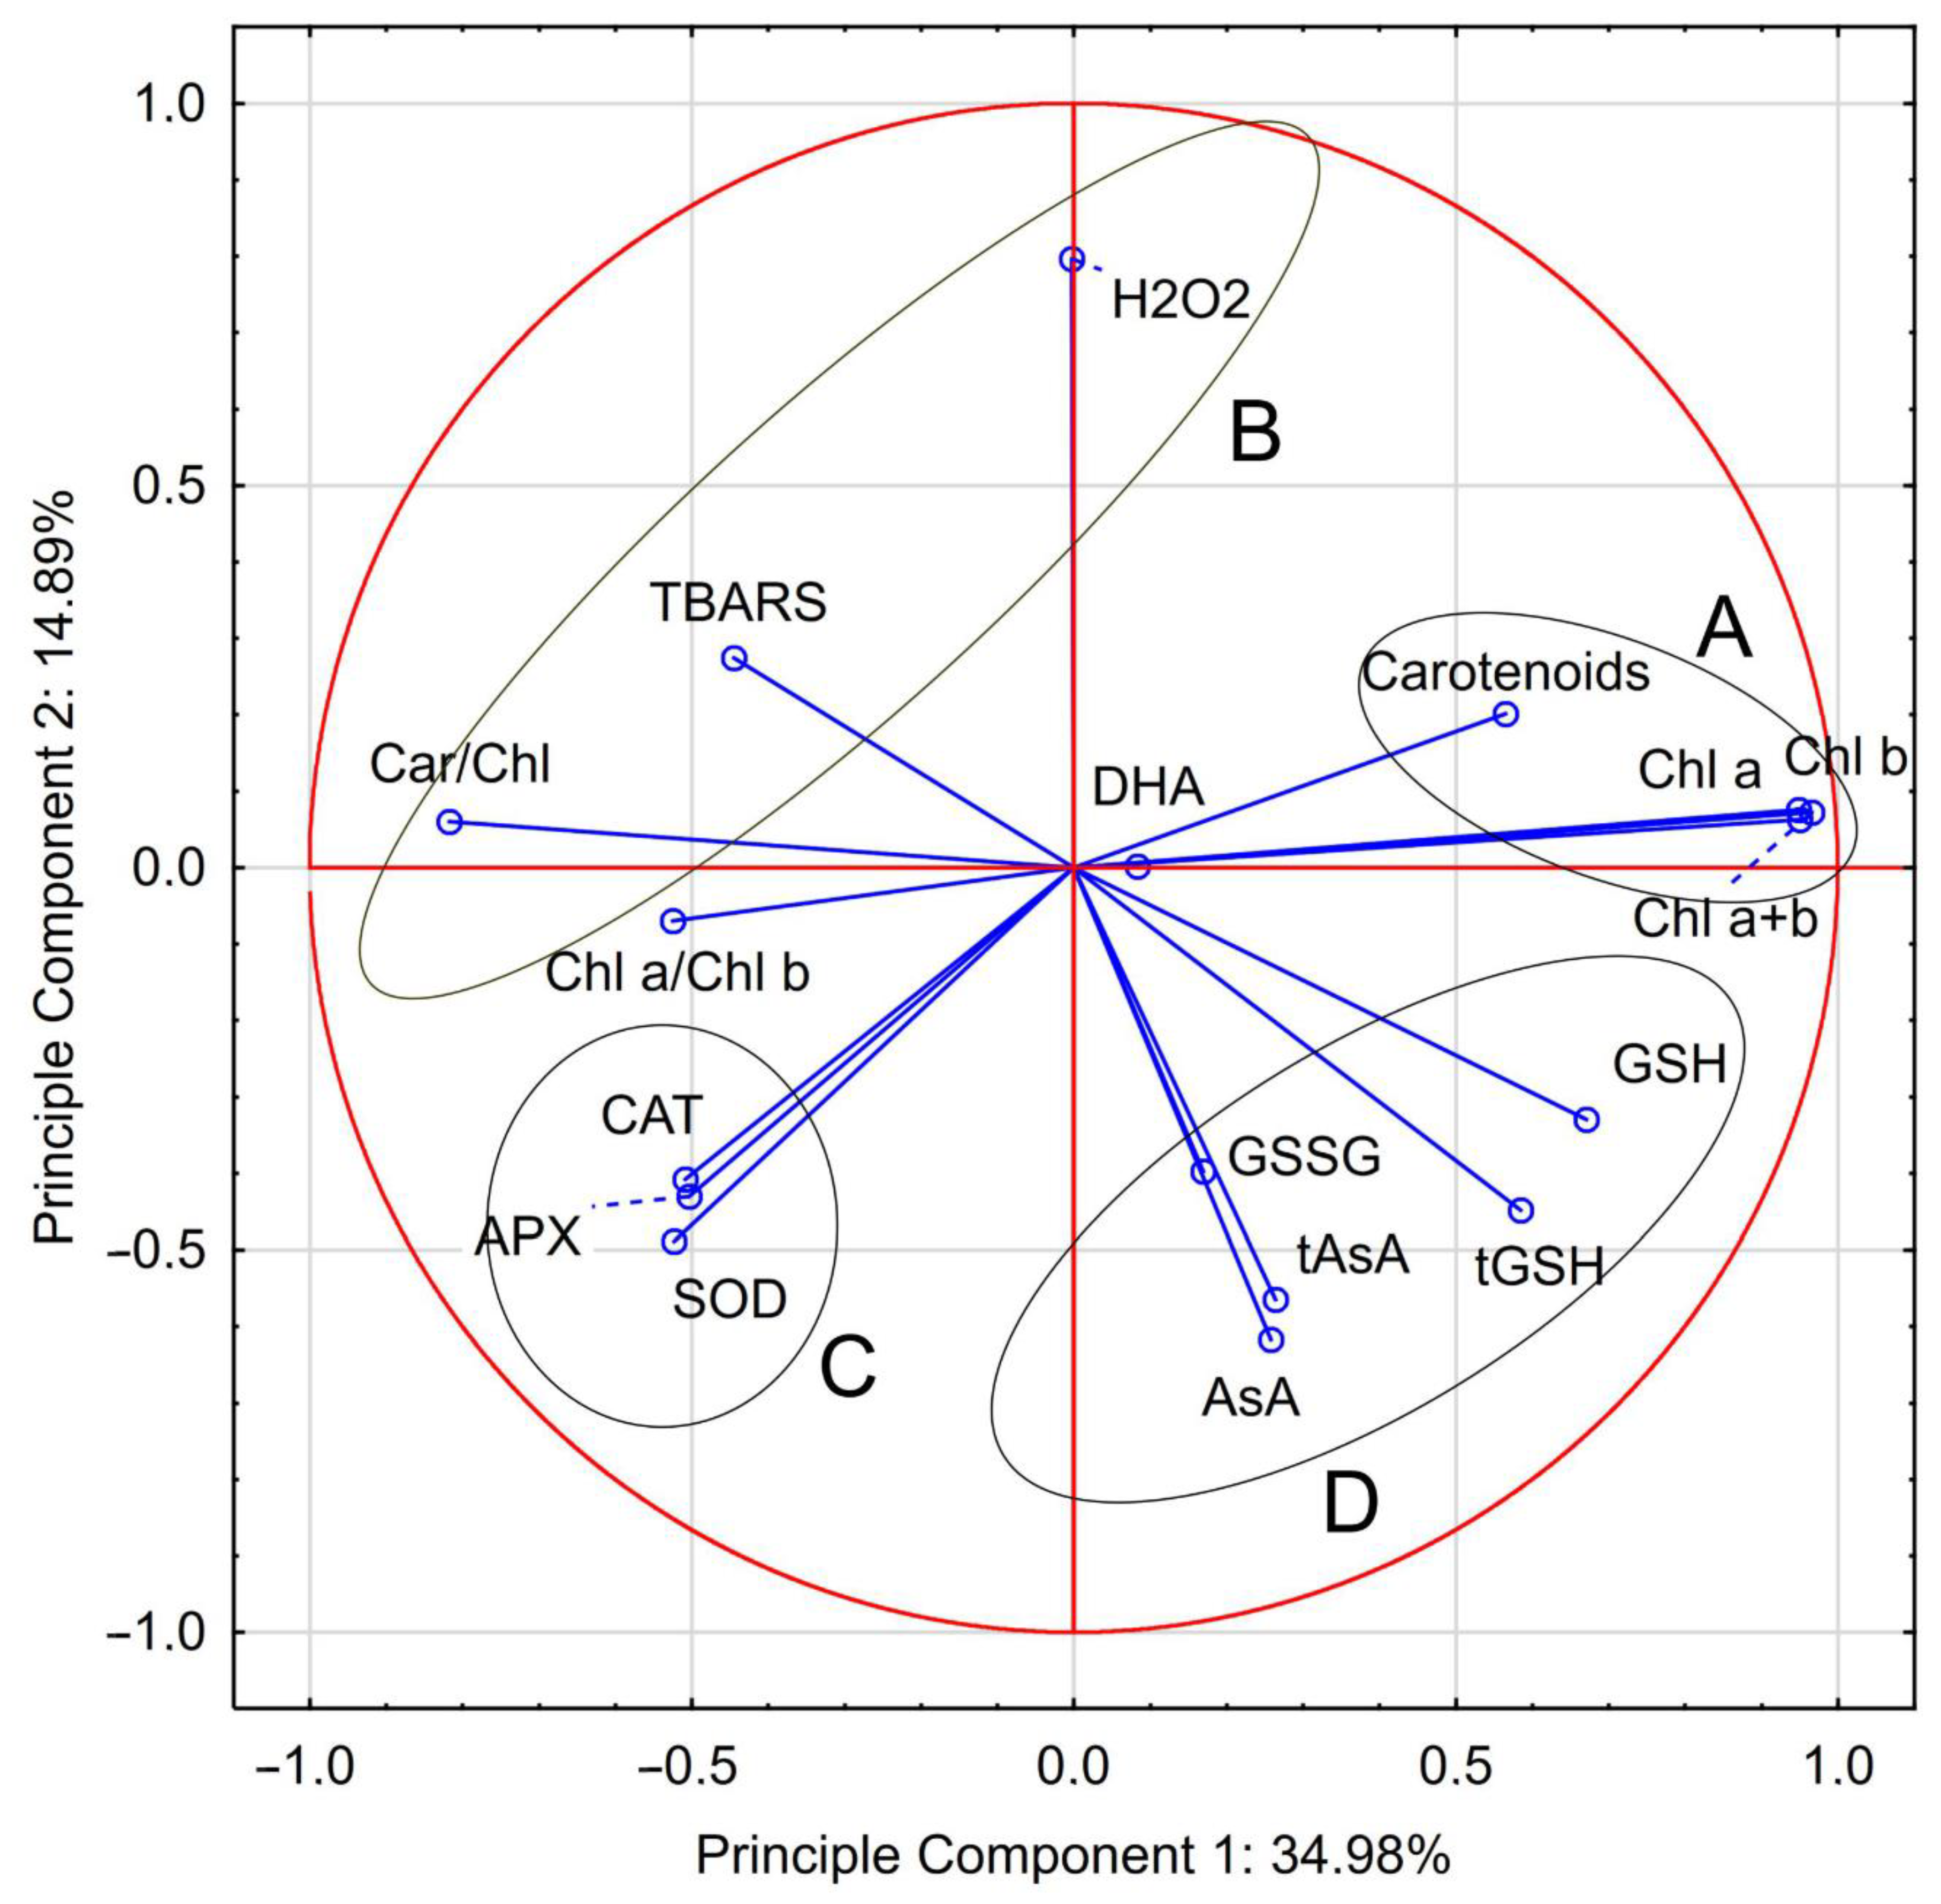
3.3.5. Correlation and Multivariate Analysis

According to the findings of the correlation analysis, the progress of leaf development, and especially leaf senescence, resulted in a simultaneous increase in the intensity of oxidative stress, the activity of biochemical defense mechanisms controlling H2O2 accumulation, and the intensity of lipid peroxidation of cell membranes (Table 3). Significant differences in Pearson’s correlation coefficients and slopes of the curves of the relationship between chlorophyll content and oxidative stress markers (H2O2, TBARS, carotenoid/chlorophyll ratio) between sun and shade leaves were observed in Table 3 (A). Significant differences were also observed in the relationship of the above-mentioned stress markers with the parameters determining the intensity of the activity of the antioxidant system (the content of small-molecule antioxidants and activity of antioxidant enzymes) between sun and shade leaves, shown in Table 3 (B–D). Correlation analysis revealed that chlorophyll degradation was associated with the accumulation of H2O2 and lipid peroxidation products, which was higher in shade leaves. A faster increase in the total AsA and DHA contents was observed in sun leaves, due to which their H2O2 levels were lower than in shade leaves in response to H2O2 accumulation, as seen in Table 3 (B). An increase in the H2O2 content also resulted in a further increase in CAT and SOD activities in the sun leaves compared with shade leaves, which can be observed in Table 3 (D). At the same time, H2O2 accumulation was found to be responsible for the faster decrease of APX activity in sun leaves. Similar relationships were found for the contents of the reduced and oxidized forms of AsA and the activities of antioxidant enzymes with the carotenoid/chlorophyll ratio, which was used to assess the intensity of oxidative stress, seen in Table 3 (B,D). The content of TBARS, which are one of the three markers of oxidative stress, showed a significant correlation with AsA forms and antioxidant enzyme activities in shade leaves. Pearson’s correlation coefficients and regression coefficients showed that an increase in the TBARS content was significantly associated with a decrease in the content of the reduced form of AsA, an increase in its oxidized form, and a decrease in the activities of all antioxidant enzymes in shade leaves. Correlation between oxidative stress markers, and total, reduced, and oxidized glutathione contents indicated a significantly lower rate of decline in these compounds in the shade leaves compared with sun leaves and thus a higher contribution of glutathione in shaping the resistance of these leaves to oxidative stress, see Table 3 (C).
PCA of leaf morphological traits revealed two factors meeting the Kaiser criterion, characterized by eigenvalues higher than one and explaining 76.26% of the variation [29] (Figure 8). The value of the KMO coefficient was 0.656. In addition, Bartlett’s test revealed that the sample adequacy criteria of PCA were met (chi-square test value 12,883.81, p < 0.001). The first component of PCA explained 60.55% of the variability, while the second explained 15.71%. The former was primarily influenced by leaf width, length, area, and perimeter, and—to a lesser extent—by leaf thickness and petiole length, whereas the latter depended mainly on leaf shape (leaf index).
Based on the PCA of leaf biochemical parameters, five factors met the Kaiser criterion and explained 49.87% of the variation (Figure 9). The value of the KMO coefficient was 0.532, with small-molecule antioxidants showing the lowest KMO values (mean 0.522) and assimilatory pigments and antioxidant enzymes showing the highest (mean 0.719). The criterion derived from Bartlett’s test was also met (chi-square test value 9774.04, p < 0.001). The first component explained 34.98% of the variability, whereas the second explained 14.89%. Biochemical parameters were categorized into four groups: A, B, C, and D (Figure 9). Strong relationships were found between chlorophylls and carotenoids (markers of leaf senescence) (group A). The decomposition of leaf pigments initiated ROS formation, lipid peroxidation, and an increase in the carotenoid/chlorophyll ratio (oxidative stress markers), which constituted a separate group of biochemical parameters (group B). Oxidative stress was found to be responsible for an increase in the activity of the antioxidant system composed of small-molecule antioxidants and antioxidant enzymes, which constituted groups C and D of biochemical parameters (Figure 9).

4. Discussion

This study analyzed the morphological, physiological, and biochemical characteristics of sun and shade beech leaves acclimatized to varying levels of light intensities. Differences in the morphological characteristics and in the timing and intensity of physiological processes, especially in the induction and course of autumn leaf senescence, were observed depending on the light conditions. Due to the uniform light conditions of the study plot and the absence of cover by other trees, leaves of all individual trees collected from the upper part of the crown were characterized by 100% insolation, whereas those collected from the lower part of the crown showed up to 60% insolation. Thus, the leaf response of trees reflected the actual effect of light intensity on the physiological and biochemical characteristics of sun and shade leaves.
Tree species are classified into two categories based on their growth type: indeterminate and determinate [30]. Indeterminate growth species form shoots and leaves throughout the growing season, while determinate growth species form leaf primordia in the first year, which then develop simultaneously at the beginning of the next growing season [31]. As a consequence, in indeterminate growth species, successively emerging leaves show a higher level of tolerance and adaptation of morphological and anatomical characteristics to changes in light intensity [32]. Determinate growth species follow a different bud development strategy. Since the anatomical characteristics of leaves are determined by light conditions in the year of their bud formation, the leaves of determinate growth species show the limited ability of morphological and anatomical acclimatization to light conditions. Common beech is a determinate growth species; therefore, it forms buds and their constituent leaf primordia under light conditions characteristic of the previous year of vegetation and the position of buds in the crown. The leaf anatomical and morphological structure of this species is determined by the light conditions prevailing during the period of bud setting [12,33,34]. The present study showed that sun leaves had a better advantage over shade leaves with respect to leaf area, leaf perimeter, and leaf thickness (morphological traits), whereas a slightly lesser advantage was observed regarding leaf blade length and width and petiole length. Similar observations on morphological traits differentiating the leaves of provenience and phenological forms of beech and on the effect of climatic conditions on these traits were reported by Dolnicki and Kraj [35], Hatziskakis [19], Stojnić [36], and Kempf [37]. Modifications in anatomical and morphological features of leaves due to varying light intensities are of particular importance in tree species characterized by a high gradient of light intensity along the crown, including beech [34,38]. One of the most important differences between the analyzed leaf types was that sun leaves appeared thicker compared with shade leaves, which can be attributed to the formation of longer palisade mesophyll cells as well as a large number of layers of this tissue [39,40]. In the sun leaves of F. sylvatica, the number of layers of palisade mesophyll does not change even when light intensity changes in the year following the bud setting, indicating that the assimilate mesophyll cells have lost their ability to divide before bud breaking [33,34]. The higher thickness of sun leaves provides space for chloroplasts and is one of their adaptation mechanisms to ensure high CO2 assimilation. In addition to changes in light intensity, day length and temperature also determine beech leaf characteristics as they influence leaf life processes such as bud flushing [41,42,43] and leaf senescence [10,18,44], which determine their lifespan. The response of trees to light intensity, day length, and temperature shapes the control and optimization of leaf life processes, the timing and duration of their phenological phases, and consequently, the lifespan of leaves and their ability to carry out photosynthesis and the accumulation of carbon and nitrogen compounds, followed by their remobilization during autumn senescence [10,35,44,45,46].
Shade leaves of beech showed a higher total chlorophyll content, a higher proportion of chlorophyll b, and a higher carotenoid content compared with sun leaves. Thus, shade leaves minimized the effects of light deficiency by increasing their light-capturing capacity and decreasing their carboxylation capacity per unit leaf area [40]. From the point of view of silviculture, an important phenomenon is the shaping of the light intensity that reaches the leaves, not only within and through the outer parts of the crown of an individual tree but also through the surrounding trees. The intensity of light within a tree’s crown depends on the vertical structure of the crown, the degree of leaf clustering, and the angle of the leaf surface. The influence of the phenological characteristics of surrounding trees on the intensity and spectral composition of the light reaching the studied individual is important. Due to the influence of light on the analyzed biochemical processes, the interrelationship of the timing of phenological events between analyzed and surrounding individuals is also important. The lower chlorophyll a/chlorophyll b ratio in shade leaves, which is due to the higher chlorophyll b content and the higher investment in light-harvesting complexes, resulted in higher efficiency in utilizing the limited light available as to both the higher range of light wavelengths absorbed and their limited intensity [40,47]. Changes in the chlorophyll content were significantly affected by the thermal and precipitation conditions under which beech trees had grown. The higher average temperature and the extremely low precipitation in June 2019 during intensive leaf growth resulted in a significantly lower leaf pigment content throughout the growing season in both leaf types and the earlier attainment of their maximum pigment content, as well as the onset of degradation. Despite the increase in precipitation in the subsequent months, the predominance of the chlorophyll content in the year with higher precipitation persisted until the end of the growing season. Although beech is a shade-tolerant species, it exhibits little tolerance to drought, which can directly affect leaf senescence regardless of light intensity, thus causing stress responses and increased ROS formation [18,48].
Light allows plants to perform photosynthesis and accumulate assimilates. In all but most shade plant parts, photosynthesis, respiration, and photorespiration generate free radicals and ROS as by-products [49,50]. Depending on the intensity of ROS accumulation, these molecules play a signaling role when present at low concentrations and regulate many cellular processes. However, excessive production of ROS has a toxic effect and causes damage to macromolecules and cellular structures of plants [51,52]. In this view, ROS are unavoidable toxic products of O2 metabolism. Consistent with other plants, the vigorous increase in the ROS content in beech leaves disrupts the redox state of cells and oxidative stress, which manifests itself in lipid peroxidation, increased permeability, dysfunction of cell membranes, and degradation of photosynthetic pigments, among others [10,17]. The cellular antioxidant system counterbalances the adverse effects of ROS particles formed in the early stages of leaf development as by-products of photosynthesis and respiration. When the activity of the antioxidant system decreases, the effects of ROS particles formed during pre-senescence and senescence are not neutralized. According to the free radical theory of leaf senescence, induction and further progress of beech leaf senescence are associated with the increased formation of ROS resulting from the light-intensity-dependent continuous photosynthesis process on the one hand and from the induction of senescence-induced chlorophyll degradation, the release of free pigment molecules from protein–pigment complexes, and the decreasing antioxidant capacity of senescing leaves on the other hand [53]. Under different light conditions affecting the growth and energy processes of sun and shade leaves, chlorophyll molecules released with varying intensities from chloroplast complexes are involved in the formation of chemically reactive singlet oxygen and superoxide anion molecules [4,54,55].
The present study demonstrated the influence of light conditions of beech leaf development within the tree canopy on the timing and course of leaf senescence. Oxidative stress is the major factor that induces leaf senescence. It increases the activity of enzymes involved in chlorophyll metabolism [20] and promotes photo-oxidative stress in cells [16,17]. This type of stress occurs when the absorption of light energy exceeds the ability of the leaves to use it in photosynthesis. The excess of absorbed light energy leads to nonphotochemical quenching and oxidative stress due to ROS accumulation and accelerated senescence. Thus, photo-oxidative stress plays a vital role in the light-intensity-specific response of leaves under different degrees of illumination. The higher light intensity with a concomitant change in the temperature trend and a 13-h photoperiod created stress conditions leading to an earlier induction of senescence in the sun leaves compared with shade leaves that were not subjected to such intense photo-oxidative conditions, which is consistent with the findings of previous studies [18,56,57]. The sink limitation hypothesis may also explain the delayed senescence of shade leaves under reduced light intensity conditions, where leaf senescence is tightly linked to photosynthate and nutrient supply [48]. These phenomena lead to an earlier and more intense degradation of photosynthetic complexes, earlier release, and degradation of chlorophyll molecules, quicker decline in the capacity to dissipate excess excitation energy in chloroplasts, and, in turn, the higher accumulation of ROS in the sun leaves. The ability of beech trees to counteract these phenomena, in particular the activity of the antioxidant system, depends on the climatic conditions of the population origin [10] and the phenological characteristics of the individuals [16,17,18]. The present study showed that the position of leaves in the crown and the leaf type (sun or shade) also played a role in counteracting the above-mentioned phenomena. Previous studies have demonstrated that the mechanism of senescence induction in beech leaves is best explained by the free radical theory, assuming that this process is controlled by the changing balance between ROS and their scavenging by the cellular antioxidant system inducing cellular redox disorders and oxidative stress and altering the expression of specific groups of genes [10,16,17]. Thus, the resistance of leaves to the accumulation of ROS generated by stress factors during the autumn temperature drop and adequate photoperiod is critical for the timing of induction and subsequent senescence of beech leaves [16,17,48].
Degradation of chlorophyll–protein complexes, which varied in timing and intensity and was associated with leaf senescence, resulted in the release of highly photoactive free chlorophyll particles in beech leaves at a rate dependent on climatic conditions in a given year and light availability. Light absorption by free chlorophyll molecules resulted in the formation of ROS (including superoxide ions and singlet oxygen) and changes in the redox state of cells [4,17,54]. These processes led to an increase in the content of H2O2-a product of dismutation of superoxide ions- and TBARS-products of peroxidation of cell membrane lipids. Both types of leaves showed slower decomposition of carotenoids in comparison with chlorophyll, which resulted in an increase in the carotenoid/chlorophyll ratio. Carotenoids play an important role in protecting the photosynthetic chloroplast system against photo-oxidative damage. These pigments are components of PSII, and they can act as accessory light-harvesting pigments, quench the chlorophyll triplet state, and scavenge singlet oxygen and other highly reactive species such as ROS. Slower and later carotenoid degradation during the senescence of shade leaves improved the protection of the PSII system against photo-oxidation, thus slowing down chlorophyll degradation and ROS formation and delaying senescence [55,58]. Carotenoid/chlorophyll ratio and TBARS content increased at a faster rate in sun leaves compared with shade leaves, indicating higher oxidative stress in the former. The degradation of chlorophyll–protein complexes which varies depending on the light intensity, the release of free chlorophyll molecules, the production of free radicals and ROS, and the activity of the harmful particle trapping system are the factors relating to the biochemical characteristics of leaves from different parts of the crown to the resistance of leaves to oxidative stress, induction and progression of senescence, and adaptation to life under specific light conditions. Due to higher light intensity, sun leaves showed earlier and faster decomposition of chlorophyll and thus the earlier release of free chlorophyll molecules, resulting in a more intense formation of superoxide ions. However, thanks to an increase in the SOD activity already in the pre-senescence period and a higher activity of the enzyme in sun leaves than in shade leaves, the superoxide ion was dismutated and transformed into less reactive and less dangerous H2O2. Even a small increase in the H2O2 content in sun leaves activates the entire mechanism of its decomposition. It includes the accumulation of small-molecule antioxidants (AsA and glutathione), the maintenance of an adequate proportion of their reduced form, an increase in the Foyer–Halliwell–Asada cycle and in consequence, higher involvement of APX and CAT in H2O2 degradation reactions, compared with shade leaves. This smaller increase in the H2O2 content in sun leaves was a consequence of a higher activity of the antioxidant system controlling its content despite potentially higher production of superoxide ions.
Changes in the redox state of cells associated with the chlorophyll degradation rate and ROS production were dependent on the light intensity, as well as the ability of leaves to remove superoxide ions and H2O2 and limit lipid peroxidation, which is characteristic of both sun and shade leaves. The relationship between these processes and the decisive effect of light intensity on them confirm their vital role in the adaptation of leaf types to optimal senescence. In addition to the decreasing temperature, which causes a decrease in the activity of the antioxidant system, light inducing ROS formation and increasing the susceptibility of leaves to oxidative stress affect the course of senescence and the lifespan of assimilatory organs [4,18,44,59]. Therefore, light differentiates the course of this process in different parts of beech tree crowns.
Since the senescence of beech leaves follows the free radical theory, differences in the intensity of ROS formation, the activity of the antioxidant system, and the changes in leaves located in parts of the crown with different light intensities are of fundamental importance for the induction and course of leaf senescence in the crown. The mechanism of defense followed by beech leaves against the increasing accumulation of superoxide ions and H2O2 is based mainly on the simultaneous increase in the intensity of AsA and glutathione formation-antioxidants participating in the Foyer–Halliwell–Asada cycle [17,60] and the increase in the efficiency of regeneration of reduced forms of these compounds. This ensures the sufficient activity of the cycle and guarantees protection to leaves against oxidative stress. Although the AsA content in the initial period of development was higher in shade leaves, the gradual decline in the antioxidant capacity, and especially senescence, induced a faster rate of decrease in the AsA content as compared to sun leaves. Similarly, sun leaves were characterized by a higher glutathione content than shade leaves. The different accumulation capacity of AsA was not the only characteristic feature associated with the acclimatization of beech leaves to specific light intensity, but the access to its reduced form also determines the activity of the Foyer–Halliwell–Asada cycle. The reduction of monodehydroascorbate radicals involving PSI and the reduced form of glutathione is the primary mechanism by which an adequate reduction of the AsA pool is maintained [16,17]. This links the photosynthesis process, the ability of leaves to form NADPH, and the chlorophyll degradation to the ability of leaves to maintain a high proportion of reduced form of AsA and glutathione. Sunflower leaves showed an increase in the total AsA content while maintaining a constant level or slight decrease in the reduced form of AsA. In sun leaves, the higher, as well as increasing content of glutathione (total and reduced form) resulted in an efficient regeneration of the reduced form of AsA. Thus, sun leaves exhibited an enhanced ability to control the increase in H2O2 levels resulting from the formation and dismutation of superoxide ions. On the other hand, shade leaves showed a decrease in total and reduced AsA contents already at the end of July, which—combined with a lower content of glutathione—resulted in a lower activity of the Foyer–Halliwell–Asada cycle enzymes indicated by the analyses. The lower activity of CAT in the shade leaves resulted in a significantly higher content of H2O2, especially in the senescence period, and weaker regulation of H2O2 formation in comparison with sun leaves.

5. Conclusions

This study demonstrated the importance of light conditions in determining the morphological traits and physiological processes of two types of leaves in beech trees—sun leaves and shade leaves. Sun leaves showed a significant advantage over shade leaves with respect to morphological traits and leaf thickness. Of particular importance were differences in leaf thickness between sun and shade leaves. These differences were attributable to the light intensity during bud formation, and the production of several cell layers in the palisade mesophyll, and these traits influenced the biochemical processes related to leaf senescence occurring in the cells. In this study, leaves collected from parts of the crowns differing in light intensity showed acclimation of biochemical processes associated with the degradation of leaf pigments, the formation of ROS, and the activity of the antioxidant system to light conditions determining the timing of induction and course of leaf senescence. Sun leaves showed a higher intensity of oxidative stress than shade leaves. However, because of the higher activity of the antioxidant system, they showed better control over the degree of ROS accumulation. This is demonstrated by increasing ascorbic acid content in response to oxidative stress, higher glutathione content, and increased antioxidant enzyme activity. Particularly noteworthy is the control mechanism of H2O2 level in sun leaves. It includes the pool of H2O2 formed in biochemical reactions and the result of the superoxide ion dismutation process. The ability of cells to maintain the equilibrium redox state was decisive for the acclimatization of leaves to light conditions and emerging differences between sun and shade leaves, control over chlorophyll degradation, accumulation of ROS, and induction of senescence. These results highlight the important role played by the leaf antioxidant system in controlling the date and the rate of leaf senescence along canopy gradient under varying light availability conditions in beech trees.

Author Contributions

Conceptualization, W.K.; methodology, W.K.; formal analysis, W.K. and A.Ś.; investigation, W.K. and A.Ś.; writing—original draft preparation, W.K. and A.Ś. All authors have read and agreed to the published version of the manuscript.

Funding

This work was supported by the Ministry of Science and Higher Education of the Republic of Poland, project number: SUB 040013-D019.

Institutional Review Board Statement

Not applicable.

Informed Consent Statement

Not applicable.

Data Availability Statement

Not applicable.

Conflicts of Interest

The authors declare no conflict of interest.

References

  1. Lambers, H.; Chapin, F.S.; Pons, T.L. (Eds.) Growth and allocation in plant physiological ecology. In Plant Physiological Ecology, 2nd ed.; Springer: New York, NY, USA, 2008; pp. 321–374. [Google Scholar]
  2. Pons, T.L. Regulation of leaf traits in canopy gradients. In Canopy Photosynthesis: From Basics to Applications; Hikosaka, K., Niinemets, Ü., Anten, N.P.R., Eds.; Springer: Dordrecht, The Netherlands, 2016; pp. 143–168. [Google Scholar]
  3. Foyer, C.H. Reactive oxygen species, oxidative signaling and the regulation of photosynthesis. Environ. Exp. Bot. 2018, 154, 134–142. [Google Scholar] [CrossRef] [PubMed]
  4. Zimmermann, P.; Zentgraf, U. The correlation between oxidative stress and leaf senescence during plant development. Cell. Mol. Biol. Lett. 2005, 10, 515–534. [Google Scholar] [PubMed]
  5. Curien, G.; Flori, S.; Villanova, V.; Magneschi, L.; Giustini, C.; Forti, G.; Matringe, M.; Petroutsos, D.; Kuntz, M.; Finazzi, G. The Water to Water Cycles in Microalgae. Plant Cell Physiol. 2016, 57, 1354–1363. [Google Scholar] [CrossRef] [PubMed] [Green Version]
  6. Polle, A. Mehler reaction: Friend or foe in photosynthesis? Bot. Acta 1996, 109, 84–89. [Google Scholar] [CrossRef]
  7. Koppenol, W.H. The Haber-Weiss cycle—70 years later. Redox Rep. 2001, 6, 229–234. [Google Scholar] [CrossRef]
  8. Terashima, I.; Miyazawa, S.I.; Hanba, Y.T. Why are sun leaves thicker than shade leaves? Consideration based on analyses of CO2 diffusion in the leaf. J. Plant Res. 2001, 114, 93–105. [Google Scholar] [CrossRef]
  9. Kraj, W.; Sztorc, A. Genetic structure and variability of phenological forms in the European beech (Fagus sylvatica L.). Ann. For. Sci. 2009, 66, 203. [Google Scholar] [CrossRef] [Green Version]
  10. Kraj, W.; Zarek, M. Biochemical basis of altitude adaptation and antioxidant system activity during autumn leaf senescence in beech populations. Forests 2021, 12, 529. [Google Scholar] [CrossRef]
  11. Kozlowski, T.T.; Kramer, P.J.; Pallardy, S.G. (Eds.) Physiological and environmental requirements for tree growth. In The Physiological Ecology of Woody Plants; Academic Press: San Diego, CA, USA, 1991; pp. 31–68. [Google Scholar]
  12. Desotgiu, R.; Cascio, C.; Pollastrini, M.; Gerosa, G.; Marzuoli, R.; Bussotti, F. Short and long term photosynthetic adjustments in sun and shade leaves of Fagus sylvatica L., investigated by fluorescence transient (FT) analysis. Plant Biosyst. 2012, 146, 206–216. [Google Scholar] [CrossRef]
  13. Lim, P.O.; Kim, H.J.; Gil Nam, H. Leaf Senescence. Annu. Rev. Plant Biol. 2007, 58, 115–136. [Google Scholar] [CrossRef] [Green Version]
  14. Buchanan-Wollaston, V.; Earl, S.; Harrison, E.; Mathas, E.; Navabpour, S.; Page, T.; Pink, D. The molecular analysis of leaf senescence—A genomics approach. Plant Biotechnol. J. 2003, 1, 3–22. [Google Scholar] [CrossRef] [PubMed]
  15. Fracheboud, Y.; Luquez, V.; Björkén, L.; Sjödin, A.; Tuominen, H.; Jansson, S. The control of autumn senescence in European aspen. Plant Physiol. 2009, 149, 1982–1991. [Google Scholar] [CrossRef] [PubMed] [Green Version]
  16. Kraj, W. Antioxidative enzyme activity as the factor causing differential autumn senescence in phenological forms of beech (Fagus sylvatica L.). Acta Physiol. Plant. 2017, 39, 16. [Google Scholar] [CrossRef]
  17. Kraj, W. Reactive oxygen species and antioxidant levels as the factors of autumn senescence in phenological forms of beech (Fagus sylvatica L.). Acta Physiol. Plant. 2016, 38, 32. [Google Scholar] [CrossRef]
  18. Kraj, W. Chlorophyll degradation and the activity of chlorophyllase and Mg-dechelatase during leaf senescence in Fagus sylvatica. Dendrobiology 2015, 74, 43–57. [Google Scholar] [CrossRef] [Green Version]
  19. Hatziskakis, S.; Tsiripidis, I.; Papageorgiou, A.C. Leaf morphological variation in beech (Fagus sylvatica L.) populations in Greece and its relation to their post-glacial origin. Bot. J. Linn. Soc. 2011, 165, 422–436. [Google Scholar] [CrossRef]
  20. Lichtenthaler, H.K.; Wellburn, A.R. Determinations of total carotenoids and chlorophylls a and b of leaf extracts in different solvents. Biochem. Soc. Trans. 1983, 11, 591–592. [Google Scholar] [CrossRef] [Green Version]
  21. Dhindsa, R.S.; Plumb-Dhindsa, P.; Thorpe, T.A. Leaf senescence: Correlated with increased levels of membrane permeability and lipid peroxidation, and decreased levels of superoxide dismutase and catalase. J. Exp. Bot. 1981, 32, 93–101. [Google Scholar] [CrossRef]
  22. Gillespie, K.M.; Ainsworth, E.A. Measurement of reduced, oxidized and total ascorbate content in plants. Nat. Protoc. 2007, 2, 871. [Google Scholar] [CrossRef]
  23. Rahman, I.; Kode, A.; Biswas, S.K. Assay for quantitative determination of glutathione and glutathione disulfide levels using enzymatic recycling method. Nat. Protoc. 2006, 1, 3159–3165. [Google Scholar] [CrossRef]
  24. Bradford, M.M. A rapid and sensitive method for the quantitation of microgram quantities of protein utilizing the principle of protein-dye binding. Anal. Biochem. 1976, 72, 248–254. [Google Scholar] [CrossRef]
  25. Aebi, H. Isolation, purification, characterization, and assay of antioxygenic enzymes: Catalase in vitro. Methods Enzymol. 1984, 105, 121–126. [Google Scholar] [CrossRef] [PubMed]
  26. Murshed, R.; Lopez-Lauri, F.; Sallanon, H. Microplate quantification of enzymes of the plant ascorbate–Glutathione cycle. Anal. Biochem. 2008, 383, 320–322. [Google Scholar] [CrossRef] [PubMed]
  27. Peskin, A.V.; Winterbourn, C.C. A microtiter plate assay for superoxide dismutase using a water-soluble tetrazolium salt (WST-1). Clin. Chim. Acta 2000, 293, 157–166. [Google Scholar] [CrossRef]
  28. Sokal, R.R.; Rohlf, F.J. Biometry: The Principles and Practice of Statistics in Biological Research; A Series of books in biology; W. H. Freeman and Company: New York, NY, USA, 1995; p. 887. [Google Scholar]
  29. Kaiser, H.F. The application of electronic computers to factor analysis. Educ. Psychol. Meas. 1960, 20, 141–151. [Google Scholar] [CrossRef]
  30. Pallardy, S.G. (Ed.) Vegetative Growth. In Physiology of Woody Plants, 3rd ed.; Academic Press: San Diego, CA, USA, 2008; pp. 39–86. [Google Scholar]
  31. Coble, A.P.; Fogel, M.L.; Parker, G.G. Canopy gradients in leaf functional traits for species that differ in growth strategies and shade tolerance. Tree Physiol. 2017, 37, 1415–1425. [Google Scholar] [CrossRef]
  32. Naidu, S.L.; DeLucia, E.H. Physiological and morphological acclimation of shade-grown tree seedlings to late-season canopy gap formation. Plant Ecol. 1998, 138, 27–40. [Google Scholar] [CrossRef]
  33. Eschrich, W.; Burchardt, R.; Essiamah, S. The induction of sun and shade leaves of the European beech (Fagus sylvatica L.): Anatomical studies. Trees 1989, 3, 1–10. [Google Scholar] [CrossRef]
  34. Uemura, A.; Ishida, A.; Nakano, T.; Terashima, I.; Tanabe, H.; Matsumoto, Y. Acclimation of leaf characteristics of Fagus species to previous-year and current-year solar irradiances. Tree Physiol. 2000, 20, 945–951. [Google Scholar] [CrossRef] [Green Version]
  35. Dolnicki, A.; Kraj, W. Leaf morphology and the dynamics of frost-hardiness of shoots in two phenological forms of European beech (Fagus sylvatica L.) from Southern Poland. EJPAU 2001, 4. Available online: http://www.ejpau.media.pl/volume4/issue2/forestry/art-01.html (accessed on 16 July 2022).
  36. Stojnić, S.; Orlović, S.; Miljković, D.; Von Wuehlisch, G. Intra- and interprovenance variations in leaf morphometric traits in European beech (Fagus sylvatica L.). Arch. Biol. Sci. 2016, 68, 781–788. [Google Scholar] [CrossRef]
  37. Kempf, M.; Banach, J.; Skrzyszewska, K. Morphological variability of beech leaves from early and late flushing provenances. Balt. For. 2018, 24, 210–217. [Google Scholar]
  38. Ishida, A.; Toma, T. Marjenah Limitation of leaf carbon gain by stomatal and photochemical processes in the top canopy of Macaranga conifera, a tropical pioneer tree. Tree Physiol. 1999, 19, 467–473. [Google Scholar] [CrossRef] [PubMed]
  39. Oguchi, R.; Hikosaka, K.; Hirose, T. Leaf anatomy as a constraint for photosynthetic acclimation: Differential responses in leaf anatomy to increasing growth irradiance among three deciduous trees. Plant Cell Environ. 2005, 28, 916–927. [Google Scholar] [CrossRef]
  40. Lambers, H.; Chapin, F.S.; Pons, T.L. (Eds.) Photosynthesis, Respiration and Long-Distance Transport. In Plant Physiological Ecology; Springer: New York, NY, USA, 2008; pp. 11–99. [Google Scholar]
  41. Petkova, K.; Molle, E.; Huber, G.; Konnert, M.; Gaviria, J. Spring and autumn phenology of Bulgarian and German provenances of Common beech (Fagus sylvatica L.) under similar climatic conditions. Silvae Genet. 2017, 66, 24–32. [Google Scholar] [CrossRef] [Green Version]
  42. Chmura, D.J.; Rożkowski, R. Variability of beech provenances in spring and autumn phenology. Silvae Genet. 2002, 51, 123–127. [Google Scholar]
  43. Schueler, S.; Liesebach, M. Latitudinal population transfer reduces temperature sum requirements for bud burst of European beech. Plant Ecol. 2014, 216, 111–122. [Google Scholar] [CrossRef]
  44. Kraj, W. Proteolytic activity and nitrogen remobilisation in senescing leaves of phenological forms of Fagus sylvatica. Dendrobiology 2014, 72, 163–176. [Google Scholar] [CrossRef] [Green Version]
  45. Denk, T. The taxonomy of Fagus in western Eurasia. 2: Fagus sylvatica subsp. sylvatica. Feddes Repert. 1999, 110, 381–412. [Google Scholar] [CrossRef]
  46. Hollinger, D.Y. Optimality and nitrogen allocation in a tree canopy. Tree Physiol. 1996, 16, 627–634. [Google Scholar] [CrossRef] [Green Version]
  47. Lichtenthaler, H.K.; Babani, F. Light adaptation and senescence of the photosynthetic apparatus. Changes in pigment composition, chlorophyll fluorescence parameters and photosynthetic activity. In Chlorophyll a Fluorescence: A Signature of Photosynthesis; Papageorgiou, G.C., Govindjee, G., Eds.; Springer: Dordrecht, The Netherlands, 2004; pp. 713–736. [Google Scholar]
  48. Vitasse, Y.; Baumgarten, F.; Zohner, C.M.; Kaewthongrach, R.; Fu, Y.H.; Walde, M.G.; Moser, B. Impact of microclimatic conditions and resource availability on spring and autumn phenology of temperate tree seedlings. New Phytol. 2021, 232, 537–550. [Google Scholar] [CrossRef] [PubMed]
  49. Logan, B.A. Reactive Oxygen Species and Photosynthesis. In Antioxidants and Reactive Oxygen Species in Plants; Smirnoff, N., Ed.; Oxford Blackwell Publishing: Oxford, UK, 2005; pp. 250–267. [Google Scholar]
  50. Racchi, M.L. Antioxidant defenses in plants with attention to Prunus and Citrus spp. Antioxidants 2013, 2, 340–369. [Google Scholar] [CrossRef] [PubMed]
  51. Tukaj, Z.; Pokora, W. Individual and combined effect of anthracene, cadmium, and chloridazone on growth and activity of SOD izoformes in three Scenedesmus species. Ecotox. Environ. Safe. 2006, 65, 323–331. [Google Scholar] [CrossRef]
  52. Mach, J.M.; Greenberg, J.T. Free Radicals and Oxidative Stress. In Plant Cell Death Processes; Noodén, L.D., Ed.; Academic Press: San Diego, CA, USA, 2004; pp. 203–214. [Google Scholar]
  53. Wingler, A.; Marès, M.; Pourtau, N. Spatial patterns and metabolic regulation of photosynthetic parameters during leaf senescence. New Phytol. 2004, 161, 781–789. [Google Scholar] [CrossRef]
  54. Hörtensteiner, S.; Kräutler, B. Chlorophyll breakdown in higher plants. BBA-Bioenerg. 2011, 1807, 977–988. [Google Scholar] [CrossRef] [Green Version]
  55. Kraj, W. Stem girdling affects the carbon/nitrogen imbalance and oxidative stress, and induces leaf senescence in phenological forms of beech (Fagus sylvatica). Acta Biol. Cracov. Bot. 2017, 59, 67–79. [Google Scholar] [CrossRef]
  56. Delpierre, N.; Dufrêne, E.; Soudani, K.; Ulrich, E.; Cecchini, S.; Boé, J.; François, C. Modelling interannual and spatial variability of leaf senescence for three deciduous tree species in France. Agric. For. Meteorol. 2009, 149, 938–948. [Google Scholar] [CrossRef]
  57. Liu, Q.; Piao, S.; Campioli, M.; Gao, M.; Fu, Y.H.; Wang, K.; He, Y.; Li, X.; Janssens, I.A. Modeling leaf senescence of deciduous tree species in Europe. Glob. Chang. Biol. 2020, 26, 4104–4118. [Google Scholar] [CrossRef]
  58. Young, A.J. The photoprotective role of carotenoids in higher plants. Physiol. Plant. 1991, 83, 702–708. [Google Scholar] [CrossRef]
  59. Munné-Bosch, S.; Jubany-Marí, T.; Alegre, L. Drought-induced senescence is characterized by a loss of antioxidant defences in chloroplasts. Plant Cell Environ. 2001, 24, 1319–1327. [Google Scholar] [CrossRef]
  60. García-Plazaola, J.I.; Becerril, J.M. Seasonal changes in photosynthetic pigments and antioxidants in beech (Fagus sylvatica) in a Mediterranean climate: Implications for tree decline diagnosis. Aust. J. Plant Physiol. 2001, 28, 225–232. [Google Scholar] [CrossRef]
Figure 1. Weather conditions during the 2019 (A) and 2020 (B) sampling periods. The gray bars represent the daily precipitation in millimeters. The lines correspond to the maximum, minimum, and average temperatures (°C). The arrows indicate the sampling dates.
Forests 13 01333 g001
Figure 2. Changes in chlorophyll a (A), chlorophyll b (B), and total chlorophyll (C) contents and chlorophyll a/b ratio (D) in sun and shade senescing beech (Fagus sylvatica L.) leaves. Analyses were performed for sun (black line) and shade (red line) leaves in 2019 and 2020. Each point is the mean of 60 measurements (±standard error). For each type of leaves, means with different uppercase letters differ significantly at p < 0.05. For each date, means with asterisks differ significantly at **—p < 0.01 and ***—p < 0.001.
Forests 13 01333 g002
Figure 3. Changes in the carotenoid content (A) and carotenoid/chlorophyll ratio (B) in the sun and shade senescing beech (Fagus sylvatica L.) leaves. Analyses were performed for sun (black line) and shade (red line) leaves in 2019 and 2020. Each point is the mean of 60 measurements (±standard error). For each type of leaves, means with different uppercase letters differ significantly at p < 0.05. For each date, means with asterisks differ significantly at **—p < 0.01 and ***—p < 0.001.
Forests 13 01333 g003
Figure 4. Changes in hydrogen peroxide (A) and thiobarbituric acid-reactive substances (B) contents in the sun and shade senescing beech (Fagus sylvatica L.) leaves. Analyses were performed for sun (black line) and shade (red line) leaves in 2019 and 2020. Each point is the mean of 60 measurements (±standard error). For each type of leaves, means with different uppercase letters differ significantly at p < 0.05. For each date, means with asterisks differ significantly at ***—p < 0.001.
Forests 13 01333 g004
Figure 5. Changes in total ascorbate (A), ascorbate (B), and dehydroascorbate (C) contents in the sun and shade senescing beech (Fagus sylvatica L.) leaves. Analyses were performed for sun (black line) and shade (red line) leaves in 2019 and 2020. Each point is the mean of 60 measurements (±standard error). For each type of leaves, means with different uppercase letters differ significantly at p < 0.05. For each date, means with asterisks differ significantly at *—p < 0.05, and ***—p < 0.001.
Forests 13 01333 g005
Figure 6. Changes in total glutathione (A), reduced glutathione (B), and oxidized glutathione (C) contents in the sun and shade senescing beech (Fagus sylvatica L.) leaves. Analyses were performed for sun (black line) and shade (red line) leaves in 2019 and 2020. Each point is the mean of 60 measurements (±standard error). For each type of leaves, means with different uppercase letters differ significantly at p < 0.05. For each date, means with asterisks differ significantly at *—p < 0.05 and ***—p < 0.001.
Forests 13 01333 g006
Figure 7. Changes in catalase (A), ascorbate peroxidase (B), and superoxide dismutase (C) activities in the sun and shade senescing beech (Fagus sylvatica L.) leaves. Analyses were performed for sun (black line) and shade (red line) leaves in 2019 and 2020. Each point is the mean of 60 measurements (±standard error). For each type of leaves, means with different uppercase letters differ significantly at p < 0.05. For each date, means with asterisks differ significantly at **—p < 0.01 and ***—p < 0.001.
Forests 13 01333 g007
Figure 8. Principal component analysis of the morphological parameters of the sun and shade beech leaves. The first two principal components are plotted. LA—leaf area, LT—leaf thickness, LP—leaf perimeter, PL—petiole length, LW—leaf width, LL—leaf length, LI—leaf index.
Forests 13 01333 g008
Figure 9. Principal component analysis of senescence markers, oxidative stress markers, and antioxidative system activity markers of the sun and shade beech leaves. The first two principal components are plotted. The components allowed the distinction between three groups of metabolites: group A consisted of leaf pigments (Chl a—chlorophyll a, Chl b—chlorophyll b, and carotenoids), group B consisted of oxidative stress markers (H2O2—hydrogen peroxide, TBARS—thiobarbituric acid-reactive substances, and Car/Chl—carotenoid/chlorophyll ratio), group C consisted of small-molecule antioxidative compounds (tAsA—total ascorbate, AsA—reduced ascorbate, tGSH—total glutathione, GSH—reduced glutathione, and GSSG—oxidized glutathione), and group D consisted of antioxidative enzymes (ascorbate peroxidase—APX, catalase—CAT, and superoxide dismutase—SOD).
Forests 13 01333 g009
Table 1. Temperature and precipitation profile during the 2019 and 2020 sampling periods.
MonthYear of Leaf Collection
20192020
Temperature [°C]Total Prec.Temperature [°C]Total Prec.
Min.Ave.MaxAmp.[mm]Min.Ave.MaxAmp.[mm]
June (last 2 weeks)16.622.228.0611.494.015.719.223.88.1552.1
July13.519.225.411.8774.713.119.025.312.1965.5
August15.020.326.711.6479.314.720.326.711.98108.6
September9.914.520.210.2778.39.715.121.211.4779.2
Whole sampling period
Average13.318.624.611.37236.313.018.324.411.41305.4
SD3.83.94.7 3.453.234.16
V%28.320.718.9 26.6117.6217.05
Min.—minimum temperature, Ave.—average temperature, Max.—maximum temperature, Amp.—temperature amplitude, total prec.—total precipitation, SD—standard deviation, V%—coefficient of variation.
Table 2. Effect of leaf type (sun or shade leaves) on their morphological characteristics (mean ± standard error) (Mann–Whitney U test).
Leaf FeatureLeaf TypeMann–Whitney U Test Z Valuep
LightShade
Ave.SEV%Ave.SEV%
Leaf length [cm]5.740.1317.614.700.116.375.708<0.001
Leaf width [cm]3.210.0820.282.540.0515.296.186<0.001
Leaf area [cm2]12.10.5535.637.940.3130.355.934<0.001
Leaf thickness [μm]110.832.0714.4482.31.3612.808.212<0.001
Leaf perimeter [cm]16.170.3619.7011.910.4026.074.876<0.001
Petiole length [cm]0.690.0328.070.550.0226.184.905<0.001
Leaf index180.42.078.88185.81.948.07−1.9180.055
Petiole index12.160.3421.5816.680.7549.27−3.825<0.001
Ave—average, SE—standard error, V%—coefficient of variation.
Table 3. Pearson’s correlation coefficients (r) and corresponding curve slope coefficients between chlorophylls (Chl a, Chl b, and Chl a + b) and oxidative stress markers (H2O2 content, TBARS content, and car/chl) (A) and between oxidative stress markers and antioxidative parameters (tAsA, AsA, DHA, tGSH, GSH, and GSSG contents, and CAT, APX, and SOD activity) (B–D) of the sun and shade beech leaves.
A
FactorH2O2TBARSCar/chl
LightShadeLightShadeLightShade
rSloperSloperSloperSloperSloperSlope
Chl a−0.694 ***−0.03−0.669 ***−0.17−0.340 ***−32.03−0.406 ***−80.31−0.887 ***−0.10−0.638 ***−0.04
Chl b−0.623 ***−0.04−0.532 ***−0.30−0.287 ***−49.98−0.328 ***−144.14−0.847 ***−0.18−0.649 ***−0.10
Chl a + b−0.671 ***−0.02−0.636 ***−0.11−0.322 ***−19.76−0.387 ***−53.58−0.875 ***−0.07−0.651 ***−0.03
B
FactortAsAAsADHA
LightShadeLightShadeLightShade
rSloperSloperSloperSloperSloperSlope
H2O20.220 ***50.73−0.372 ***−37.290.147 **20.60−0.626 ***63.990.189 **30.100.491 ***25.59
TBARS0.0640.010−0.150 ***−0.019−0.0110.000−0.376 ***−0.0490.1250.0100.442 ***0.029
Car/chl0.328 ***25.05−0.342 *−126.630.347 ***15.75−0.394 ***−148.810.168 **8.850.147 *28.21
C
FactortGSHGSHGSSG
LightShadeLightShadeLightShade
rSloperSloperSloperSloperSloperSlope
H2O2−0.526 ***−1818.44−0.587 ***−475.06−0.553 ***−880.31−0.252 ***−149.10−0.475 ***−940.19−0.801 ***−325.95
TBARS−0.443 ***−0.590−0.238 ***−0.245−0.452 ***−0.290−0.048−0.036−0.408 ***−0.330−0.404 ***−0.209
Car/chl−0.475 ***−543.15−0.049−149.17−0.530 ***−279.370.177 **386.12−0.410 ***−268.80−0.356 ***−535.29
D
FactorCATAPXSOD
LightShadeLightShadeLightShade
rSloperSloperSloperSloperSloperSlope
H2O20.165 **123.32−0.441 ***−255.40−0.508 ***−1.880−0.585 ***−1.1960.273 ***330.45−0.560 ***−214.94
TBARS0.0000.000−0.190**−0.140−0.237 ***0.000−0.501 ***−0.001−0.0960.050−0.426 ***−0.208
Car/chl0.319 ***78.84−0.317 ***−678.47−0.553 ***−0.680−0.223 ***−1.6890.278 ***111.44−0.171 **−242.109
H2O2—hydrogen peroxide, TBARS—thiobarbituric acid-reactive substances, car/chl—carotenoid/chlorophyll ratio, tAsA—total ascorbate, AsA—reduced ascorbate, DHA—dehydroascorbate, tGSH—total glutathione, GSH—reduced glutathione, GSSG—oxidized glutathione, CAT—catalase, APX—ascorbate peroxidase, SOD—superoxide dismutase. Pearson’s correlation coefficients (r) significance at: *—p < 0.05, **—p < 0.01, and ***—p < 0.001.
Publisher’s Note: MDPI stays neutral with regard to jurisdictional claims in published maps and institutional affiliations.

