Article

Effect of Impregnation with a Low-Concentration Furfuryl Alcohol Aqueous Solution on Hygroscopic Properties of Chinese Fir and Poplar Wood

College of Materials Science and Engineering, Southwest Forestry University, Kunming 650224, China
*
Author to whom correspondence should be addressed.
Forests 2022, 13(8), 1176; https://doi.org/10.3390/f13081176
Submission received: 25 June 2022 / Revised: 20 July 2022 / Accepted: 21 July 2022 / Published: 25 July 2022
(This article belongs to the Special Issue Advanced Technologies in Physical and Mechanical Wood Modification)

Abstract

:
Furfurylation with a low concentration of furfuryl alcohol (FA) promotes the improvement of the properties and the effectiveness of FA on cell–wall action without darkening the furfurylated wood to the point that it affects its applications. In this paper, the effects of furfurylation on the hygroscopicity and water uptake dimensional stability of poplar (Populus sp.) and Chinese fir (Cunninghamia lanceolata) were analyzed. Meanwhile, the distribution of FA resin, the relationship between wood and water, the change in pore size distribution, and the weight percentage gain and cell wall bulking coefficient of wood were also investigated. The results were as follows: (1) A low concentration of FA could better enter the cell walls of the Chinese fir than the poplar, as FA resin was almost cured in the secondary walls, cell corners, and compound middle lamellae when a 10% concentration of FA was applied to the Chinese fir and poplar. When the FA concentration was increased to 30%, there were no significant increases in the amount of FA entering the cell walls and the amounts of FA cured in the cell lumen of the poplar were greater than those of the Chinese fir. Meanwhile, the modification of cell walls was more suitable in poplar than in Chinese fir. (2) The pointed ends of the pit chambers and the pit apertures (800–1000 nm) in the poplar and the small pores of the pit membranes and the pit apertures (1–6 μm) in the Chinese fir were partially deposited by the FA resin, which formed new pores in the size ranges of 80–600 nm and 15–100 nm, respectively. The porosity of the poplar was greater than that of the Chinese fir, and the bulk density of the poplar was less than that of the Chinese fir before and after modification. (3) Furfurylation with a low concentration of FA was able to better reduce the equilibrium moisture content, improve the anti-swelling efficiency, and enhance the dimensional stability of the poplar wood compared to the Chinese fir. Furfurylation effectively reduced water uptake due to the hydrophobic property of the FA resin. The water uptake of the Chinese fir increased by 17%–19% in second cyclic water soaking when treated with FA with various concentrations, which indicated the loss and leaching of FA resin during the test. Low-field NMR was used to demonstrate that the furfurylation not only reduced the amount of water but also affected the combination state of bound and free water with wood. Thus, furfurylation at a low concentration is a feasible method by which to extend applications of furfurylated wood.

1. Introduction

Chinese fir (Cunninghamia lanceolata) and poplar (Populus sp.) are the main plantation-grown species with great importance in the timber supply system in China. However, both the Chinese fir and poplar have significant disadvantages in terms of their poor mechanical properties and dimensional instability, limiting their high-value utilization in the wood-processing industry. Numerous studies have been conducted to improve their fast-growing wood density and application performance by using various methods such as UF and PF resin impregnation modification [1,2]. Furfurylation is an impregnation modification method [3,4], and it consists of impregnation and curing processes. Furfuryl alcohol (FA) can be impregnated into wood and then cured into resin under the action of heat and a catalyst, which can effectively increase wood density, enhance the mechanical properties, and improve dimensional stability [5,6,7,8,9,10,11]. It is of utmost importance for FA to be derived from biomass materials such as corn cobs and non-fossil resources [12]. Therefore, furfurylation is considered to be an environmentally friendly modification method [13,14,15,16].
The development of furfurylated wood originated in North America during the 1950s from I.S. Goldstein [17], and the furfurylation method of commercial wood represented by Kebony® in Norway is widely used in outdoor places such as wooden buildings and trestles [18,19]. However, the treatment process has always employed high levels of weight percentage gain, and large amounts of FA tend to accumulate and deposit in the cell lumen. The effectiveness of FA-modified cell walls also diminishes with increasing concentrations of FA. Additionally, furfurylated wood of a high concentration darkens the color of modified wood and does not significantly improve dimensional stability compared to furfurylated wood of a low concentration [19,20]; neither of them are compatible with the interior furniture and wood product requirements for light colors and high dimensional stability [21]. There are also differences in the wood properties between Chinese domestic, fast-growing trees and European temperate species, and previous studies indicated that the concentration of FA-modified solutions determines the distribution area in wood; FA is mainly deposited in wood’s cell walls and is almost absent in the cell lumen when the concentration of FA is low [22]. Furthermore, compared to its greater improvement of the mechanical and hygroscopic properties of furfurylated wood with high concentrations of FA, the relationship between the modified wood with a low concentration of FA and hygroscopic properties for the main purpose of cell wall modification has yet to be scientifically evaluated.
This paper focused on the hygroscopicity and dimensional stability properties of furfurylated wood with a low FA concentration (below 30%) treatment. The effectiveness of the modification on the cell wall was analyzed by correlating the weight percentage gain and cell wall bulking coefficient. The changes in physical aspects such as the furfuryl alcohol resin distribution and pore size distribution were also analyzed. Finally, the effect of the modification treatment on the wood–water relationship of the Chinese fir and poplar was analyzed with low-field NMR.

2. Materials and Methods

2.1. Materials

Poplar and Chinese fir were harvested from Jiangsu Province and Zhejiang Province, China, respectively. The soil type of both the poplar and Chinese fir was clayey, the height of the poplar from sea level was 70 m, the height of the fir from sea level was 1500 m, and the diameters of the poplar and fir were 30 cm or more. The trees were over 25 years old. The air-dry density of the poplar was found to be about 480 kg/m3, and that of the Chinese fir was about 310 kg/m3. Specimens with straight grain and no visible defects were selected and processed into 20 × 20 × 20 mm (tangential × radical × longitudinal) when the moisture content was below 12%. Samples were selected from the sapwood of the Chinese fir and poplar. Furfuryl alcohol (FA), maleic anhydride, and borax were purchased from Tianjin Fengchuan Chemical Reagent Technologies Co., Ltd. (Tianjin, China).

2.2. Methods

2.2.1. Preparation of Furfurylated Wood

Distilled water was used as the solvent to prepare the modified solution with FA concentrations of 10%, 20% and 30% in which furfuryl alcohol, maleic anhydride, and borax were used in the mass ratio of 1:0.06:0.01, respectively. The impregnation processes were as follows.
(1)
Drying: The specimens were placed in an oven at 103 °C for a 24 h drying process, and then the oven-dries mass and tangential, radical, and longitudinal directions were measured after cooling in a desiccator with an accuracy of 0.0001 g and 0.01 mm, respectively.
(2)
Impregnation (full cell process): The specimens were first treated under a negative pressure of 0.06 MPa for 0.5 h, then kept under a pressure of 0.4 MPa for 2 h, and finally treated under a negative pressure of 0.06 MPa for 0.5 h [23]. After the impregnation was completed, the excess impregnation solution on the surface was wiped away. Meanwhile, in order to more uniformly diffuse the furfuryl alcohol, each specimen was wrapped in aluminum foil and kept at 30 °C for 72 h.
(3)
Curing and drying: The samples were cured in an oven at 103 °C for 6 h, and then the aluminum foil was removed. The furfurylated wood mass M1 and dimensions were obtained after drying; the drying process was carried out at 50 °C for 12 h, followed by 70 °C for 12 h, and finally 103 °C for 24 h. According to the weight percentage gain, the furfurylated poplar and Chinese fir wood impregnated with 0%, 10%, 20%, and 30% concentrations were labeled as PW0, PW17, PW35, PW51, SW0, SW23, SW45 and SW75, respectively.
The weight percentage gain (WPG) and bulking coefficient (BC) were calculated using the following equation:
WPG ( % ) = M 1 M 0 M 0 × 100
where M0 and M1 are the oven-dried weights (g) before and after FA treatment, respectively.
BC ( % ) = V 1 V 0 V 0 × 100
Here, V0 and V1 are the oven-dried volume (mm3) before and after treatment, respectively.

2.2.2. Morphology and Microstructure

Each sample was placed in a beaker filled with distilled water; then, the beaker was placed in a desiccator with a pressure of −0.06 MPa until the sample was submerged; afterwards, the sample was softened in a water bath at 90 °C for 2 h. Transverse and longitudinal sections with thicknesses of 10–12 μm were sectioned with a microtome (SM2000R, Leica company, Weitzlar, Germany).
Transverse sections of the samples were observed with confocal laser scanning microscopy (SP8, Leica company, Weitzlar, Germany) using a 63× oil microscope, with a 633 nm excitation state and a detector range of 650–700 nm. Meanwhile, the distribution position of FA in the cell wall was observed with a scanning electron microscope (Quanta 200, FEI, Portland, OR, USA).

2.2.3. EMC and Dimensional Stability of Adsorption

Samples were conditioned at 20 °C and relative humidity (RH) of 33%, 65%, and 95% through moisture absorption with 12 replicates [24]. The humidity and temperature in the moisture absorption test were controlled using a climate chamber (KMF720, Binder, Tuttlingen, Germany) with a temperature accuracy of ±0.1 °C and a humidity accuracy of ±2.5%. The measurement accuracy of the balance was 0.0001 g [25]. The moisture adsorption tests were continuously conducted from the lowest to higher RH values after the samples were treated in the oven at 103 °C for 24 h. The weight and dimensions were measured when mass variations were lower than 0.1% after daily mass readings at each RH. The reduced equilibrium moisture content (EMCR) and anti-swelling efficiency (ASE*) were calculated using the following equation [26,27]:
EMC ( % ) = M 2 M 1 M 1 × 100
where M2 is the mass of absorption equilibrium.
EMC R = EMC ( 1 + WPG )
ASE ( % ) = α 1 α 0 α 0
Here, α1 and α0 are the volume swelling efficiency of untreated and treated wood in absorption, respectively.
α ( % ) = V a V u V u × 100
ASE * = ASE ( 1 + BC ) BC
Here, Va is the swollen volume and Vu is the oven-dried volume.

2.2.4. Mercury Intrusion Porosimetry (MIP)

Mercury intrusion porosimetry (AutoPore IV, Micromeritics, Norcross, GA, USA) was used to analyze the pore size distribution, cumulative pore volume, bulk density, and samples porosity with dimensions of 6 × 6 × 5 mm3 (R × T × L) under oven-dried conditions. Hg intrusion was performed using a pressure between 0 and 414 MPa with an equilibrium time of 10 s at the initial and the final pressure levels during the MIP test process.

2.2.5. LF-NMR Analysis

For the analysis of the effect of FA modification on bound and free water, low-field NMR (MicroMR-60H, Niumag, Shanghai, China) was used to analyze the control and furfurylated wood with 30% FA and to condition samples to become fully water-saturated via the full-cell vacuum-pressure process. The Carr–Purcell–Meiboom–Gill (CPMG) pulse sequence was used to calculate the T2 of the samples, and 18,000 echoes with 64 scans were acquired. The echo time was 0.2 ms, LF-NMR data were inverted with a multi-exponential function, and the algorithm used SIRT. The test temperature was room temperature (25 °C).

2.2.6. Cyclic Water Soaking and Dimensional Stability

In order to evaluate the effect of FA treatment on the water uptake and dimensional stability, the samples were first placed in an oven at 103 °C for 24 h. Second, we conditioned samples to become fully water-saturated using a full-cell vacuum-pressure process and then soaked them in water at 30 °C for 24 h. Finally, we oven-dried them again. This process was defined as a drying–soaking–drying cycle, which was repeated three times [28]. We tested 12 replicates for each group. The reduced water uptake (MCWAR) and reduced anti-swelling efficiency (ASEws) with water saturation were calculated with each cycle repetition and using the following equations:
MC WA ( % ) = G i G i 0 G i 0 × 100
MC WAR = MC WAR ( 1 + WPG )
where Gi is the mass of a fully water-saturated sample and Gi0 is the mass of an oven-dried sample in the same number of cycles.
Reduced anti-swelling efficiency (ASEws) values with water saturation were calculated with Equations (5)–(7) described above [25,26] during cyclic water soaking.

2.2.7. Statistical Analysis

IBM SPSS Statistics (V.23) software was employed to assess the effect of the furfuryl alcohol treatment concentration on weight percentage gain, bulking coefficient, equilibrium moisture content, water uptake, and volume swelling efficiency, according to the methods of a previous study [29]

3. Results and Discussion

3.1. WPG and BC of Furfurylation, Hygroscopicity and Dimensional Stability

The WPG and the FA concentration showed a significant positive relationship, as seen in Table 1. However, there were considerable differences in the WPG of the Chinese fir and poplar. At a 10% furfurylation concentration, the WPG values of the Chinese fir and poplar were about 23% and 17%, respectively. When the concentration increased to 30%, the WPG values of the Chinese fir and poplar were 75% and about 51%, respectively, indicating that the WPG of the Chinese fir was generally higher than that of the poplar. However, the air-dry densities of the poplar and fir were about 480 and 310 kg/m3, respectively, which led to differences in the permeability and porosity of the Chinese fir and poplar and may have resulted in different weight percentage gains in furfurylation. Additionally, there was a large number of alternate pits in the vessel that may have resulted in a lower retention of furfuryl alcohol in the cell walls of the poplar. It was also suggested that the comparatively lower WPG of poplar wood is caused by its easier evaporation during the curing and drying stages [30].
As can be seen from Table 1, the BC increased accordingly alongside the WPG. The increases in the WPG of the Chinese fir were similar to those of the BC from 10% to 20% and from 20% to 30% of FA concentration, though the increases in BC lowered in the second stage. Statistical analysis showed significant differences between various concentrations of FA and the WPG, but there were no significant differences between furfurylated wood and BC at concentrations of 20% and 30%, indicating that the amount of FA entering the cell wall did not significantly increase and the effectiveness of FA on cell wall modification decreased with the increase in WPG. In addition, the BC of the poplar was significantly higher than that of the Chinese fir, indicating that the furfurylation of the poplar cell wall required lower concentrations than that of the Chinese fir.
Dimensional stability is one of the important properties of wood products in usage, and it is related to moisture absorption. As can be seen from Table 1, The EMCR of the furfurylated wood was lower than that of the control wood. The EMC of SW75 was reduced by 23%–36% compared to the control wood of below 95% RH, and the EMC was reduced by about 11% at 95% RH while the EMC reduction in poplar was smaller than that of the Chinese fir. These results indicate that furfurylation could effectively reduce the hygroscopicity of the poplar and Chinese fir; this may have been due to the curing of FA resin in the cell wall that covered moisture adsorption sites such as hydroxyl groups in the amorphous areas [11], but the differences were not significant across the various FA concentration treatments. The changes in the hygroscopic process of ASE* after furfurylation were more intuitive than those of EMCR. It was found that the average ASE* value of SW75 was more than 45% and that the average ASE* value of PW51 was more than 61%. It was shown that a low concentration of furfurylation could better improve the hygroscopic dimensional stability of the Chinese fir and poplar, but it was more effective in improving the dimensional stability of the poplar, which was consistent with higher BC values also observed in the poplar.

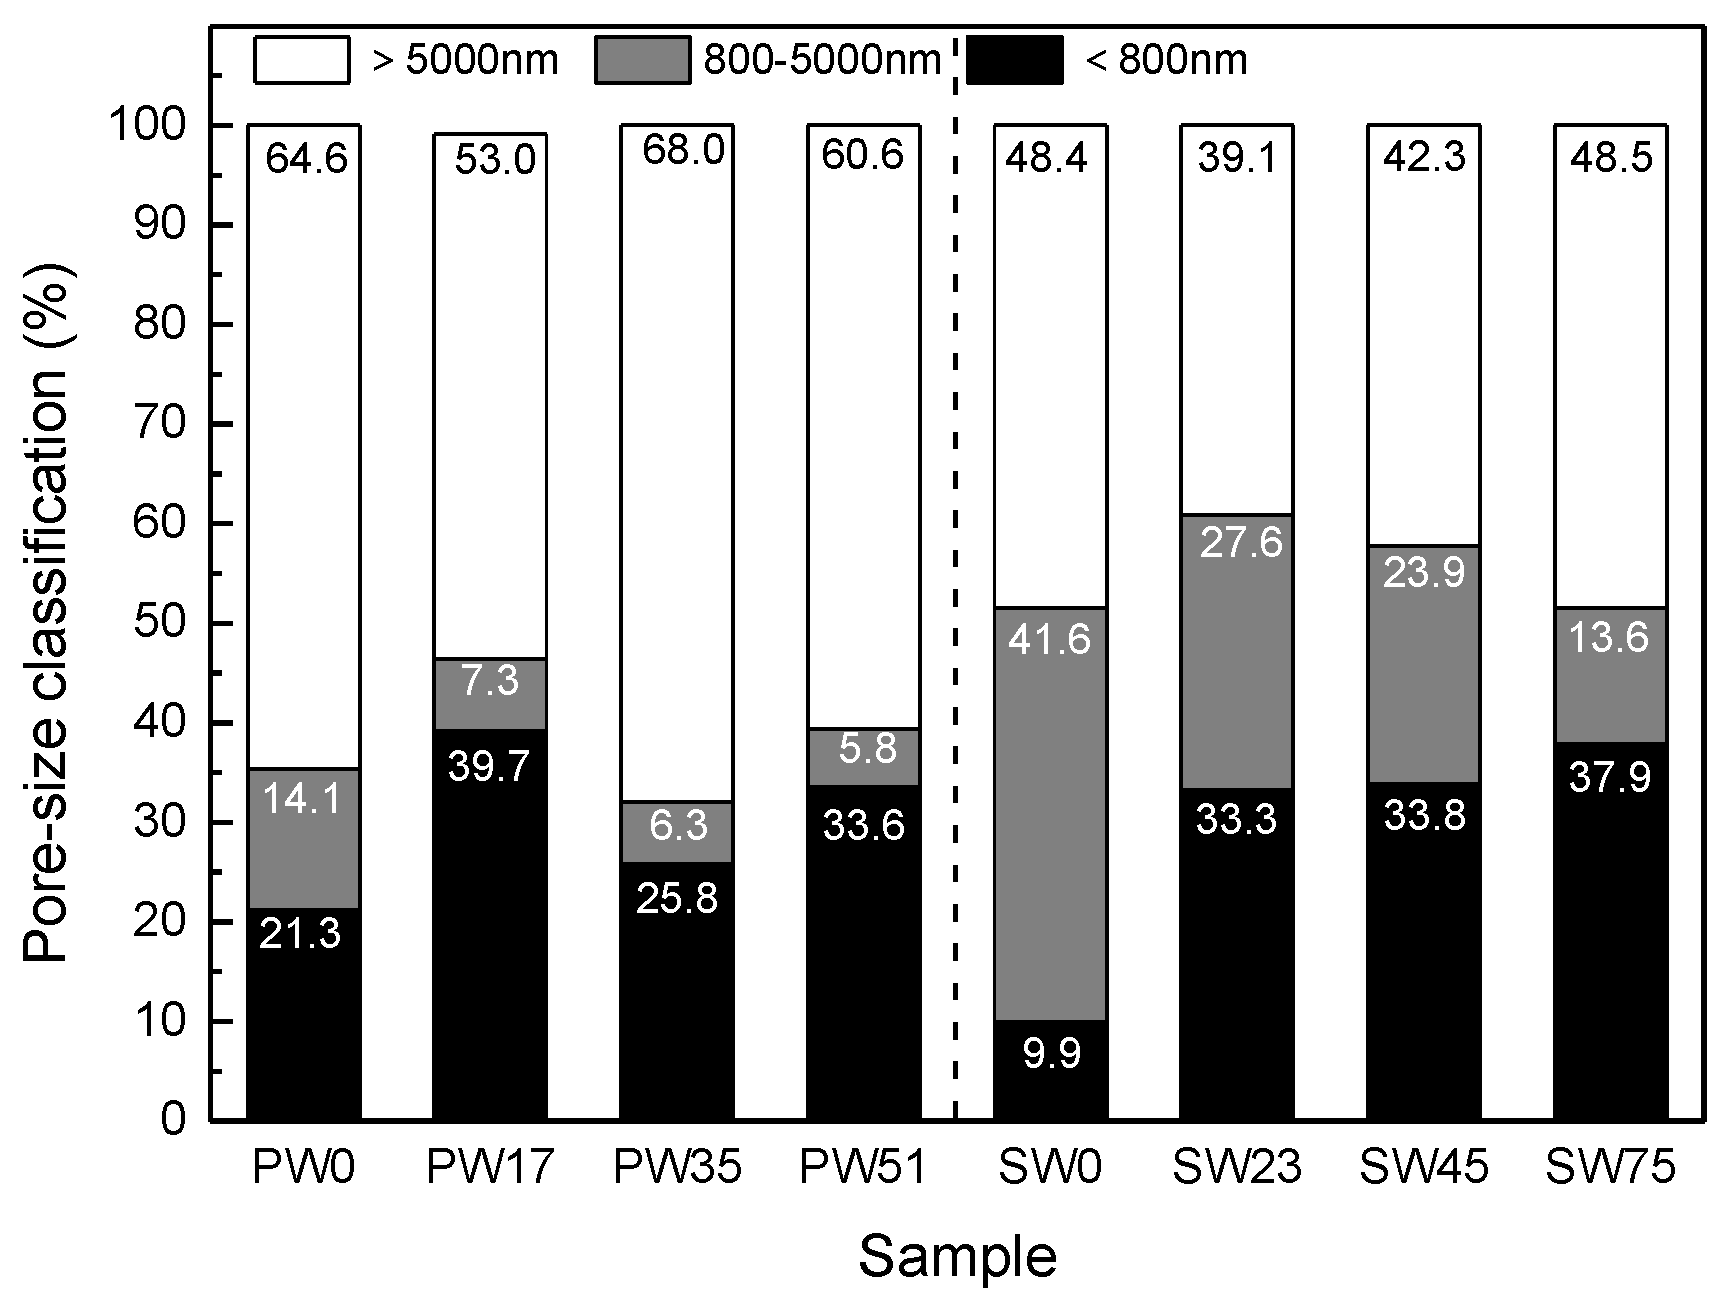
3.2. Mercury Intrusion Porosimetry (MIP)

The MIP method is a common means of analyzing the large pores of wood. The cumulative pore volume reflects the total pore volume in a sample, and the log-differential pore size distribution represents the pore volume in different pore size ranges. Figure 1 (left) shows the cumulative volume and log-differential pore size distributions for Chinese fir samples. The 1–6 μm diameter variation of the pore volume of the control wood was caused by the pointed ends of the pits, the voids of the pit membranes, and the pit openings [31,32]. The log-differential distribution of the pore diameters between 1 and 6 μm decreased with increasing concentrations of FA due to the deposition of FA resin at the pointed ends of pits and tracheids. The furfurylated Chinese fir showed new pores in the range of 80–600 nm, and larger concentrations of FA led to the formation of smaller new-pore sizes because the FA resin was cured on the pores of the pit openings, pit membranes, and pointed ends of the tracheids. The diameters of between 6 and 20 μm may have been caused by latewood tracheids, and pore sizes of over 20 μm represented the earlywood tracheids in the control Chinese fir [31]. The pore volume in the 6–20 μm range decreased with increasing impregnation concentrations, but the level of change in pore volume for diameters of over 20 μm was less than 6–20 μm due to furfurylation, indicating that the amount of cured FA in the cell lumina of latewood was greater than that of earlywood in the Chinese fir.
Figure 1 (right) shows the cumulative pore volume and log-differential pore-size distributions of the poplar wood. The pore volume of the control wood significantly changed at 800–1000 nm according to the log-differential pore size due to the point ends of all the cell elements and pit chambers, openings, and fibers [33]. However, the furfurylated poplar wood showed almost no pore size distribution between 800 and 1000 nm, indicating that FA was cured at the point ends of the pit chambers, openings, and wood fibers. The pore diameters between 10 and 15 μm represented the voids of the wood fibers, and the pore diameters over 30 μm were assigned to the vessels in the control wood [33,34]. Pore volume decreased with increasing impregnation concentrations in the range of 10–15 μm, indicating that the amount of FA cured in the wood fibers increased with increased concentrations. The pores with diameters of between 15 and 80 nm reflected the voids of the pit membranes in the control wood. The pore volume of PW17, between 15 and 80 nm, was larger than that of other furfurylated poplar wood, which implied that the new pores were formed on the basis of the pores at the point ends of the pit chambers; on the other hand, smaller pore diameters formed as the WPG of FA increased in PW35 and PW51.
The newly formed pore size distribution of the furfurylated poplar (10–80 nm) was smaller than that of the Chinese fir (80–600 nm), which may have been related to the fact that poplar wood contains a much higher number of pits and smaller pore diameters in pit membranes. The amount of FA resin in the wood fibers and latewood tracheids significantly increased with increasing concentrations, as shown in Figure 1. The FA modification affected the pit structure from low concentrations, which may have been related to the fact that the pit is an important channel by which an impregnating solution can enter wood.
Table 2 shows the results of the MIP measurements. The bulk density of the furfurylated wood increased and the porosity gradually decreased with increasing concentrations of FA. The WPG of the poplar was less than that of the fir, the bulk density of the poplar was greater than that of the fir, and the porosity of the poplar was still less than that of the fir before and after modification. On the other hand, according to previous studies and changes in cumulative pore volume and log-differential pore-size distributions after furfurylation, the pore size distributions were grouped into three pore classes (below 800 nm, 800–5000 nm, and greater than 5000 nm) [32]. Additionally, the pore volume proportion was calculated as shown in Figure 2. The percentages of pore volumes below 800 nm for SW0, SW23, SW45, and SW75 were 9.9%, 33.3%, 33.8%, 37.9%, and 41.6%, respectively, and those of 800–5000 nm were 27.6%, 23.9%, and 13.6%, respectively. The trends of the pore volume percentages of the poplar and fir below 800 nm and from 800 to 5000 nm were generally consistent. These results indicate that the pore volume of the furfurylated wood decreased in the range of 800–5000 nm and increases below 800 nm, which led to changes in bulk density and porosity.

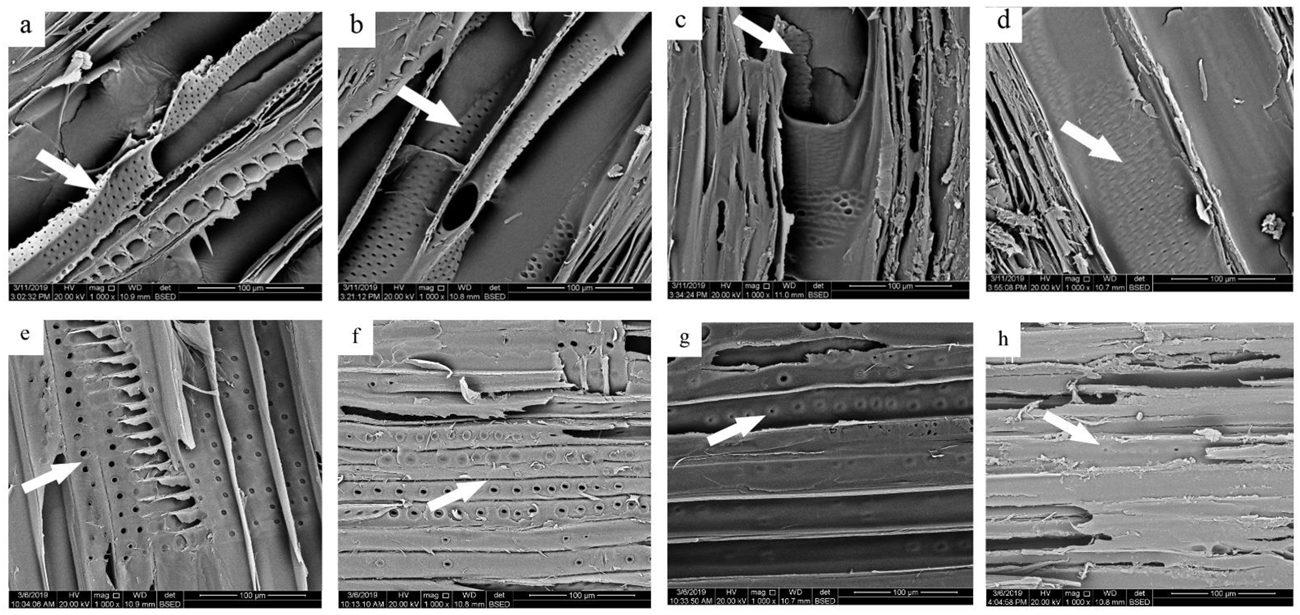
3.3. Characterization of FA Distribution

The CLSM and SEM images of the control and furfurylated poplar wood are shown in Figure 3a–d,e–h respectively. There was fluorescence in the cell walls as a whole in PW17 (Figure 3b), indicating that furfuryl alcohol could effectively penetrate the cell wall and deposit into the cell walls, especially in the lignin-rich areas such as the cell corners (CC), secondary walls (S2) and compound middle lamellae (CML). As the concentration of FA increased to 20%, the distribution of PW35 (Figure 3c) in the cell walls was consistent with that of PW17 (Figure 3b), but there was brighter fluorescence in the wood fiber lumen. These results could imply that FA was deposited in the inner walls of the wood fibers. It can also be seen from the SEM images in Figure 1 that the wood fibers in PW35 (Figure 3g) changed from clean and tidy in the lumen of PW17 (Figure 1f) cells after FA was attached. PW51 cell walls and cell lumen showed greater changes than PW17 and PW35. The cell walls and lumen of PW51 showed brighter fluorescence, and changes in the cell walls occurred due to a large number of furfuryl alcohol resin curing and bulking processes. Changes in cell lumen were caused by differences in FA conjugation lengths between the cell walls and cell lumen, resulting in stronger fluorescence in cell lumen [22]. Furthermore, the wood fiber cell morphology of PW51 (oval shaped) became crowded. The microstructure of a poplar longitudinal section can be observed in Figure 4a–d, which shows that furfurylation led to the deposition of FA resin in the alternate pits and wood fiber tracheids of the poplar that became more obvious with increases in furfuryl alcohol concentration.
The CLSM and SEM images of the Chinese fir shown in Figure 3i–p also show that the FA deposited in the Chinese fir cell walls was consistent with that of the poplar, with both mainly located in the lignin-rich area. The WPG of the Chinese fir was generally higher than that of the poplar, but the fluorescent brightness seemed to be weaker than that of the poplar at each modification level, which may have been related to the fact that the cell wall BC of the Chinese fir was smaller than that of the poplar. Meanwhile, compared to that of SW23 and SW45, the cell morphology of SW75 was deformed and apparent fluorescence in the tracheid cell cavities was observed. In addition, the amount of FA resin in the cell lumen of the 30%-concentration furfurylated Chinese fir was smaller than that of the poplar, probably due to the fact that Chinese fir cell walls could accommodate more furfuryl alcohol resin. According to the microstructure of the Chinese fir longitudinal section in Figure 4e–h, the filling of the Chinese fir pits and tracheids became obvious with increasing FA concentrations, and the pit aperture was almost completely filled at the 30% concentration.

3.4. LF-NMR

Figure 5 and Table 3 show the T2 relaxation time distribution, mean value, EMC (water saturation), and proportion of furfurylated and untreated wood, which indicate the microscopic state of water-bound hydrogen in wood and the difference in the degree of water binding to the wood according to the work of previous studies [35,36,37,38,39]. The relaxation times of the three main peaks of the T2 spectrum of SW0 were 1.05 ms, 12.75 ms, and 109.70 ms, and the proportions of their water populations were 9.9%, 3.0%, and 86.7%, respectively, which could be attributed to bound water in the cell walls and free water in the tracheids of latewood and earlywood. The results were generally consistent with those of previous studies [40]. The T2 values of SW75 were 0.56 ms, 219.64 ms, and 1245 ms, and the proportions of their water populations were 14.57%, 67.57%, and 17.22%, respectively, which could be attributed to cell walls, tracheids, and incompletely cured FA resin, respectively. The T2 values of water-saturated PW0 were 2.25 ms, 54.79 ms, and 471.38 ms, and their water populations accounted for 12.2%, 44.7%, and 41.0%, respectively; the shortest relaxation time was caused by bound water in the cell walls, and the others were caused by free water in wood fibers and vessels [41]. The T2 values of PW51 were 0.74 ms, 102.34 ms, and 880.49 ms, and the proportions of the their water populations were 15.7%, 5.2%, and 78.3%, respectively, caused by cell walls, wood fibers, vessels, and incompletely cured furfuryl alcohol resin, respectively. Compared to control wood, the relaxation times of bound water were reduced by 46% for SW75 and 67% for PW51, though the relaxation time of free water was prolonged due to furfurylation, indicating that furfurylation tightened the bound water and freed the free water. The change in the T2 value of the bound water may have been due to the increase in density and the decrease in moisture content after FA treatment. On the other hand, the effects of FA on free and bound water were different because FA resin is a hydrophobic substance that enlarged the cell wall contact angle more than that of the control wood, resulting in increasing T2 values between the wood and free water [42,43]. In addition, the proportions of the different water populations of furfurylated and control wood showed that although furfurylation reduced the moisture content of the wood, it increased the proportion of bound water and decreased the proportion of free water in the poplar and Chinese fir wood following water-saturation treatment, during which the proportion of free water in the vessel increased and that in the wood fiber decreased.
In summary, the effects of furfurylation on bound and free water included reductions in the amount of moisture content, tighter bonds between bound water and the wood, and a freer relationship between the free water and wood. The first effect can be attributed to the cell wall densification and the reduction in bound water following the furfuryl alcohol impregnation treatment, and the last effect may be attributed to the attachment of the hydrophobic FA resin to the cell walls.

3.5. Cyclic Water Soaking and Dimensional Stability

Water uptake represents the ability of wood to hold an amount of water, and it is closely related to porosity. Accordingly, water uptake also reflects the effect of FA treatment on the pore size distribution of cell walls and cell cavities [25]. Table 4 shows the MCWAR and ASEWS values of furfurylated and untreated wood during the water uptake test. It can be seen that the FA treatment could effectively reduce the MCWAR of the Chinese fir and poplar, as the MCWAR of the Chinese fir and poplar decreased along with increasing FA concentrations, with average reductions of 56%–79% for the Chinese fir and 8%–44% for the poplar compared to the control wood. Furthermore, Table 2 and Table 3 show that the MCWA of PW0 was 58% of that of SW0 and that the porosity of PW0 was 95.16% of that of SW0 in the control wood, mainly due to porosity. Moreover, the MCWAR of the furfurylated wood was different to control samples. The porosity of furfurylated Chinese fir was 13.51%–27.54% higher than that of the poplar, but the MCWAR of the furfurylated poplar wood was 22.17%–67.98% higher than that of the Chinese fir following furfurylation with various concentrations, indicating that the higher the WPG, the more significant the reduction in MCWAR. In addition, the ASEWS correspondingly increased with increases in FA concentration. However, changes in the amount of free water demonstrated insignificant effects on the dimensional stability of the wood. Thus, although the ASEWS increased with increasing WPG, it was not as significant as the decrease in MCWAR.
The number of water soaking cycles also had an effect on furfurylated wood, as seen in Table 4. As the cyclic water soaking times increased, the MCWAR of the poplar and fir control wood did not significantly change at around 276% and 161%, respectively. The ASEWS of the control wood decreased as the number of cycles of water soaking increased, but the third cycle of water soaking was less variable compared to the second cycle. Compared to the control wood, the MCWAR and ASEWS of the furfurylated wood slowly increased. The MCWAR of the second cycle of the furfurylated Chinese fir wood increased by 17%–19% compared to the first cycle, which indicated that there may have been a loss of FA impregnated in the wood during the test that resulted in increases in pore space and the water-uptake capacity. Furthermore, the loss of furfuryl alcohol was consistent with the large T2 values produced by the uncured furfuryl alcohol in low-field NMR. On the other hand, the ASEWS of PW51 decreased by more than 37% after each repetition of cyclic water uptake, which could imply that although furfurylation had a significant bulking effect on the poplar cell walls, it may have been unstable due to the large number of pits in the poplar cell walls.

4. Conclusions

(1)
Low concentrations of furfuryl alcohol can better enter the cell walls of the Chinese fir than those of poplar. Compared to an FA concentration of 10%–20%, there were no significant increases in the amount of FA entering the cell walls when the FA concentration was increased to 30% in both the Chinese fir and the poplar. Furthermore, the furfurylation of the poplar cell walls was more suitable than those of the Chinese fir cell walls. The FA resin was almost cured in the secondary walls, cell corners, and compound middle lamellae when furfurylated with the 10% concentration. Once the concentration increased to 30%, the amount of FA cured in the cell lumen of the poplar was greater than that of the Chinese fir.
(2)
The poplar’s pointed ends of pit chambers and pit apertures (800–1000 nm) and the Chinese fir’s small pores of pit membranes and pit apertures (1–6 μm) were partially infiltrated and deposited by FA resin at the 10%–30% concentrations and formed new pore sizes in the pore size distribution ranges of 80–600 nm and 15–100 nm, respectively. The amount of FA cured in the tracheids of the Chinese fir latewood and poplar wood rays increased along with increasing FA concentrations. The porosity of the poplar was greater than that of the Chinese fir, and the bulk density was lower in the poplar than the fir before and after modification.
(3)
Wood impregnation with a low concentration of FA was able to reduce the EMCR and improve the ASE*, but the dimensional stability of the poplar wood was more significantly improved. Additionally, furfurylation effectively reduced water uptake due to the hydrophobicity properties of the furfuryl alcohol resin. Furthermore, with increases in cyclic water soaking times, furfurylation demonstrated significant effects of MCWAR reduction and ASEWS improvement. The MCWAR of the Chinese fir increased by 17%–19% when treated with FA at various concentration in secondary cyclic water soaking, suggesting the loss and leaching of FA resin during the test. In addition, low-field NMR showed that the effects of modification on bound and free water included reductions in the amount of moisture content, tighter bonds between the bound water and wood, and a freer relationship between the free water and wood. It can therefore be concluded that furfurylation is a feasible method by which to extend furfurylated wood applications when using FA at low concentrations.

Author Contributions

Conceptualization, T.C.; experiments and data analysis, T.C., H.S. and Y.Y.; writing—original draft preparation, H.S. and X.C.; resources, T.C.; writing—review and editing, T.C. and C.F.; supervision, T.C. and C.D.; project administration, T.C. All authors have read and agreed to the published version of the manuscript.

Funding

This research was funded by the National key technology research and development project (2017YFD0600202), the Natural National Science Foundation of China (31560190) and the Natural National Science Foundation of China (31960291).

Institutional Review Board Statement

Not applicable.

Informed Consent Statement

Not applicable.

Data Availability Statement

The data presented in this study are available on request by contact with the corresponding author.

Conflicts of Interest

The authors declare no conflict of interest.

References

  1. Hosseinpourpia, R.; Adamopoulos, S.; Mai, C. Dynamic vapour sorption of wood and holocellulose modified with thermosetting resins. Wood Sci. Technol. 2016, 50, 165–178. [Google Scholar] [CrossRef]
  2. Klüppel, A.; Mai, C. The influence of curing conditions on the chemical distribution in wood modified with thermosetting resins. Wood Sci. Technol. 2013, 47, 643–658. [Google Scholar] [CrossRef] [Green Version]
  3. Lande, S.; Westin, M.; Schneider, M. Properties of furfurylated wood. Scand. J. For. Res. 2011, 19, 22–30. [Google Scholar] [CrossRef]
  4. Esteves, B.; Nunes, L.; Pereira, H. Properties of furfurylated wood (Pinus pinaster). Eur. J. Wood Wood Prod. 2011, 69, 521–525. [Google Scholar] [CrossRef]
  5. Morozovs, A.; Keke, A.; Fisere, L.; Spulle, U. Wood modification with furfuryl alcohol and furfurylated wood durability in water. In Proceedings of the 17th International Scientific Conference Engineering for Rural Development, Jelgava, Latvia, 23–25 May 2018. [Google Scholar]
  6. Yang, T.; Cao, J.; Ma, E. How does delignification influence the furfurylation of wood? Ind. Crops Prod. 2019, 135, 91–98. [Google Scholar] [CrossRef]
  7. Herold, N.; Pfriem, A. Impregnation of veneer with furfuryl alcohol for an improved plasticization and moulding. Eur. J. Wood Wood Prod. 2013, 71, 281–282. [Google Scholar] [CrossRef]
  8. Kong, L.; Guan, H.; Wang, X. In situ polymerization of furfuryl alcohol with ammonium dihydrogen phosphate in poplar wood for improved dimensional stability and flame retardancy. ACS Sustain. Chem. Eng. 2018, 6, 3349–3357. [Google Scholar] [CrossRef]
  9. Buchelt, B.; Dietrich, T.; Wagenführ, A. Testing of set recovery of unmodified and furfurylated densified wood by means of water storage and alternating climate tests. Holzforschung 2014, 68, 23–28. [Google Scholar] [CrossRef]
  10. Dong, Y.; Ma, E.; Li, J.; Zhang, S.; Hughes, M. Thermal properties enhancement of poplar wood by substituting poly(furfuryl alcohol) for the matrix. Polym. Compos. 2019, 41, 1066–1073. [Google Scholar] [CrossRef]
  11. Shen, X.; Guo, D.; Jiang, P.; Yang, S.; Li, G.; Chu, F. Water vapor sorption mechanism of furfurylated wood. J. Mater. Sci. 2021, 56, 11324–11334. [Google Scholar] [CrossRef]
  12. Deka, H.; Mohanty, A.; Misra, M. Renewable-resource-based green blends from poly(furfuryl alcohol) bioresin and lignin. Macromol. Mater. Eng. 2014, 299, 552–559. [Google Scholar] [CrossRef]
  13. Lande, S.; Westin, M.; Schneider, M.H. Eco-efficient wood protection: Furfurylated wood as alternative to traditional wood preservation. Manag. Environ. Qual. 2004, 15, 529–540. [Google Scholar] [CrossRef]
  14. Pilgård, A.; Treu, A.; van Zeeland, A.N.T.; Gosselink, R.J.A.; Westin, M. Toxic hazard and chemical analysis of leachates from furfurylated wood. Environ. Toxicol. Chem. 2010, 29, 1918–1924. [Google Scholar] [CrossRef] [PubMed]
  15. Pilgård, A.; De Vetter, L.; Van Acker, J.; Westin, M. Toxic hazard of leachates from furfurylated wood: Comparison between two different aquatic organisms. Environ. Toxicol. Chem. 2010, 29, 1067–1071. [Google Scholar] [CrossRef] [PubMed]
  16. Vetter, L.D.; Pilgård, A.; Treu, A.; Westin, M.; Acker, J.V. Combined evaluation of durability and ecotoxicity: A case study on furfurylated wood. Wood Mater. Sci. Eng. 2009, 4, 30–36. [Google Scholar] [CrossRef]
  17. Goldstein, I.; Dreher, W. Stable Furfuryl Alcohol Impregnating Solutions. Ind. Eng. Chem. 1960, 52, 57–58. [Google Scholar] [CrossRef]
  18. Mantanis, G.I. Chemical modification of wood by acetylation or furfurylation: A review of the present scaled-up technologies. Bioresources 2017, 12, 4478–4489. [Google Scholar] [CrossRef] [Green Version]
  19. Hadi, Y.S.; Nawawi, D.S.; Abdillah, I.B.; Pari, G.; Pari, R. Evaluation of discoloration and subterranean termite resistance of four furfurylated tropical wood species after one-year outdoor exposure. Forests 2021, 12, 900. [Google Scholar] [CrossRef]
  20. Li, W.; Wang, H.; Ren, D.; Yu, Y. Wood modification with furfuryl alcohol catalysed by a new composite acidic catalyst. Wood Sci. Technol. 2015, 49, 845–856. [Google Scholar] [CrossRef]
  21. Sedliačiková, M.; Moresová, M.; Aláč, P.; Malá, D. What is the supply and demand for coloured wood products? An empirical study in Slovakian practice. Forests 2021, 12, 530. [Google Scholar] [CrossRef]
  22. Thygesen, L.G.; Barsberg, S.; Venås, T.M. The fluorescence characteristics of furfurylated wood studied by fluorescence spectroscopy and confocal laser scanning microscopy. Wood Sci. Technol. 2010, 44, 51–65. [Google Scholar] [CrossRef]
  23. Pu, H.; Chen, T.; Li, Y. Influences of furfurylation modification on the wood properties of rubberwood. J. For. Eng. 2014, 28, 50–53. [Google Scholar]
  24. Yang, L.; Tian, G.; Yang, S.; Shang, L.; Liu, X.E.; Jiang, Z. Determination of fiber saturation point of rattan (Calamus simplicifolius) using the LF-NMR and two conventional methods. Wood Sci. Technol. 2020, 54, 667–682. [Google Scholar] [CrossRef] [Green Version]
  25. Zelinka, S.L.; Glass, S.V.; Thybring, E.E. Evaluation of previous measurements of water vapor sorption in wood at multiple temperatures. Wood Sci. Technol. 2020, 54, 769–786. [Google Scholar] [CrossRef]
  26. Thybring, E.E. The decay resistance of modified wood influenced by moisture exclusion and swelling reduction. Int. Biodeterior. Biodegrad. 2013, 82, 87–95. [Google Scholar] [CrossRef]
  27. Chen, J.; Wang, Y.; Cao, J.; Wang, W. Improved water repellency and dimensional stability of wood via impregnation with an epoxidized linseed oil and carnauba wax complex emulsion. Forests 2020, 11, 271. [Google Scholar] [CrossRef] [Green Version]
  28. Chen, T.; Luo, P.; Xu, Z.; Luo, X.; Hu, Z. Effects of furfuryl alcohol impregnation on physical and mechanical properties of densified poplar wood. J. For. Eng. 2016, 1, 21–25. [Google Scholar]
  29. Boneka, A.S.; Uyup, M.K.A.; Hua, L.S.; Siam, N.A.; Salim, S.; Ashaari, Z. Sorption isotherm and physico-mechanical properties of kedondong (Canarium spp.) wood treated with phenolic resin. Constr. Build. Mater. 2021, 288, 123060. [Google Scholar] [CrossRef]
  30. Li, W.; Liu, M.; Wang, H.; Ren, D.; Yu, Y. Fabrication of highly stable and durable furfurylated wood materials. Part II: The multi-scale distribution of furfuryl alcohol (FA) resin in wood. Holzforschung 2020, 74, 1147–1155. [Google Scholar] [CrossRef]
  31. Zauer, M.; Hempel, S.; Pfriem, A.; Mechtcherine, V.; Wagenführ, A. Investigations of the pore-size distribution of wood in the dry and wet state by means of mercury intrusion porosimetry. Wood Sci. Technol. 2014, 48, 1229–1240. [Google Scholar] [CrossRef]
  32. Li, L.; Wang, X.; Yan, Y.; Ping, L. Pore analysis of thermally compressed Scots pine (Pinus sylvestris L.) By mercury intrusion porosimetry. Holzforschung 2017, 72, 57–63. [Google Scholar] [CrossRef]
  33. Plötze, M.; Niemz, P. Porosity and pore size distribution of different wood types as determined by mercury intrusion porosimetry. Eur. J. Wood Wood Prod. 2011, 69, 649–657. [Google Scholar] [CrossRef] [Green Version]
  34. Jansen, S.; Choat, B.; Pletsers, A. Morphological variation of intervessel pit membranes and implications to xylem function in angiosperms. Am. J. Bot. 2009, 96, 409–419. [Google Scholar] [CrossRef]
  35. Araujo, C.D.; MacKay, A.L.; Whittall, K.P.; Hailey, J.R.T. A diffusion model for spin-spin relaxation of compartmentalized water in wood. J. Magn. Reson. 1993, 101, 248–261. [Google Scholar] [CrossRef]
  36. Cai, C.; Zhou, F.; Cai, J. Bound water content and pore size distribution of thermally modified wood studied by NMR. Forests 2020, 11, 1279. [Google Scholar] [CrossRef]
  37. Cox, J.; Mcdonald, P.J.; Gardiner, B.A. A study of water exchange in wood by means of 2D NMR relaxation correlation and exchange. Holzforschung 2010, 64, 259–266. [Google Scholar] [CrossRef] [Green Version]
  38. Xu, K.; Lu, J.; Gao, Y.; Wu, Y.; Li, X. Determination of moisture content and moisture content profiles in wood during drying by low-field nuclear magnetic resonance. Dry. Technol. 2017, 35, 1909–1918. [Google Scholar] [CrossRef]
  39. Thybring, E.E.; Digaitis, R.; Nord-Larsen, T.; Beck, G.; Fredriksson, M. How much water can wood cell walls hold? A triangulation approach to determine the maximum cell wall moisture content. PLoS ONE 2020, 15, e0238319. [Google Scholar] [CrossRef]
  40. Fredriksson, M.; Thygesen, L.G. The states of water in norway spruce (Picea abies (L.) Karst.) Studied by low-field nuclear magnetic resonance (LFNMR) relaxometry: Assignment of free-water populations based on quantitative wood anatomy. Holzforschung 2017, 71, 77–90. [Google Scholar] [CrossRef] [Green Version]
  41. Almeida, G.; Gagné, S.; Hernández, R.E. A NMR study of water distribution in hardwoods at several equilibrium moisture contents. Wood Sci. Technol. 2007, 41, 293–307. [Google Scholar] [CrossRef]
  42. Thygesen, L.G.; Elder, T. Moisture in untreated, acetylated, and furfurylated Norway spruce studied during drying using time domain NMR. Wood Fiber Sci. 2008, 40, 309–320. [Google Scholar]
  43. Thygesen, L.G.; Elder, T. Moisture in untreated, acetylated, and furfurylated Norway spruce monitored during drying below fiber saturation using time domain NMR. Wood Fiber Sci. 2009, 41, 194–200. [Google Scholar]
Figure 1. Cumulative pore volume and log-differential intrusion versus pore size of Chinese fir (left) and poplar (right).
Forests 13 01176 g001
Figure 2. Comparison of the average pore size classification of untreated and furfurylated Chinese fir and poplar wood.
Forests 13 01176 g002
Figure 3. (ad) CLSM images of control poplar wood (a), SW23 (b), SW45 (c), and SW75 (d); (il) CLMS images of control Chinese fir wood (i) PW17 (j), PW35 (k), and PW51 (l). (eh) SEM images of control poplar wood (e), PW17 (f), PW35 (g), and PW51 (h); (mp) SEM images of control Chinese fir wood (m), SW23 (n), SW45 (o), and SW75 (p).
Forests 13 01176 g003
Figure 4. Microstructures of longitudinal sections of control poplar wood (a), PW17 (b), PW35 (c), and PW51 (d); microstructures of longitudinal sections of control Chinese fir wood (e), SW23 (f), SW45 (g), and SW75 (h).
Forests 13 01176 g004
Figure 5. The T2 value distribution of fully water-saturated furfurylated and control Chinese fir and poplar wood.
Forests 13 01176 g005
Table 1. WPG and BC and variations in EMCR and ASE* at 20 °C for Chinese fir and poplar wood with furfurylation (%).
SampleFA wt%WPGBCRH/EMCRRH/ASE*
33%65%95%33%65%95%
SW0---5.91 a11.23 a25.36 a---
(0.42)(0.02)(0.69)
SW231023.69 c6.22 b4.18 b9.25 b23.55 b33.2328.8331.42
(1.25)(0.98)(0.11)(0.12)(0.52)
SW452045.80 b9.31 a4.43 c9.14 c21.89 b30.9141.7737.61
(2.52)(0.93)(0.14)(0.29)(0.79)
SW753075.02 a9.85 a3.83 d8.68 d22.36 b36.4258.2442.80
(3.19)(1.24)(0.12)(0.14)(0.96)
PW0---5.15 a11.04 a25.22 a---
(0.04)(0.37)(0.92)
PW171017.66 c11.70 b3.83 b8.82 b22.73 b48.4534.9444.98
(1.31)(0.66)(0.11)(0.07)(1.18)
PW352035.96 b13.73 a3.77 c8.63 c21.49 c42.5140.7936.78
(3.96)(0.67)(0.07)(0.29)(0.65)
PW513051.07 a14.02 a3.79 d8.53 d22.66 c77.5751.2955.82
(6.07)(1.16)(0.07)(0.62)(1.10)
The standard deviation is given in parentheses; the same letter after a mean indicates no significance at p ≤ 0.05.
Table 2. Bulk density and porosity of control wood and furfurylated poplar and Chinese fir wood.
SamplePW0PW17PW35PW51SW23SW45SW75
Total intrusion volume mL/g1.411.190.850.721.741.251.11
Bulk density g/cm30.470.520.640.680.400.470.52
Porosity %66.4261.8154.3249.5569.5258.9458.31
Table 3. The T2 mean value, peak area, and proportion of furfurylated and untreated Chinese fir and poplar wood.
SamplePeakFully
Water-Saturated (%)
T2 Value (ms)Peak Proportion (%)
SW01251.71.19.9
212.83.0
3109.786.7
4821.40.5
Sum 100
SW75170.00.614.6
26.40.6
3219.667.6
41245.917.2
Sum 100
PW01169.62.2512.2
211.12.0
354.844.7
4471.441.0
Sum 100
PW51179.70.715.7
215.70.8
3102.35.2
4880.578.3
Sum 32,528.3
Table 4. Variation in MCWAR (fully water-saturated) and ASEWS of furfurylated and untreated poplar and Chinese fir with water uptake.
SampleMCWAR (%)ASEWS (%)
1st2nd3rd1st2nd3rd
SW0278.57 a276.04 a277.40 a
(8.85)9.94(8.85)
SW2395.80 b114.15 b120.88 b56.5638.4227.40
(9.75)(11.10)(9.67)
SW4560.24 c70.35 c74.20 c70.2247.0741.20
(1.86)2.69(50.89)
SW7557.19 c66.70 c62.66 d70.9051.1642.88
(1.39)3.29(9.21)
PW0162.22 a161.66 a160.64 a
(9.65)(10.31)(10.97)
PW17145.17 b145.92 b147.68 b50.4823.3214.90
(2.62)(3.54)(2.36)
PW35115.24 c118.18 c123.04 c63.7935.0821.40
(8.68)(10.49)(9.07)
PW5189.80 d99.15 d102.91 d72.3645.3723.47
(12.08)(11.74)(14.34)
The standard deviation is given in parentheses; the same letter after the mean indicates no significance at p ≤ 0.05.
Publisher’s Note: MDPI stays neutral with regard to jurisdictional claims in published maps and institutional affiliations.

