Article

Strongly Active Responses of Pinus tabuliformis Carr. and Sophora viciifolia Hance to CO2 Enrichment and Drought Revealed by Tree-Ring Isotopes on the Central China Loess Plateau

1
School of Geography and Tourism, Shaanxi Normal University, West Chang’an Street 620, Xi’an 710119, China
2
State Key Laboratory of Cryospheric Science, Northwest Institute of Eco-Environment and Resources, Chinese Academy of Sciences, Lanzhou 730000, China
3
Meteorological Service Center of Gansu Province, Lanzhou 730020, China
4
The Key Laboratory of Mountain Environment Evolution and Regulation, Institute of Mountain Hazards and Environment, Chinese Academy of Sciences, Chengdu 610041, China
*
Author to whom correspondence should be addressed.
Forests 2022, 13(7), 986; https://doi.org/10.3390/f13070986
Submission received: 25 April 2022 / Revised: 18 June 2022 / Accepted: 19 June 2022 / Published: 23 June 2022

Abstract

:
Understanding the water-use strategy of human-planted species used in response to climate change is essential to optimize afforestation programs in dry regions. Since 2000, trees on the central Loess Plateau have experienced a shift from strengthening drought to weakening drought. In this study, we combined tree-ring δ13C and δ18O records from Pinus tabuliformis (syn. tabulaeformis) Carr. (a tree) and Sophora viciifolia Hance (a shrub) on the central Loess Plateau to investigate species-specific responses to rising atmospheric CO2 (Ca) and drought. We found summer relative humidity controlled the fractionation of tree-ring δ18O, but the magnitude of the climate influence on δ13C differed between the species. The intrinsic water-use efficiency (iWUE) trends of both species suggested a strongly active response to maintain constant intercellular CO2 concentrations as Ca rose. The tree-ring δ13C and δ18O of both species using first-difference data were significantly and positively correlated, with stronger relationships for the shrub. This indicated the dominant regulation of iWUE by stomatal conductance in both species, but with greater stomatal control for the shrub. Moreover, the higher mean iWUE value of S. viciifolia indicated a more conservative water-use strategy than P. tabuliformis. Based on our commonality analysis, the main driver of the increased iWUE was the joint effect of Ca and vapor-pressure deficit (25.51%) for the tree, while it was the joint effect of Ca and the self-calibrated Palmer drought severity index (39.13%) for the shrub. These results suggest S. viciifolia will be more drought-tolerant than P. tabuliformis and as Ca continually rises, we should focus more on the effects of soil drought than atmospheric drought on the water-use strategy of S. viciifolia.

1. Introduction

The atmospheric carbon dioxide concentration (Ca) has increased rapidly from 303 ppm in 1920 to 410 ppm in 2020 [1]. During the same period, extreme drought events have occurred frequently in parallel with global warming [2]. Rising Ca and global warming have increased tree water-use efficiency around the world and stimulated tree growth and forest productivity [3,4,5]; on the other hand, gradual warming has exacerbated both atmospheric vapor and soil water deficits, which restricts forest growth and endangers ecosystem health [6,7]. The trade-off between these two changes is a crucial determinant of changes in the terrestrial carbon cycle and in the sustainable development of forests [8], especially on dryland vegetation cover [9].
China’s Loess Plateau is a typically fragile ecotone located in the transition zone between China’s arid and humid regions [10]. Since 1999, the Grain for Green Project (GFGP) has been implemented across China, including on the Loess Plateau, to conserve soil and sequester carbon through afforestation and grassland restoration [11]. Although the vegetation cover increased greatly, evidence provided the warning that the regional revegetation was approaching the sustainable limits imposed by the regional water resource [11,12]. Again, the frequently occurring drought hazards on the Loess Plateau have threatened the sustainability of plantations [13,14]. One way to deal with this risk is to study the water-use characteristics of human-planted species, which can identify suitable species for improving next-stage afforestation.
In contrast to field control experiments and eddy-flux measurements with sparse distributions, the stable carbon isotope (δ13C) in tree rings provides an opportunity to investigate long-term plant water-use strategies. Discrimination against 13C (Δ13C) during photosynthesis in C3 plants reveals a specific response to the ratio of intercellular CO2 concentration (Ci) to Ca (i.e., Ci/Ca). In turn, the Ci/Ca level is determined by the relationship between photosynthesis (A) and stomatal conductance (gs) [15], which is referred to as intrinsic water-use efficiency (iWUE = A/gs), at the individual tree level. iWUE indicates the balance between water loss and photosynthetic carbon assimilation [16]. Different from δ13C, the stable oxygen isotope (δ18O) in tree rings is inversely linked to gs but is independent of A and can, therefore, be assumed to be a proxy for gs in certain environments [17]. Variation in gs can affect δ18O in leaf water and derived photosynthate through: (1) evaporative cooling of the leaf; (2) the diffusion of water vapor; and (3) the Péclet effect [18]. Based on these mechanisms, a semiquantitative model was developed to link A and gs with δ13C and δ18O [19], and this has been used to determine whether variation in iWUE is caused by changes in A, gs, or both [20,21]. Thus, the dual-isotope records in annual growth rings can reveal the water-use strategy of human-planted species used to survive under environmental constraints.
Previous studies of tree-ring isotopic records on the Loess Plateau mainly focused on paleoclimate reconstructions, such as relative humidity (RH) [22,23] and drought history [24,25]. Yet, relatively few researchers examined plant physiology using δ13C or δ18O data. For example, Pinus tabuliformis primarily utilized shallow water based on an analysis of δ18O [26], and the higher iWUE derived from δ13C indicated that this species had more conservative water use than Robinia pseudoacacia [27] on the Loess Plateau. However, to our knowledge, few studies have been concentrated on the human-planted species’ medium for long-term ecophysiological responses to regional climate changes using both carbon and oxygen isotopes.
Pinus tabuliformis Carr. (a tree) and Sophora viciifolia Hance (a shrub) are both native pioneer species with high drought tolerance and a high survival rate, and they were widely distributed and planted to halt soil erosion on the Loess Plateau [28,29]. In this study, we combined tree-ring α-cellulose δ13C and δ18O of P. tabuliformis and S. viciifolia growing on the central Loess Plateau to explore species-specific responses to rising Ca and drought. Our main goals were to (1) identify the dominant climate drivers of tree-ring δ13C and δ18O responses; (2) explore the mechanisms of iWUE changes in the two species; and (3) quantify the contribution of atmospheric CO2 concentrations and drought to the iWUE of the two species. We hypothesized that S. viciifolia is more sensitive to rising Ca and frequent drought than P. tabuliformis.

2. Materials and Methods

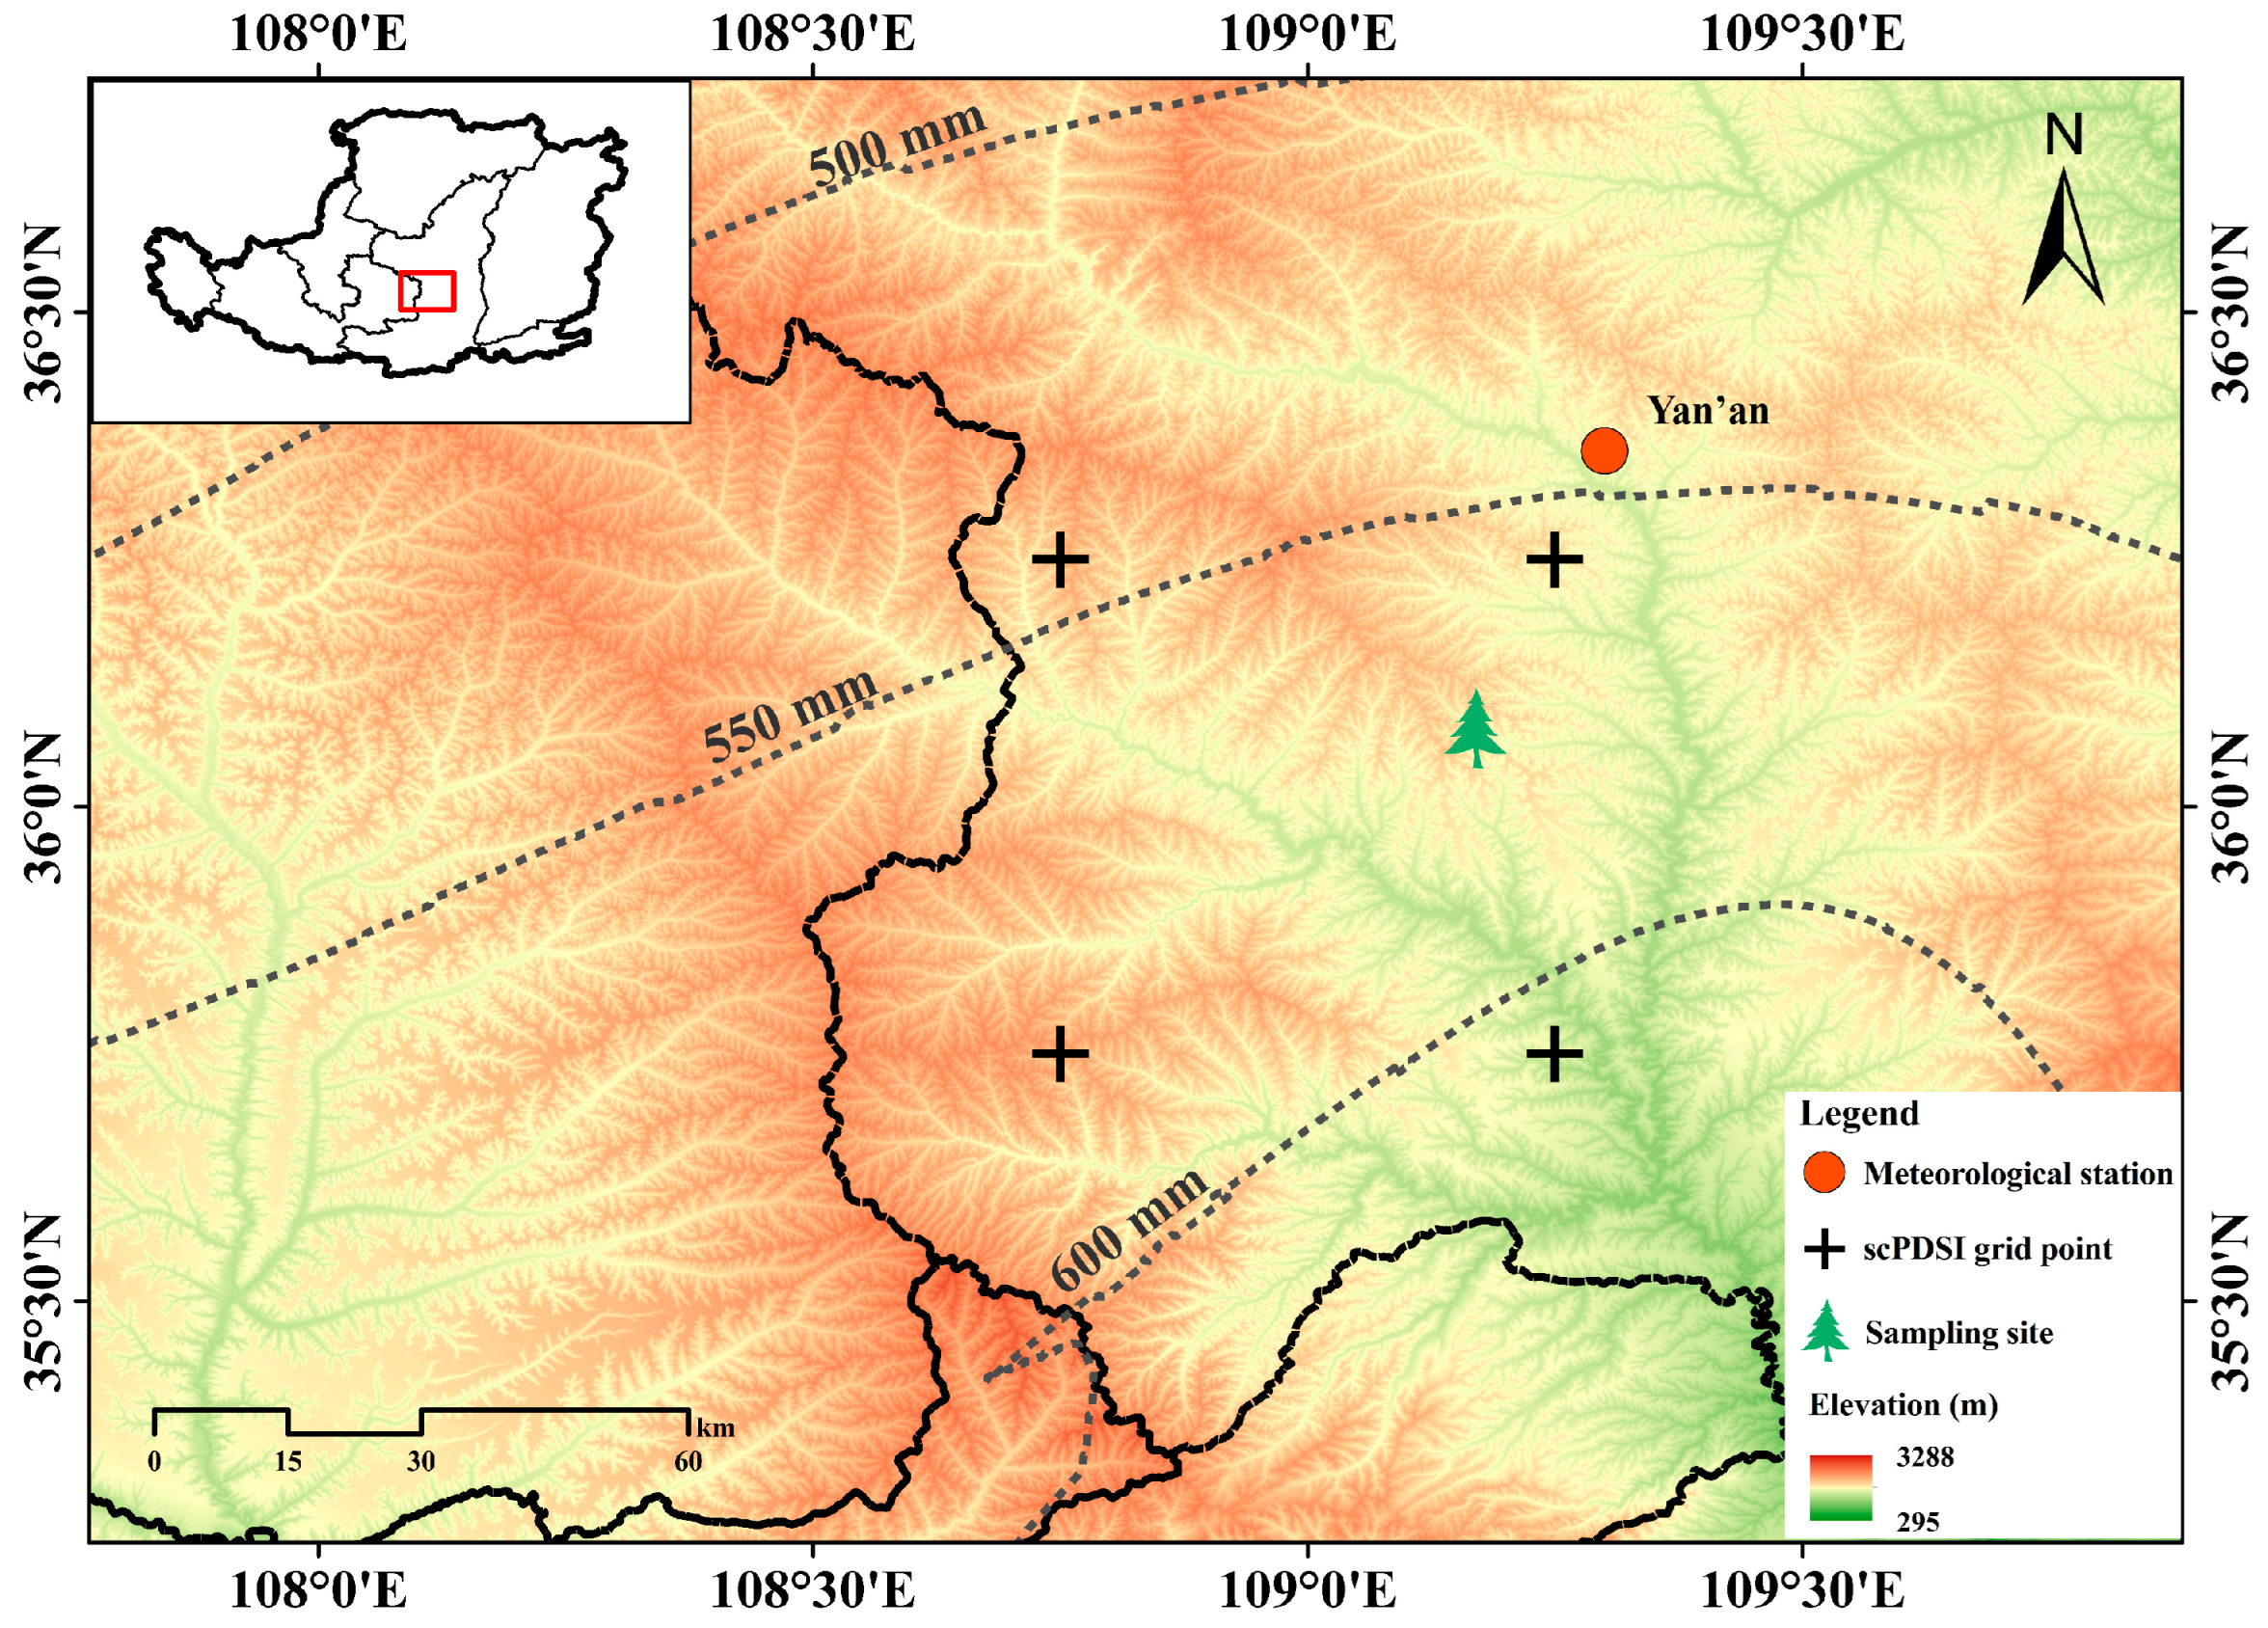
2.1. Study Area and Climate

Ravines and gullies cross the central Loess Plateau (Figure 1), and most areas are covered with a loess soil, which is highly vulnerable to erosion. Groundwater is buried deeply, and soil water is the main water source for plants [30]. Because of long-term climate change and human activities, the region’s primary forest vegetation has been severely damaged and replaced by secondary and artificial vegetation (e.g., GFGP).
The annual average temperature at the Yan’an meteorological station (36.36° N, 109.30° E, Figure 1) was 10.5 °C, with mean monthly temperature ranging from −4.8 °C in January to 23.5 °C in July, for the period from 1986 to 2017 (Figure S1a,b). Annual total precipitation was 516 mm from 1986 to 2017, and up to 90% of the precipitation fell during the growing season (April to October) (Figure S1a,c). Extreme precipitation event happened in July 2013. Vapor-pressure deficit (VPD) reflects the atmospheric vapor demand (i.e., atmospheric drought), while self-calibrated Palmer drought severity index (scPDSI) denotes the balance between evaporation and precipitation (i.e., soil drought), which are both common and effective indictors of drought on the Loess Plateau [31]. We estimated the monthly mean VPD based on the monthly air temperature and RH [32]; VPD ranged from 0.21 kPa in January to 1.13 kPa in June (Figure S1a). We also extracted scPDSI datasets based on 0.5° gridded datasets from the Climate Explorer database (https://climexp.knmi.nl/, accessed on 13 February 2021) as shown in Figure 1.
The scPDSI value in 2000 was lowest (−3.89) during the whole investigated period, which indicated the drought reached the severest level [33] (Figure 2a). An abrupt test using the ‘changepoint.np’ package for R software showed that the year 2000 was the inflection point year. From 1986 to 1999, scPDSI decreased significantly (R2 = 0.43, p < 0.05, Figure 2a) while VPD and temperature increased significantly (R2 = 0.34, p < 0.05 and R2 = 0.53, p < 0.005, respectively; Figure 2b and Figure S1b). Total precipitation decreased but not significantly (Figure S1c). After 2000, the scPDSI (temperature) showed significantly increasing (decreasing) trends (Figure 2a and Figure S1b), while VPD and total precipitation showed no significant change (Figure 2b and Figure S1c). Based on these results, we defined the period from 1986 to 1999 as a period when drought stress strengthened (Ds+) and the period from 2000 to 2017 as a period when drought stress weakened (Ds−).

2.2. Sample Preparation and Isotopic Measurements

The sampling site (36.08° N, 109.17° E, 1146 to 1264 m a.s.l.) was located at the Renjiatai forest plantation on the central Loess Plateau (Figure 1). We collected wood cores from P. tabuliformis and discs from S. viciifolia in June 2018. Following standard dendrochronological techniques [34], we air-dried the samples and then sanded and cross-dated them. Tree-ring widths were measured using version 6.0 of the LINTAB system (RINNTECH, Heidelberg, Germany) with a resolution of 0.01 mm and checked with the COFECHA quality control software [35]. Details of the cross-dating and growth analysis are provided by Li et al. [36].
We selected five cores (five trees) and six discs (six shrubs) from each species for isotope analysis according to our previous suggestions [37]. The selected tree cores had a high intercorrelation with the master chronology (the Pearson’s correlation coefficient ranged from 0.50 to 0.87 (p < 0.005) for P. tabuliformis and 0.61 to 0.77 (p < 0.005) for S. viciifolia). We eliminated the first 5 years of each core or disc to avoid possible juvenile effects and then separated the annual rings using a scalpel under a binocular microscope. The samples were dried in a vacuum-drying oven and then ground to pass through a 60-mesh (300 μm) sieve in an automatic grinder.
We extracted α-cellulose using the method of Liu et al. [37] and Leavitt and Danzer [38]. Briefly, the sample was placed in a filter bag and the α-cellulose was extracted by means of organic extraction, followed by bleaching and alkalization. Finally, the α-cellulose was homogenized using an ultrasonic cell disruptor (JY92-2D, Scents Industry, Ningbo, China) and then freeze-dried for 72 h using a vacuum freeze dryer (LGJ-10c, Foring Technology, Beijing, China) prior to the stable isotope analysis.
The isotopic measurements were conducted at the Laboratory of Stable Isotopes and Global Change, Shaanxi Normal University. We packed 0.14 to 0.16 mg of α-cellulose into silver capsules for the δ18O analysis and determined the ratio using a high-temperature conversion element analyzer (Flash IRMS EA, Isolink, Germany) coupled through a ConFlo VI interface to a gas isotope ratio mass spectrometer (Delta V Advantage, Thermo Fisher Science, Bremen, Germany). To determine the δ13C values, we added 0.10 to 0.12 mg of α-cellulose into tin foil capsules; then, we used the same equipment that we used for the δ18O analysis with silver capsules. The stable isotope measurements were calibrated following a two-point calibration method [39] using Sigma-Aldrich α-cellulose and IAEA-CH3. The δ18O and δ13C values were expressed with reference to the corresponding standards, namely, the Vienna Standard Mean Ocean Water (VSMOW) and Vienna Pee Dee Belemnite (VPDB), respectively. The isotope measurements were performed three times for δ18O and one time for δ13C for each sample, and the precision was better than 0.3‰ for δ18O and 0.05‰ for δ13C, respectively.

2.3. Definitions and Basic Equations

The Δ13C can be calculated as follows [16]:
Δ C 13 = δ C 13 air δ C 13 plant 1 +   δ C 13 plant 1000
where δ13Cair and δ13Cplant are the δ13C values of ambient CO2 and plant cellulose, respectively. For C3 plants, Δ13C is also a function of the difference between Ci and Ca, and it can be converted to Ci/Ca ratios as follows:
Δ C 13 = a + ( b a ) × C i C a
where a (~4.4‰) represents the isotopic discrimination that results from diffusion of CO2 from the atmosphere into the intercellular space of leaf cells, and b (~27.0‰) is the fractionation associated with carboxylation by Rubisco.
iWUE is the ratio of the net photosynthetic assimilation rate (A) to stomatal conductance (gs) for water vapor [40]:
i W U E = A g s = ( C a C i ) 1.6
where 1.6 is the ratio of the diffusivities of water and CO2 in air.
The atmospheric CO2 concentration rose rapidly since industrialization and increased by 58.3 ppm from 1986 to 2017 (https://gml.noaa.gov/ccgg/trends/global.html accessed on 24 April 2022), as shown in Figure S1d. To identify the climate drivers of the tree-ring δ13C, we used a statistical correction for the effects of depleted atmospheric δ13C (δ13Cair; Figure S1d) due to anthropogenic fossil fuel emissions [15]:
δ C 13 cor =   δ C 13 plant ( δ C 13 air + 6.4 )  
where δ13Ccor represents corrected tree-ring δ13C.
If the rise of Ca alone were responsible for changing iWUE, the ensuing measured long-term stomatal regulation of leaf gas exchange would fall within the natural ranges expected for active (constant Ci) or passive (constant Ci/Ca and Ca-Ci) responses [41]. These scenarios differ only in the degree to which the increase in Ci follows the increase in Ca (either not at all, in a proportional way, or at the same rate, respectively) [42]. Mean Ci concentration over the first 3 years of each species was used as the starting point for the scenarios in our study. Therefore, the iWUE of each year for the active response scenario (constant Ci) was calculated using Ca concentration of the current year and the mean Ci concentration of the first 3 years according to equation (3). The iWUE for the negative response scenario was derived following a similar method. More details can be found in Voelker et al. [43] and Saurer et al. [44]; these scenarios denoted different trade-offs between A and gs, so we applied the scenarios as guidelines to interpret the observed iWUE trends for the tree and shrub, respectively.

2.4. Data Analyses

We computed Pearson’s correlation coefficient (r) for the relationships between the tree-ring δ13Ccor and δ18O of the two species and the relationships between climate variables and dual isotopes. A piecewise regression model was employed to identify the difference in trends of climatic variance and isotopic values since the drought shift happened in 2000. We used the coefficient of determination (R2) to evaluate the goodness of fit of regression models. To avoid juvenile effects and the effects of low-frequency trends on δ13Ccor, we also extracted the high-frequency signal using the first-difference data [37]. To compare the difference in isotopic values between the two species, we used an independent samples Student’s t test for the common period (1994 to 2017).
We also used commonality analysis to quantify the contribution of Ca and drought (VPD and scPDSI) to the iWUE of the two species over the investigated period. Commonality analysis can decompose the explained variances into pure and joint effects of the predictors when dealing with variables that exhibit collinearity in regression analysis [45]. We performed this analysis using version 3.6.3 of the ‘yhat’ package for the R software [46].

3. Results

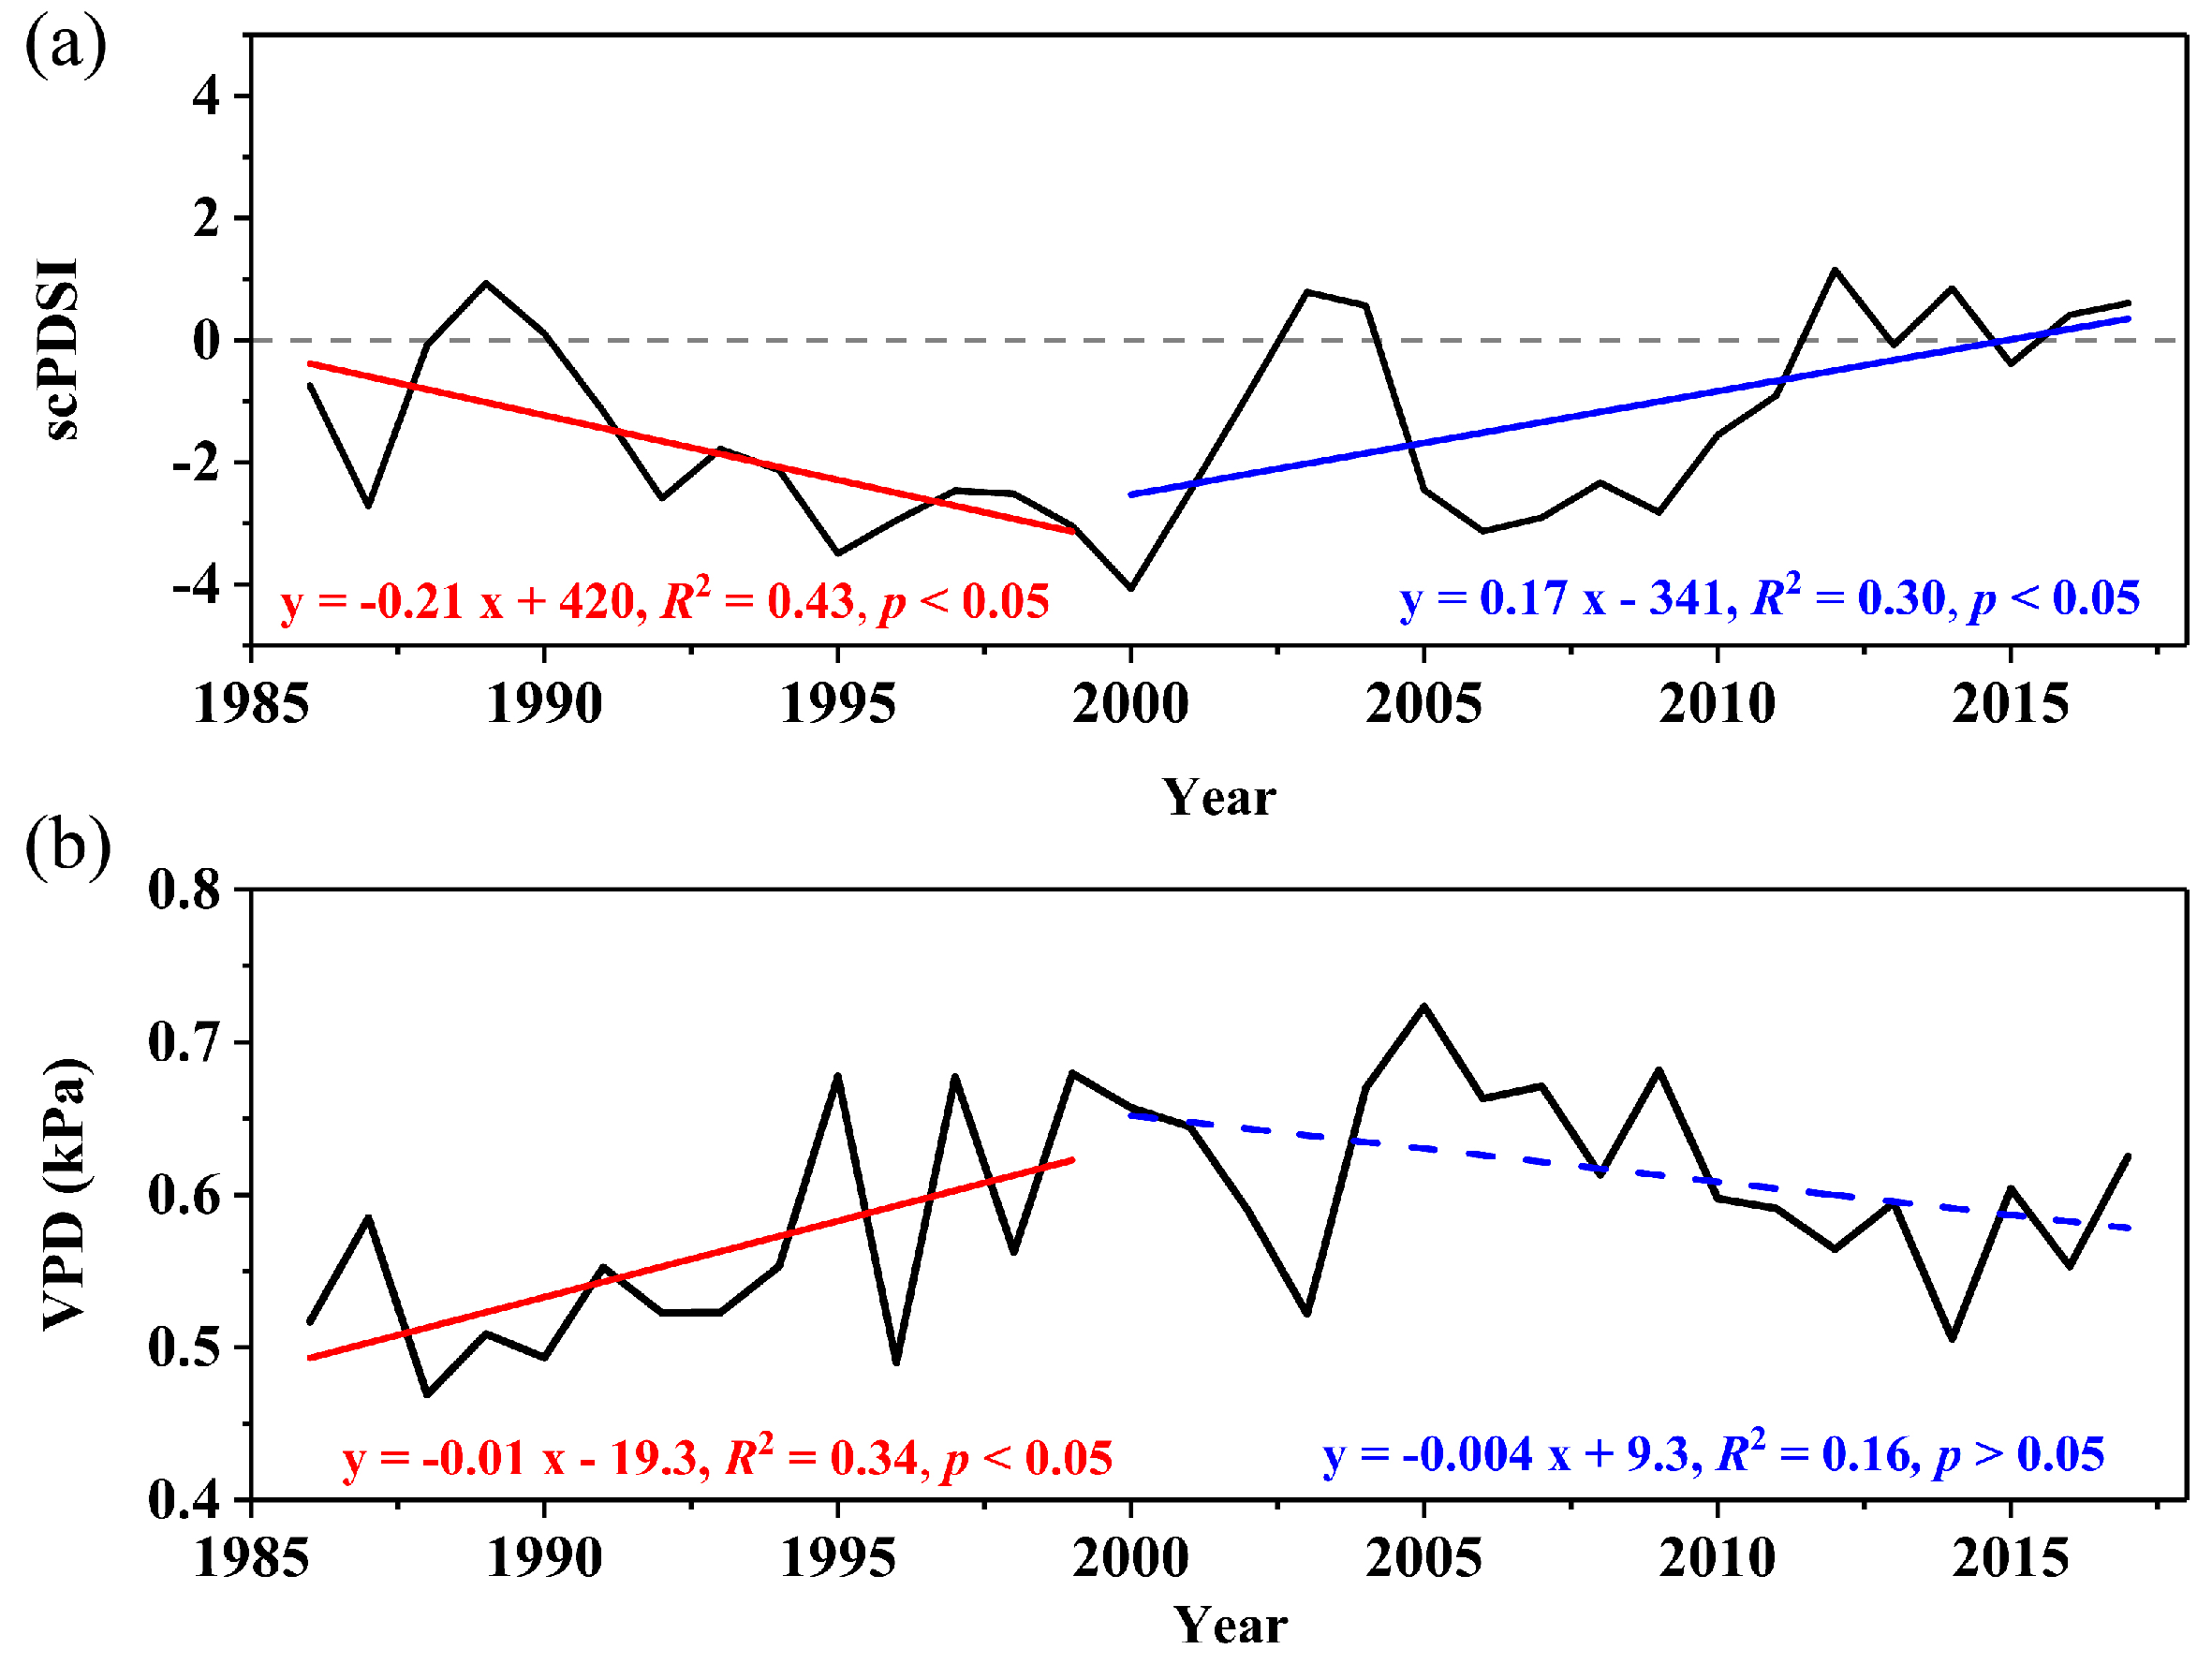
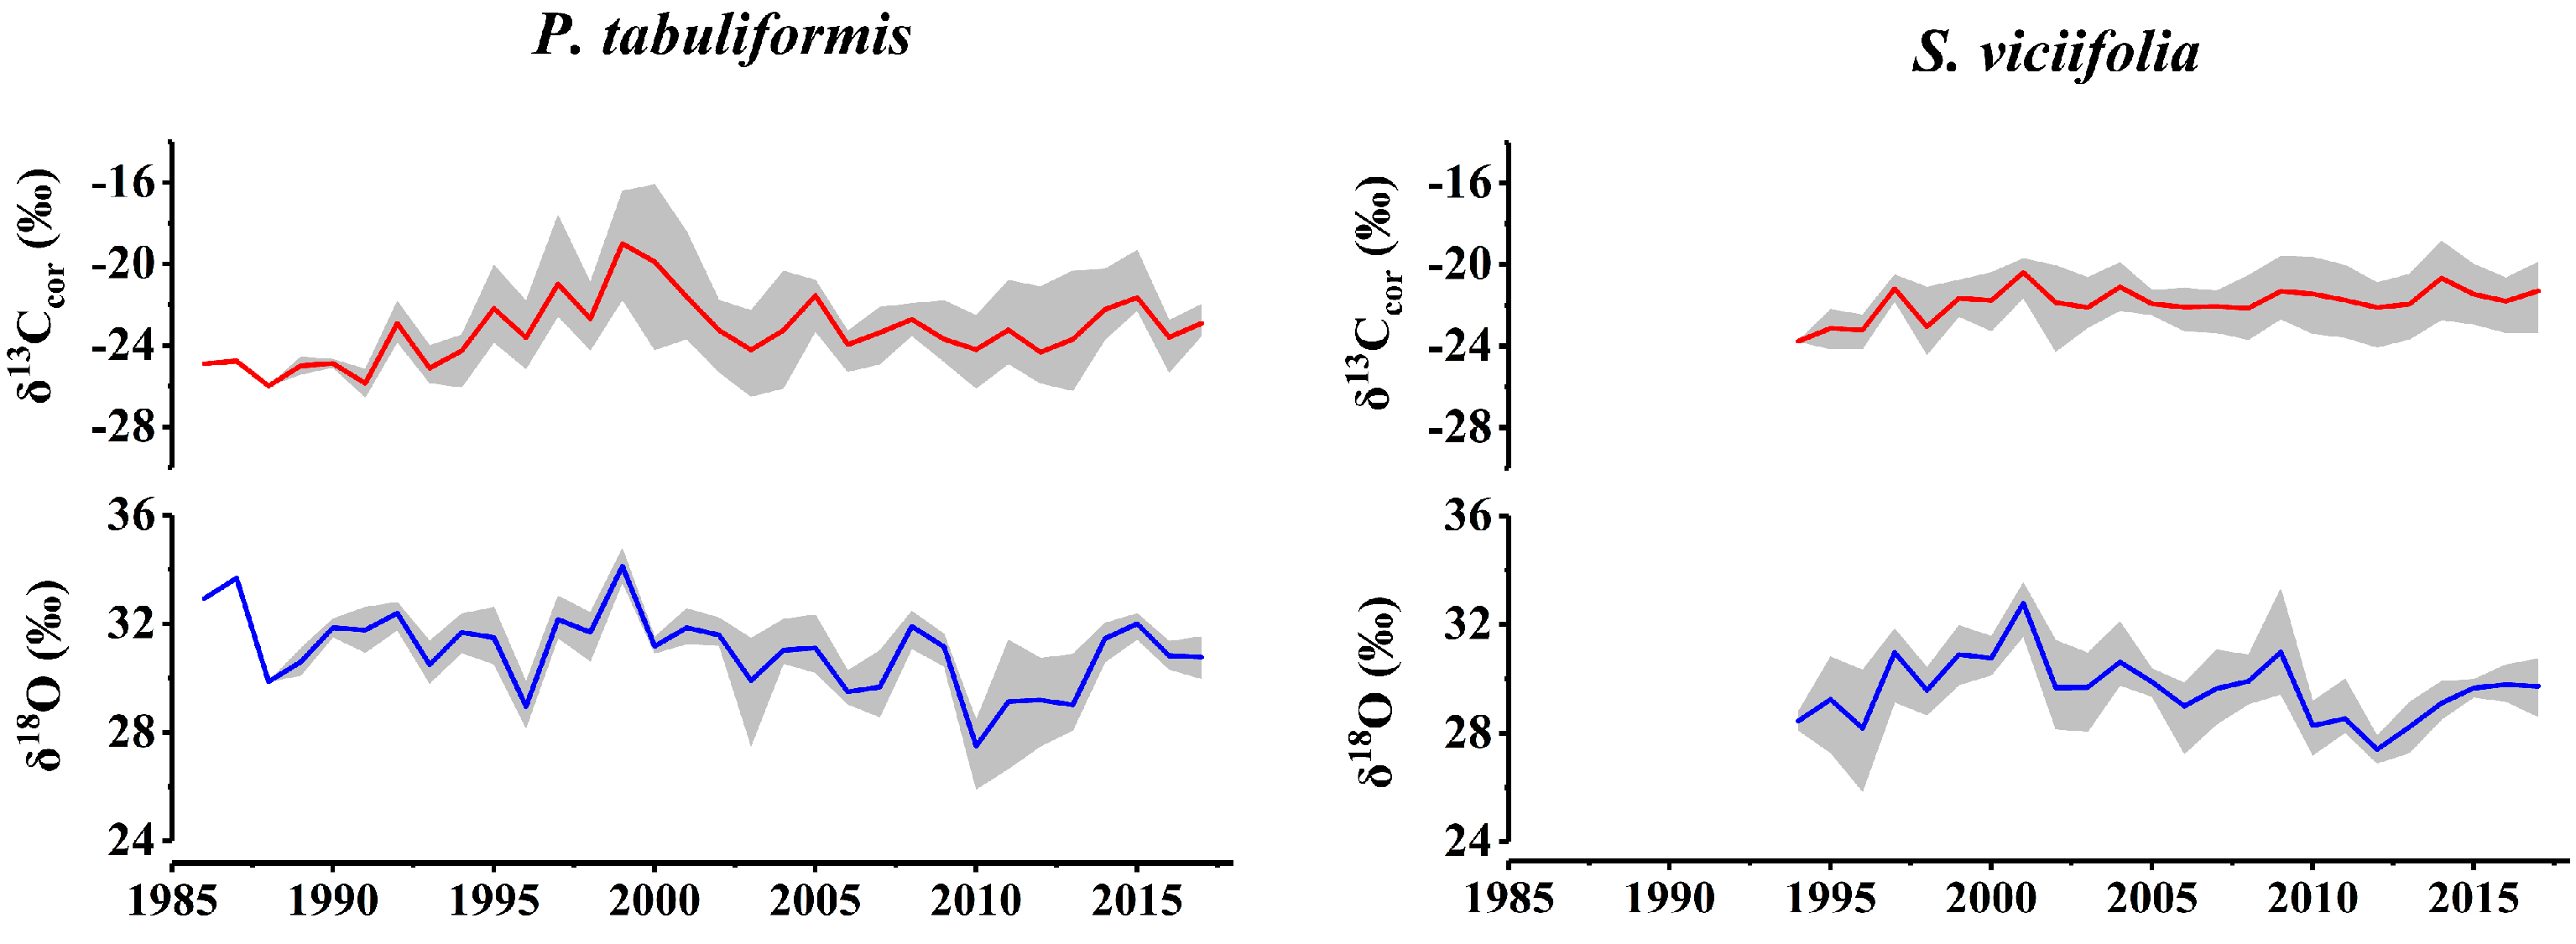
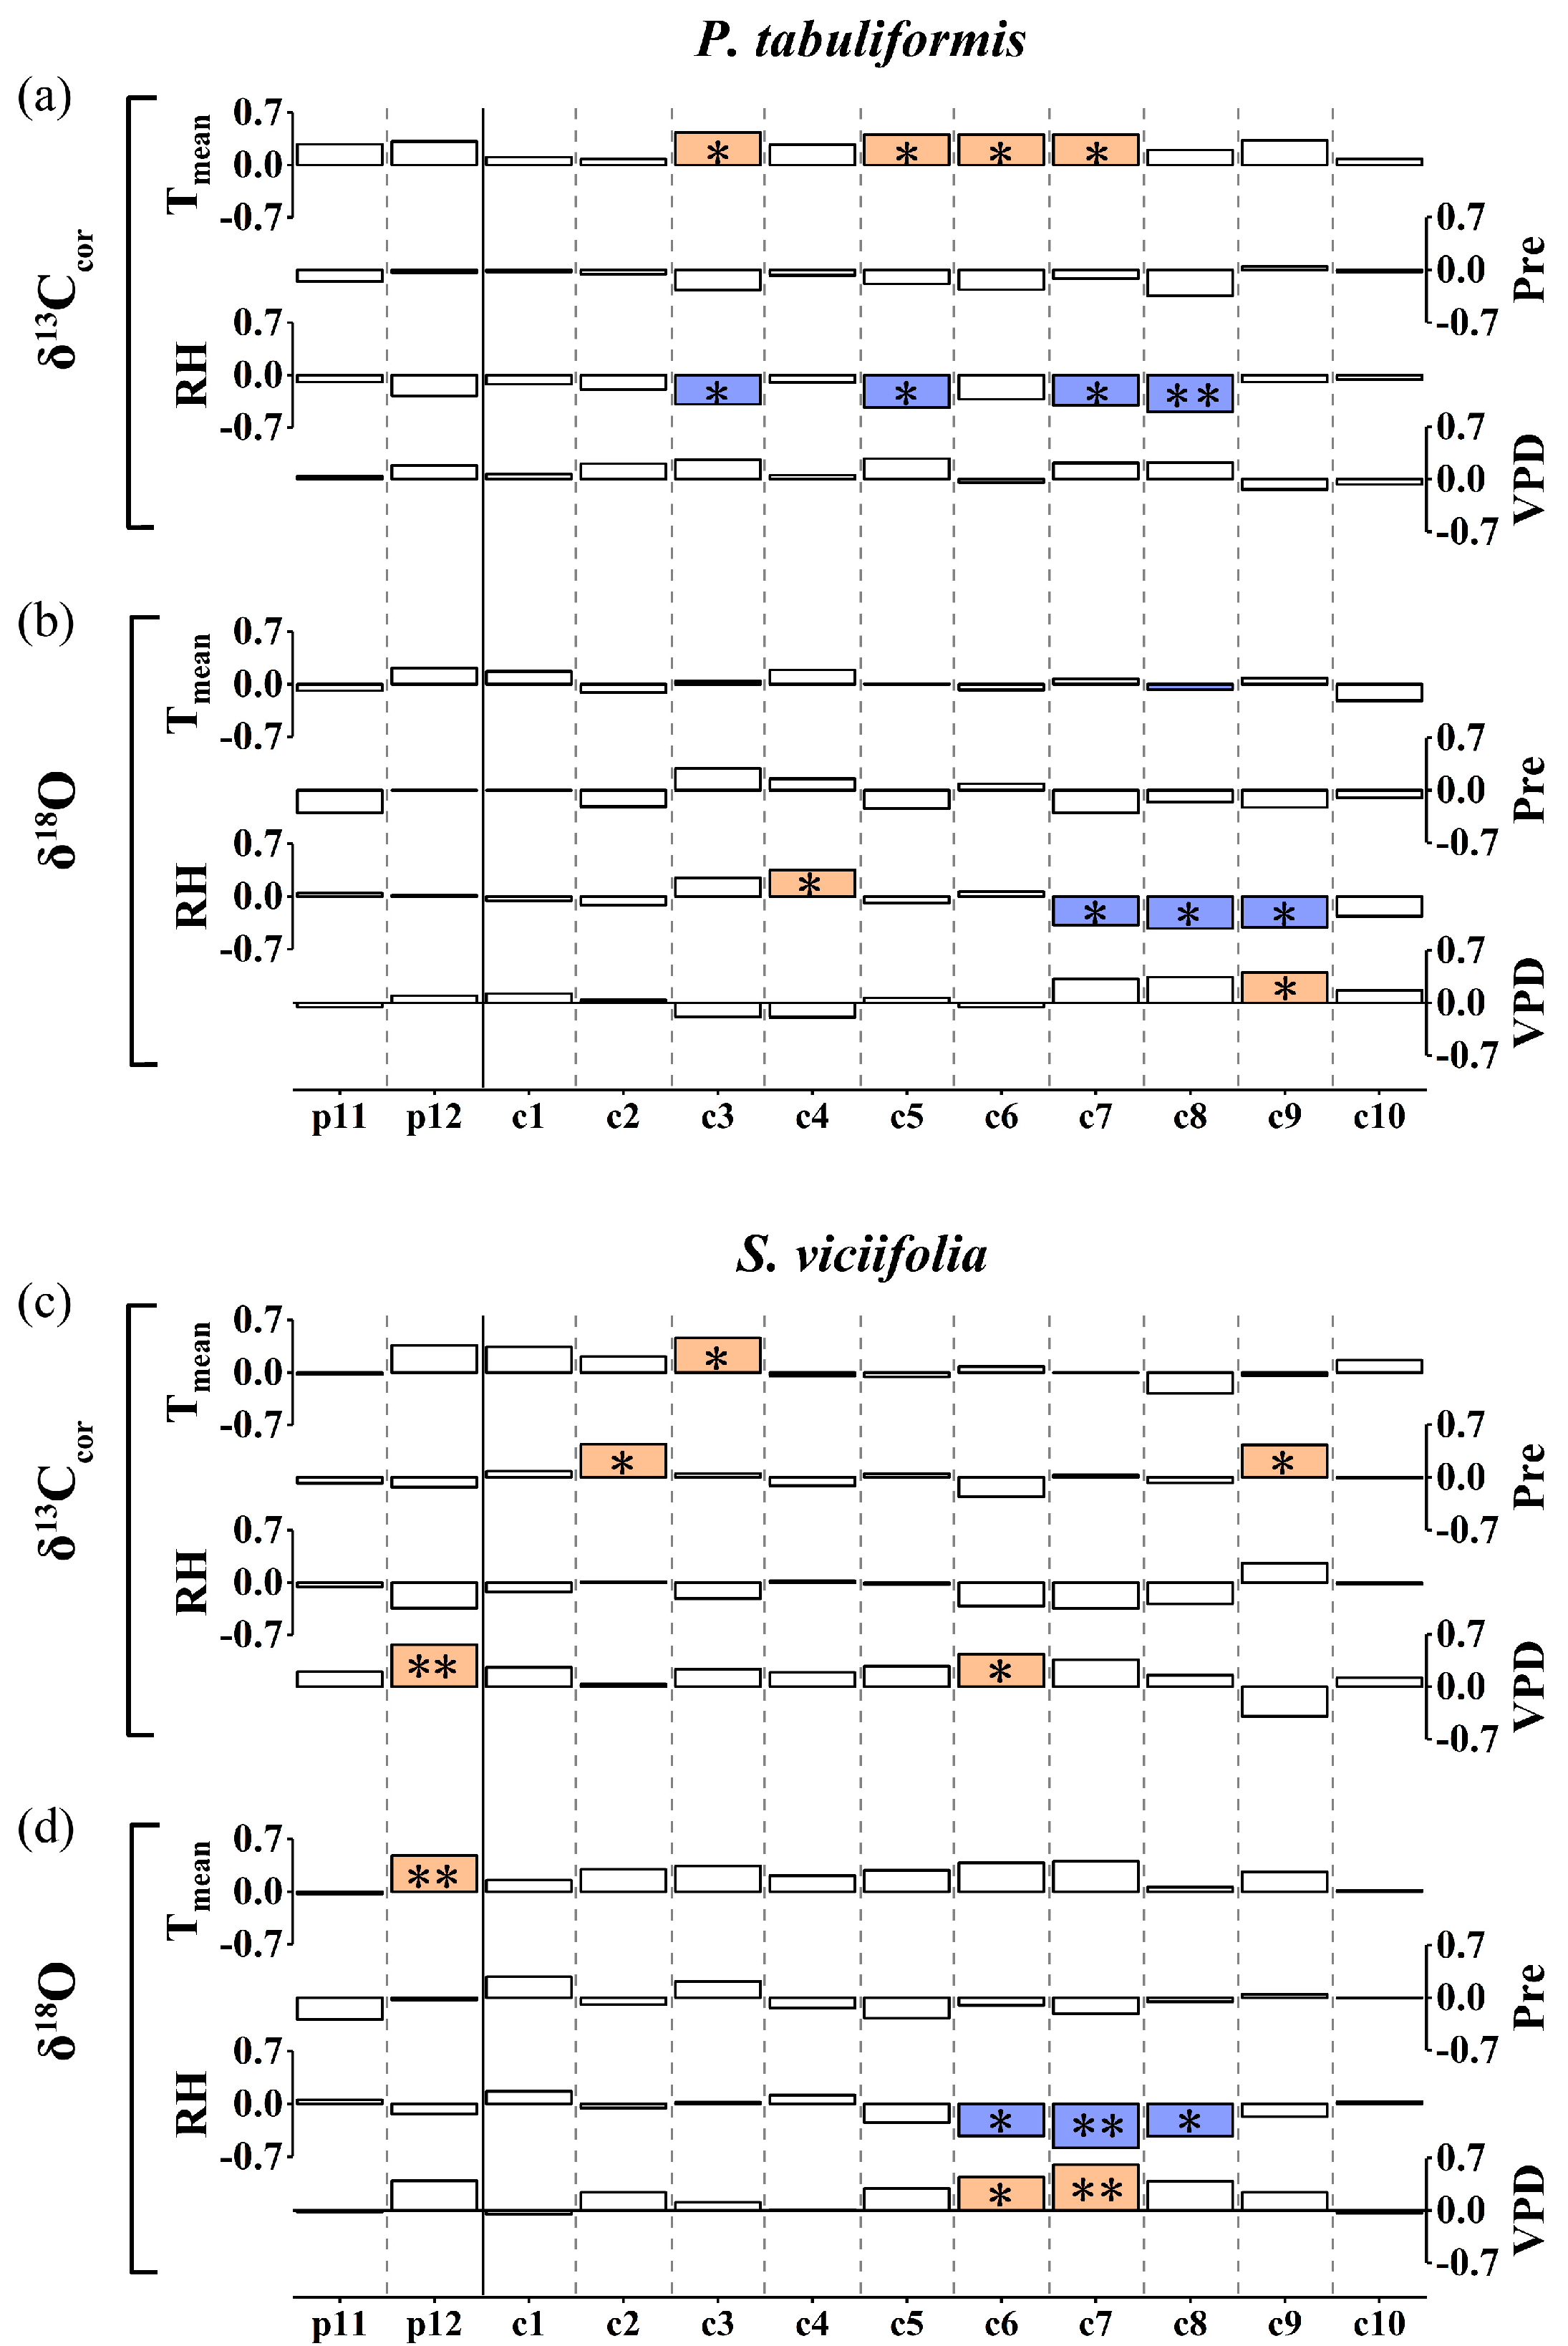
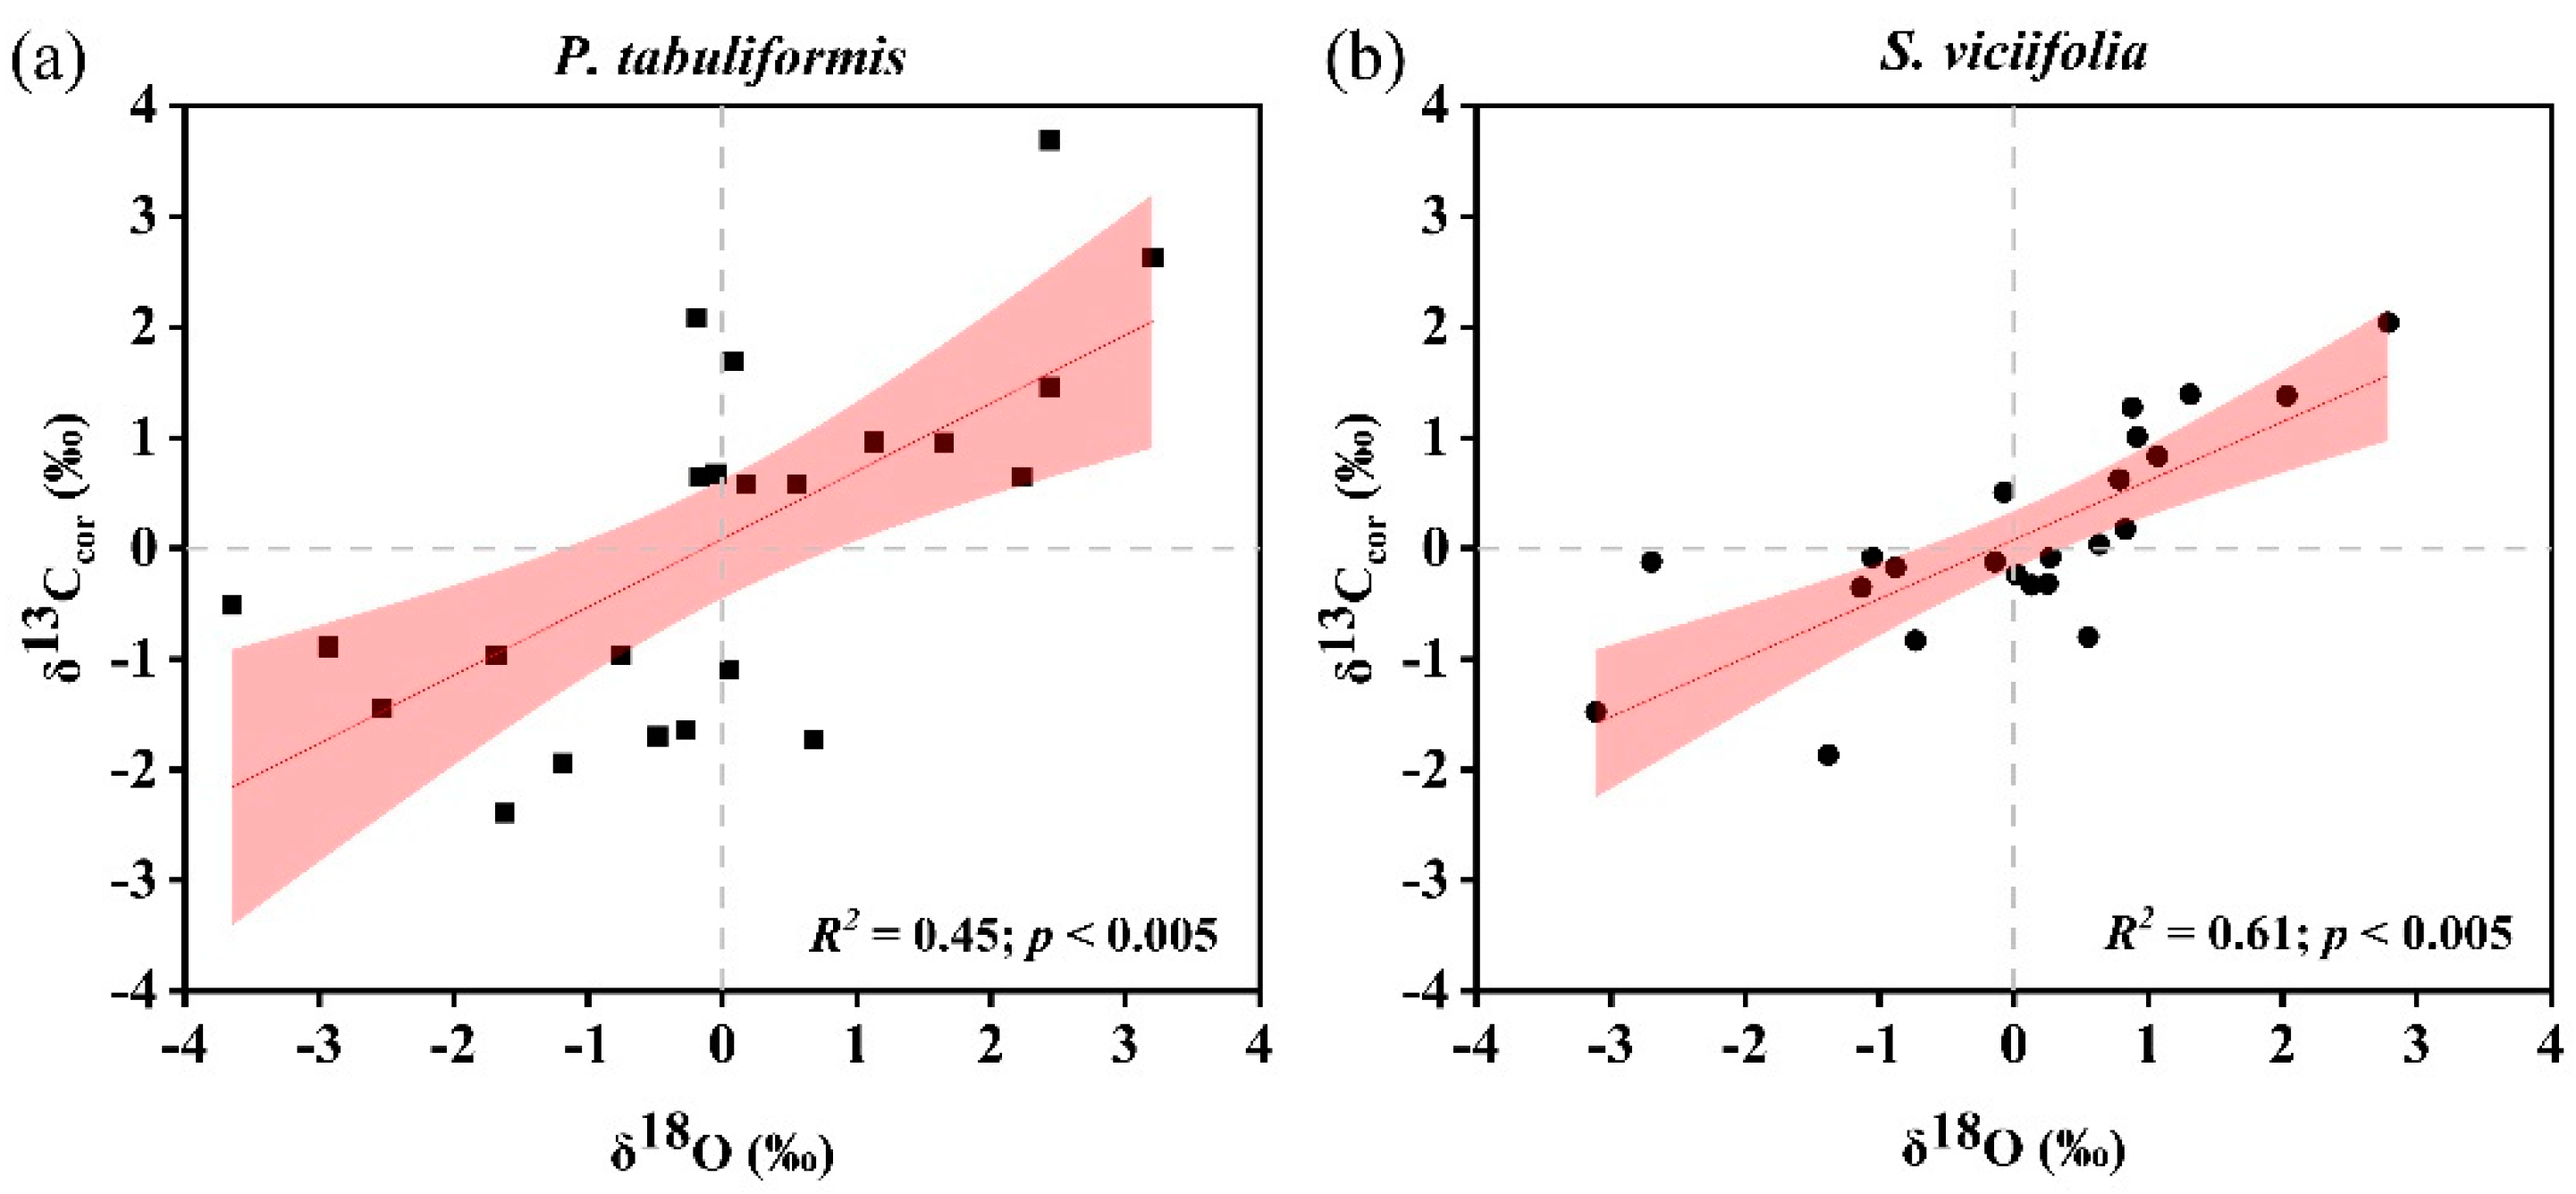
3.1. Characteristics and Climate Responses of δ13Ccor and δ18O

Table 1 summarizes the statistical characteristics of the δ13Ccor and δ18O series of P. tabuliformis and S. viciifolia during the common period from 1994 to 2017. The mean δ13Ccor value of the tree was lower than that of the shrub, while the mean δ18O value of the tree was higher than that of the shrub. Figure 3 shows the trends of the δ13Ccor and δ18O series of both species. The δ13Ccor series of P. tabuliformis showed an obvious increase (0.373‰ yr−1, p < 0.005, Table S1) in the Ds+ period, with a maximum value of −19.00‰ in 1999 (Figure 3). In the subsequent Ds− period, the series exhibited a nonsignificant decreasing trend (p > 0.05, Table S1). The δ13Ccor series of S. viciifolia appeared to increase, but the increase was not statistically significant (p > 0.05) throughout neither the Ds+ period nor the Ds− period (Figure 3; Table S1). The δ18O series of P. tabuliformis showed slightly but not significantly decreasing trends in both the Ds+ period and the Ds− period (Table S1). The δ18O series of S. viciifolia exhibited a nonsignificant increasing trend in the Ds+ period, while the series decreased significantly in the Ds− period (−0.117‰ yr−1, p < 0.05; Figure 3; Table S1).
The responses of δ13Ccor and δ18O to changes in the climatic parameters differed in signal strength between the two species (Figure 4). The δ13Ccor of P. tabuliformis was significantly and positively correlated with mean temperature in March and from May to July, while it was negatively correlated with RH (except in June with p > 0.05) (Figure 4a). For S. viciifolia, there were no dominant climate variables showing effects on δ13Ccor. In the growing season, precipitation in September and VPD in June exhibited significant and positive relationships with δ13Ccor of S. viciifolia (Figure 4c). δ18O of both species exhibited obvious relationships with moisture conditions rather than temperature (Figure 4b,d). δ18O of both species was significantly and negatively correlated with RH from July to August, while it exhibited no significant relationship (p > 0.05) with precipitation. Furthermore, δ18O was significantly and positively correlated with VPD in September for P. tabuliformis and with VPD from June to July for S. viciifolia.

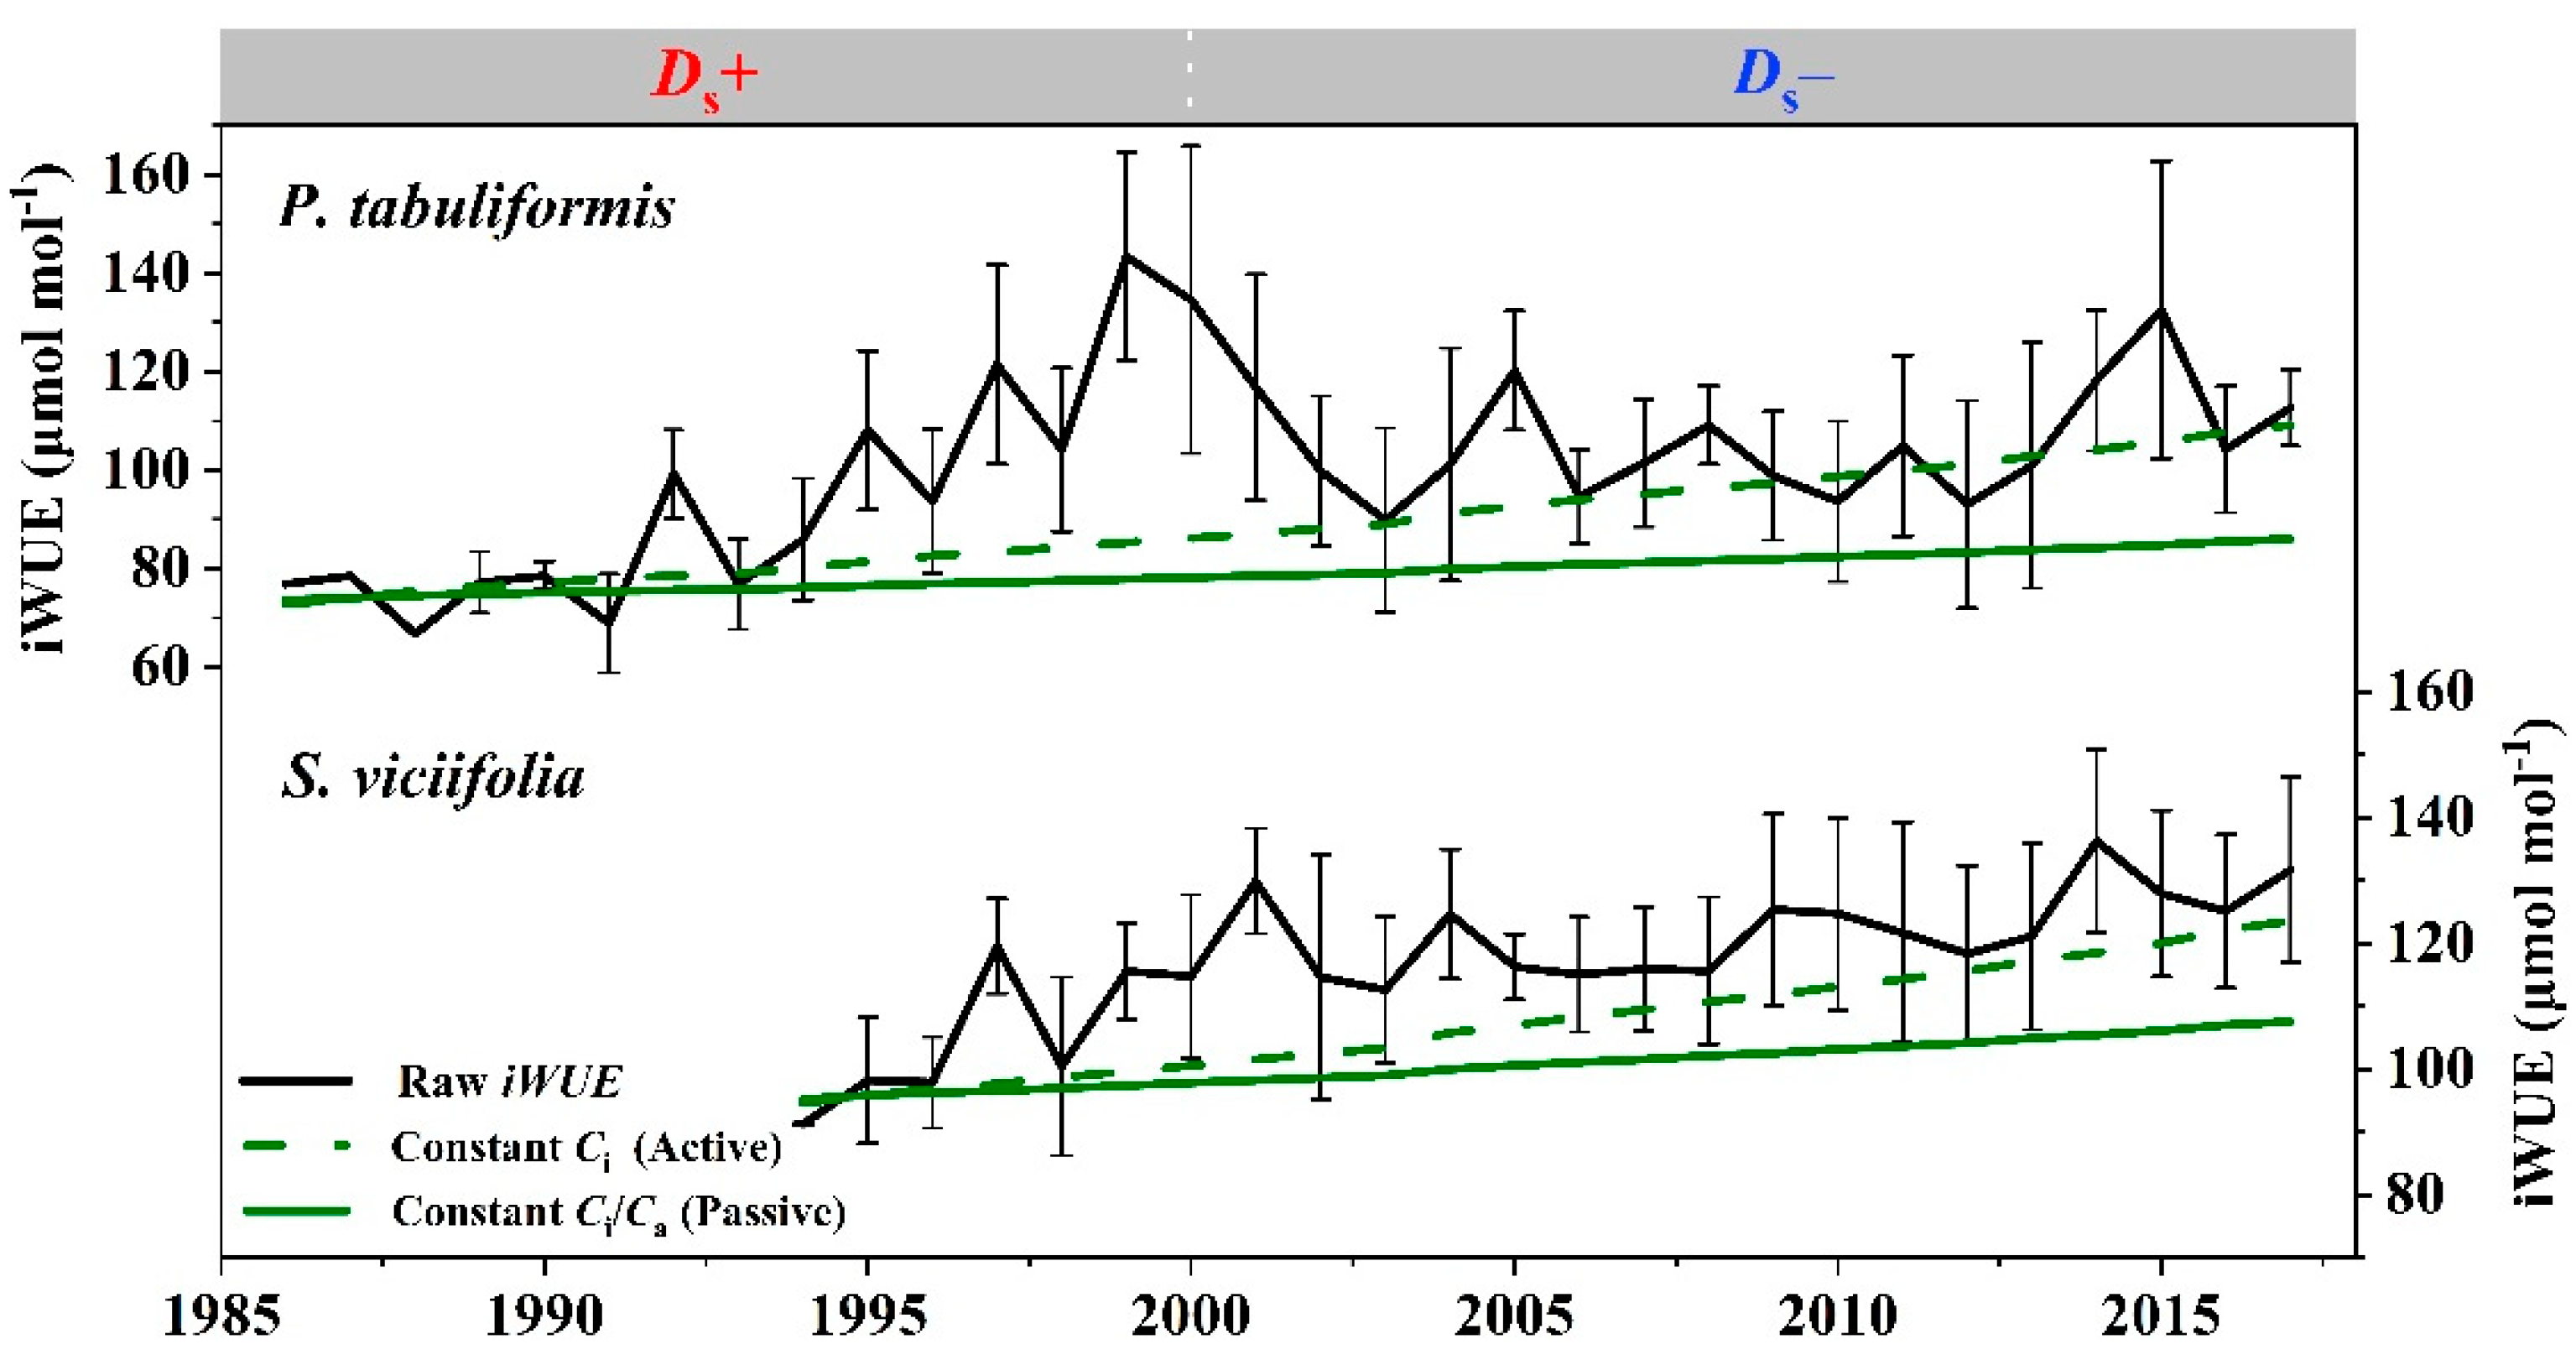
3.2. Trends of iWUE and Dual-Isotopes Relationships

The mean iWUE value of S. viciifolia was 9.7 μmol mol−1 higher than for P. tabuliformis during the common period from 1994 to 2017 (Table 1). The iWUE series of both species exhibited increasing trends, but at different rates during the study period (Figure 5). For P. tabuliformis, the iWUE series showed a significant and rapid increase in the Ds+ period (4.57 μmol mol−1 yr−1, p < 0.005, Table S1), and as the drought stress weakened, the iWUE series began to decrease until 2003 and then had a nonsignificant increase (Figure 5; Table S1). However, the iWUE series of S. viciifolia showed a nonsignificant increasing trend in the Ds+ period and then increased significantly at a rate of 1.28 μmol mol−1 yr−1 in the Ds− period (Figure 5; Table S1). Furthermore, the measured iWUE trends of both species were above the theoretical iWUE trend in the active gas exchange scenario: constant Ci (Figure 5). For P. tabuliformis, the difference between the theoretical iWUE in the constant Ci scenario and the measured iWUE gradually increased in the Ds+ period, while the measured iWUE approached the theoretical value in the Ds− period (Figure 5). For S. viciifolia, the measured iWUE trend was nearly in parallel with the theoretical iWUE in the constant Ci scenario during the whole investigated period (Figure 5).
Figure S2 shows the relationship between δ13Ccor and δ18O of both species either using the raw data or in the first-difference data. For P. tabuliformis, there was no significant relationship between δ13Ccor and δ18O in the Ds+ period, but a significant and positive relationship (r = 0.63; p < 0.01) in the Ds− period based on the raw data (Figure S2a). For S. viciifolia, δ13Ccor was significantly and positively correlated with δ18O in the raw data during both subperiods (Figure S2c). In the first-difference data (Figure S2b,d), we found significant and positive correlations between the two isotopes during both subperiods for both species (r = 0.74 and 0.92 in the Ds+ period and r = 0.56 and 0.70 in the Ds− period for P. tabuliformis and S. viciifolia, respectively). In order to compare the difference in dual-isotope relationships between species at the same sample size, we also calculated the correlations during the common period from 1994 to 2017. We found that the significant and positive relationships between δ13Ccor and δ18O of both species were shown both in the first-difference data (R2 = 0.45 and 0.61 for P. tabuliformis and S. viciifolia, respectively; Figure 6) and in the raw data (R2 = 0.50 and 0.29 for P. tabuliformis and S. viciifolia, respectively; Figure S3).

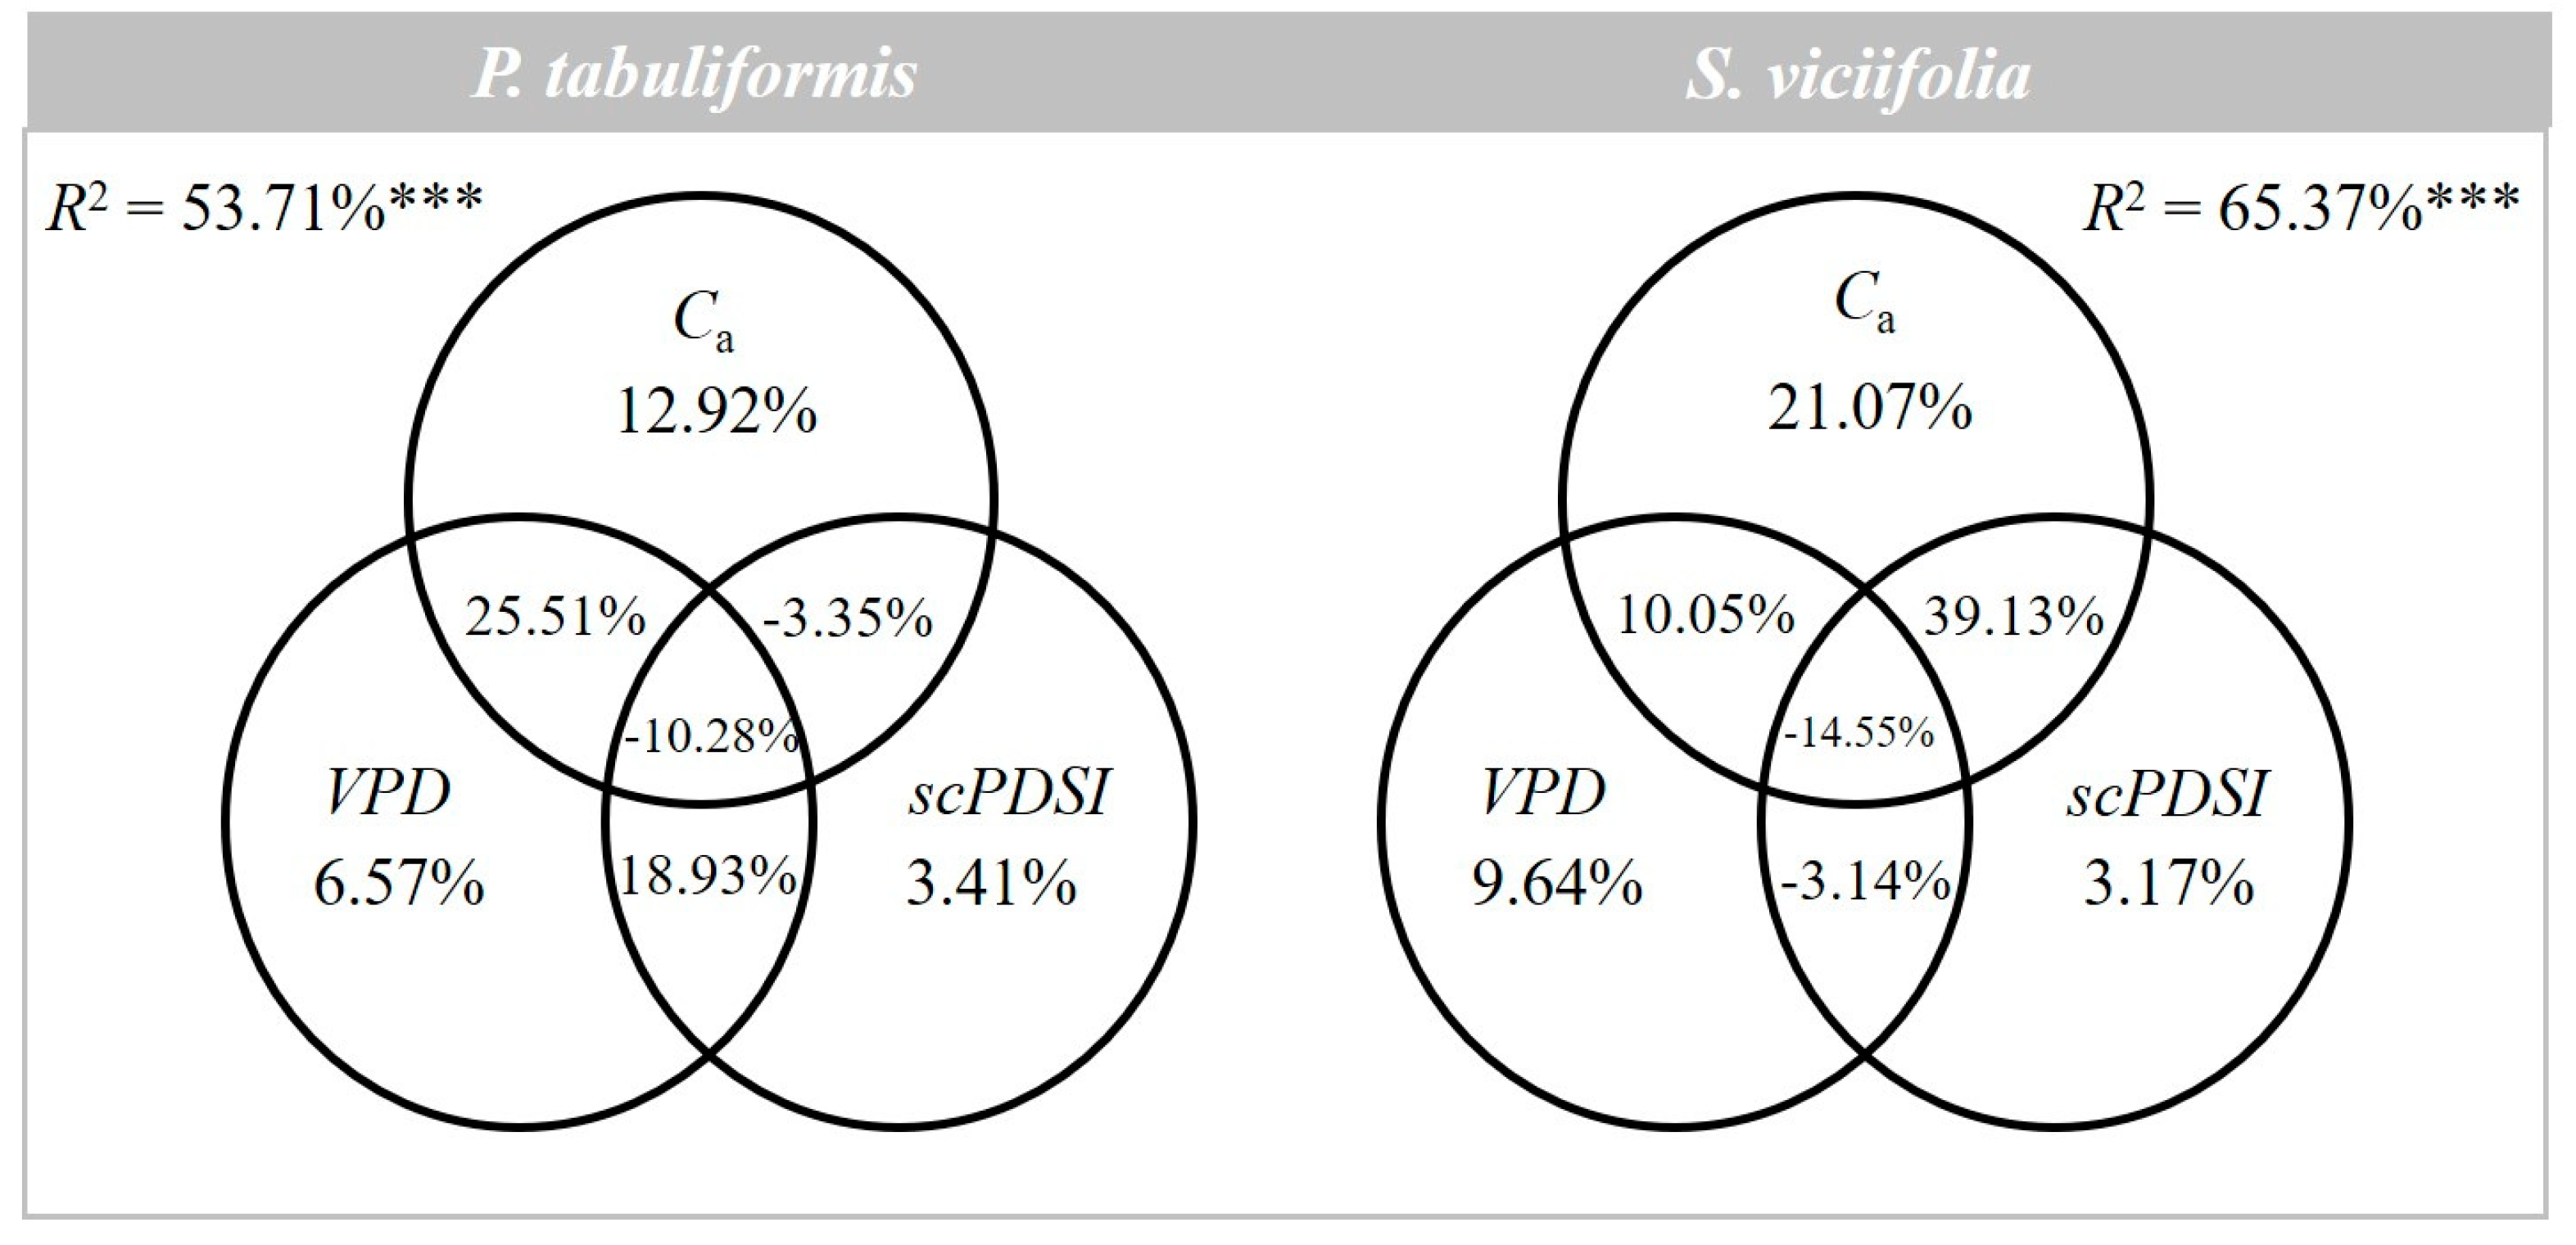
3.3. Contribution of CO2 and Drought to iWUE

In the commonality analysis, we calculated the pure and joint effects of Ca, VPD, and scPDSI on the iWUE of both species. The analysis explained a larger proportion of the iWUE variation of S. viciifolia than that of P. tabuliformis (R2 = 65.37% and 53.71%, respectively) (Figure 7). Among the seven components of the explained variance for P. tabuliformis, the combined effects of Ca and VPD accounted for 25.51% of the variance, followed by the combined effects of VPD and scPDSI (18.93%) during the period from 1986 to 2017. For S. viciifolia, the contribution of the combined effects of Ca and scPDSI was greatest (39.13%), followed by the pure effect of Ca (21.07%) during the period from 1994 to 2017.

4. Discussion

4.1. Climate Drivers of δ13Ccor and δ18O

Tree-ring δ13C records the balance between A and gs [16], and the fractionation that affects δ13C is influenced by plant physiology, environmental variables, or both simultaneously [15]. The significant relationships between tree-ring δ13C and RH, precipitation, and VPD revealed moisture conditions during the growing season, especially in the summer, were generally the main limiting factor for tree growth on the Loess Plateau [47] (Figure 4a,c). These results were in accordance with previous studies in other arid and semiarid regions in China [25,48,49]. In dry conditions, leaves will typically respond by decreasing gs to conserve water, and reservoirs of CO2 available for continued photosynthesis are reduced, which increases the gradient of Ci to Ca and leads to higher tree-ring δ13C values [15]. The significant relationship between tree-ring δ13C and temperature can be explained as high summer temperatures will reduce the Ci concentration if rates of photosynthesis are increased or rates of stomatal conductance are reduced, which weaken carbon fractionation and increase the δ13C value [50] (Figure 4a,c).
As suggested in an earlier report, the xylem δ18O reflects the mixing signal for source water δ18O and leaf water δ18O [51]. Our correlation analysis (Figure 4b,d) suggested that RH, rather than precipitation, controlled the tree-ring δ18O in both species, with the effect becoming significant about 1 month later for S. viciifolia, which suggested strong gs dominance of oxygen fractionation in the tree rings rather than water source variations during the growing season. RH strongly affects the leaf-to-air vapor pressure ratio, which is one of the factors that directly controls tree-ring δ18O; a high RH decreases evaporation, resulting in the dilution of leaf δ18O [52].

4.2. Stomatal Conductance Dominates the Regulation of iWUE

The higher iWUE value of S. viciifolia indicated an overall more conservative water-use strategy and higher drought tolerance than that of P. tabuliformis [27] (Table S1). The difference in water-use strategies between species is related to hydraulic architecture characteristics. For example, the thick cuticle and well-developed palisade tissue of S. viciifolia reduce its evaporation rate and preserve water [53], while the small tracheids and transverse tracheid walls of P. tabuliformis increase the resistance to water transport [54].
In this study, the measured iWUE trends of P. tabuliformis and S. viciifolia were beyond the predicted iWUE trends in the active response scenario (Figure 5). This pattern suggests the intercellular CO2 concentration of both species keeps constant, no matter how the atmospheric CO2 changes [44]. Moreover, the actual Ci derived from δ13Cplant supported the scenario (Figure S4). Except for the low value during the strong drought stress period from 1997 to 2001 (Ca: 363.8 to 368.5 ppm), the Ci concentration of P. tabuliformis stayed within the level of 221.2 ppm (Figure S4a). Similarly, the Ci concentration of S. viciifolia stayed within the level of 192.5 ppm (Figure S4b). This phenomenon is rare, and we found only one similar report about this phenomenon in spruce forests polluted by copper smelter emissions in Canada’s Abitibi region [41]. If this leaf gas exchange strategy continues, Ci/Ca will gradually decrease as atmospheric CO2 levels continue to rise, and the water-use efficiency of forests may increase greatly [43]. Conversely, maintaining a constant Ci/Ca with rising Ca is the commonest response in most species and environments [43]. The constant Ci/Ca scenario agrees with the least-cost optimality hypothesis [55], which is described as an approach in which “leaves minimize the summed unit costs of transpiration and carboxylation”, and this can be achieved by a synchronous decrease in both gs and A [56]. Our results could possibly be explained by the reduced gs that resulted from the combined effects of rising Ca and drought [57], which was demonstrated in subsequent dual-isotope conceptual models. The short study period may be another potential reason, because recent studies have shown that the iWUE patterns in the first two or three decades of isotope chronologies resemble the constant Ci scenario, and trees will change to the constant Ci/Ca scenario as they age [52,58]. Additionally, iWUE trends in our study were also potentially influenced by overestimated δ13Cplant due to juvenile effects, even though we removed the initial 5 years to avoid this potential bias.
Variations in the tree-ring δ13C were reflected by A or gs or both, while the tree-ring δ18O was mainly determined by the δ18O in the source water and the evaporative enrichment of 18O in the leaf water, the latter of which is predominantly controlled by gs [15,16]. If tree-ring δ13C and δ18O shared a common variability, variations in tree-ring δ18O should mainly result from changes in gs [18,19]. In the dual-isotope conceptual model, the significant and positive relationship between δ13Ccor and δ18O could be interpreted as domination of the regulation of iWUE by gs rather than by A [19] (Figure 6 and Figure S2). iWUE driven by stomatal closure was a common phenomenon in the water-limited regions where water saving would be prioritized over carbon gain [4]. Owing to potential juvenile effects, the dual-isotope relationship in the first-difference data was more reliable. We also found the coefficient of determination in the regression model for S. civiifolia (R2 = 0.61) was higher than that for P. tabuliformis (R2 = 0.45) when using the first-difference data (Figure 6). Moreover, the higher coefficient of determination indicated that S. viciifolia had greater stomatal control than P. tabuliformis [21] (Figure 6), which was in line with our initial hypothesis. Combined with the higher iWUE value, we suggest S. viciifolia will be more drought-tolerant than P. tabuliformis. Meanwhile, we should realize that species with relatively closed stomata are suggested to have less efficient carbon use with future warmer and drier climates [37,49] and may be at risk of carbon starvation [59]. Future research should be paired with measurements such as growth monitoring and physiology indicators (e.g., xylem embolism resistance and hydraulic conductivity). Previous studies suggested that Scheidegger’s model should be utilized with caution [60]. One of the major challenges for interpreting the model’s output is whether to assume constant δ18O in the source water and water vapor among investigation periods [20]. In our study, changes in cellulose δ18O were caused by variations in leaf water δ18O enrichment due to RH rather than precipitation (Figure 4b,d), and our study covered a small spatial scale with uniform topographic and meteorological conditions. On the other hand, we were aware that no gas exchange measurements were made in this study, and trees may utilize water in deep soil layer by extending their roots in an extreme drought year. Taken together, these factors suggest that our interpretation of the results need to be strengthened with further works.

4.3. The Contribution of CO2 and Drought to iWUE

Based on the commonality analysis, the main driver of the increased iWUE was the joint effect of Ca and VPD (25.51%) for P. tabuliformis, while it was the joint effect of Ca and scPDSI (39.13%) for S. civiifolia (Figure 7). Rising Ca improves iWUE by increasing A, reducing gs, or both, which describes the so-called CO2 fertilization effect [3]. Either increased atmospheric vapor deficit (e.g., VPD) or decreased soil moisture (e.g., scPDSI) causes partial stomatal closure and reductions in gs. Assuming leaf photosynthetic capacity does not instantly change, reduced gs leads to increased Ci/Ca ratios and thus increased iWUE [61]. This divergence was possibly caused by differences in plant functional types (e.g., root depth) between the tree and shrub. For instance, shallower root depth limits shrubs from acquiring deep stores of soil moisture, which may buffer the leaf-level responses of trees to fluctuations in aridity [62]. Drought-related limitations on tree growth such as dieback of branches or even whole-tree mortality are non-negligible risks to forest ecosystems, and increased iWUE can be a plant response that aims to promote survival and minimize the growth decrease caused by decreased water availability [20]. Recently, Xiao et al. [63] reported that in areas where shrub species are naturally distributed, populations gradually become concentrated in micro-geomorphic regions with better soil moisture conditions under a regional climate warming trend. Intensive vegetation restoration might lead to increased transpiration that can aggravate water shortages, and a dried soil layer has spread on the Loess Plateau [64]. Thus, we suggest that as Ca continually rises, researchers should focus more on the effects of soil drought than atmospheric drought on the water-use strategy of S. viciifolia.

5. Conclusions

We established tree-ring δ13C and δ18O chronologies for P. tabuliformis and S. viciifolia growing on the central Loess Plateau to investigate species-specific responses to atmospheric CO2 enrichment and drought stress. Summer RH controlled the fractionation of δ18O at our study site. The iWUE patterns of both species demonstrated a strongly active response to maintain constant Ci and were dominated by gs. The main driver of the increased iWUE was the pure and joint effects of Ca and VPD for the tree, while it was the pure and joint effects of Ca and scPDSI for the shrub. We suggest S. viciifolia will be more drought-tolerant due to its more conservative water-use strategy and greater stomatal control compared with P. tabuliformis.
The short period covered by our samples suggests that juvenile effects may have affected our δ13C, despite us having partly eliminated these effects. In future research, older trees that provide a longer time series should be studied. In addition, it is unclear whether iWUE stimulates tree growth, which is needed to complete ongoing research. Finally, additional research should also be carried out on the physiological mechanisms that underlie the biochemical phenomenon observed in this study.

Supplementary Materials

The following are available online at https://www.mdpi.com/article/10.3390/f13070986/s1, Figure S1: (a) The monthly mean temperature, precipitation and vapor-pressure deficit at the Yan’an meteorological station. Temporal variations of the annual (b) mean annual temperature, (c) total precipitation and (d) atmospheric carbon dioxide concentration and atmospheric stable carbon isotope ratio from 1986 to 2017, Figure S2: Scatter plots for the relationships between the tree-ring δ13Ccor and δ18O series during the period when drought stress strengthened and the period when drought stress weakened for Pinus tabuliformis and Sophora viciifolia either in raw data or in first-difference data, Figure S3: Scatter plots for the relationships between the tree-ring δ13Ccor and δ18O series during the common period from 1994 to 2017 for Pinus tabuliformis and Sophora viciifolia in the raw data, Figure S4: The trends of intercellular CO2 concentration based on tree-ring δ13Cplant of Pinus tabuliformis and Sophora viciifolia as atmospheric CO2 concentration rises, Table S1: Change rates of the δ13Ccor, δ18O and intrinsic water-use efficiency series of Pinus tabuliformis and Sophora viciifolia.

Author Contributions

Conceptualization, X.L. (Xiaohong Liu), X.Z., W.W. and G.X.; data curation, X.L. (Xiaoqin Li); formal analysis, W.G.; funding acquisition, X.L. (Xiaohong Liu); investigation, W.G. and X.L. (Xiaoqin Li); methodology, X.L. (Xiaohong Liu) and X.Z.; software, L.Z.; writing—original draft, W.G.; writing—review & editing, X.L. (Xiaohong Liu), X.Z., L.Z., W.W. and G.X. All authors have read and agreed to the published version of the manuscript.

Funding

This work was supported by the National Natural Science Foundation of China (Grant 41971104) and partially supported by Graduate Innovation Fund (1105010008) of the School of Geography and Tourism, Shaanxi Normal University. And the APC was funded by the National Natural Science Foundation of China (Grant 41971104).

Institutional Review Board Statement

Not applicable.

Informed Consent Statement

Not applicable.

Data Availability Statement

The datasets generated and/or analyzed during the study are available from the corresponding author upon reasonable request.

Acknowledgments

I am very grateful to the reviewers and editors for their suggestions on the revision of the manuscript.

Conflicts of Interest

The authors declare no conflict of interest.

References

  1. WMO. WMO Greenhouse Gas Bulletin (GHG Bulletin)—No.16: The State of Greenhouse Gases in the Atmosphere Based on Global Observations through 2019; World Meteorological Organization: Geneva, Switzerland, 2020. [Google Scholar]
  2. Dai, A.G. Increasing drought under global warming in observations and models. Nat. Clim. Chang. 2012, 3, 52–58. [Google Scholar] [CrossRef]
  3. Keenan, T.F.; Hollinger, D.Y.; Bohrer, G.; Dragoni, D.; Munger, J.W.; Schmid, H.P.; Richardson, A.D. Increase in forest water-use efficiency as atmospheric carbon dioxide concentrations rise. Nature 2013, 499, 324–327. [Google Scholar] [CrossRef] [PubMed]
  4. Mathias, J.M.; Thomas, R.B. Global tree intrinsic water use efficiency is enhanced by increased atmospheric CO2 and modulated by climate and plant functional types. Proc. Natl. Acad. Sci. USA 2021, 118, e2014286118. [Google Scholar] [CrossRef] [PubMed]
  5. Battipaglia, G.; Saurer, M.; Cherubini, P.; Calfapietra, C.; McCarthy, H.R.; Norby, R.J.; Cotrufo, M.F. Elevated CO2 increases tree-level intrinsic water use efficiency: Insights from carbon and oxygen isotope analyses in tree rings across three forest FACE sites. New Phytol. 2013, 197, 544–554. [Google Scholar] [CrossRef] [PubMed] [Green Version]
  6. Restaino, C.M.; Peterson, D.L.; Littell, J. Increased water deficit decreases Douglas fir growth throughout western US forests. Proc. Natl. Acad. Sci. USA 2016, 113, 9557–9562. [Google Scholar] [CrossRef] [Green Version]
  7. Zhou, S.; Williams, A.P.; Berg, A.M.; Cook, B.I.; Zhang, Y.; Hagemann, S.; Lorenz, R.; Seneviratne, S.I.; Gentine, P. Land-atmosphere feedbacks exacerbate concurrent soil drought and atmospheric aridity. Proc. Natl. Acad. Sci. USA 2019, 116, 18848–18853. [Google Scholar] [CrossRef] [Green Version]
  8. Keenan, T.F.; Prentice, C.; Canadell, J.G.; Williams, C.A.; Wang, H.; Raupach, M.; Collatz, G.J. Recent pause in the growth rate of atmospheric CO2 due to enhanced terrestrial carbon uptake. Nat. Commun. 2016, 7, 13428. [Google Scholar] [CrossRef] [Green Version]
  9. Li, C.J.; Fu, B.J.; Wang, S.; Stringer, L.C.; Wang, Y.P.; Li, Z.D.; Liu, Y.X.; Zhou, W.X. Drivers and impacts of changes in China’s drylands. Nat. Rev. Earth Environ. 2021, 2, 858–873. [Google Scholar] [CrossRef]
  10. Zheng, K.; Wei, J.Z.; Pei, J.Y.; Cheng, H.; Zhang, X.L.; Huang, F.Q.; Li, F.M.; Ye, J.S. Impacts of climate change and human activities on grassland vegetation variation in the Chinese Loess Plateau. Sci. Total Environ. 2019, 660, 236–244. [Google Scholar] [CrossRef]
  11. Chen, Y.P.; Wang, K.B.; Lin, Y.S.; Shi, W.Y.; Song, Y.; He, X.H. Balancing green and grain trade. Nat. Geosci. 2015, 8, 739–741. [Google Scholar] [CrossRef]
  12. Feng, X.M.; Fu, B.J.; Piao, S.L.; Wang, S.; Ciais, P.; Zeng, Z.Z.; Lü, Y.H.; Zeng, Y.; Li, Y.; Jiang, X.H.; et al. Revegetation in China’s Loess Plateau is approaching sustainable water resource limits. Nat. Clim. Chang. 2016, 6, 1019–1022. [Google Scholar] [CrossRef]
  13. Yao, Y.B.; Wang, R.Y.; Yang, J.H.; Yue, P.; Lu, D.R.; Xiao, G.J.; Wang, Y.; Liu, L.C. Changes in terrestrial surface dry and wet conditions on the Loess Plateau (China) during the last half century. J. Arid. Land. 2013, 5, 15–24. [Google Scholar] [CrossRef] [Green Version]
  14. Qiu, L.J.; Wu, Y.P.; Shi, Z.Y.; Yu, M.Z.; Zhao, F.B.; Guan, Y.H. Quantifying spatiotemporal variations in soil moisture driven by vegetation restoration on the Loess Plateau of China. J. Hydrol. 2021, 600, 126580. [Google Scholar] [CrossRef]
  15. McCarroll, D.; Loader, N.J. Stable isotopes in tree rings. Quat. Sci. Rev. 2004, 23, 771–801. [Google Scholar] [CrossRef]
  16. Farquhar, G.D.; O’Leary, M.H.; Berry, J.A. On the relationship between carbon isotope discrimination and the intercellular carbon dioxide concentration in leaves. Aust. J. Plant. Physiol. 1982, 9, 121–137. [Google Scholar] [CrossRef]
  17. Barbour, M.M.; Schurr, U.; Henry, B.K.; Wong, S.C.; Farquhar, G.D. Variation in the oxygen isotope ratio of phloem sap sucrose from castor bean. Evidence in support of the Péclet effect. Plant Physiol. 2000, 123, 671–680. [Google Scholar] [CrossRef] [Green Version]
  18. Barbour, M.M.; Roden, J.S.; Farquhar, G.D.; Ehleringer, J.R. Expressing leaf water and cellulose oxygen isotope ratios as enrichment above source water reveals evidence of a Péclet effect. Oecologia 2004, 138, 426–435. [Google Scholar] [CrossRef]
  19. Scheidegger, Y.; Saurer, M.; Bahn, M.; Siegwolf, R. Linking stable oxygen and carbon isotopes with stomatal conductance and photosynthetic capacity: A conceptual model. Oecologia 2000, 125, 350–357. [Google Scholar] [CrossRef]
  20. Gessler, A.; Cailleret, M.; Joseph, J.; Schönbeck, L.; Schaub, M.; Lehmann, M.; Treydte, K.; Rigling, A.; Timofeeva, G.; Saurer, M. Drought induced tree mortality—A tree-ring isotope based conceptual model to assess mechanisms and predispositions. New Phytol. 2018, 219, 485–490. [Google Scholar] [CrossRef]
  21. Rodriguez-Caton, M.; Andreu-Hayles, L.; Morales, M.S.; Daux, V.; Christie, D.A.; Coopman, R.E.; Alvarez, C.; Rao, M.P.; Aliste, D.; Flores, F.; et al. Different climate sensitivity for radial growth, but uniform for tree-ring stable isotopes along an aridity gradient in Polylepis tarapacana, the world’s highest elevation tree species. Tree Physiol. 2021, 41, 1353–1371. [Google Scholar] [CrossRef]
  22. Liu, Y.; Wang, L.; Li, Q.; Cai, Q.F.; Song, H.M.; Sun, C.F.; Liu, R.S.; Mei, R.C. Asian summer monsoon-related relative humidity recorded by tree ring δ18O during last 205 years. J. Geophys. Res. Atmos. 2019, 124, 9824–9838. [Google Scholar] [CrossRef]
  23. Wang, Y.; Liu, Y.; Li, Q.; Song, H.M.; Sun, C.F.; Fang, C.X. An Asian summer monsoon-related relative humidity record from tree-ring δ18O in Gansu Province, North China. Atmosphere 2020, 11, 984. [Google Scholar] [CrossRef]
  24. Liu, Y.; Ren, M.; Li, Q.; Song, H.M.; Liu, R.S. Tree-ring δ18O-based July–August relative humidity reconstruction on Mt. Shimen, China, for the last 400 years. Atmos. Res. 2020, 243, 105024. [Google Scholar] [CrossRef]
  25. Li, Q.; Nakatsuka, T.; Kawamura, K.; Liu, Y.; Song, H.M. Hydroclimate variability in the North China Plain and its link with El Niño-Southern Oscillation since 1784 A.D.: Insights from tree-ring cellulose δ18O. J. Geophys. Res. Atmos. 2011, 116, D22106. [Google Scholar] [CrossRef] [Green Version]
  26. Wang, L.; Liu, H.Y.; Leavitt, S.; Cressey, E.L.; Quine, T.A.; Shi, J.F.; Shi, S.Y. Tree-ring δ18O identifies similarity in timing but differences in depth of soil water uptake by trees in mesic and arid climates. Agric. For. Meteorol. 2021, 308, 108569. [Google Scholar] [CrossRef]
  27. Koretsune, S.; Fukuda, K.; Chang, Z.Y.; Shi, F.C.; Ishida, A. Effective rainfall seasons for interannual variation in δ13C and tree-ring width in early and late wood of Chinese pine and black locust on the Loess Plateau, China. J. For. Res. 2009, 14, 88–94. [Google Scholar] [CrossRef]
  28. Chen, M.; Zhang, X.; Li, M.; Zhang, J.J.; Cao, Y. Climate-growth pattern of Pinus tabulaeformis plantations and their resilience to drought events in the Loess Plateau. For. Ecol. Manag. 2021, 499, 119642. [Google Scholar] [CrossRef]
  29. Wang, J.; Lu, N.; Fu, B.J. Inter-comparison of stable isotope mixing models for determining plant water source partitioning. Sci. Total Environ. 2019, 666, 685–693. [Google Scholar] [CrossRef]
  30. Fan, J.; Wang, Q.J.; Jones, S.B.; Shao, M.A. Soil water depletion and recharge under different land cover in China’s Loess Plateau. Ecohydrology 2016, 9, 396–406. [Google Scholar] [CrossRef]
  31. Zeng, X.M.; Sun, S.W.; Wang, Y.Y.; Chang, Y.X.; Tao, X.X.; Hou, M.Y.; Wang, W.C.; Liu, X.H.; Zhang, L.N. Does resin tapping affect the tree-ring growth and climate sensitivity of the Chinese pine (Pinus tabuliformis) in the Loess Plateau, China? Dendrochronologia 2021, 65, 125800. [Google Scholar] [CrossRef]
  32. Campbell, G.S.; Norman, J.M. An Introduction to Environmental Biophysics; Springer: New York, NY, USA, 1977. [Google Scholar]
  33. Palmer, W.C. Weather Bureau Research Paper No. 45. In Meteorological Drought; US Department of Commerce: Washington, DC, USA, 1965. [Google Scholar]
  34. Cook, E.R.; Kairiukstis, L.A. Methods of Dendrochronology: Applications in the Environmental Sciences; Springer: New York, NY, USA, 1990. [Google Scholar]
  35. Holmes, R.L. Computer-assisted quality control in tree-ring dating and measurement. Tree-Ring Bull. 1983, 43, 69–78. [Google Scholar]
  36. Li, X.Q.; Zhang, L.N.; Zeng, X.M.; Wang, K.Y.; Wang, Y.B.; Lu, Q.Q.; Liu, X.H. Different response of conifer and shrubs radial growth to climate in the middle Loess Plateau. Acta Ecol. Sin. 2020, 40, 5685–5697. (In Chinese) [Google Scholar]
  37. Liu, X.H.; Zhao, L.J.; Voelker, S.; Xu, G.B.; Zeng, X.M.; Zhang, X.W.; Zhang, L.N.; Sun, W.Z.; Zhang, Q.L.; Wu, G.J.; et al. Warming and CO2 enrichment modified the ecophysiological responses of Dahurian larch and Mongolia pine during the past century in the permafrost of northeastern China. Tree Physiol. 2019, 39, 88–103. [Google Scholar] [CrossRef] [PubMed]
  38. Leavitt, S.W.; Danzer, S.R. Method for batch processing small wood samples to holocellulose for stable-carbon isotope analysis. Anal. Chem. 1993, 65, 87–89. [Google Scholar] [CrossRef]
  39. Evans, M.N.; Selmer, K.J.; Breeden, B.T.; Lopatka, A.S.; Plummer, R.E. Correction algorithm for online continuous flow δ13C and δ18O carbonate and cellulose stable isotope analyses. Geochem. Geophys. Geosystems 2016, 17, 3580–3588. [Google Scholar] [CrossRef] [Green Version]
  40. Ehleringer, J.R.; Hall, A.E.; Farquhar, G.D. Stable Isotopes and Plant Carbon-Water Relations; Academic Press: Cambridge, MA, USA, 1993. [Google Scholar]
  41. Savard, M.M.; Begin, C.; Marion, J. Response strategies of boreal spruce trees to anthropogenic changes in air quality and rising pCO2. Environ. Pollut. 2020, 261, 114209. [Google Scholar] [CrossRef]
  42. Barichivich, J.; Peylin, P.; Launois, T.; Daux, V.; Risi, C.; Jeong, J.; Luyssaert, S. A triple tree-ring constraint for tree growth and physiology in a global land surface model. Biogeosciences 2020, 18, 3781–3803. [Google Scholar] [CrossRef]
  43. Voelker, S.L.; Brooks, J.R.; Meinzer, F.C.; Anderson, R.; Bader, M.K.; Battipaglia, G.; Becklin, K.M.; Beerling, D.; Bert, D.; Betancourt, J.L.; et al. A dynamic leaf gas-exchange strategy is conserved in woody plants under changing ambient CO2: Evidence from carbon isotope discrimination in paleo and CO2 enrichment studies. Glob. Chang. Biol. 2016, 22, 889–902. [Google Scholar] [CrossRef]
  44. Saurer, M.; Siegwolf, R.T.W.; Schweingruber, F.H. Carbon isotope discrimination indicates improving water-use efficiency of trees in northern Eurasia over the last 100 years. Glob. Chang. Biol. 2004, 10, 2109–2120. [Google Scholar] [CrossRef]
  45. Seibold, D.R.; McPhee, R.D. Commonality analysis: A method for decomposing explained variance in multiple regression analyses. Hum. Commun. Res. 1979, 5, 355–365. [Google Scholar] [CrossRef]
  46. Ray-Mukherjee, J.; Nimon, K.; Mukherjee, S.; Morris, D.W.; Slotow, R.; Hamer, M. Using commonality analysis in multiple regressions: A tool to decompose regression effects in the face of multicollinearity. Methods Ecol. Evol. 2014, 5, 320–328. [Google Scholar] [CrossRef]
  47. Keyimu, M.; Li, Z.S.; Fu, B.J.; Chen, W.L.; Wei, J.S.; Jiao, L.; Gao, G.Y.; Lü, Y.H. Spatial differences in the radial growth responses of black locust (Robinia pseudoacacia Linn.) to climate on the Loess Plateau, China. Dendrochronologia 2021, 67, 125832. [Google Scholar] [CrossRef]
  48. Li, Q.; Liu, Y.; Nakatsuka, T.; Zhang, Q.B.; Ohnishi, K.; Sakai, A.; Kobayashi, O.; Pan, Y.N.; Song, H.M.; Liu, R.S.; et al. Oxygen stable isotopes of a network of shrubs and trees as high-resolution plaeoclimatic proxies in Northwestern China. Agric. For. Meteorol. 2020, 285, 107929. [Google Scholar] [CrossRef]
  49. Wang, W.Z.; McDowell, N.G.; Liu, X.H.; Xu, G.B.; Wu, G.J.; Zeng, X.M.; Wang, G.X. Contrasting growth responses of Qilian juniper (Sabina przewalskii) and Qinghai spruce (Picea crassifolia) to CO2 fertilization despite common water-use efficiency increases at the northeastern Qinghai–Tibetan plateau. Tree Physiol. 2020, 41, 992–1003. [Google Scholar] [CrossRef]
  50. Liu, Y.; Wang, Y.C.; Li, Q.; Song, H.M.; Linderholm, H.W.; Leavitt, S.W.; Wang, R.Y.; An, Z.S. Tree-ring stable carbon isotope-based May–July temperature reconstruction over Nanwutai, China, for the past century and its record of 20th century warming. Quat. Sci. Rev. 2014, 93, 67–76. [Google Scholar] [CrossRef]
  51. Treydte, K.; Boda, S.; Graf Pannatier, E.; Fonti, P.; Frank, D.; Ullrich, B.; Saurer, M.; Siegwolf, R.; Battipaglia, G.; Werner, W.; et al. Seasonal transfer of oxygen isotopes from precipitation and soil to the tree ring: Source water versus needle water enrichment. New Phytol. 2014, 202, 772–783. [Google Scholar] [CrossRef]
  52. Liu, X.H.; Wang, W.Z.; Xu, G.B.; Zeng, X.M.; Wu, G.J.; Zhang, X.W.; Qin, D.H. Tree growth and intrinsic water-use efficiency of inland riparian forests in northwestern China: Evaluation via δ13C and δ18O analysis of tree rings. Tree Physiol. 2014, 34, 966–980. [Google Scholar] [CrossRef] [Green Version]
  53. Li, F.L.; Bao, W.K.; Liu, J.H.; Wu, N. Eco-anatomical characteristics of Sophora davidii leaves along an elevation gradient in upper Minjiang River dry valley. Chin. J. Appl. Ecol. 2006, 17, 5–10. (In Chinese) [Google Scholar]
  54. Liu, X.Y.; Li, J.Y.; Zhai, H.B.; Zhu, G.B. Discussion on drought resistance through hydraulic architecture of trees. J. Beijing For. Univ. 2003, 25, 48–54. (In Chinese) [Google Scholar]
  55. Prentice, I.C.; Dong, N.; Gleason, S.M.; Maire, V.; Wright, I.J. Balancing the costs of carbon gain and water transport: Testing a new theoretical framework for plant functional ecology. Ecol. Lett. 2014, 17, 82–91. [Google Scholar] [CrossRef]
  56. Wang, W.Z.; Liu, X.H.; An, W.L.; Xu, G.B.; Zeng, X.M. Increased intrinsic water-use efficiency during a period with persistent decreased tree radial growth in northwestern China: Causes and implications. For. Ecol. Manag. 2012, 275, 14–22. [Google Scholar] [CrossRef]
  57. Brienen, R.J.W.; Wanek, W.; Hietz, P. Stable carbon isotopes in tree rings indicate improved water use efficiency and drought responses of a tropical dry forest tree species. Trees 2010, 25, 103–113. [Google Scholar] [CrossRef] [Green Version]
  58. Huang, R.; Zhu, H.F.; Liu, X.H.; Liang, E.Y.; Grießinger, J.; Wu, G.J.; Li, X.X.; Bräuning, A. Does increasing intrinsic water use efficiency (iWUE) stimulate tree growth at natural alpine timberline on the southeastern Tibetan Plateau? Glob. Planet. Chang. 2017, 148, 217–226. [Google Scholar] [CrossRef]
  59. McDowell, N.; Pockman, W.T.; Allen, C.D.; Breshears, D.D.; Cobb, N.; Kolb, T.; Plaut, J.; Sperry, J.; West, A.; Williams, D.G.; et al. Mechanisms of plant survival and mortality during drought: Why do some plants survive while others succumb to drought? New Phytol. 2008, 178, 719–739. [Google Scholar] [CrossRef] [PubMed]
  60. Roden, J.; Siegwolf, R. Is the dual-isotope conceptual model fully operational? Tree Physiol. 2012, 32, 1179–1182. [Google Scholar] [CrossRef]
  61. Driscoll, A.W.; Bitter, N.Q.; Sandquist, D.R.; Ehleringer, J.R. Multidecadal records of intrinsic water-use efficiency in the desert shrub Encelia farinosa reveal strong responses to climate change. Proc. Natl. Acad. Sci. USA 2020, 117, 18161–18168. [Google Scholar] [CrossRef]
  62. Kannenberg, S.A.; Driscoll, A.W.; Szejner, P.; Anderegg, W.R.L.; Ehleringer, J.R. Rapid increases in shrubland and forest intrinsic water-use efficiency during an ongoing megadrought. Proc. Natl. Acad. Sci. USA 2021, 118, e2118052118. [Google Scholar] [CrossRef]
  63. Xiao, S.C.; Ding, A.J.; Tian, Q.Y.; Han, C.; Peng, X.M. Site- and species-specific climatic responses of two co-occurring shrubs in the temperate Alxa Desert Plateau, northwest China. Sci. Total Environ. 2019, 667, 77–85. [Google Scholar] [CrossRef]
  64. Wang, Y.Q.; Shao, M.A.; Zhu, Y.J.; Liu, Z.P. Impacts of land use and plant characteristics on dried soil layers in different climatic regions on the Loess Plateau of China. Agric. For. Meteorol. 2011, 151, 437–448. [Google Scholar] [CrossRef]
Figure 1. Locations of the sampling site, the nearest meteorological station, and the four closest self-calibrated Palmer drought severity index (scPDSI) grid points. The insert map in upper-left corner provides the location of study region (red rectangle) on the Loess Plateau. The dashed contours represent the total annual precipitation in the study region from 2000 to 2013.
Forests 13 00986 g001
Figure 2. Temporal variations in the annual mean (a) self-calibrated Palmer drought severity index (scPDSI) and (b) vapor-pressure deficit (VPD) from 1986 to 2017. We divided the entire period into two subperiods based on the change in drought trends that occurred in 2000. The trends and linear regression models for scPDSI and VPD in the two subperiods are also provided. The solid and dashed lines represent significant and nonsignificant trends, respectively.
Forests 13 00986 g002
Figure 3. Tree-ring δ13Ccor (upper panel) and δ18O (lower panel) series for Pinus tabuliformis from 1986 to 2017 and for Sophora viciifolia from 1994 to 2017. The shaded area represents the range of isotopic values calculated from the individual tree.
Forests 13 00986 g003
Figure 4. Correlations (Pearson’s r) between tree-ring δ13Ccor (a,c) and δ18O (b,d) and the monthly local climate variables from the previous November (p11) to the current October (c10) for Pinus tabuliformis (a,b) and Sophora viciifolia (c,d). The significant correlations are shown in light orange (positive) and light purple (negative). *, p < 0.05; **, p < 0.01. Note: Tmean = mean monthly temperature; Pre = total monthly precipitation; RH = monthly relative humidity; VPD = monthly vapor pressure deficit. On the x-axis, p represents the previous year and c represents the current year.
Forests 13 00986 g004
Figure 5. Temporal trends for the intrinsic water-use efficiency (iWUE, black line) based on tree-ring δ13Cplant data from Pinus tabuliformis (top) and Sophora viciifolia (bottom). The green lines represent derived iWUE trends for the active response scenario, constant Ci (dash line), and the passive response scenario, constant Ci/Ca (straight line). Error bars are 1 standard deviation (SD). Ds+ = the period when drought stress strengthened; Ds− = the period when drought stress weakened.
Forests 13 00986 g005
Figure 6. Scatter plots for the relationships between the tree-ring δ13Ccor and δ18O series during the common period from 1994 to 2017 for (a) Pinus tabuliformis and (b) Sophora viciifolia using the first-difference data. The coefficient of determination (R2) in the regression model is provided. The red shaded area indicates the 95% confidence interval.
Forests 13 00986 g006
Figure 7. Proportions of the variation of intrinsic water-use efficiency (iWUE) explained by the commonality analysis for Pinus tabuliformis from 1986 to 2017 (left) and Sophora viciifolia from 1994 to 2017 (right). The commonality analysis results include seven fractions of explained variances for the response variables: the pure effect of atmospheric CO2 (Ca), pure effect of the vapor-pressure deficit (VPD), pure effect of the self-calibrated Palmer drought severity index (scPDSI), and the joint effects of two or more of the three factors. The percentage values represent the proportion of the iWUE variance explained by each fraction. ***: p < 0.005.
Forests 13 00986 g007
Table 1. Statistical characteristics for the δ13Ccor, δ18O, and intrinsic water-use efficiency (iWUE) series of Pinus tabulifomis and Sophora viciifolia during the common period from 1994 to 2017. SD represents the standard deviation. Values of a parameter followed by different letter differed significantly (p < 0.05) based on independent samples Student’s t tests during the common period.
SpeciesIndexMean SD
P. tabuliformisδ13Ccor−22.8 (‰) b1.4 (‰)
δ18O30.8 (‰) a1.4 (‰)
iWUE107.6 (μmol mol−1) b14.8 (μmol mol−1)
S. viciifoliaδ13Ccor−21.9 (‰) a0.8 (‰)
δ18O29.6 (‰) b1.2 (‰)
iWUE117.3 (μmol mol−1) a11.2 (μmol mol−1)
Publisher’s Note: MDPI stays neutral with regard to jurisdictional claims in published maps and institutional affiliations.

