Article

(Re)Designing Urban Parks to Maximize Urban Heat Island Mitigation by Natural Means

by
Victor L. Barradas
1,*,
Jennifer A. Miranda
2,
Manuel Esperón-Rodríguez
3 and
Monica Ballinas
4
1
Laboratorio Interacción Planta-Atmósfera, Instituto de Ecología, Universidad Nacional Autónoma de México, Mexico City 04510, Mexico
2
Departamento de Arquitectura del Paisaje, Facultad de Arquitectura, Universidad Nacional Autónoma de México, Mexico City 04510, Mexico
3
Hawkesbury Institute for the Environment, Western Sydney University, Richmond, NSW 2753, Australia
4
Laboratorio de Entornos Sostenibles, Facultad de Arquitectura, Universidad Nacional Autónoma de México, Mexico City 04510, Mexico
*
Author to whom correspondence should be addressed.
Forests 2022, 13(7), 1143; https://doi.org/10.3390/f13071143
Submission received: 29 June 2022 / Revised: 12 July 2022 / Accepted: 17 July 2022 / Published: 20 July 2022
(This article belongs to the Special Issue Urban Forests and Landscape Ecology—Series II)

Abstract

:
Urban trees play a key role in mitigating urban heat by cooling the local environment. However, the cooling benefit that trees can provide is influenced by differences in species traits and site-specific environmental conditions. Fifteen dominant urban tree species in parks from Mexico City were selected considering physiological traits (i.e., transpiration and stomatal conductance) and aesthetic and morphological characteristics. Species’ physiological performance was measured to explore the potential of trees to reduce urban heat load. Data were collected over a 4-week period in the months of April and May 2020, the warmest and driest months of the year in Mexico City. We used the Thermal UrbaN Environment Energy (TUNEE) balance model to calculate the cooling benefit of each species and the number of individuals necessary to reduce local air temperature. The highest midday transpiration was registered for Liquidambar styraciflua L. (0.0357 g m−2 s−1) and the lowest for Buddleja cordata H.B.K (0.0089 g m−2 s−1), representing an energy consumption and cooling potential of 87.13 and 21.69 J m−2 s−1, respectively. Similarly, the highest stomatal conductance was recorded for L. styraciflua., whereas the lowest was recorded for B. cordata. Based on the species transpiration rates and aesthetic characteristics, we developed a proposal and outline for a 50 × 50 m urban park (i.e., park community) consisting of six species with 19 individuals, and according to the TUNEE model, the proposed arrangement can reduce air temperature up to 5.3 °C. Our results can help urban planners to (re)design urban parks to mitigate urban heat while increasing urban tree diversity in parks.

1. Introduction

Urbanization, as a radical transformation of the natural environment, creates many distinct effects in the built-up area; one of them is the urban heat island (UHI) effect. UHI occurs when the air temperature is higher in the urban area than in its rural surroundings e.g., [1,2]. This difference in temperature in cities is caused by the redistribution of energy from solar radiation due to extreme changes in land use, causing an alteration in the energy balance [1]. This is partially due to the drastic reduction of the latent heat flux (QE) caused by impervious surfaces (e.g., asphalt and concrete), reduced evaporation and the number of green areas, and increases in the sensible heat flux (QH), which contributes to the air temperature increase [1].
As a nature-based solution, urban green spaces (i.e., green areas, such as urban parks and forests, green belts, and components such as street trees and water infrastructure in urban contexts [3]) provide multiple environmental services, such as mitigation of the UHI, reduction of air temperature, air and water purification, wind and noise filtering, and microclimate stabilization [4]. Therefore, these green spaces are crucial to improving urban livability, and thereby the well-being of city dwellers [5,6]. These green spaces also provide a connection with nature and social and psychological services. Recent research shows that green spaces can also aid crime reduction [7,8,9].
Urban park design, however, is usually planned from an economic perspective [10] or exploring social (e.g., population lifestyle and values) and spatial (e.g., patterns of urban open space) attributes [11]. Urban park design can also be directed to achieve specific goals, such as heat mitigation by using, for example, urban trees to mitigate UHI. However, research assessing the effect of urban tree species on reducing urban heat is site-specific, e.g., [12,13,14], or has explored relationships between temperature and vegetation using satellite images, e.g., [15,16,17], which may miss information on individual tree species performance and thus limits its ability to inform species selection.
Urban trees decrease air temperature through transpiration [18,19]. Transpiration (E) is the process of water movement through a plant and its evaporation from aerial parts, such as leaves, stems, and flowers [20]. This process is conducted through stomata, which are pores found in the epidermis of leaves, stems, and other organs that are used to control gas exchange, and it is measured through the stomatal conductance [21]. Therefore, using species with high transpiration in parks and gardens can help reduce the UHI effect and thermal pollution, while promoting optimal environmental thermal comfort [19,22].
The quantification of E is also important for the management of urban forests because E is related to the amount of irrigation needed for an urban tree to survive and perform well in the urban context. Plants exchange near 95% of the absorbed water by E, and 5% or less is used in other physiological mechanisms (e.g., photosynthesis) [23]. Urban park design, therefore, requires information on species’ physiological responses to environmental conditions where they are planted and growing to identify urban tree species with high E. For efficient urban park design, it is required to define the best environmental conditions needed by trees and the optimal conditions for landscape and urban planning (e.g., achieving additional benefits such as enhanced biodiversity). A recently developed approach to assess these conditions is the Thermal UrbaN Environment Energy (TUNEE) balance model, which calculates the cooling benefit that different tree species can produce and the number of individuals of each species necessary to reduce local air temperature [19].
The predicted increases in temperature by the end of the century represent a threat to human populations [24]. Furthermore, the UHI can exacerbate heat waves; therefore, mitigating UHI is crucial since rising temperatures can negatively affect human thermal comfort, which can alter productivity, increase energy consumption using air conditioning systems, and cause health problems and even increase the risk of mortality [25,26,27]. Here, we used Mexico City as a case study. The UHI intensity in Mexico City can be 6 to 7 °C warmer during nighttime; however, it can also occur during daytime with intensities of up to 10 °C [28]. Further, the electricity consumption in Mexico City in 1996, for example, was 28.4 GW h to the domestic sector, of which 5.69 GW h (20%) was used to cool down inside buildings (e.g., air conditioning, evaporative cooling, fans), while 8.52 GW h was used in commercial and service centers in the metropolitan area [29]. The aim of this work was to propose an approach to (re)design urban parks to mitigate the UHI effect by proposing a tree community that, through its high transpiration rate, can more effectively reduce local air temperature, with a clear direction towards more sustainable, livable cities.

2. Materials and Methods
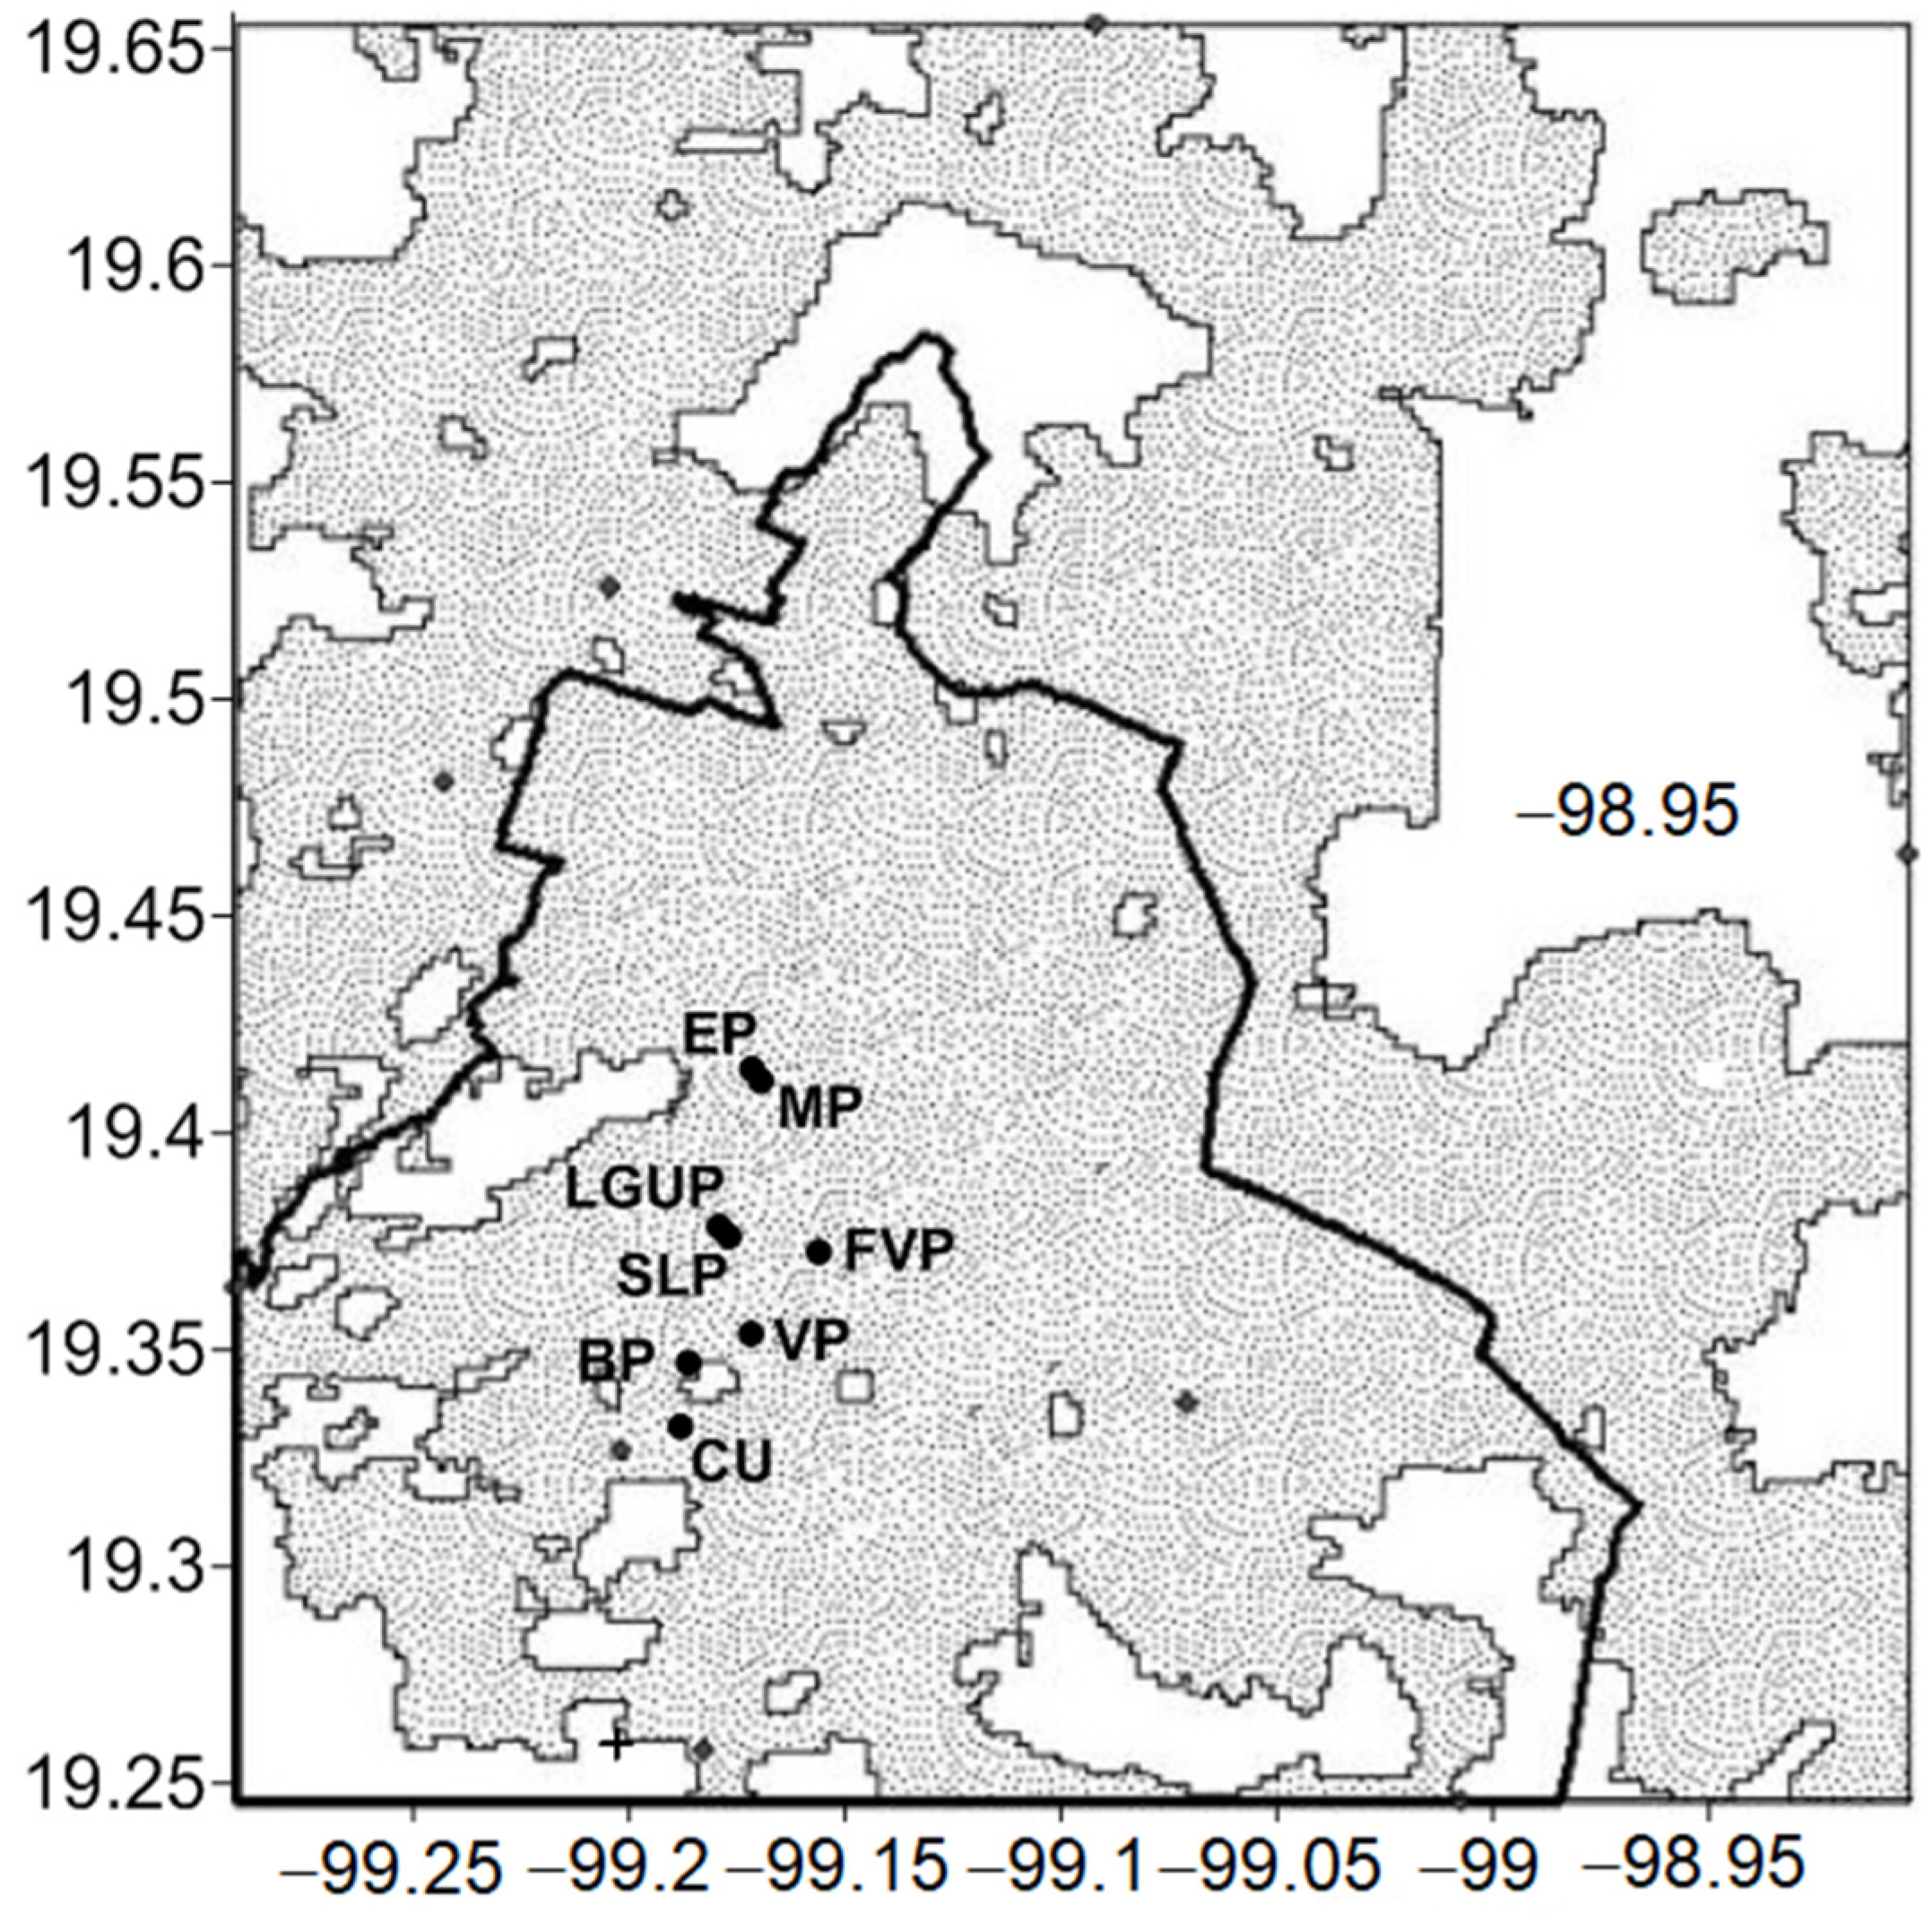
2.1. Study Area

The Metropolitan Area of Mexico City (MAMC) (19°25′ N, 99°10′ W) is located in an inland-elevated valley at an altitude of ca. 2250 m asl in central Mexico. Climate is highland tropical, with a well-defined rainy season (May–October). Mean annual precipitation (mean of 30 years; 1981–2010) is 600 mm, and almost 89% occurs during the rainy season [30]. Winds are light and predominantly from the northeast. Extreme maximum and minimum temperatures are registered in April and May (30.6 °C) and January and December (0.6 °C), respectively; mean annual temperature is 14.6 °C [31].
The urban area is extensive (~1200 km2) and heavily developed. As a result, there are urban effects on air quality and climate [32,33], with a marked UHI effect [28,29,30,31,32,33,34]. UHI not only occurs at night but also during daytime, with differences of up to 10 °C (TU-R) warmer compared to surrounding nonurban areas [19,28]. By the end of the dry season, the maximum daily air temperature can reach up to 33 °C [28].
We selected eight urban green areas (seven parks) within the MAMC to collect our data: (1) Luis G. Urbina Park (LGUP); (2) Francisco Villa Park (FVP); (3) San Lorenzo Park (SLP); (4) España Park (EP); (5) Mexico Park (MP); (6) Bombilla Park (BP); (7) Los Viveros Park (LVP); and (8) green areas from Ciudad Universitaria, UNAM (CU) (Figure 1). Urban vegetation in public areas is administered by the municipality and is not irrigated systematically.

2.2. Species Selection

Fifteen dominant urban tree species were selected based on their presence and abundance in eight urban green areas from Mexico City: Acacia longifolia (Andrews) Willd, Acer negundo L, Alnus acuminata Kunth, Buddleja cordata H.B.K, Celtis occidentalis L., Ficus benjamina L, Fraxinus uhdei (Wenz.) Lingelsh, Lagerstroemia indica L., Ligustrum lucidum W.T. Aiton, Liquidambar styraciflua L., Populus alba L., Populus deltoides W.Bartram ex Marshall, Quercus rugosa Neé, Robinia pseudoacacia L., and Ulmus parvifolia Jacq. Species selection included 11 natives and 4 exotics, and 8 deciduous and 7 evergreen species. Diameter at standard height (DSH), height (H), and crown diameter (CD) varied across species, with F. benjamina (DSH and CD) and F. uhdei (H) presenting the highest values, whereas B. cordata had the lowest values for all three metrics (DSH, H, and CD) (Table 1).
For all 15 species, we collected global occurrence records from the Global Biodiversity Information Facility (GBIF; 1.1.1.2, accessed on 23 May 2022, www.gbif.org; https://doi.org/10.15468/dl.f9ws9k) including records from their native and exotic ranges. Climate data were extracted from each species record aiming to capture species’ realized climate niches. Then, we estimated mean values for mean annual temperature (MAT, °C), annual precipitation (AP, mm), the maximum temperature of the warmest month (MTWM, °C) and precipitation of the driest quarter (PDQ, mm) for each species to determine their climate of origin (Supplemental Table S1). Climate data (baseline data representative of 1970–2000) were obtained from WorldClim version 2.1 [35] at 30 arc-seconds (~1 km) resolution.

2.3. Data Collection

We selected 10 individual trees of each species. All trees were inside the parks surrounded by bare soil and some herbaceous vegetation and planted intermixed apparently in unsystematic arrangements. Individual trees for measurements were randomly selected with no overlapping crowns among trees. Tree species’ structural parameters and location are shown in Table 1.
Stomatal conductance (gS, 1/stomatal resistance) was measured with a gas diffusion porometer (LI-1600, LI-COR, Lincoln, NE, USA) on at least five expanded leaves per plant in the mid-level of the tree for at least four individuals in every park. Air temperature (TA), photosynthetically active radiation (PAR), and relative humidity (RH) were determined next to each measured leaf with a quantum sensor (LI-190SB, LI-COR Ltd., Lincoln, NNE, USA), and a humicap sensor (Vaisala, Helsinki, Finland).
A quantum sensor was installed near and parallel to the leaf maintaining the orientation of the leaf when measuring. Leaf temperature (TL) was measured with infrared thermographs (thermal camera, PCE-TC3, PCE Instruments, Southampton, UK). The leaf–air vapor pressure deficit (VPD) was calculated from TA, TL and RH measurements (VPD = eHeA = {0.6108exp[(17.27 TL)/(237.3 + TL)]} − {0.6108exp[(17.27 TA)/(237.3 + TA)] [1−RH)}). Additionally, net radiation, air temperature, air humidity, and wind direction and speed were monitored with a net radiometer (NR Lite2, Kipp & Zonen, Delft, The Netherlands), a temperature-humidity probe (HMP35C, Campbell-Scientific, Logan, UT, USA) in a ten-plate radiation shield (41003-5 Campbell Scientific, Logan, UT, USA) and an anemometer and vane set (03001, RM Young, Traverse City, MI, USA), respectively. These instruments were installed 3 m above the highest tree canopy on a telescopic tube connected to a data logger (21X, Campbell Scientific, Logan, UT, USA) and scanned every 30 s and 30 min averages logged. Leaf area index (A) was estimated with a canopy analyzer (LAI-2000, LI-COR Ltd., Lincoln, Dearborn, MI, USA). Four LAI measurements were taken at 1 m height from the ground and with a 90° view cap on a fish-eye lens. LAI is the ratio of the area of leaves to the area of the ground under the crown [36] and was measured on overcast days. LAI data were analyzed using FV2200 software developed for LAI-2200, deploying an isolated crown model and removing the 5th mask (68°). Measurements were performed from 11:00 to 14:00 local hour (h, local time) when transpiration was the highest [37], during the months of April and May 2020, the warmest and the driest months of the year. During measurements, maximum average temperature was 29 °C and 10.2 mm of precipitation were registered the last six days of March.
Transpiration (E) was estimated from VPD and gS using the relationship e.g., [37]:
E = ρ ε C P   V P D λ γ   ( r c + r A )      
where γ is the psychrometric constant; λ is the latent heat of evaporation of water; ρ is the air density; ε is the mole fraction of water in air (0.622 kg water per kg air); CP is the specific heat of dry air at constant pressure; rS (1/gS), rC, and rA are stomatal, canopy and aerodynamic resistance, respectively. Canopy resistance was calculated as rC = 1/AgS, where A is the leaf area index. Aerodynamic resistance was estimated by rA = [ln((zd)/z0)]/[k2u(z)], where z is a reference level, d is the displacement height, z0 is roughness length, k is the von Karman’s constant, and u(z) is the wind speed at level z [38]. We considered that species presenting high values of E, gS, PAR, VPD, and TA were more efficient at mitigating UHI because these high values increase water output [39] and thus the cooling potential decreases local air temperature [19]. We acknowledge that the use of this model may introduce an error since the vegetation plot does not formally fulfil the assumptions to estimate it. However, Ballinas and Barradas [37] found that rA was from three to five times lower than rC in some urban trees in Mexico City; therefore, this error was considered not significant.

2.4. The Thermal UrbaN Environment Energy Balance Model

The Thermal UrbaN Environment Energy (TUNEE) balance model is a physics-mathematical-biological-ecological-environmental-urban phenomenological model used to determine strategies to mitigate UHI. The model is based on the first law of thermodynamics and determinates energy distribution while incorporating plant physiological traits (i.e., transpiration and/or stomata conductance) [19]. TUNEE model shows the effect of urban vegetation on air temperature (TA) after increasing latent heat flux. Previous research determined the diagnosis equation for Mexico City as TA = 0.03892[QN − (QE + QETRP)] + 15.3, where basal temperature is ~15 °C during the day, when QN > 0 (this relationship can change in function of basal temperature) and QE and QETRP are the actual latent heat flux and the necessary latent heat flux, respectively, provided by evaporating surfaces by vegetation [19].

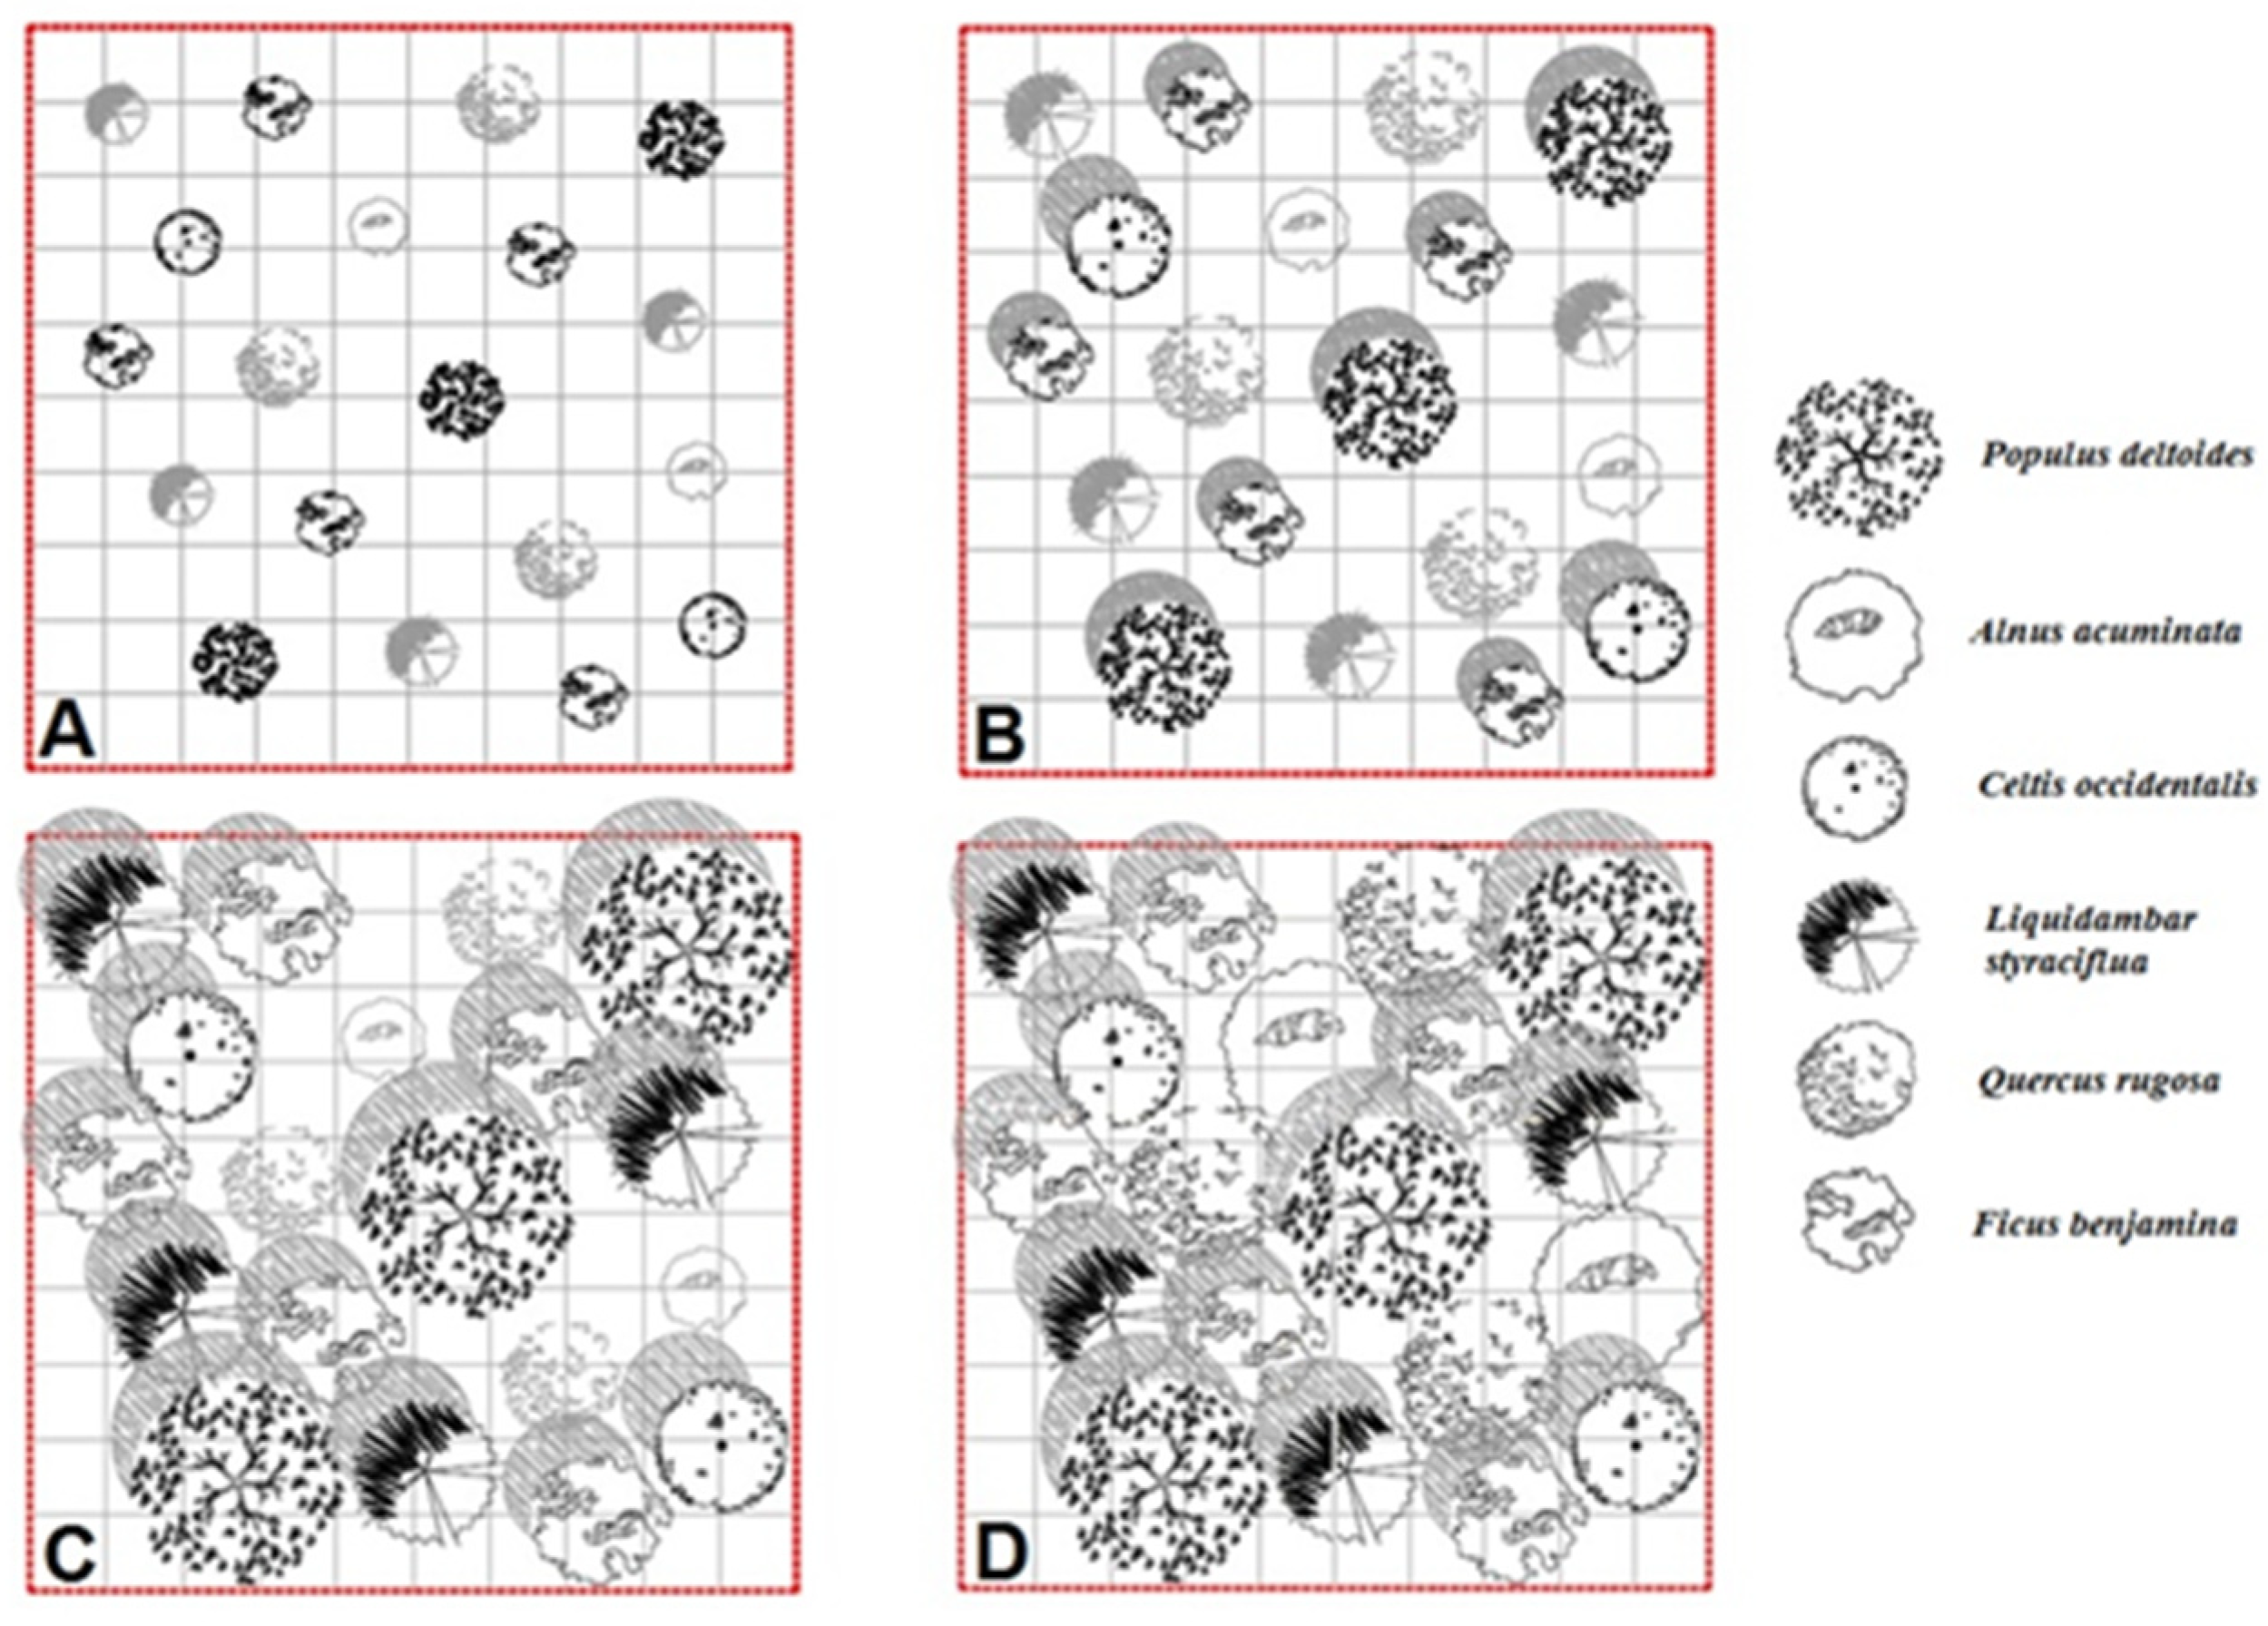
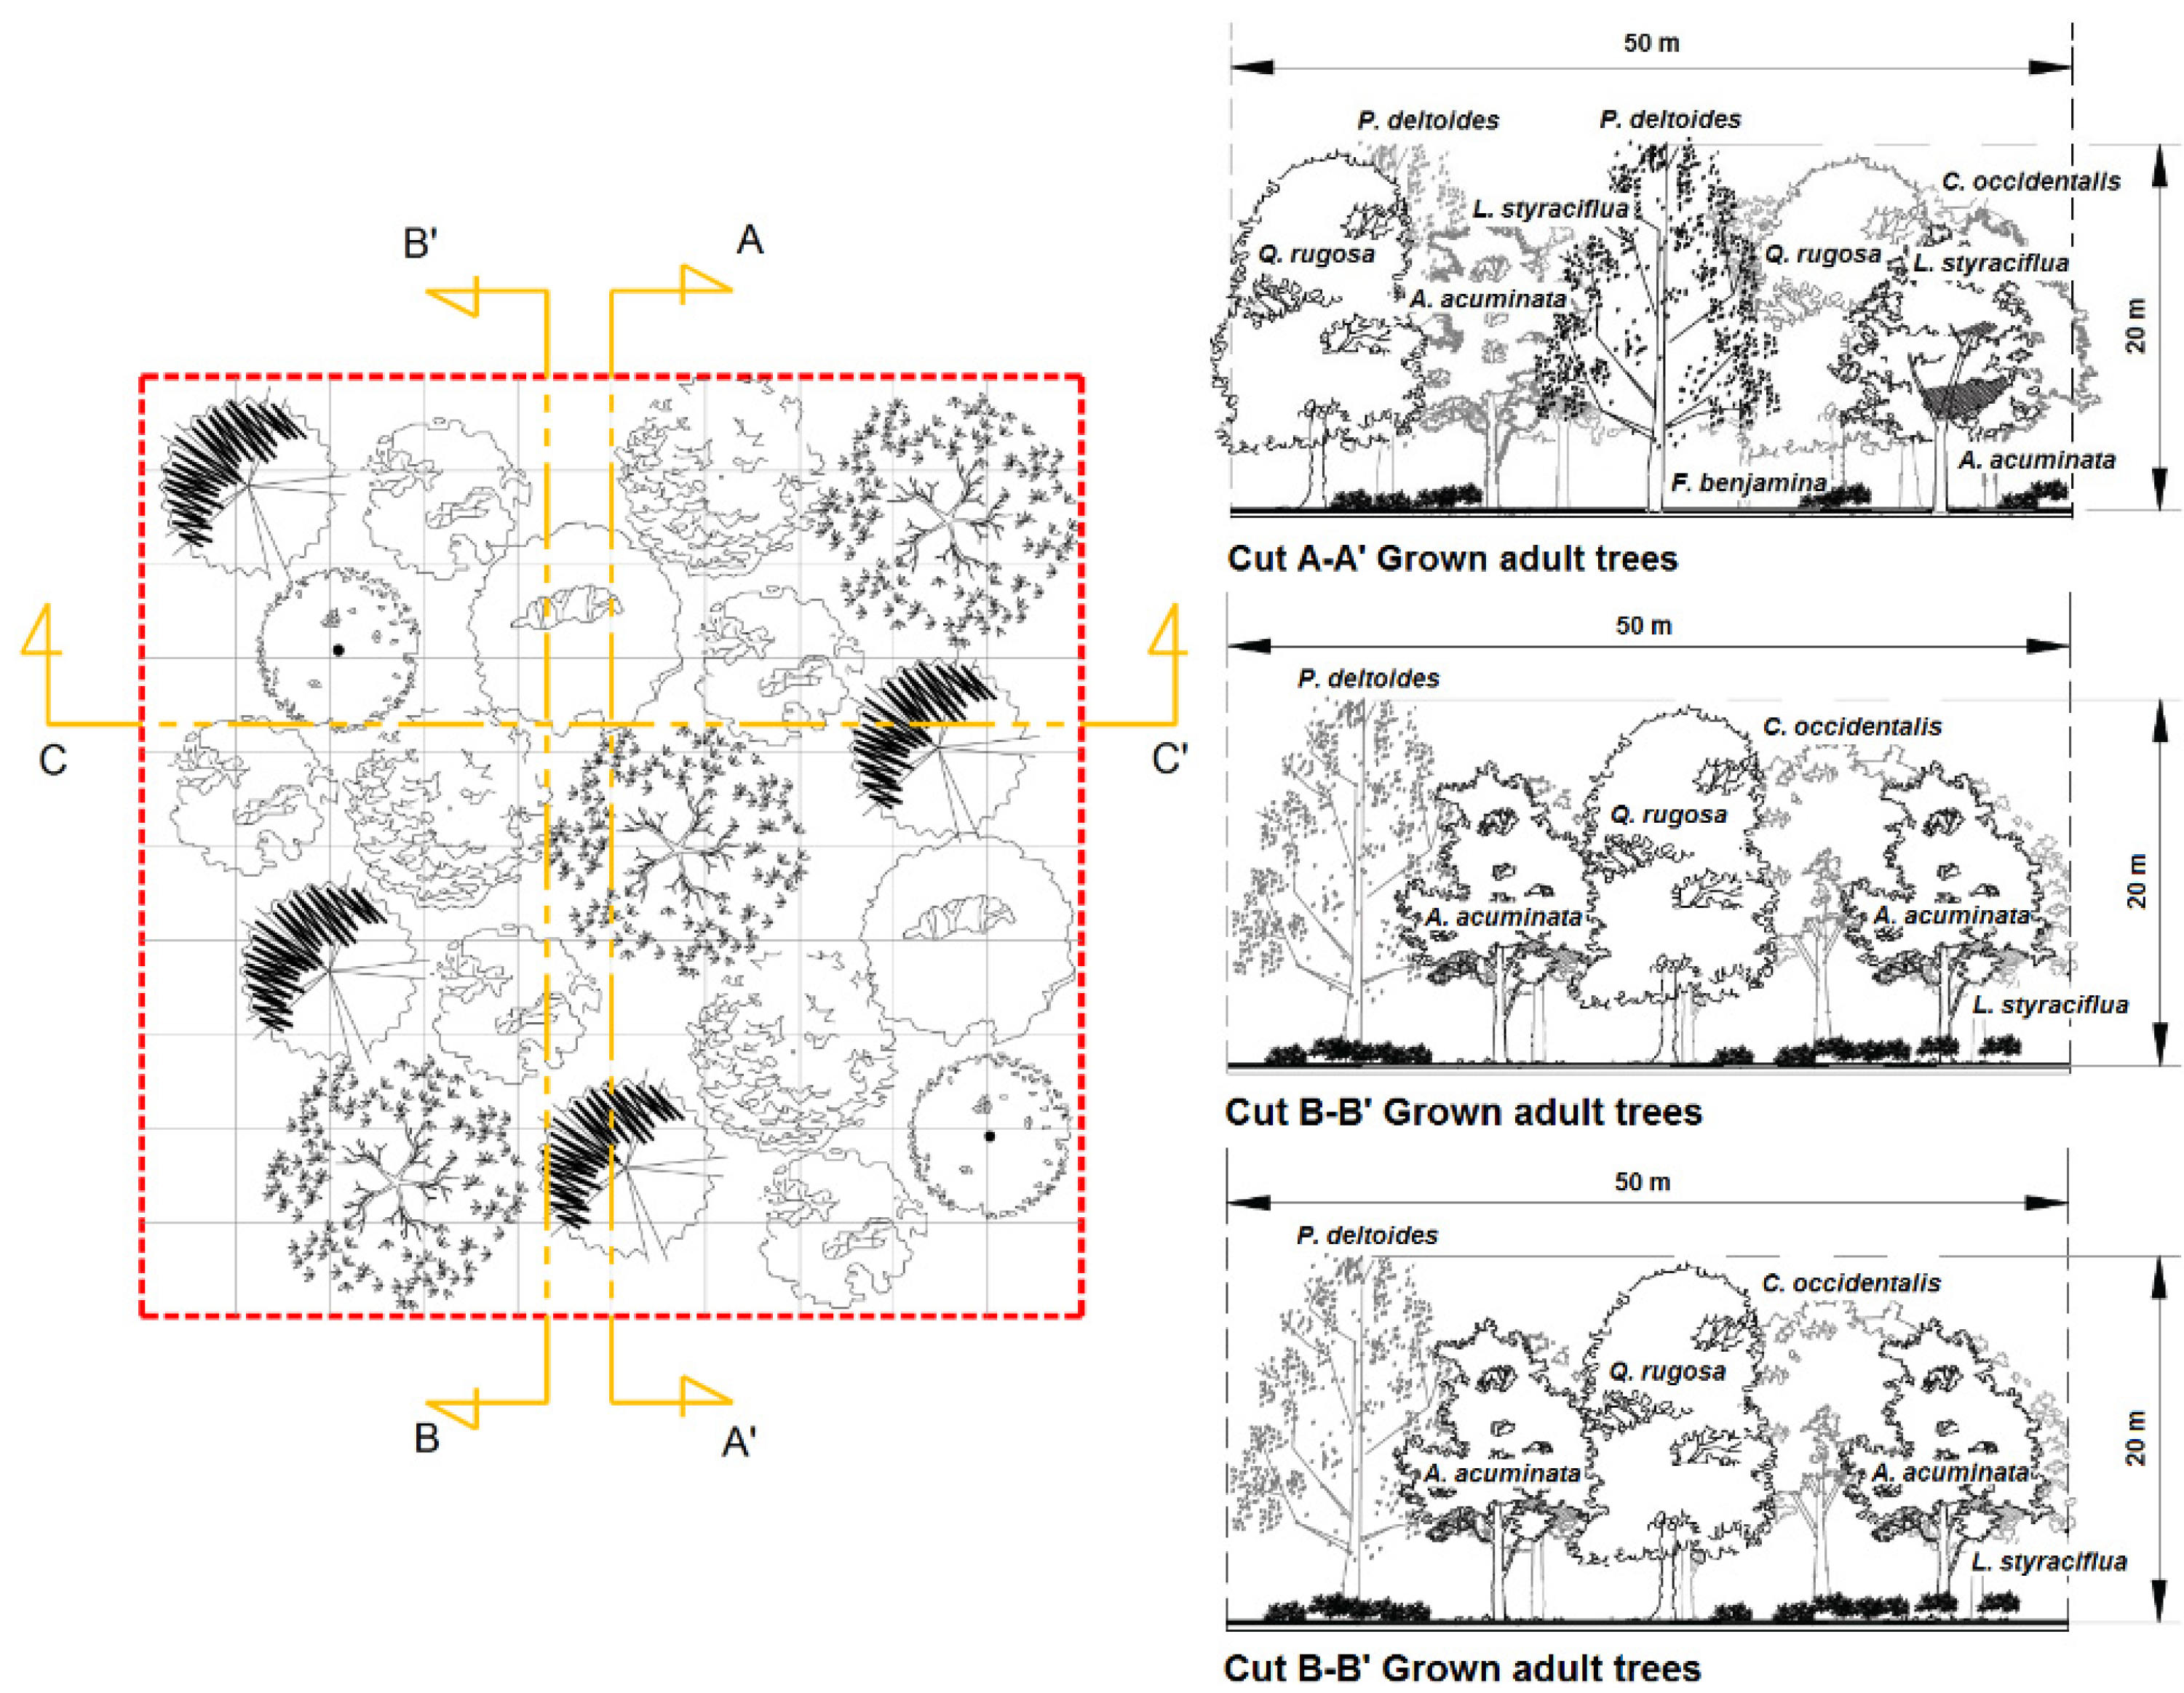
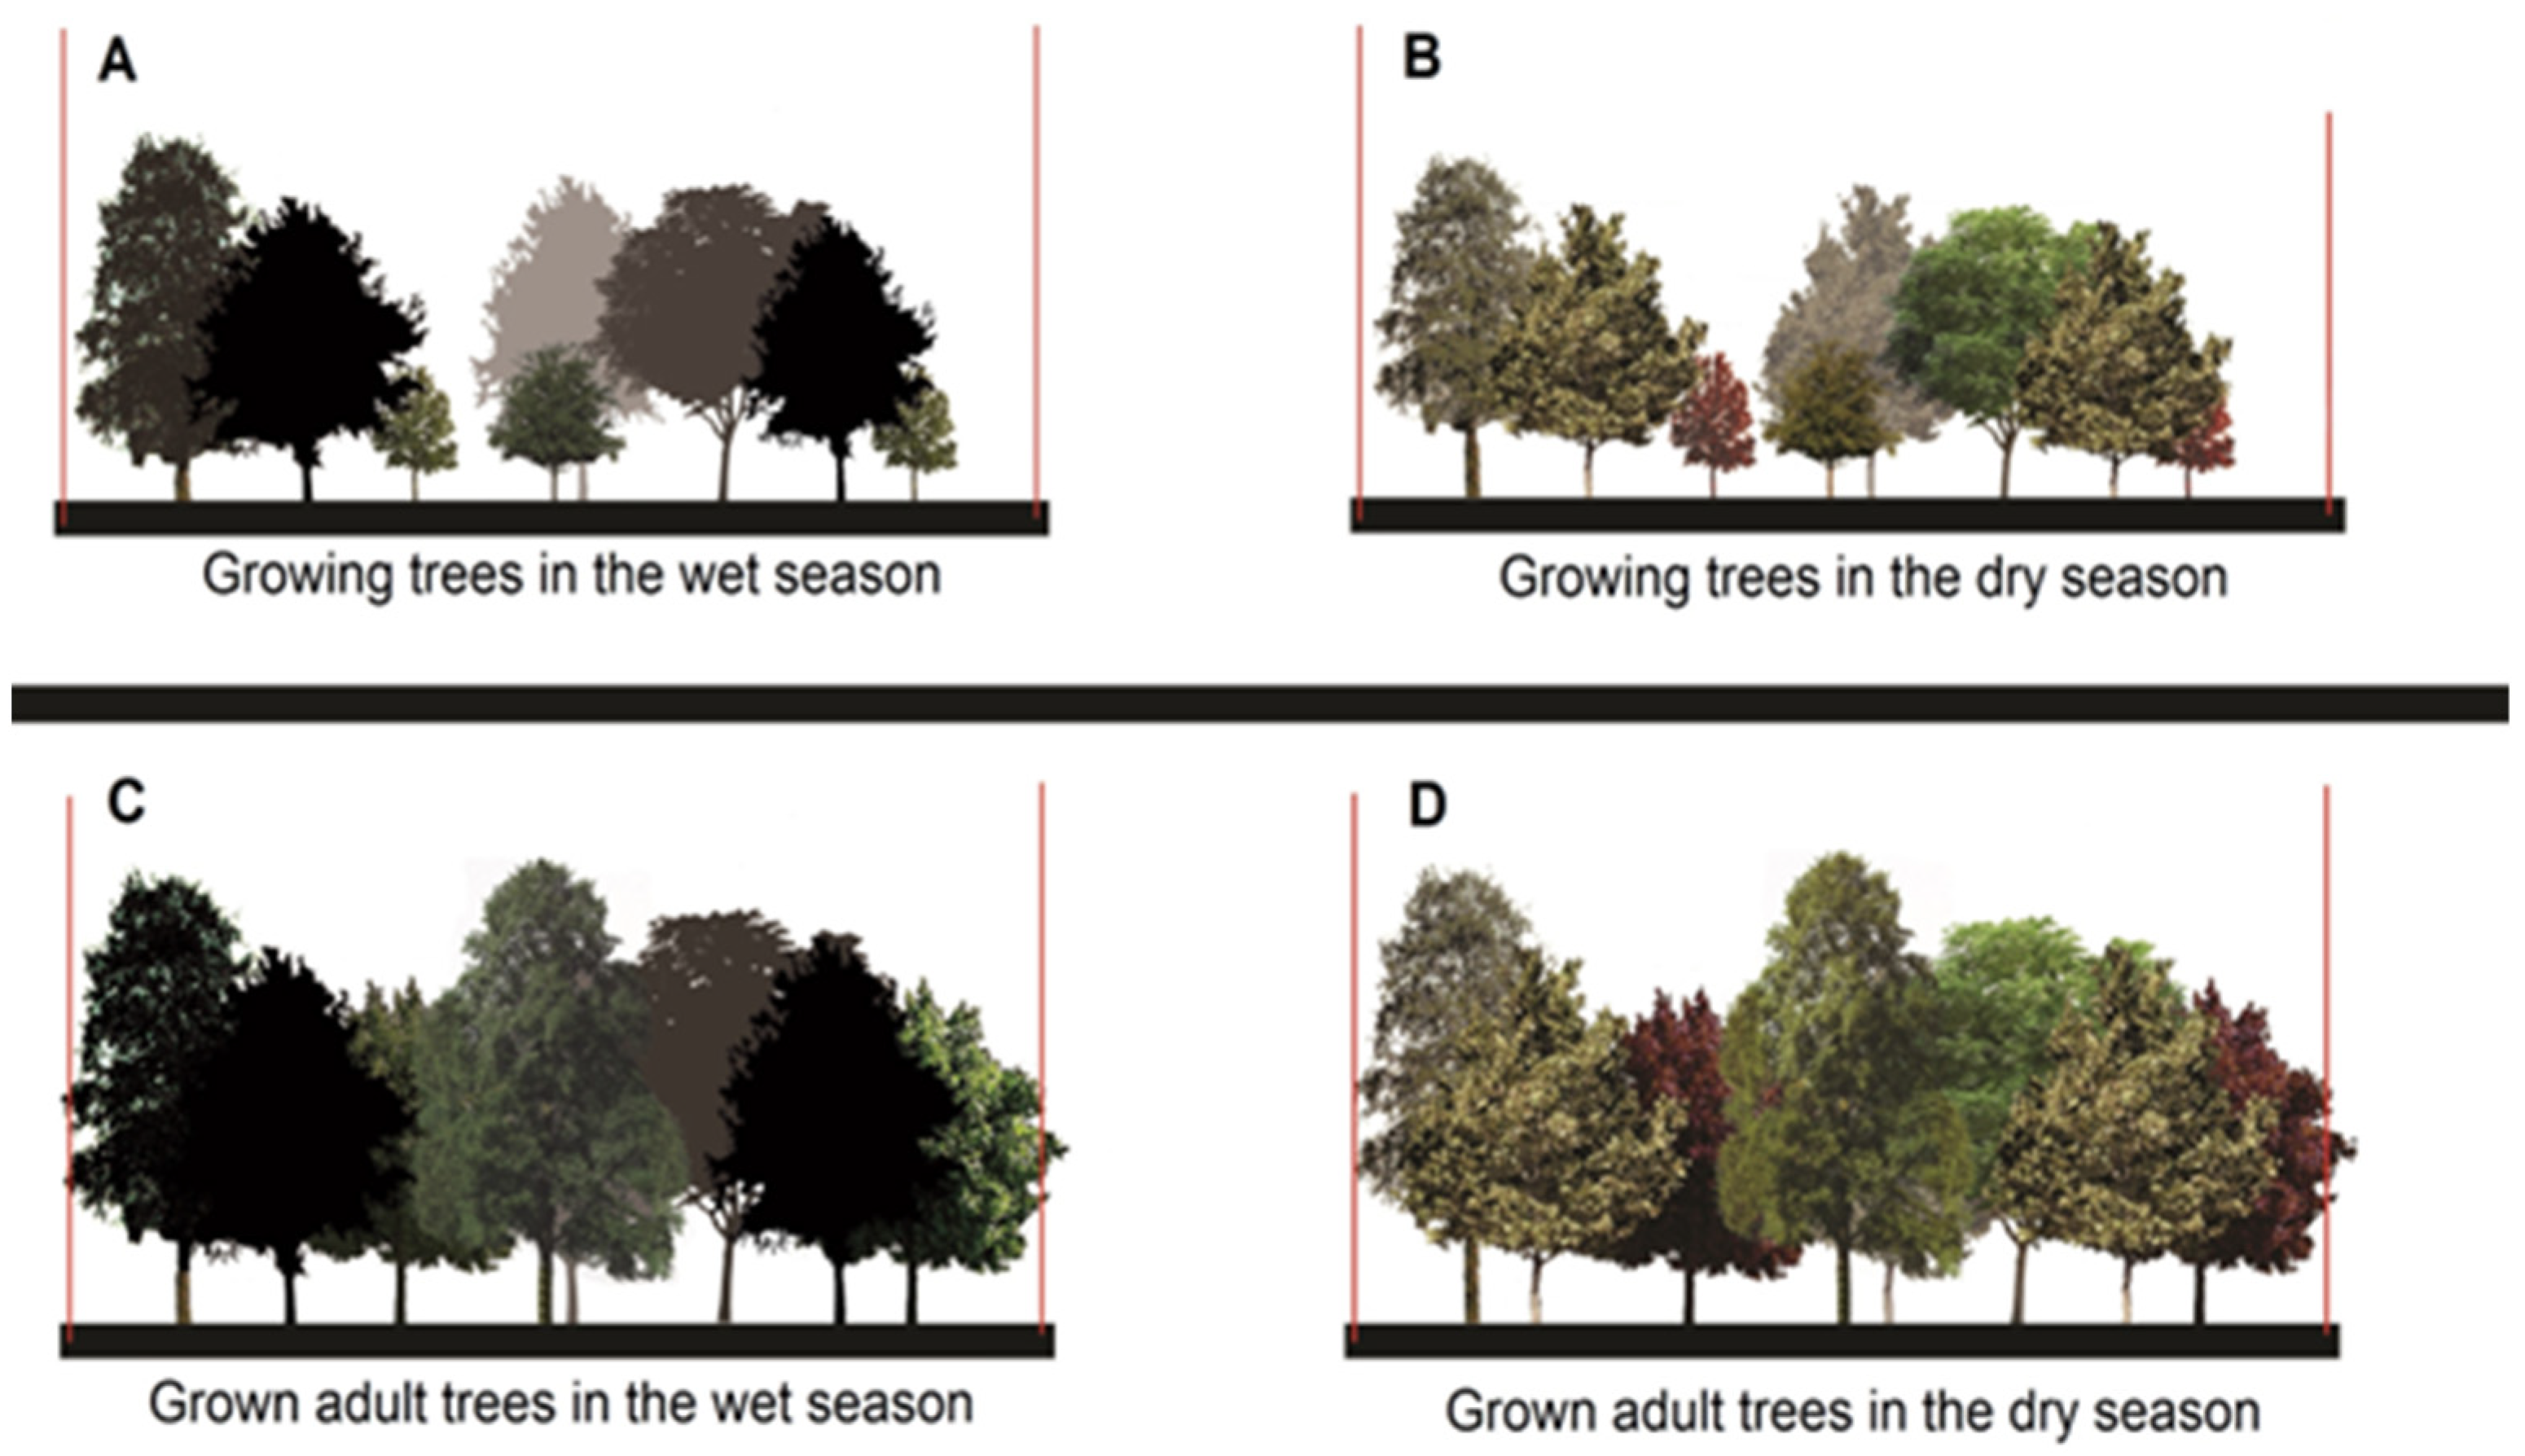
2.5. (Re)Designing Urban Parks

We developed a theoretical proposal based on a 50 × 50 m urban park design in which the planting technique was used as a module. We generated a tree community using urban tree species with aesthetic value and high transpiration and combined from a landscape point of view. Here, we defined a ‘tree community’ as a set of tree species that grow in the same place and present an association or affinity with one another. Therefore, these tree species can be used in urban forests to promote an adequate establishment and development of individuals, to ensure their performance and survival. Although aesthetics is subjective, the construction of the tree community was based on three principles of aesthetics: beauty, balance, and harmony [40,41]. The final set presented a structured that was considered beautiful (the result of the sum of the flowering, fall color, showy fruit, and pleasing bark [42]), which had balance and harmony and where the structural characteristics of each species predominate, articulating them to shape the space from an architectural and artistic point of view.

2.6. Statistical Analysis

We assessed differences in E, gS, TA, and TL and VPD among species using analysis of variance and Fisher’s test and a Student’s t-test to identify differences between TL and TA in the same species. We assessed relationship between species climate of origin and E and gS using linear regression models. Model performance was evaluated through the calculation of an R2 value and the F-statistic at a significance level of p < 0.05. Statistical analyses were conducted using R version 4.0.5 (R Core Team, 2021).

3. Results

The highest midday E was registered for L. styraciflua (0.0357 g m−2 s−1) and the lowest for B. cordata (0.0089 g m−2 s−1) (F(14,465) = 1196.8, p < 0.001). Transpiration rates represented an energy consumption or cooling potential from 87.13 (L. styraciflua) to 21.69 J m−2 s−1 (B. cordata). We identified three homogenous groups based on their transpiration rates: High E (L. styraciflua, A. acuminata, Q. rugosa, L. lucidum, and F. benjamina), moderate E (P. deltoides, F. uhdei, P. alba, C. occidentalis, and A. negundo), and low E (A. longifolia, U. parvifolia, R. pseudoacacia, L. indica, and B. cordata) (Table 2).
In concordance, gS was higher for L. styraciflua and lower for B. cordata (F(14,465) = 1180.9, p < 0.001). Concerning QN, B. cordata had the highest values and A. negundo had the lowest (F(14,465) = 925.3, p < 0.001). Although we found no statistical differences among tree species in differences between TA and TL (F(14,465) = 1.45, p = 0.10) and among individuals of the same species (p > 0.05), we observed that leaf temperature was higher than air temperature in species with low E. VPD values were the highest for Q. rugosa and lowest for L. indica (F(14,465) = 79.174, p < 0.001). We found a relationship among E, VPD, and TA. Species that had low E, such as B. cordata, L. indica, and A. negundo, recorded low VPD, where the air was more saturated with water vapor and relatively lower leaf temperature were recorded compared to the other species. We considered four groups accordingly to the relationship among E, VPD, and TA and species responses (Table 3). Species that recorded high E (Group 2 from Table 3) differed with respect to species that showed a moderate E, increased TL, and higher humidity (Group 3 from Table 3), although differences between ranges of temperature and humidity were not negligible for these two groups. High E for species within group 2 was likely caused by greater irrigation; however, irrigation data were not available.
Regarding microclimate, B. cordata had the highest values of PAR, whereas A. negundo had the lowest. Quercus rugosa presented the highest values of TA and VPD and L. indica the lowest. The highest TA and TL were associated with Q. rugosa, whereas L. indica had the lowest temperature values. Acer negundo had the greatest difference between TA and TL (1 °C), while L. styraciflua, A. acuminata, and U. parvifolia had no difference between air and leaf temperatures.
We found no significant correlations between the species’ climate of origin (i.e., MAT, MTWM, AP, and PDQ) and E and gS (p > 0.05), although we found a trend that species with a wet and warm origin (i.e., high MAT and AP) have higher E (Supplemental Table S2).
The proposal and outline for an urban park design was developed for a space of 2500 m2 (50 m × 50 m), considered functional and physiological parameters—mainly based on transpiration and aesthetic perspective—and consisted of six species with 19 individuals, including three individuals of P. deltoides, two individuals of A. acuminata, two individuals of C. occidentalis, four individuals of L. styraciflua, three individuals of Q. rugosa, and five individuals of F. benjamina (Figure 2).
The planting technique used to generate a tree community module with different perspectives is presented in Figure 2, Figure 3 and Figure 4. Figure 2 and Figure 3 show an example of how trees can be associated and grow together, not only depending on their growth rate, leaf characteristics, and aesthetic perspective but also on their transpiration rates, showing the highest potential to mitigate UHI with aesthetic and landscape potential. This urban park design includes four fast-growth (P. deltoides, A. acuminata, C. occidentalis and F. benjamina), one medium-growth (L. styraciflua), and one slow-growth (Q. rugosa) species. Fast-growth species consist of those trees that reach their maximum development between five and 15 years, medium-growth are trees that reach their full development between 15 and 20 years, and slow-growth species reach their full development >20 years. Figure 4 shows a realistic ambience profile of the proposed tree community during the growth stage and at full growth.
According to the results given by the TUNEE model, the proposed urban park design of a tree community can reduce air temperature up to 5.3 °C without considering the effect of shade, with a cooling potential of 142.7 W m−2 when trees are fully developed (i.e., mature trees). The cooling benefit varied among each set of trees and species, so the set with the highest cooling potential is given by F. benjamina (187.7 W m−2), while the set of C. occidentalis had the lowest cooling potential with 86.4 W m−2 (Table 4).

4. Discussion

Here, we used a bioclimatic approach for (re)designing urban parks to demonstrate that species selection considering E can significantly decrease local air temperature and mitigate UHI. Our research can contribute to landscape design by providing recommendations for the selection and management of urban trees with high E and proper species establishment. We propose an approach for comprehensive vegetation management with tree communities to mitigate urban heat by promoting high E. Our work also raises the following question: Is it possible to obtain moderate VPD and high E (i.e., comfort zones) for urban trees through landscape design? One approach to this concept could be (re)designing urban parks emulating natural communities (or park communities) because nature uses certain principles of order to control the conditions where vegetation grows.

4.1. Transpiration and Stomatal Conductance

In general, high E and gS are related to sufficient irradiance (PAR ≥ 300 µmol m−2 s−1) on leaves to stimulate stomatal opening by raising leaf temperature [43,44], while a moderate VPD prevents stomatal closure produced by the influence of dry air and high pressure of humid air [45,46]. However, for these conditions to occur, plants must have water available in the soil. Indeed, high E requires that most of the water of the substrate is absorbed by the roots, which depends on the permeability and type of soil [47]. The absorbed water must be efficiently conducted through the vascular system to all tissues and organs to perform vital functions. Finally, leaf characteristics and stomatal sensitivity facilitate water loss [48]. Therefore, species used in landscape and urban planning should have positive or desirable physiological and morphological traits (Table 1) to promote high E and gS.
To maintain high E, it also should be considered that when TL is higher than TA, stomata close (i.e., no E occurs) because water is limited to increase E and decrease TL [45,46]. Therefore, we recommend the establishment of trees under conditions of adequate irrigation (or during the rainy season) and light shade (with enough light infiltration to decrease TL). Shadows cast by taller trees help to reduce excessive sunlight on leaves, preventing stomatal closure when trees are in conditions of low water availability in the soil [49,50,51]. Additionally, shade decreases the surface temperature of the soil and thus reduces water loss by evaporation of the substrate [50].

4.2. (Re)Designing Urban Parks

Urban parks are conformed by groups of trees of different species where E differs among species and individuals depending on their characteristics and spatial location within the park and relative to other individuals, and on local environmental conditions [52]. Trees have mechanisms to adapt to different environmental conditions and stomatal behavior has different responses depending on these conditions [50,53]. Furthermore, urban trees can adapt and change their morphological and physiological traits as an adaptive response to the environment [54]. Thus, urban park communities can provide suitable environments that promote high E. However, an urban park community that promotes high E must consider species selection, density per unit area, park area, frond size of the selected individual trees, distance between individuals, number of individuals, diversity, and climate of origin. Indeed, although we did not find a significant correlation between E and climate of origin, we found evidence that species with warmer and wetter origin have high E; thus, climate of origin can be used as a tool to inform species selection [55].
Urban park communities can allow strategic tree location; fast-growing species can play the role of “nurse species” to create favorable conditions for the development of other species [56]. These communities within the urban context can promote the proper establishment and development of individuals to ensure plant performance [57]. However, care must be taken because cities are artificial entities that require management and practices different from natural environments, such as the case of species introduced due to their high E, such as F. benjamina, a tree native to Asia.

4.3. Additional Management Considerations

Our results suggest that to be able to compare E among species, it is important that all individuals are under similar or controlled conditions, considering irrigation, drafts, and type of substrate, among other factors. Moreover, it must be considered that E is not only determined by external conditions but also depends on internal conditions, especially water supply, which in turn depends on the roots, driving resistance, and soil conditions [58].
Transpiration is also reduced by decreasing the ratio of root/leaf area [59]. Hence, care must be taken to avoid improper pruning that removes most of the foliage. A large leaf surface increases E due to the presence of a greater number of leaves [60]. However, if a tree structure does not allow enough light infiltration to stimulate E, this will decrease [61]. To avoid this problem, we recommend performing pruning shaping and thinning to form open spaces within the canopy and allow air circulation and light infiltration to stimulate E. It is also important to avoid the excessive cutting of roots that is performed when maintenance work is running on sidewalks or underground infrastructures, such as power grids or drainage.
As for irrigation, we did not find recommendations based on morpho-physiological characteristics of our species, but rather on experience (empirical knowledge). Harris [62] proposed a formula based on estimated coefficients to calculate irrigation of trees, shrubs, ground cover, mixed-grass coverage, and transpiration. However, Harris [62] did not consider soil characteristics or specific species. Because irrigation in urban parks is limited, it is necessary to know the real water demand of individual tree species, which to date is vastly unavailable. In places such as Mexico City where water for irrigation is limited, urban park communities can achieve more efficient use of water using our approach to estimating more accurately the amount of water needed for irrigation, especially during periods of increased scarcity, depending on the size of the urban park and the number of species and individual trees. Indeed, according to the conditions of the eight green areas used in this work, it seems that irrigation is inadequate in all green areas, causing water wastage, tree damage, and poor landscape, with additional socioeconomic losses.
Knowing more accurately the water requirements of urban trees can help to form tree communities with high, moderate, or low water requirements, depending on the water availability of the space to (re)design, and even zoning the park regarding the irrigation system and type of activities to provide water more efficiently and potentially at low cost. Nevertheless, despite lack of irrigation data, the proposed urban park design of a tree community presented in Figure 2 and Figure 3 shows a similar cooling potential (Table 4) than that of the LGUP park (measured as 5.6 °C [63]), which is a park almost 39 times larger (9.9 ha) than the module proposed here.
Another approach is replacing tree species currently planted in parks with low E with tree species with medium or high E, considering the characteristics highlighted in this study and redesigning them to include in the palette species with high E and other physiological variables as a criterion for species selection aside from aesthetic and landscape features. This is especially important when species richness and diversity is encouraged while (re)designing urban parks [64]. This inclusion not only would reduce heat loads but could also improve human thermal comfort indices with a direct effect on human health [65].
While we have presented a novel method for (re)designing urban parks to maximize urban heat mitigation, there are some limitations to our study. First, we considered only a small number of species (i.e., 15 dominant urban tree species) that may not enhance urban tree diversity or account for the role of rare or endangered species [66,67]. Second, physiological data on E and gS might not be readily available for a great number of species, limiting decision making about species selection. Third, other physiological traits, such as leaf area or leaf water potential at turgor point can also be used to guide species selection [68]. Finally, additional factors that can mitigate (e.g., presence of blue infrastructure) or exacerbate (e.g., air pollution) urban heat are not considered in our approach.

5. Conclusions

This work allowed us to understand how some plant traits of urban trees can be considered tools of landscape and urban design to reduce air temperature and mitigate UHI. Moreover, applying a bioclimatic approach, as proposed here for (re)designing urban parks, can help to improve local environmental conditions through proper management of vegetation, and make more efficient use of irrigation. Furthermore, our approach can be used to enhance urban greening strategies aiming to increase canopy cover while mitigating urban heat.
Our study offers a comparison of physiological responses among species facilitating the identification of the most efficient species to reduce urban heat via transpiration. A simultaneous evaluation of several urban tree species is useful for prioritizing tree options for urban greening in policies and plans. For example, we considered that species with high E and gS, such as L. styraciflua and Q. rugosa, can help to mitigate the effects of the UHI. Therefore, these species can be considered good plant choices when landscape design and urban planning aim to reduce local air temperature. We recommend increasing the number of urban tree species with different attributes to promote species and trait diversity in cities while (re)designing urban parks. We also highlight the need for research on physiological data for urban tree species to fill gaps in knowledge to assist species selection. Although our approach is based in Mexico City, other cities can replicate our method and use E or other plant traits to identify which species are more efficient to mitigate heat and achieve more effective irrigation conditions.

Supplementary Materials

The following supporting information can be downloaded at: https://www.mdpi.com/article/10.3390/f13071143/s1, Table S1: Mean values of mean annual temperature (MAT, °C), annual precipitation (AP, mm), maximum temperature of the warmest month (MTWM, °C) and precipitation of the driest quarter (PDQ, mm) for 15 dominant urban tree species based on their realized climatic niches; Table S2: Results of linear regression models used to assess relationships between two physiological traits (transpiration = E; stomatal conductance = gS) and four climate variables (mean annual temperature = MAT; annual precipitation = AP; maximum temperature of the warmest month = MTWM; precipitation of the driest quarter = PDQ) of 15 dominant tree species.

Author Contributions

Conceptualization, V.L.B., M.B. and M.E.-R.; methodology, V.L.B., J.A.M., M.E.-R. and M.B.; formal analysis, V.L.B., M.E.-R. and M.B.; investigation J.A.M., M.B. and V.L.B.; resources, V.L.B.; writing—original draft preparation, V.L.B., M.E.-R. and M.B.; writing—review and editing, V.L.B., M.E.-R. and M.B.; funding acquisition, V.L.B.; supervision. All authors have read and agreed to the published version of the manuscript.

Funding

This research was funded partially Programa de Apoyo a Proyectos de Investigación e innovación Tecnológica (PAPIIT), DGAPA, Universidad Nacional Autónoma de México, grant number IT200620 including the APC.

Institutional Review Board Statement

Not applicable.

Informed Consent Statement

Not applicable.

Data Availability Statement

Not applicable. The data that support the finding of this study are available from the corresponding author upon reasonable request.

Acknowledgments

This study was supported partially by Grant PAPIIT Programa de Apoyo a Proyectos de Investigación e Innovación Tecnológica, DGAPA, UNAM, Grant/Award Number IT200620.

Conflicts of Interest

The authors declare no conflict of interest.

References

  1. Oke, T.R. The heat island of the urban boundary layer: Characteristics, causes and effects. Wind Clim. Cities 1995, 277, 81–107. [Google Scholar]
  2. Williams, N.S.G.; Hahs, A.K.; Vesk, P.A. Urbanisation, plant traits and the composition of urban floras. Perspect. Plant Ecol. Evol. Syst. 2015, 17, 78–86. [Google Scholar] [CrossRef]
  3. Miller, R.W.; Hauer, R.J.; Werner, L.P. Urban Forestry: Planning and Managing Urban Greenspaces, 3rd ed.; Waveland Press, Inc.: Long Grove, IL, USA, 2015. [Google Scholar]
  4. Livesley, S.; McPherson, E.G.; Calfapietra, C. The urban forest and ecosystem services: Impacts on Urban water, heat, and pollution cycles at the tree, street, and city scale. J. Environ. Qual. 2016, 45, 119–124. [Google Scholar] [CrossRef]
  5. Beer, A.R. Developing tools to monitor the effectiveness of development plans. In Proceedings of the PRO/ECE-Workshop on Sustainable Urban Development: Research and Experiments, 1st ed.; Van der Vegt, H., Ter Heide, H., Tjallingii, S., Van Alphen, D., Eds.; Delft University Press: Dordrecht, The Netherlands, 1994; pp. 69–85. [Google Scholar]
  6. Sayad, B.; Alkama, D.; Ahmad, H.; Baili, J.; Aljahdaly, N.H.; Menni, Y. Nature-based solutions to improve the summer thermal comfort outdoors. Case Stud. Therm. Eng. 2021, 28, 101399. [Google Scholar] [CrossRef]
  7. Ulrich, R.S. Natural versus urban sciences: Some psycho-physiological effects. Environ. Behav. 1981, 13, 523–556. [Google Scholar] [CrossRef]
  8. Chiesura, A. The role of urban parks for the sustainable city. Landsc. Urban Plan. 2004, 68, 129–138. [Google Scholar] [CrossRef]
  9. Donovan, G.H.; Prestemon, J. The Effect of Trees on Crime in Portland, Oregon. Environ. Behav. 2010, 44, 3–30. [Google Scholar] [CrossRef]
  10. Vandermeulen, V.; Verspecht, A.; Vermeire, B.; Van Huylenbroeck, G.; Gellynck, X. The use of economic valuation to create public support for green infrastructure investments in urban areas. Landsc. Urban Plan. 2011, 103, 198–206. [Google Scholar] [CrossRef]
  11. Thompson, C.W. Urban open space in the 21st century. Landsc. Urban Plan. 2002, 60, 59–72. [Google Scholar] [CrossRef]
  12. Farhadi, H.; Faisi, M.; Sanaieian, H. Mitigating the urban heat island in residential area of Tehran: Investigating the role of vegetation, material, and orientation of buildings. Sustain. Cities Soc. 2019, 46, 101448. [Google Scholar] [CrossRef]
  13. Rakoto, P.Y.; Deilami, K.; Hurley, J.; Amati, M.; Sun, Q.C. Revisiting the cooling effects of urban greening: Planning implications of vegetation types and spatial configuration. Urban For. Urban Green. 2021, 64, 127266. [Google Scholar] [CrossRef]
  14. Cortes, A.; Rejuso, A.J.; Santos, J.A.; Blanco, A. Evaluating mitigation strategies for urban heat island in Mandaue City using ENVI-met. J. Urban Manag. 2022, 11, 97–106. [Google Scholar] [CrossRef]
  15. Buyadi, S.N.A.; Mohd, W.M.N.W.; Misni, A. Green spaces growth impact on the urban microclimate. Procedia—Soc. Behav. Sci. 2013, 105, 547–557. [Google Scholar] [CrossRef] [Green Version]
  16. Gioia, A.; Paolini, L.; Malizia, A.; Oltra-Carrió, R.; Sobrino, J.A. Size matters: Vegetation patch size and surface temperature relationship in foothills cities of northwestern Argentina. Urban Ecosyst. 2014, 17, 1161–1174. [Google Scholar] [CrossRef]
  17. Alavipanah, S.; Wegmann, M.; Qureshi, S.; Weng, Q.; Koellner, T. The Role of Vegetation in Mitigating Urban Land Surface Temperatures: A Case Study of Munich, Germany during the Warm Season. Sustainability 2015, 7, 4689–4706. [Google Scholar] [CrossRef] [Green Version]
  18. Gates, D.M. Transpiration and leaf temperature. Annu. Rev. Plant Physiol. 1968, 19, 211–238. [Google Scholar] [CrossRef]
  19. Ballinas, M.; Barradas, V.L. The urban tree as a Tool to mitigate the urban heat island in Mexico City: A simple phenomenological model. J. Environ. Qual. 2016, 45, 157–166. [Google Scholar] [CrossRef]
  20. Freeman, S. Biological Science, 3rd ed.; Benjamin Cummings: San Francisco, CA, USA, 2007. [Google Scholar]
  21. Esau, K. 1977. In Anatomy of Seed Plants, 2nd ed.; Wiley and Sons: Denver, CO, USA, 2007. [Google Scholar]
  22. García-Sánchez, I.E.; Barradas, V.L.; de León Hill, C.A.P.; Esperón-Rodríguez, M.; Pérez, I.R.; Ballinas, M. Effect of heavy metals and environmental variables on the assimilation of CO2 and stomatal conductance of Ligustrum lucidum, an urban tree from Mexico City. Urban For. Urban Green. 2019, 42, 72–81. [Google Scholar] [CrossRef]
  23. Pallardy, S.G. Physiology of Woody Plants, 3rd ed.; Academic Press: San Diego, CA, USA, 2007; pp. 325–366. ISBN 978-0-12-088765-1. [Google Scholar]
  24. IPCC. Climate Change 2021: The Physical Science Basis, the Working Group I contribution to the Sixth Assessment Report; Intergovernmental Panel on Climate Change: Geneva, Switzerland, 2021. [Google Scholar]
  25. Seppanen, O.; Fisk, W.J.; Faulkner, D. Control of Temperature for Health and Productivity in Offices; Lawrence Berkeley National Laboratory: Berkeley, CA, USA, 2004. [Google Scholar]
  26. Tse, W.L.; So, A.T. The Importance of Human Productivity to Air-Conditioning Control in Office Environments. HVACR Res. 2007, 13, 3–21. [Google Scholar] [CrossRef]
  27. Lowe, S.A. An energy and mortality impact assessment of the urban heat island in the US. Environ. Impact Assess. Rev. 2016, 56, 139–144. [Google Scholar] [CrossRef]
  28. Ballinas, M. Mitigación de la isla de calor urbana: Estudio de caso de la zona metropolitana de la Ciudad de México. Master’s Theise, Universidad Nacional Autónoma de México, Ciudad de México, Mexico, 2011. [Google Scholar]
  29. Ramos-Niembro, G.; Heard, C.; Sánchez-Viveros, A. Simulación de escenarios de ahorro y uso eficiente de energía, con medidas de control pasivo. Energía Racion. FIDE 1998, 28, 17–29. [Google Scholar]
  30. INEGI. Available online: http://cuentame.inegi.org.mx/monografias/informacion/df/territorio/clima.aspx?tema=me&e=09 (accessed on 23 April 2021).
  31. SMN. Available online: https://smn.conagua.gob.mx/es/climatologia/informacion-climatologica/normales-climatologicas-por-estado (accessed on 23 April 2021).
  32. Barradas, V.L.; Tejeda-Martínez, A.; Jáuregui, E. Energy balance measurements in a suburban vegetated area in Mexico City. Atmos. Environ. 1999, 33, 4109–4113. [Google Scholar] [CrossRef]
  33. Oke, T.R.; Sproken-Smith, R.A.; Jáuregui, E.; Grimmond, C.S.B. The energy balance of central Mexico City during the dry season. Atmos. Environ. 1999, 33, 3919–3930. [Google Scholar] [CrossRef]
  34. Jauregui, E. Mesomicroclima de la Ciudad de México; Instituto de Geografía UNAM: Ciudad de México, Mexico, 1971. [Google Scholar]
  35. Fick, S.E.; Hijmans, R.J. WorldClim 2: New 1-km spatial resolution climate surfaces for global land areas. Int. J. Climatol. 2017, 37, 4302–4315. [Google Scholar] [CrossRef]
  36. Kumar, R.; Kaushik, S.C. Performance evaluation of green roof and shading for thermal protection of buildings. Build. Environ. 2005, 40, 1505–1511. [Google Scholar] [CrossRef]
  37. Ballinas, M.; Barradas, V.L. Transpiration and stomatal conductance as potential mechanisms to mitigate the heat load in Mexico City. Urban For. Urban Green. 2016, 20, 152–159. [Google Scholar] [CrossRef]
  38. Thom, A.S. Momentum, Mass and Heat Exchange of Plant Communities, 1st ed.; Vegetation and the atmosphere Academic Press: London, UK, 1976; pp. 57–109. [Google Scholar]
  39. Monteith, J.L. Evaporation and environment. Symposium of the Soc. Exp. Biol. 1965, 19, 205–224. [Google Scholar]
  40. Panagopoulos, T. Linking forestry, sustainability and aesthetics. Ecol. Econ. 2009, 68, 2485–2489. [Google Scholar] [CrossRef]
  41. Yılmaz, S.; Özgüner, H.; Mumcu, S. An aesthetic approach to planting design in urban parks and greenspaces. Landsc. Res. 2018, 43, 965–983. [Google Scholar] [CrossRef]
  42. Avolio, M.L.; Pataki, D.E.; Trammell, T.L.; Endter-Wada, J. Biodiverse cities: The nursery industry, homeowners, and neighborhood differences drive urban tree composition. Ecol. Monogr. 2018, 88, 259–276. [Google Scholar] [CrossRef] [Green Version]
  43. Hovenden, J.M.; Brodribb, T. Altitude of origin influences stomatal conductance and therefore maximum assimilation rate in southern Beech, Nothofagus cunninghamii. Aust. J. Plant Physiol. 2000, 27, 451–456. [Google Scholar] [CrossRef]
  44. Esperón-Rodríguez, M.; Barradas, V.L. Potential vulnerability to climate change of four tree species from the central mountain region of Veracruz, Mexico. Clim. Res. 2014, 60, 163–174. [Google Scholar] [CrossRef]
  45. Collatz, G.J.; Ball, J.T.; Grivet, C.; Berry, A.J. Physiological and environmental regulation of stomatal conductance, photosynthesis and transpiration: A model that includes a laminar boundary layer. Agric. For. Meteorol. 1991, 54, 107–136. [Google Scholar] [CrossRef]
  46. Bunce, J.A. Does transpiration control stomatal responses to water vapour pressure deficit? Plant Cell Environ. 1997, 20, 131–135. [Google Scholar] [CrossRef] [Green Version]
  47. Scherer, T.F.; Seelig, B.; Franzen, D. Soil, Water and Plant Characteristics Important to Irrigation; NDSU Extension Service: Fargo, ND, USA; Available online: https://www.ag.ndsu.edu/publications/crops/soil-water-and-plant-characteristics-important-to-irrigation (accessed on 13 April 2022).
  48. McCulloh, K.A.; Woodruff, D.R. Linking stomatal sensitivity and whole-tree hydraulic architecture. Tree Physiol. 2012, 32, 369–372. [Google Scholar] [CrossRef] [Green Version]
  49. McCree, K.J. Photosynthetically active radiation. Physiol. Plant Ecol. 1981, 12/A, 41–55. [Google Scholar]
  50. Jones, H.G. Plant and Microclimate, 3rd ed.; Cambridge University Press: Cambridge, UK, 1992. [Google Scholar]
  51. Chazdon, R.L.; Pearcy, R.W.; Lee, D.W.; Fetcher, N. Photosynthetic responses of tropical forest plants to contrasting light environments. In Tropical Forest Plant Ecophysiology; Mulkey, S.S., Chazdon, R.L., Smith, A.P., Eds.; Springer: Boston, MA, USA, 1996; pp. 5–55. [Google Scholar]
  52. Zhao, D.; Lei, Q.; Shi, Y.; Wang, M.; Chen, S.; Shah, K.; Ji, W. Role of species and planting configuration on transpiration and microclimate for urban trees. Forests 2020, 11, 825. [Google Scholar] [CrossRef]
  53. Arriaga, A.; Cruz, G.; Ortiz, G. Relaciones Hídricas en Las Plantas; P&V Editores: Mexico City, Mexico, 1999. [Google Scholar]
  54. Esperon-Rodriguez, M.; Rymer, P.D.; Power, S.A.; Challis, A.; Marchin, R.M.; Tjoelker, M.G. Functional adaptations and trait plasticity of urban trees along a climatic gradient. Urban For. Urban Green. 2020, 54, 126771. [Google Scholar] [CrossRef]
  55. McPherson, E.G.; Berry, A.M.; van Doorn, N.S. Performance testing to identify climate-ready trees. Urban For. Urban Green. 2018, 29, 28–39. [Google Scholar] [CrossRef]
  56. Padilla, F.M.; Pugnaire, F.I. The role of nurse plants in the restoration of degraded environments. Front. Ecol. Environ. 2006, 4, 196–202. [Google Scholar] [CrossRef]
  57. González, M.F. Las comunidades Vegetales de México, 2nd ed.; SEMARNAT & INE: Ciudad de México, Mexico, 2004; pp. 56–75. [Google Scholar]
  58. Braun-Blanquet, J. Fitosociología. Bases Para El Estudio de Las Comunidades Vegetales; H. Blume Ediciones: Madrid, Spain, 1979. [Google Scholar]
  59. Parker, J. Effects of variations in the root-leaf ratio on transpiration rate. Plant Physiol. 1949, 24, 739–743. [Google Scholar] [CrossRef] [PubMed] [Green Version]
  60. Geller, G.N.; Smith, W.K. Influence of leaf size, orientation, and arrangement on temperature and transpiration in three high-elevation, large-leafed herbs. Oecologia 1982, 53, 227–234. [Google Scholar] [CrossRef] [PubMed]
  61. Ku, S.B.; Edwards, G.E.; Tanner, C.B. Effects of light, carbon dioxide, and temperature on photosynthesis, oxygen inhibition of photosynthesis, and transpiration in Solanum tuberosum. Plant Physiol. 1977, 59, 868–872. [Google Scholar] [CrossRef] [Green Version]
  62. Harris, R.W. Arboriculture, Integrated Management of Landscape Trees, Shrubs and Vines, 2nd ed.; Pentice-Hall Inc.: Hoboken, NJ, USA, 1992; pp. 318–345. [Google Scholar]
  63. Barradas, V.L. Air temperature and humidity and human comfort index of some city parks of Mexico City. Int. J. Biometeorol. 1991, 35, 24–28. [Google Scholar] [CrossRef]
  64. Nielsen, A.B.; Van Den Bosch, M.; Maruthaveeran, S.; van den Bosch, C.K. Species richness in urban parks and its drivers: A review of empirical evidence. Urban Ecosyst. 2014, 17, 305–327. [Google Scholar] [CrossRef]
  65. Stigsdotter, U.K.; Corazon, S.S.; Sidenius, U.; Refshauge, A.D.; Grahn, P. Forest design for mental health promotion—Using perceived sensory dimensions to elicit restorative responses. Landsc. Urban Plan. 2017, 160, 1–15. [Google Scholar] [CrossRef]
  66. Alvey, A.A. Promoting and preserving biodiversity in the urban forest. Urban For. Urban Green. 2006, 5, 195–201. [Google Scholar] [CrossRef]
  67. Morgenroth, J.; Östberg, J.; Harðarson, S.B.; Wiström, B.; Nielsen, A.B. Urban Tree Diversity for Sustainable Cities—Policy Brief; Nordic Forest Research: Joensuu, Finland, 2016. [Google Scholar]
  68. Watkins, H.; Hirons, A.; Sjöman, H.; Cameron, R.; Hitchmough, J.D. Can Trait-Based Schemes Be Used to Select Species in Urban Forestry? Front. Sustain. Cities 2021, 3, 54618. [Google Scholar] [CrossRef]
Figure 1. Location of the sites where measurements were collected in the Metropolitan Area of Mexico City (MAMC). The shaded area represents the MAMC and the solid line locates the boundary between Mexico City and the urban area in the State of Mexico. Abbreviation corresponds to LGUP: Luis G. Urbina Park; FVP: Francisco Villa Park; SLP: San Lorenzo Park; EP: España Park; MP: Mexico Park; BP: Bombilla Park; LVP: Los Viveros Park; and CU: green areas from Ciudad Universitaria.
Forests 13 01143 g001
Figure 2. Proposed urban park design conformed by a tree community module and its enlargement over time, from the initial planting ((A), 2 years) to full growth ((D), ≥20 years), growing differentially due to different species growth rates. Fast-growing trees exceed the other trees in size generating shade zones ((B), 15 years), while moderate-growth trees surpass slow-growing trees in size in the medium-term, ameliorating the environment by producing more shade zones whereas fast-growing trees have full growth ((C), ≥15 years).
Forests 13 01143 g002
Figure 3. Final outlook of a proposed urban park design of a tree community module showing three different internal profiles as A-A’, B-B’ and C-C’ cuts.
Forests 13 01143 g003
Figure 4. Realistic ambience of the B-B’ profile on Figure 3 of the proposed urban park design of a tree community during the growth stage (A,B) and at full growth (C,D) in the wet (A,C) and dry (B,D) seasons.
Forests 13 01143 g004
Table 1. Aesthetic characteristics (type of flower and fruit and flowering period), leaf area index (A, m2 m−2), diameter at standard height (DSH, m), crown diameter (CD, m), leaf size (LS, long (l, cm), wide (w, cm)), leaf habit (LH) and location for 15 dominant urban tree species (n = 4 for A, n = 10 for DBH and CD, n = 40 for LS) from eight urban green areas of Mexico City.
SpeciesFamilyFlowerFloweringFruitADSHHCDLS (l, w)LHLocation (Park)
Acacia longifoliaFabaceaeSmall yellow or golden-yellow Mainly during winter and early springA very elongated pod3.50.488.09.38.5, 1.4EvergreenCiudad Universitaria
Acer negundoSapindaceaeSeveral in a cluster, greenish-yellowSpringSamaras 1-seeded, pale yellow3.20.318.87.513.5, 8.6DeciduousLuis G. Urbina
Alnus acuminataBetulaceaeInflorescences are catkinsSpring and SummerLong dehiscent, woody brown fruits2.50.298.56.57.6, 3.7Evergreen /
deciduous
Ciudad Universitaria/
Viveros
Buddleja cordataLoganiaceaeSmall fragrant flowers, white, cream, or yellowSummer and early autumnCapsule fruit2.00.164.03.412.8, 5.3EvergreenCiudad Universitaria
Celtis occidentalisCannabaceaeGold/Yellow, green, orange, purple/lavenderSpringRound fleshy berry-like drupes4.60.338.59.511.1, 4.9DeciduousLuis G. Urbina
Ficus benjaminaMoraceaeInflorescences black, green, orange, purple/lavender, red/burgundySpring and SummerGlobose to slightly oblong fig5.40.7611.515.07.6, 3.4EvergreenBombilla/
Francisco Villa
Fraxinus uhdeiOleaceaeSmall and insignificant, without petals, green, white or yellowWinterBrown samaras4.40.2515.011.08.1, 3.5DeciduousSan Lorenzo/
Luis G. Urbina
Lagerstroemia indicaLythraceaeNumerous and irregular, gold/yellow,
pink,
purple/lavender,
red/burgundy,
white
Spring,
Summer, and Fall
Brown/copper capsule2.10.154.35.25.5, 3.1EvergreenCiudad Universitaria
Ligustrum lucidumOleaceaeSmall, perfect, creamy white flowersSummerBlack, blue druppe4.00.1513.08.16.3, 3.1EvergreenCiudad Universitaria
Liquidambar styracifluaHamamelidaceae Yellow-green flowersSpring and SummerBrown/copper capsule4.60.2713.611.07.5, 6.7DeciduousCiudad Universitaria/
Viveros
Populus albaSalicaceaeInflorescence catkinSpring and SummerWhite loculicidal capsules2.60.176.04.33.8, 3.7DeciduousLuis G. Urbina/
Bombilla
Populus deltoidesSalicaceaeInflorescence catkin, green
red/burgundy
SpringBrown/copper,
Green or white capsule
3.80.4713.39.311.1, 8.7EvergreenEspaña/Mexico
Quercus rugosaFagaceaePistillate catkins pubescentSpringAcorn3.10.175.57.813.6, 8.6Evergreen /deciduousViveros/
Francisco Villa
Robinia pseudoacaciaFabaceaeFragrant wisteria-like white flowersSpring and SummerBrown/copper,
purple/lavender legume
3.00.197.08.07.5, 4.4DeciduousViveros
Ulmus parvifoliaUlmaceaeInsignificant and reddish greenSpring,
Summer, and Fall
Brown/copper samara1.50.235.03.08.0, 3.7DeciduousViveros
Table 2. Averages of stomatal conductance (gS, cm s−1) transpiration (E, g m−2 s−1), cooling potential (CP, J m−2 s−1), net radiation (QN, W m−2), vapor pressure deficit (VPD, kPa), leaf temperature (TL, °C), and air temperature (TA, °C) of 15 dominant urban tree species from eight urban green areas of Mexico City. Species are ordered (Nr) accordingly to their transpiration (E) from high to low.
NrSpeciesgSECPQNVPDTLTA
1Liquidambar styraciflua3.810.035787.2365.52.7928.228.2
2Alnus acuminata3.520.035286.0119.72.9329.629.6
3Quercus rugosa3.650.034884.9345.03.3832.532.4
4Ligustrum lucidum2.890.032479.2475.02.7327.827.7
5Ficus benjamina3.010.030774.9112.22.6927.827.5
6Populus deltoides2.170.021552.5162.23.0129.629.2
7Fraxinus udhei2.60.019447.5355.32.9029.528.9
8Populus alba2.570.018745.5410.482.8028.528.3
9Celtis occidentalis2.850.016640.5295.132.8129.028.2
10Acer negundo2.100.013031.837.832.5126.925.9
11Acacia longifolia1.820.011728.6299.832.5626.826.7
12Ulmus parvifolia1.60.010826.4384.153.0130.130.1
13Robinia pseudoacacia1.620.010726.2462.173.2131.531.4
14Lagerstroemia indica1.260.010225.1346.52.0124.123.8
15Buddleja cordata1.080.008921.7482.982.1424.624.1
Table 3. Relationships among air temperature (TA), vapor pressure deficit (VPD) and transpiration (E) for 15 dominant urban tree species from eight urban green areas of Mexico City.
GroupSpeciesTAVPDE
1Lagerstroemia indica
Buddleia cordata
LowLowLow.
Air is nearly saturated with water vapor; therefore, the leaf cannot release water through stomata
2Alnus acuminata
Ulmus parvifolia
Quercus rugosa
Robinia pseudoacacia
HighModerateHigh.
VPD is favorable and leaf temperature is high
3Populus deltoides
Liquidambar styraciflua
Ficus benjamina
Fraxinus uhdei
Celtis occidentalis
Ligustrum lucidum
Populus alba
Acacia longifolia
HighModerateModerate.
VPD is favorable and leaf temperature is high
4Acer negundoLowHighLow.
Stomatal closure could avoid water loss and desiccation of leaves
Table 4. Cooling potential of a proposed urban park design of a tree community of six tree species in a space of 2500 m2 (50 m × 50 m) in one day and one hour. Values were calculated using the TUNEE model with an urban air temperature of 28 °C (TAU), net radiation of 680 W m−2, energy storage (urban fabric) of 252 W m−2, and latent and sensible heat of 94.0 and 392 W m−2, respectively. The values of the latent heat flux (QEP, W m−2) and the air temperature (TAP, °C) generated by each of the species, as well as the difference between the urban temperature and that of the park species (ΔT = TAPTAU, °C) are shown.
SpeciesQEPTAPΔT
Populus deltoides96.824.53.4
Alnus acuminata99.624.43.6
Celtis occidentalis86.424.93.1
Liquidambar styraciflua185.921.16.9
Quercus rugosa122.123.54.4
Ficus benjamina187.721.07.0
Weighted average142.722.75.3
Publisher’s Note: MDPI stays neutral with regard to jurisdictional claims in published maps and institutional affiliations.

