Article

Quantifying Vegetation Stability under Drought in the Middle Reaches of Yellow River Basin, China

College of Geomatics, Xi’an University of Science and Technology, Xi’an 710054, China
*
Author to whom correspondence should be addressed.
Forests 2022, 13(7), 1138; https://doi.org/10.3390/f13071138
Submission received: 7 July 2022 / Accepted: 18 July 2022 / Published: 19 July 2022
(This article belongs to the Section Forest Meteorology and Climate Change)

Abstract

:
Under the background of climate warming, the increase in the frequency and severity of drought leads to vegetation facing severe challenges. A comprehensive and systematic assessment of the stability of vegetation under drought stress in the middle reaches of Yellow River basin (MRYRB) will help to grasp the characteristics of vegetation response to drought. In this study, the normalized difference vegetation index (NDVI) was used to achieve quantitative and qualitative assessments of vegetation stability to drought, and the smoothed monthly standardized precipitation evapotranspiration index (SPEI) was used to describe the characteristics of drought events in 2005/2006 and identified vegetation stability parameters using a standardized anomaly of NDVI across space, which included the resistance duration, resilience duration, drought threshold, and lag time. Vegetation was dominated by less resistance and less resilience. The 2005/2006 drought event affected most of the study area, and vegetation growth was inhibited. The duration of vegetation resistance over 100 days accounted for 65.7%, and vegetation in 89.4% of the regions could return to normal within 100 days. The drought threshold of vegetation gradually decreased from northwest to southeast, and the lag time was mainly concentrated from 1 to 3 months. These findings contribute to a better understanding of the effects of drought on the environment, as well as scientific references for reducing ecological, economic, and social losses in future droughts, and promoting ecological environmental governance and high-quality development in the MRYRB.

1. Introduction

Drought is a complex phenomenon that is the most destructive of all natural hazards and can lead to serious ecological hazards [1,2,3]. Increased water stress will lead to more frequent and severe droughts in semi-arid regions. Vegetation provides a wide range of ecosystem services that are essential for maintaining biodiversity, and a range of evidence suggests that increased CO2 concentrations result in vegetation gains and increased leaf area index [4], and improved water use efficiency [5]. However, drought may reduce this benefit. Most studies have shown that drought has a significant negative effect on vegetation growth, when the water stress triggered by reduced precipitation cannot meet the transpiration demand of vegetation. Within a certain threshold, vegetation structure and function are changed and growth is inhibited; when crossing an ecological response threshold, vegetation will die and be replaced by other species, resulting in a secondary succession of vegetation [6,7]. Additionally, in the context of global warming, evapotranspiration increases [8], vegetation transpiration is accelerated, and the negative effects of regional drought on vegetation may be amplified [9,10].
As the rate of climate change is slow relative to vegetation evolution, there is an urgent need to assess its stability for further maintenance of vegetation productivity under future climate states [11]. Vegetation stability assessment, including resistance and resilience, quantifies the direct effects of drought on vegetation and is an important indicator of the ability of vegetation to withstand drought risk [12]. Resistance is defined as the ability of vegetation to maintain its basic structure, processes, and functions under stress, disturbance, or species invasion, whereas resilience is defined as the ability of vegetation to self-regulate until it returns to normal after being subjected to external disturbance. After disturbance, vegetation responds to the external environment by regulating its own resilience, however, frequent drought disturbances reduce vegetation stability, accelerate environmental changes, and deplete vegetation’s ability to resist and overcome risks [13]. Vegetation resistance and resilience are closely related to vegetation type and attributes associated with drought stress [14,15]. Analyses of vegetation stability often include quantitative estimates of vegetation characteristics based on climatic anomalies. Huang et al. [16] quantified the temporal stability of biomes on a global scale based on a satellite-derived vegetation index, and demonstrated that evergreen broadleaf forests have a higher resistance to drought risk; Li et al. [17] used a vegetation standardized ring width index to compare gymnosperms and angiosperms, and found that gymnosperms had reduced resistance, increased resilience, and increased sensitivity to drought. However, they ignored the potential problem that previous studies have often failed to consider the effect of the degree of disturbance due to water stress, which could lead to a possible underestimation of the resilience of disturbed vegetation. There are also unresolved issues, such as the adaptive water uptake strategy to resist (or adapt to different) drought conditions, how long vegetation’s resistance to drought risk is maintained, and the resilience duration after drought.
Not all droughts have the same effects, and previous studies have shown that vegetation responses to drought are spatially heterogeneous and species-specific [18], the severity and duration of droughts can vary, as can the impact on vegetation [19]. The physiological mechanisms behind the drought response of vegetation are well understood, but quantitative descriptions are lacking at the regional scale. Moreover, little is known about the threshold of vegetation response to drought, and the extent to which drought can have a serious impact on vegetation is an issue that needs to be addressed. Therefore, it is crucial to effectively assess the degree of vegetation response to different characteristics of drought disturbances, to improve vegetation stability, and to determine the potential of vegetation to cope with drought events [17].
In arid and semi-arid regions of the middle reaches of Yellow River basin (MRYRB), vegetation has high sensitivity and vulnerability to drought. Subject to the innate natural conditions, the region has developed toward a warm-dry trend in recent decades and is highly susceptible to drought, with winter and spring being the high drought periods and drought frequency as high as 75% [8]. The frequency of moderate and severe drought is as high as 80%, and extreme drought also occurs from time to time [20]. The increasing dryness and disconnection of rivers due to drought has accelerated the land desertification and vegetation degradation in the study area. Based on this, it is necessary to systematically assess the effects of drought on vegetation in the MRYRB and provide important information for mitigating the effects of drought on vegetation productivity. According to the Bulletin of Flood and Drought Disaster in China and Yellow River Water Resources Bulletin, the annual precipitation in the MRYRB of 2005/2006 was lower than the multi-year average, and the proportion of drought-damaged cropland area was higher, which adversely affected vegetation growth.
In this study, we assessed the stability of the vegetation in the study area, a monitored drought event during June 2005–August 2006, based on the smoothed standardized precipitation evapotranspiration index (SPEI), and used the standardized anomaly normalized difference vegetation index (NDVI) to spatially identify the stability parameters, including resistance duration, and resilience duration. In particular, we define drought threshold and lag time, and include them as stability parameters. The goal of this study is therefore to address the following questions: (1) How is vegetation stability distributed in the study area? (2) What is the threshold and lag time for drought to have a severe impact on vegetation during the drought event? (3) How do drought characteristics and vegetation types affect the resistance duration and resilience duration?

2. Materials and Methods
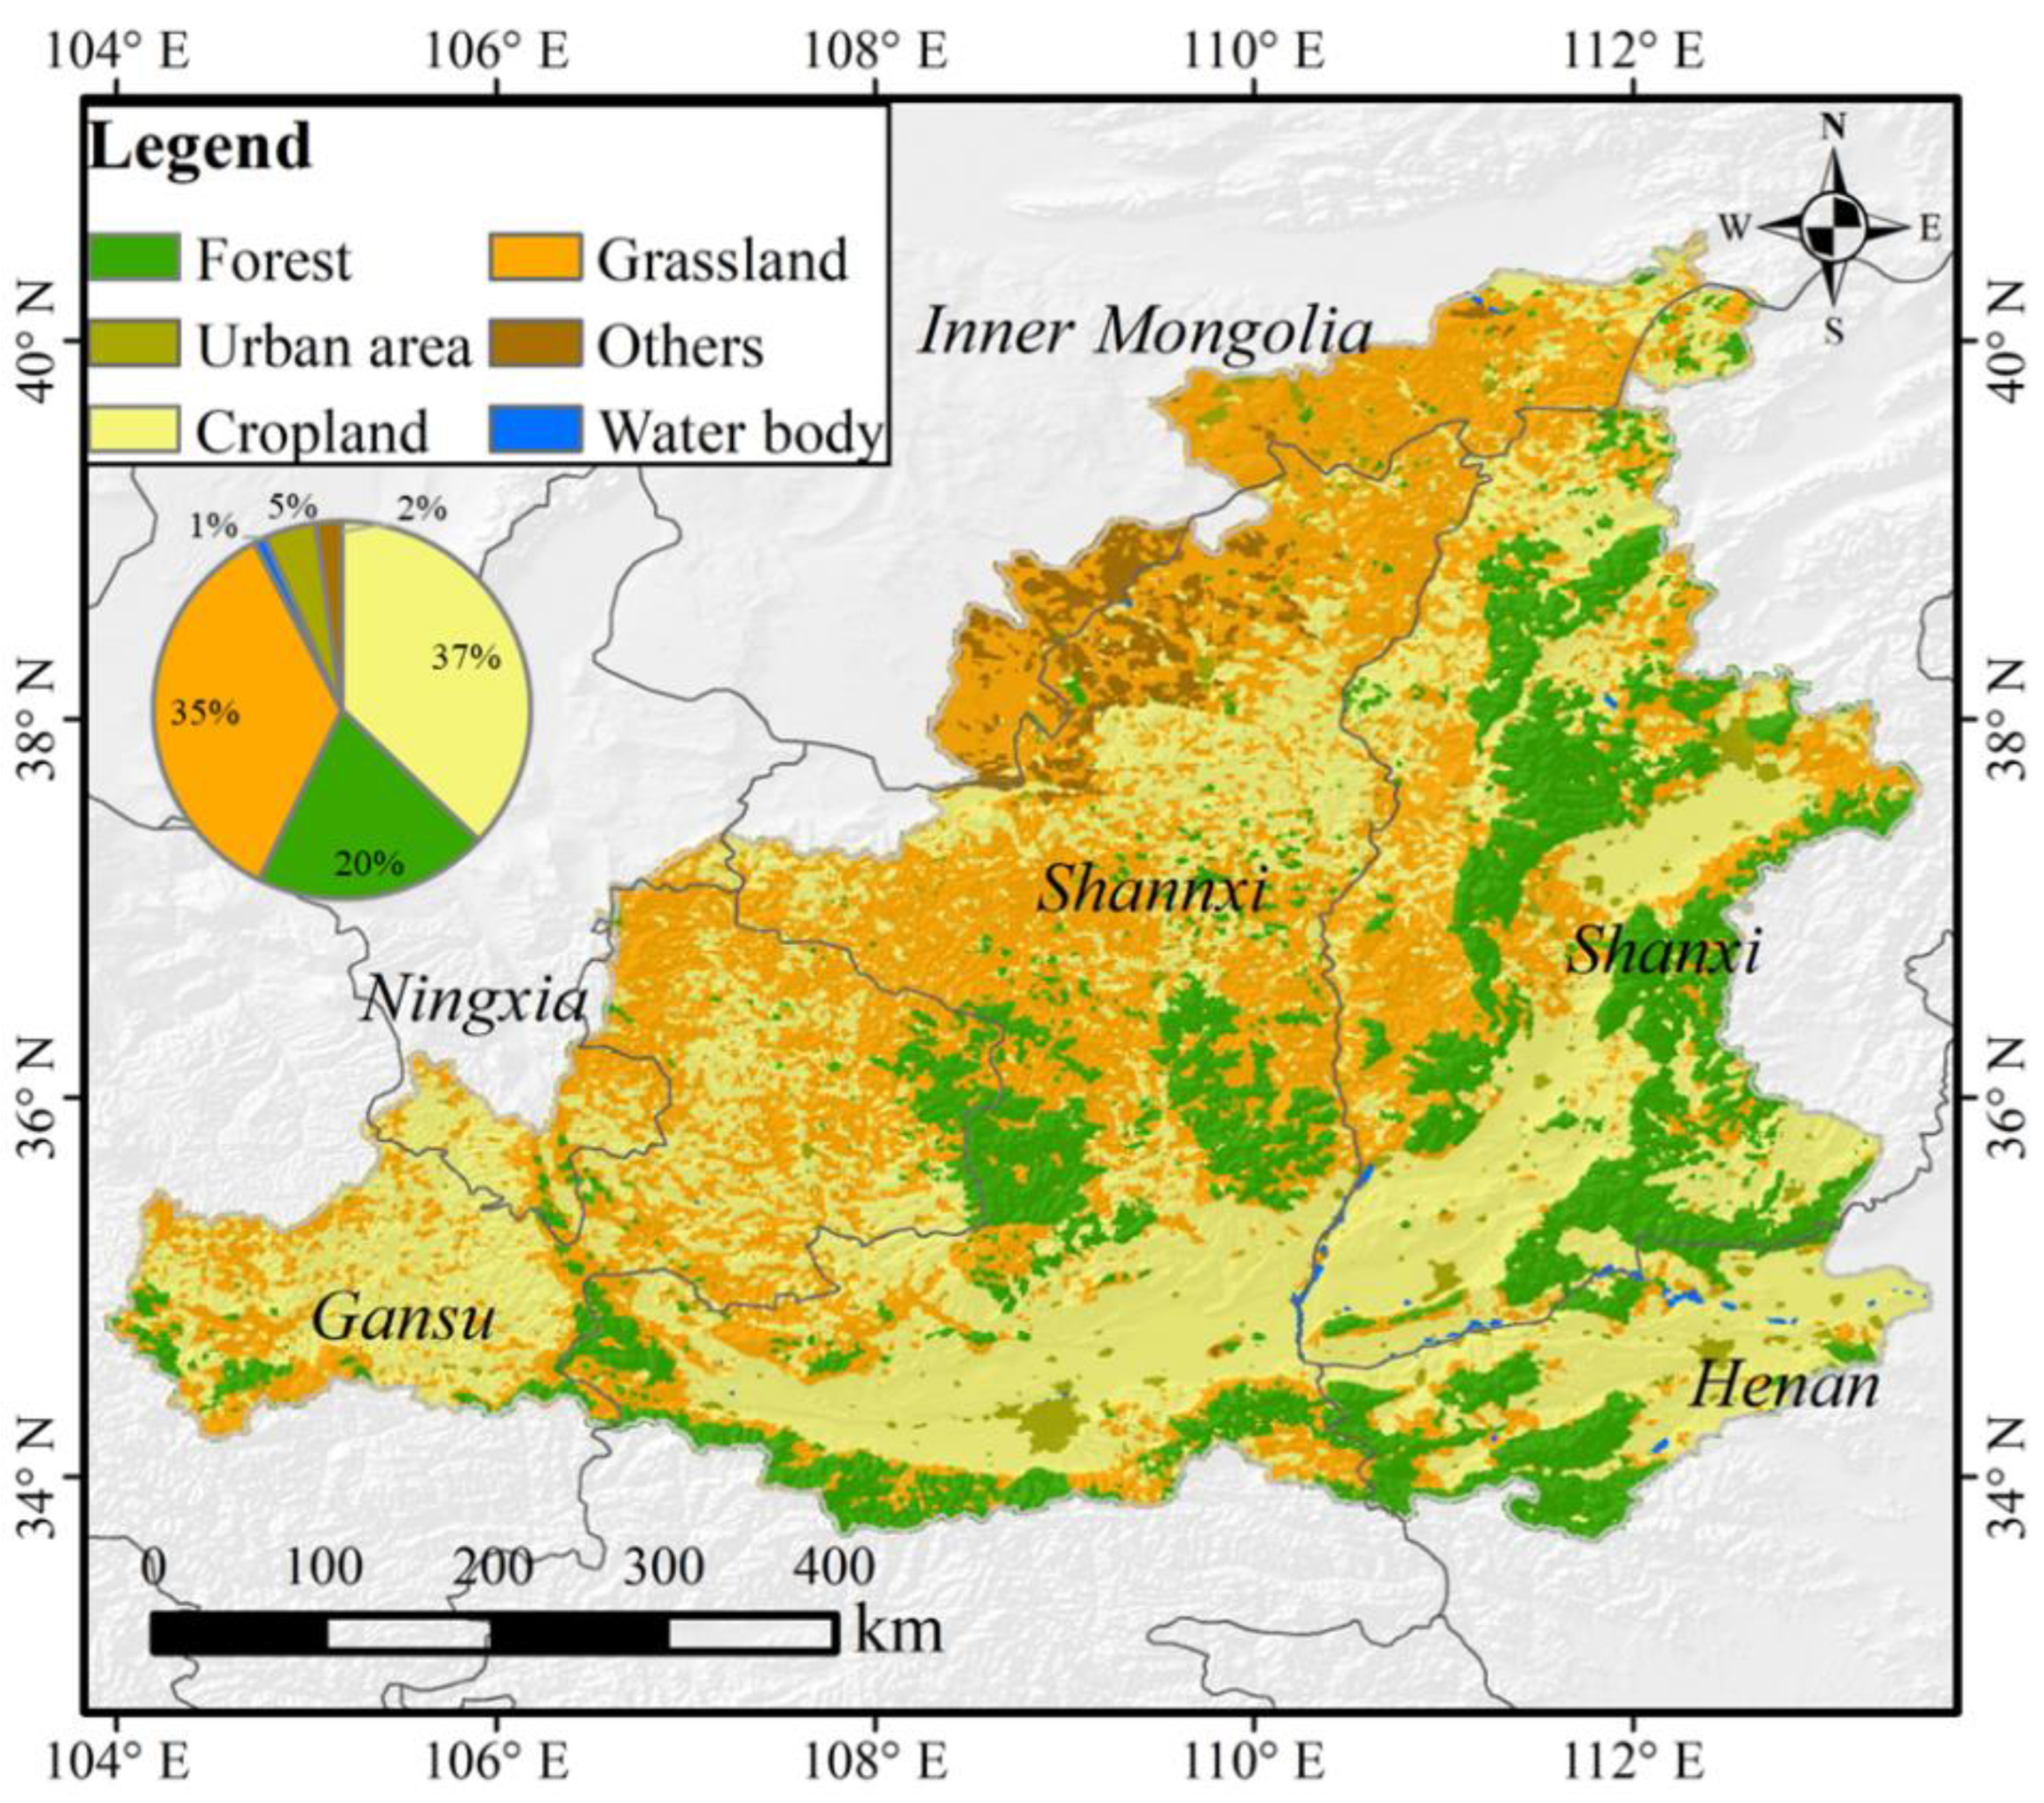
2.1. Study Area

The MRYRB is located in the section of the Yellow River between Hekou Town, Toketo County, Inner Mongolia and Taohuayu, Zhengzhou, Henan Province, which ranges from 32° N to 42° N and 104° E to 112° E, with a length of about 126.04 km and a total area of about 3.44 × 10⁵ km2, accounting for 43.3% of the area of the Yellow River basin (Figure 1). The region covers many highly populated areas in six provincial administrative regions (Gansu, Ningxia, Inner Mongolia, Shaanxi, Shanxi, Henan). The MRYRB flows through the core area of the Loess Plateau where precipitation is low and spatial and temporal distribution is uneven. The annual precipitation is between 300 mm and 800 mm, mostly concentrated in June–September, accounting for more than 60% of the whole year. Heavy rainfall concentration is coupled with special loess soil, where erosion resistance is weak, making the study area one of the most serious soil erosion areas in the world. The study area is in a semi-arid zone with strong evaporation and an annual evaporation of 1284.7 mm [21]. The excessive evaporation capacity makes the MRYRB highly susceptible to drought. Related studies show that a longer, more extensive and more severe drought will occur in the MRYRB [22,23].

2.2. Data Sources and Processing

2.2.1. Normalized Difference Vegetation Index

This study uses two types of NDVI datasets: the Système Pour l’Observation de la Terre VEGETATION NDVI (SPOT-NDVI) dataset covers the period from January 2000 to May 2014, which is derived from atmospherically corrected surface reflectance data using pair-band synthesis techniques. In this study, the S10 product was used, and the international maximum synthesis method was used to synthesize the 10-day data. The data are converted to a true value by the following formula:
N D V I = a × D N + b
where, D N is the digital value, a and b values are 0.004 and −0.1, respectively.
The Project for the Onboard Autonomy-Vegetation NDVI (PROBA-NDVI) dataset covers the period from June 2014 to December 2018. As a continuation of the SPOT-Vegetation mission, its spectral range is roughly the same as that of the SPOT series of vegetation sensors [24]. A reference quality assessment of the PROBA-NDVI product was performed by the Flemish Institute of Technology (Vito, Belgium) and showed no significant systematic deviations between SPOT-NDVI and PROBA-NDVI, and can be used to jointly monitor vegetation dynamics [25]. The DN values are converted to the corresponding standard NDVI values by the following formula:
P V = ( D N O F F S E T ) / S C A L E
where, P V is the physical value and D N is the digital value. For Proba-NDVI, the O F F S E T and S C A L E values are 20 and 250, respectively.
The above two datasets were obtained with a temporal resolution of 10 days and a spatial resolution of 1 km from the European Space Agency (http://www.vito-eodata.be/ (accessed on 10 March 2022)).

2.2.2. Standardized Precipitation Evapotranspiration Index

The start, end, duration, and severity of drought events in the MRYRB were identified using the 1-month SPEI in this study. The SPEI at the temporal of the 1-month dataset (SPEIbase v2.6) was accessed from the Consejo Superior de Investigaciones Científicas (CSIC) (http://digital.csic.es/handle/10261/153475 (accessed on 5 March 2022)), which has 0.5° spatial resolution and a monthly time step temporal resolution, and its coverage is between January 2000 and December 2018. The calculation of the PET in the SPEI dataset is based on the FAO-56 Penman-Monteith method [26]. The reliability of this dataset has been confirmed and has been widely used in related research [27,28]. SPEI data were interpolated to 1 km using the inverse distance weight (IDW) method of ArcGIS 10.4 to match the spatial resolution of NDVI, which is an efficient and intuitive method for spatial analysis [29].

2.2.3. Land Cover Data

Land cover data with a spatial resolution of 1 km for 2018 were obtained from the Resource and Environment Science and Data Center (http://www.resdc.cn (accessed on 10 March 2022)). This dataset is generated by remote sensing images with a manual visual interpretation method. The quality has been controlled and integration has been checked [30]. In this study, six level I categories were reclassified as forest, grassland, cropland, water body, urban area, and others. We considered three major land cover groups, including forest (20%), grassland (35%) and cropland (37%). The spatial distribution of land cover types is shown in Figure 1.

2.3. Method

2.3.1. Resistance and Resilience

NDVI is one of the most widely used indexes to reflect the state of vegetation, and therefore can be a good indicator of the resistance and resilience of vegetation to drought events [31]. Resistance ( Ω ) and resilience ( Δ ) are the widely used methods for describing the stability of vegetation, which can be calculated by the following formula [31]:
Ω = Y n ¯ | Y e Y n ¯ |
Δ = Y d Y m
where, Y n ¯ represents normal conditions, which means NDVI without drought (SPEI > −0.5), Y e represents the occurrence of drought, Y d represents NDVI in the driest period (SPEI reached the lowest value during the study years), Y m represents the mean value calculated over the period of 2000–2018. Both indicators are unitless and can be used for comparison between different vegetation types [31]. Classification of vegetation resistance and resilience in the MRYRB is based on Natural Breaks (Jenks) [32] (Table 1).

2.3.2. Standardized Anomaly

The effectiveness and variability of NDVI in regional vegetation drought stress monitoring was further analyzed by calculating the standardized anomalies of the vegetation index with the following formula [33]:
S A ( i , j ) = V I ( i , j ) V I ( i , j ) ¯ S T D ( V I ( i , j ) ¯ )
where, S A ( i , j ) is the standardized anomaly of NDVI; V I ( i , j ) is the value of NDVI at the ith grid for the jth month during the drought event, V I ( i , j ) ¯ is the mean value of NDVI at the ith grid for the jth month during the reference period (2000–2018), S T D ( V I ( i , j ) ¯ ) is the standard deviation of the index at ith grid for the jth month over the reference period.

2.3.3. Identification of the Drought Characterization at Grid Cell Level

The SPEI is smoothed for a three-month running average to avoid unreasonable interruptions in long continuous dry periods due to a single wet month [34]. Here, the smoothed SPEI is used for identifying the start and end times of drought events. Then, the characteristics of drought event can be described by the characteristics as Figure 2a. The formulas for calculating drought duration (DD) and drought severity (DS) are as follows [34]:
D D = D α D β
D S = i = D α D β S P E I i
where, D α represents the drought start time, which is defined as the first month with SPEI below the threshold, D β represents the drought end time, which is defined as SPEI above the threshold for the first month, S P E I i is the SPEI value of the ith month during the drought event. Following grades of meteorological drought in the National Standards of the People’s Republic of China and related study [35], the threshold is set at −0.5. The smaller the value of SPEI, the greater the corresponding drought severity by the calculation principle of SPEI.

2.3.4. Identification of the Vegetation Stability Parameters at Grid Cell Level

In order to reflect the short-term effect of drought on vegetation, this study used NDVI with a 10-day scale after standardized anomaly processing (SANDVI) to monitor the vegetation stability parameters. The stability of vegetation during typical drought events will be evaluated in terms of resistance duration, resilience duration, drought threshold and lag time. The resistance duration (RD1) and resilience duration (RD2) are calculated as follows [15,34]:
R D 1 = T β T α
R D 2 = T γ T β
where, T α represents the damaged time, the first time of the SANDVI less than the threshold (−0.5) [34], which means drought is starting to negatively impact vegetation. T β represents the most damaged time, which was defined as the day when SANDVI reached the minimum value during drought events, T γ represents the recovery time, the first time when SANDVI changed from −0.5 to above −0.5, which means vegetation is relieved from the drought (Figure 2b).
The definition of drought threshold and lag time when vegetation is damaged in this study is shown in Figure 2c–e, where the standardized anomaly of NDVI is less than the threshold, which means that drought has a serious negative impact on vegetation, and considering the cumulative effect of drought [36], the corresponding SPEI value and accumulated value from a few months ago is defined as the drought threshold. Here we set the threshold of SANDVI at −1.5 because it effectively captures the extreme anomaly in the 2005/2006 drought event. With this threshold of −1.5, we found that SANDVI was above that level for more than 95% of the grids in this region. The lower the drought threshold, the stronger the ability of vegetation to resist risks. Because of the legacy of drought, vegetation growth could be more affected by previous drought conditions, and there is a lag time between vegetation and drought [37].

3. Results

3.1. Qualitative Description of Vegetation Stability

Higher resistance and resilience can effectively resist the negative effects of drought on vegetation. The vegetation resistance in the study area is generally less, but the resilience is fair. Most of the areas have less resistance and resilience and show large spatial differences (Figure 3). Spatial differences existed in the distribution of vegetation resistance, showing more in the southeast and less in the northwest. 78.9% of the regions had less vegetation resistance (resistance < 10), and only 11.7% of the regions had more resistance (resistance > 14), which were mainly concentrated in the southeast of the study area (Figure 3a). Similar to the spatial distribution pattern of resistance, the overall vegetation resilience showed an increasing trend from southeast to northwest. The vegetation was dominated by less (resilience < 0.8) and fair (0.8 < resilience < 1.2) resilience, accounting for 41.6% and 58.9% of the area, respectively (Figure 3b). In central Shaanxi, northwestern Henan, and parts of Shanxi, vegetation had more resistance and fair resilience, and had a strong ability to cope with drought events. In most areas of the northwestern part of the study area, the vegetation resistance and resilience were less, and the occurrence of drought events caused great damage to vegetation in these areas. In the south and east of the MRYRB, the cropland and forest interlaced belts had more resistance and fair resilience. Very few areas existed with less resistance to drought, but more resilience (Figure 3c).

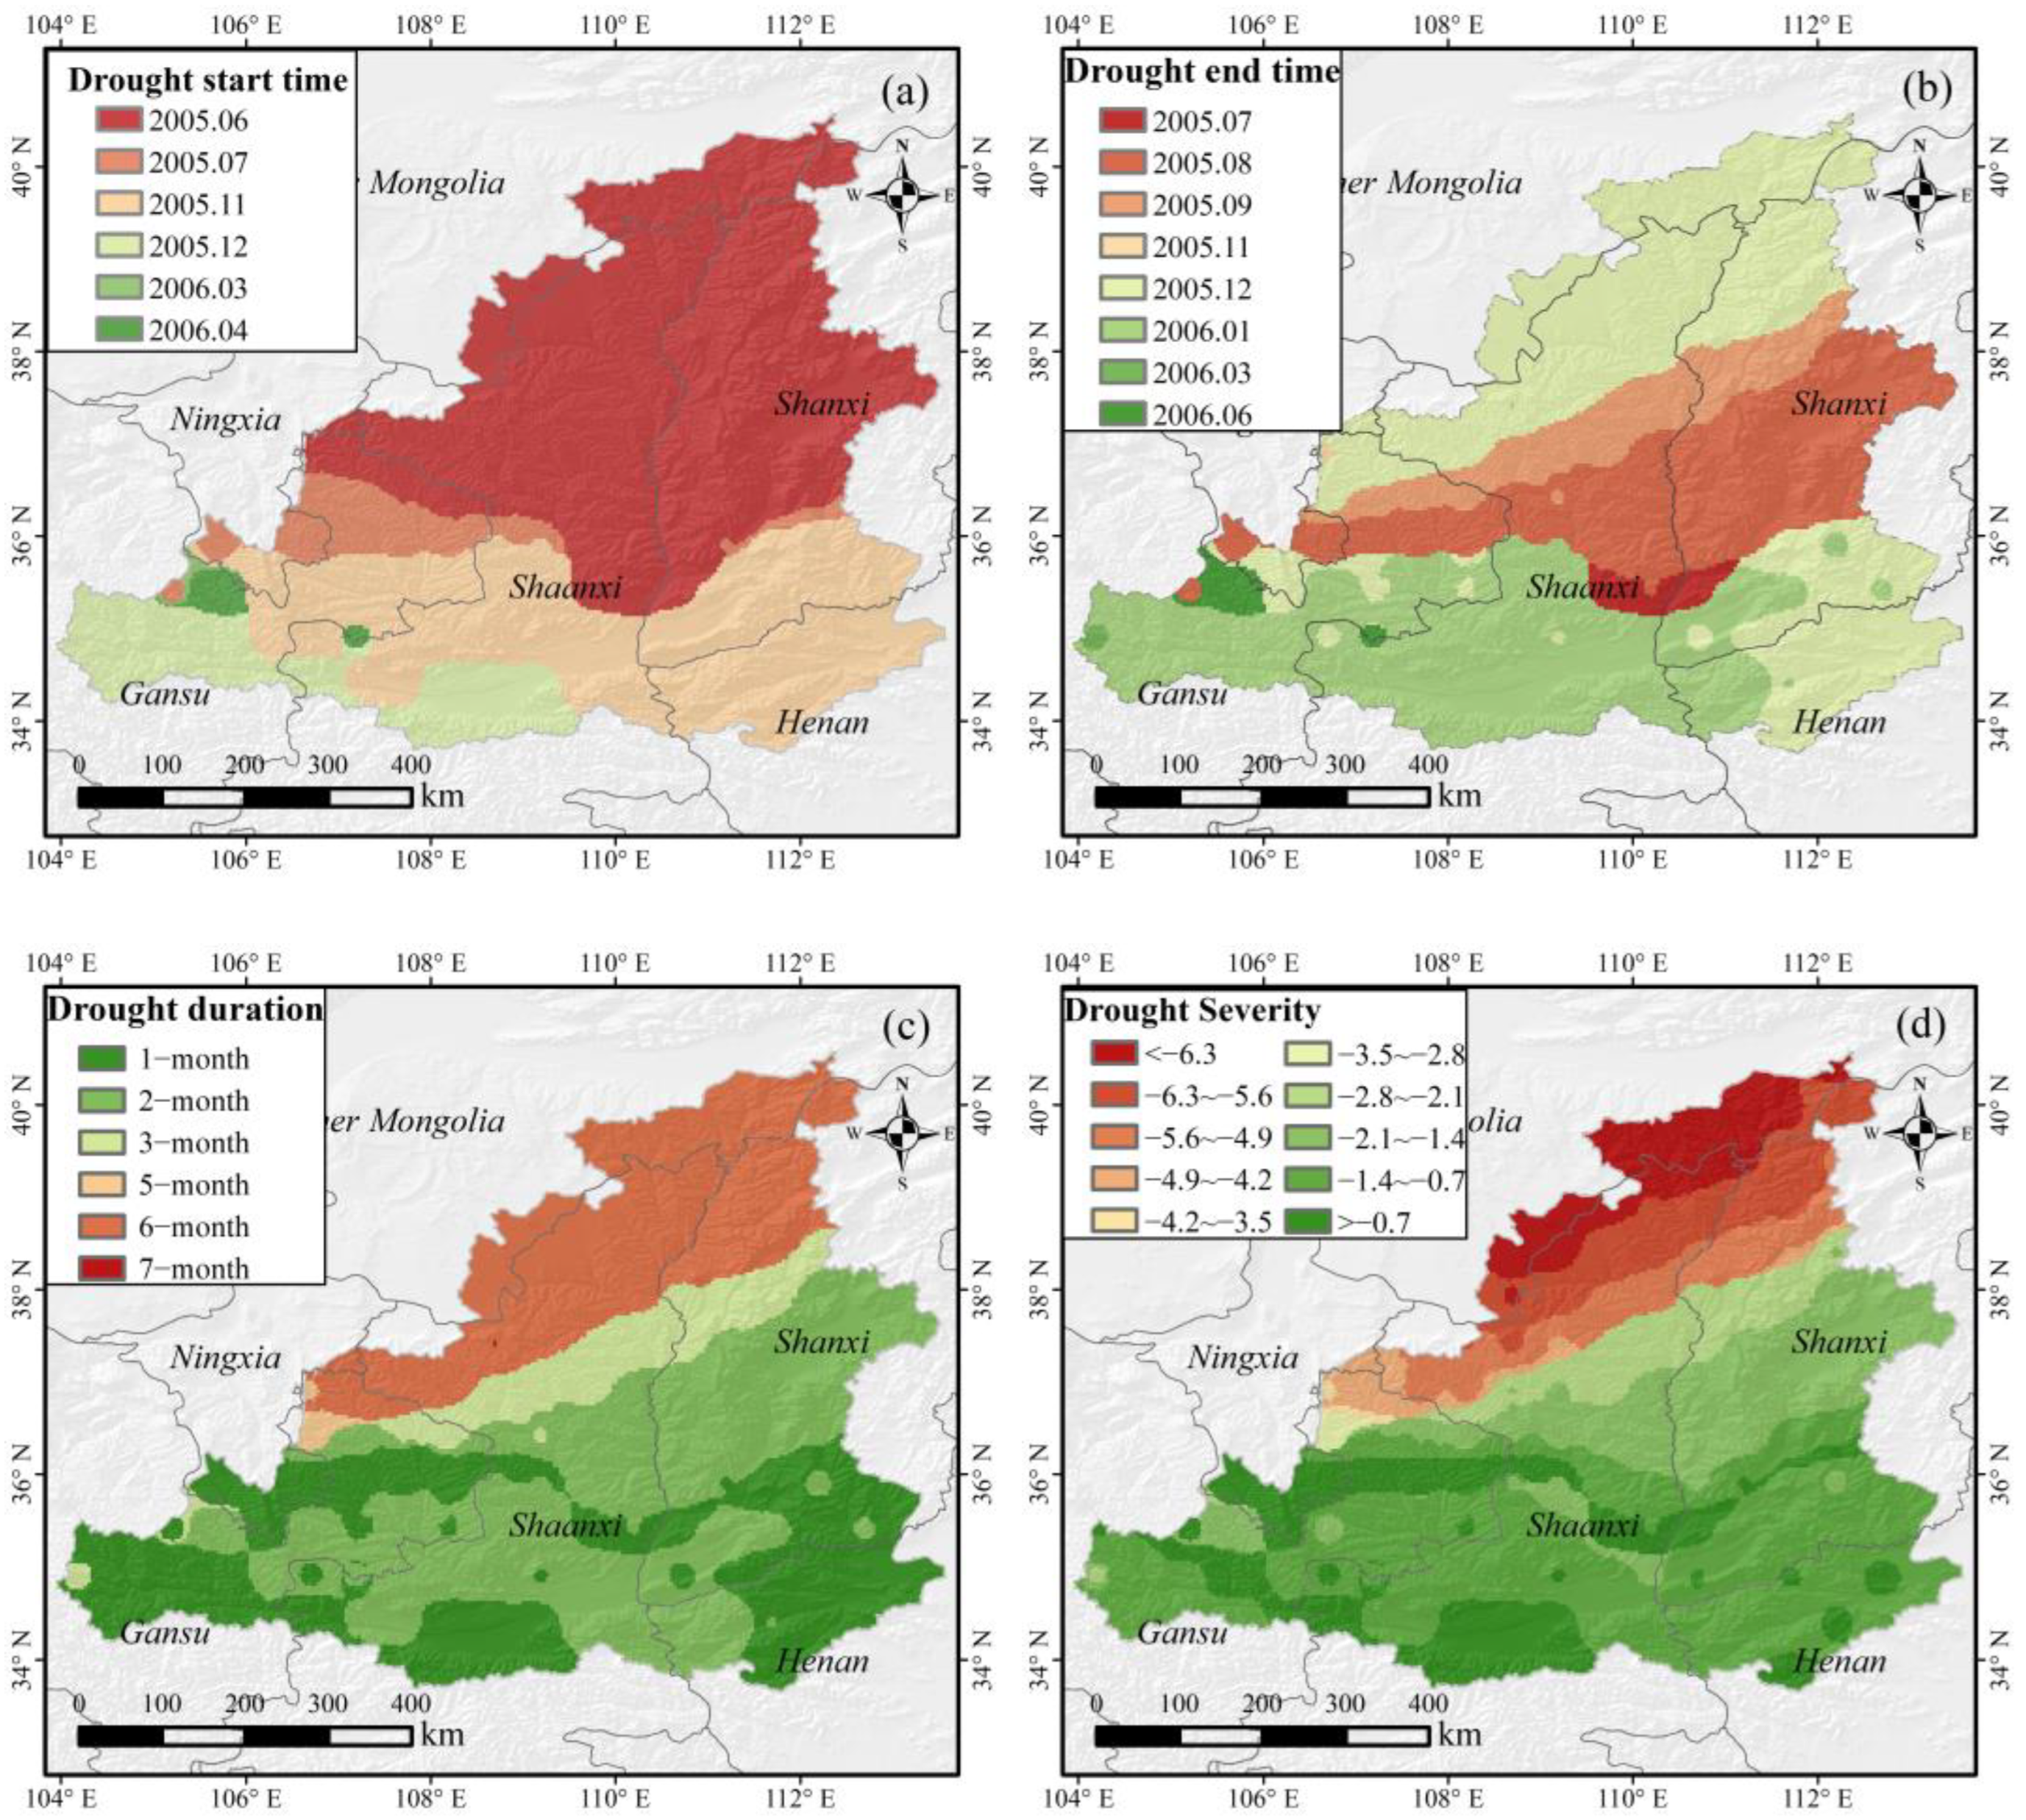
3.2. The Characteristics of the 2005/2006 Drought Event

The drought events in 2005/2006 were mainly composed of summer droughts and winter–spring droughts, which affected most of the study area. There is a large spatial variation in the drought characteristics identified by the smoothed SPEI, including the start time, end time, drought duration, and drought severity (Figure 4). As Figure 4a,b show, this drought event started in the north of Shaanxi and Shanxi in June 2005, and gradually expanded and finally reached the south of the study area in the winter of 2005. 57.5% of the area started to become dry in June–July 2005, and 41.3% of the area started to become dry in November–December 2005. The drought event first faded in the middle of Shaanxi and Shanxi before the winter of 2005, however, most of the southern part of the MRYRB was released from the drought after January 2006.
The drought duration and drought severity have similar spatial distribution patterns. The drought duration was more than 3 months in 25.3% of the regions, which was mainly distributed in the northwest, lasting only one month in 28.4% of the regions. The drought that lasted for 2 months accounted for the largest proportion of the regions, as high as 37.9%. The drought severity in 24.9% of the areas was less than −3.5, of which the severity of drought was less than −6.3, accounting for 7.7% of the area, and the area with a severity greater than −0.7, accounting for 15.5% of the area. The longer drought duration and extreme drought severity in the northwest part of the study area contrasted with a lighter drought in the south with a shorter duration and reduced severity.

3.3. Spatial Distribution of Vegetation Stability Parameters

Spatial heterogeneity in relation to vegetation during drought events (Figure 5). In the 2005/2006 drought event, drought began to negatively affect vegetation earlier in the south; vegetation in areas such as the Guanzhong Plain was damaged as early as June 2005, whereas in the northern part of the study area, such as Inner Mongolia, and northern Shaanxi, the vegetation began to have a negative affection in January 2006. Vegetation in 97.7% of the regions had negative anomalies in 2005, and only 2.3% of the regions had negative anomalies until 2006 (Figure 5a). Vegetation vitality in the northwest mainly recovered from September to October 2005, whereas the northeast region mainly recovered from March to May 2006, and the recovery time of vegetation was predominantly in 2006. The areas with recovery time after June 2006 were mainly concentrated in southeast Ningxia (Figure 5b). The vegetation resistance duration was more than 100 days in 65.7% of the area, and 9.5% of the area was more than 200 days, mainly distributed in the southeastern part of the study area (Figure 5c). The resilience duration was longer in the north, and 89.4% of vegetation could return to normal within 100 days, but 0.4% of the vegetation needed more than 6 months to return to normal (Figure 5d).
In the northern part of the study area, the vegetation damaged time was mainly from November 2005 to January 2006, and the recovery time was concentrated from March to May 2006. The resistance duration and resilience duration were mostly about 60 days and 100 days, respectively. Although vegetation in the southern part of the study area was damaged earlier, it had a longer resistance duration to drought and the early water stress had little effect on vegetation in the area. Parts of Gansu and Shaanxi provinces close to Gansu had a closer damaged time and recovery time, so the resistance and resilience durations in these areas was short. At the intersection of the three provinces of Ningxia, Shaanxi and Gansu, evidenced by a longer duration and extreme severity, which makes the damaged time in this area early, the recovery time is late, and the duration of resistance and resilience is longer.
The lower the drought threshold, the stronger the stability of vegetation. The drought event substantially damaged vegetation productivity, as shown in Figure 5e: over 70% of the vegetation experienced significant negative anomalies. The average value of the drought threshold in the MRYRB was −2.62, the upper threshold was −7.12, and the lower threshold was −0.51 during the drought event. The drought threshold gradually decreased from northwest to southeast, and it was less than −3 accounted for 34.1% of the area, which was mainly distributed in the southeast of the study area. The areas where drought has little effect on vegetation are mostly densely forested, and the areas where forest is not affected amount to 23.2%, indicating that the forest was rarely affected by short-term and less-severe droughts. At the junction of northern Shaanxi and Inner Mongolia, the drought threshold is the lowest, mostly concentrated above −4.9.
Analysis shows that drought has a lagging effect on most parts of the MRYRB (Figure 5f). Consistent with previous studies [38,39], the lagged months were mainly observed at short time scales (1–3 months), and the area percentage with a 3-month lag was the maximum (59.9%), followed by a 2-month lag (14.7%). These two lag time scales are widely distributed in the MRYRB, concentrated in the central and northeastern parts of the study area. The lag time of 6 months or more accounted for 12.7% of the region, mainly in the junction of Shaanxi and Gansu.

4. Discussion

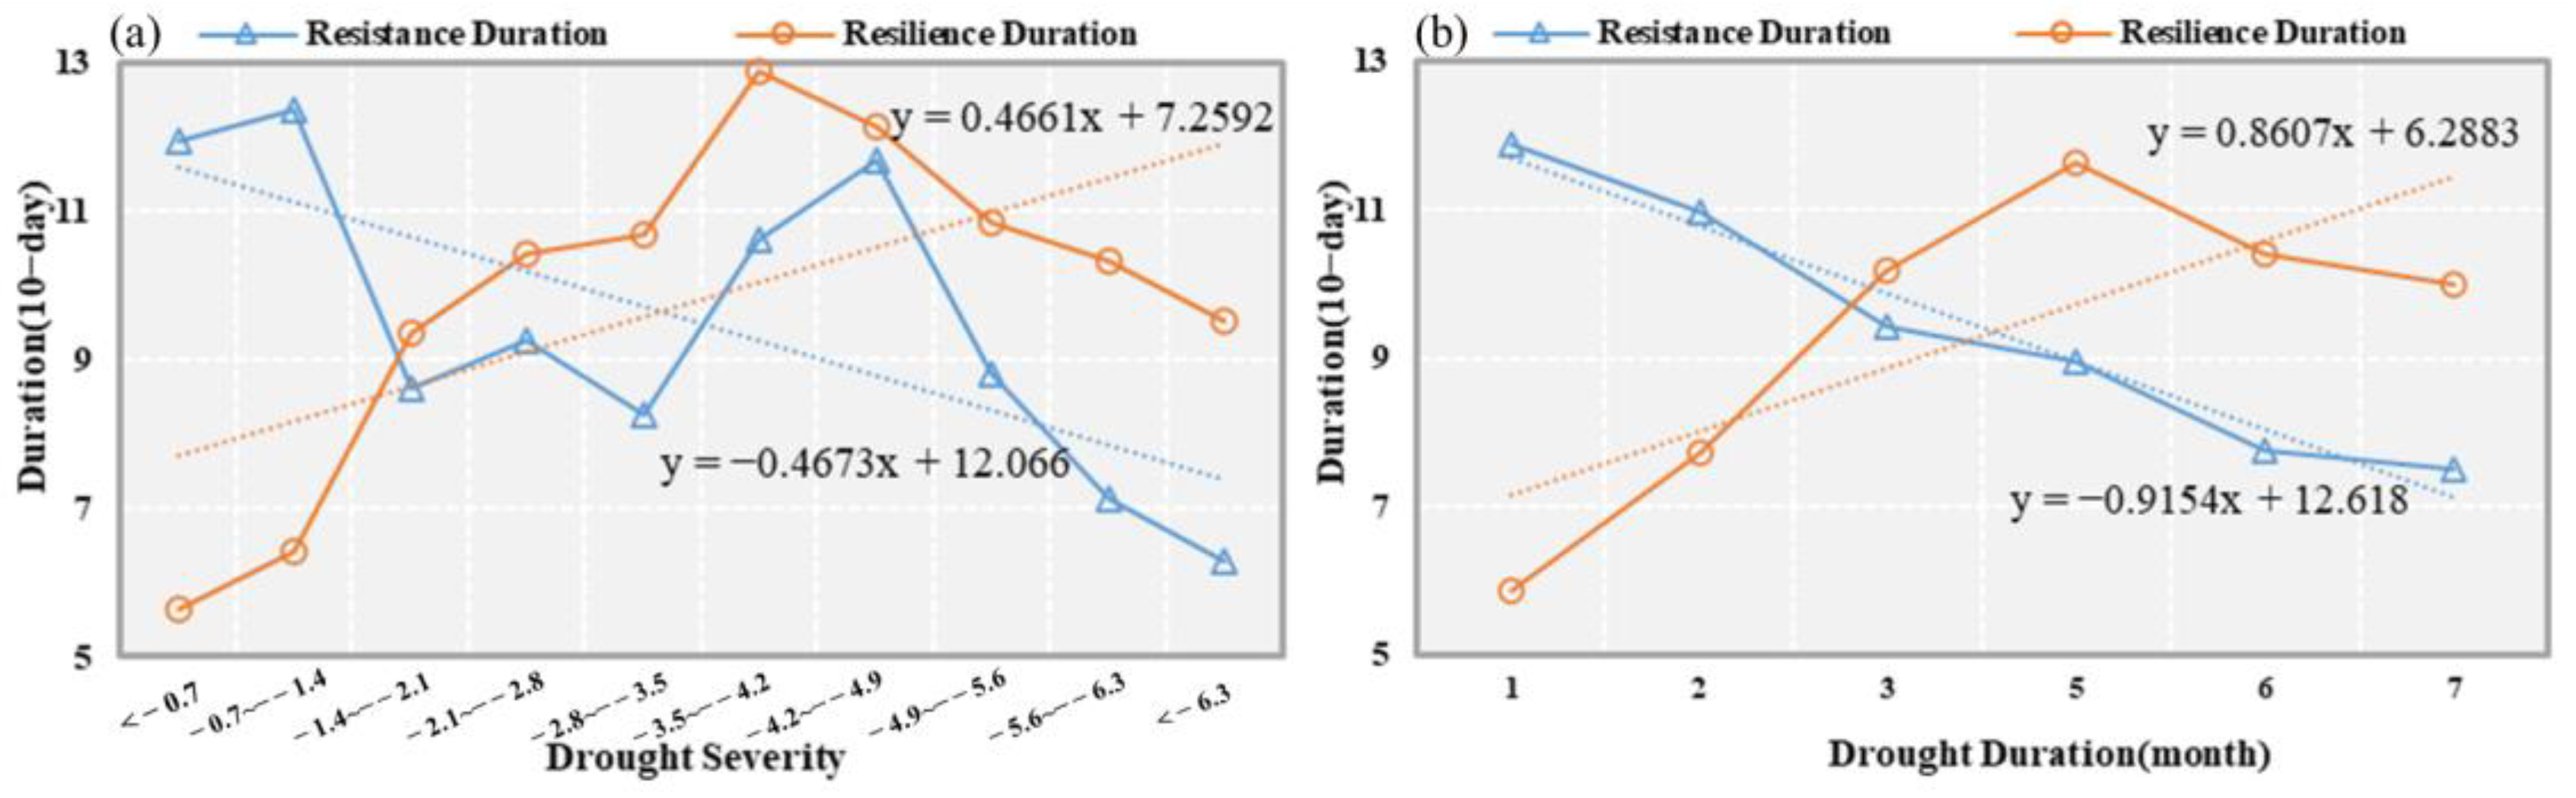
4.1. Impact of Drought Characteristics on Stability

Vegetation resistance duration during drought and resilience duration after drought are closely related to the degree of drought damage [40,41]. In the process of increasing drought severity, the vegetation resistance duration and resilience duration fluctuated greatly, but in general, the resistance duration showed a downward trend. Contrastingly, the resilience duration showed an upward trend, and with the increase in drought duration, the resistance duration of vegetation is trending down, and the resilience duration is trending up (Figure 6).
It is generally believed that the increase in the duration and severity of drought weakens the ability of vegetation to be resistant and resilient during a drought event, which was a strong linear predictor for vegetation stability [6]. While in the initial stage of drought, the vegetation-related capacity does not decrease immediately, but fluctuates. Contrastingly, during the drought stress and vegetation response phases, a decrease in precipitation leads to a decrease in soil moisture, which is usually accompanied by an increase in temperature and evapotranspiration demand from the atmosphere, which together lead to vegetation water stress. Evaporation will decrease, reducing the rate at which moisture in the soil falls [40,42]. Contrastingly, the vegetation itself will change under climate change scenarios, especially under the warm-dry climate area. Vegetation has a certain adaptability to the environment [43], and within the damaged threshold, vegetation can improve its resistance to risk by adjusting its physiological structure with the deepening of drought severity. Especially in areas with high vegetation coverage, where the leaf area on the ground surface is large and the root system is deep, the developed root system can increase the ability of vegetation to adapt to drought and stabilize water storage under water stress conditions. This function is an important mechanism for the active adaptation of vegetation to climate change [44]. Therefore, in the process of vegetation gradually adapting to the environment, the resistance duration fluctuated or even increased with the increase in drought severity (Figure 6a). After reaching a certain level, the resistance duration decreased steadily. There was a strong negative correlation between drought duration and resistance duration, and vegetation resistance duration decreased gradually with the extension of drought duration (Figure 6b). The recovery of vegetation root function after drought depends on the severity and duration of the drought, as well as the degree of root damage and death. Effective precipitation is a sign of the end of a drought event, which is the fraction of natural precipitation that actually replenishes soil moisture to the root layer of vegetation [45]. Dry-rewetting events can reduce the natural loss of vegetation after the drought ends. Suitable precipitation causes a burst of decomposition and N- and C-mineralization, which enables vegetation to rapidly develop nutrient resources after drought release, speeding up recovery [41]. However, the factors affecting vegetation stability parameters are not only drought characteristics. Some areas in the southern part of the study area have a shorter drought duration but a longer vegetation resistance duration. This situation may occur because of: (1) the time-lag effect of drought; (2) the cumulative effect of NDVI; (3) other elements that inhibit vegetation growth, high temperature heat wave, low temperature, pests and diseases, etc. [36,46].

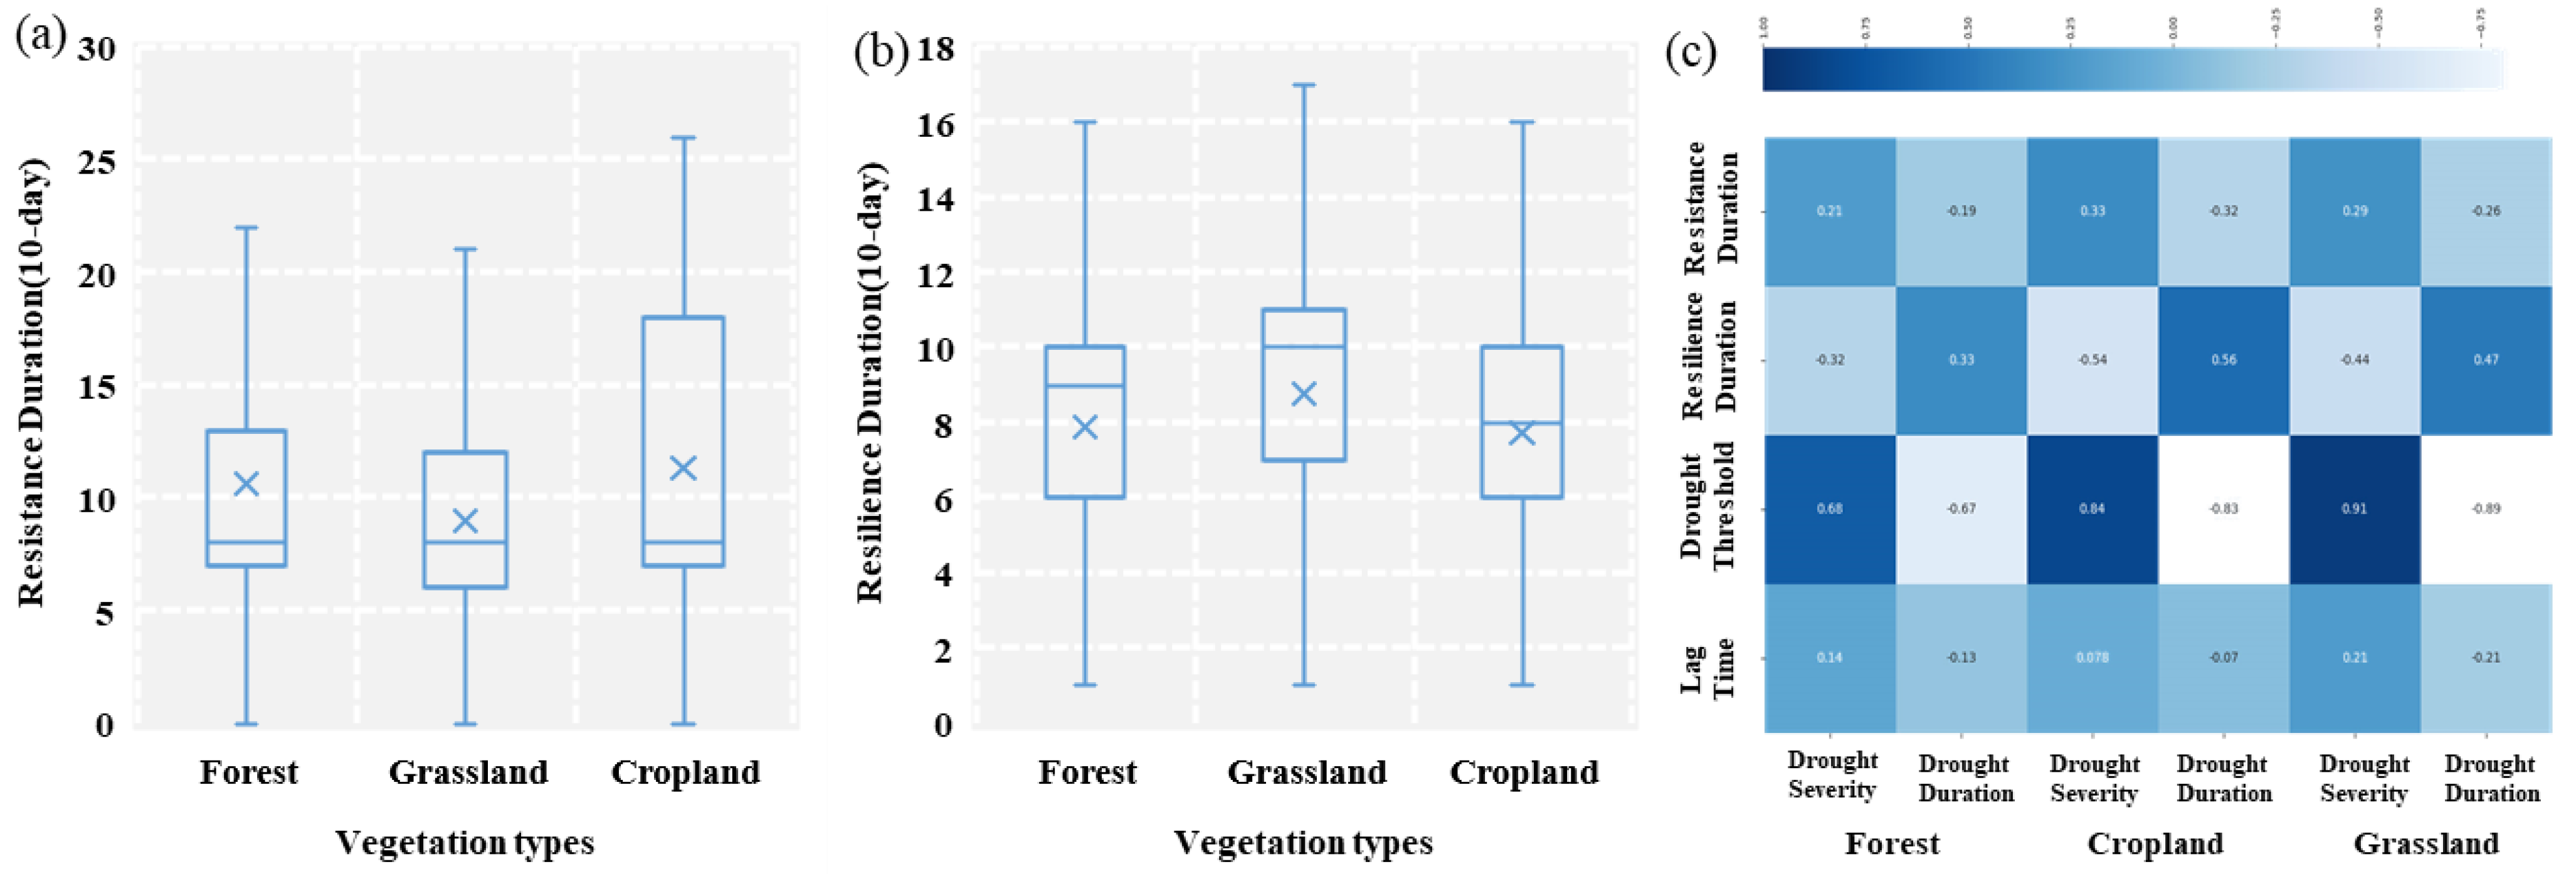
4.2. Divergent Stability in Different Vegetation Types

The resistance duration of vegetation to drought in most areas of the MRYRB is within 150 days, and it can return to normal within 100 days after drought (Figure 7a,b). Some cropland with a higher resistance duration than forest and grassland existed; grassland had the shortest resistance duration, but the longest resilience duration. However, cropland had the shortest resilience duration. The drought threshold was most influenced by drought characteristics, showing a strong positive relationship with drought severity and a strong negative relationship with drought duration, among which, grassland showed the most obvious performance on this relationship. However, the least influenced by drought characteristics was the lag time. Drought severity showed a significant positive correlation with resistance duration and a significant negative correlation with resilience duration, whereas drought duration was the opposite, with cropland showing the most pronounced performance for this relationship. Overall, the response characteristics of forest to drought were weaker than those of grassland and cropland (Figure 7c).
Effective precipitation and suitable temperature are the primary factors for vegetation to restore its ecological function [47,48], but it also has a great relationship with its own physiological structure. Resistance duration and resilience duration differed significantly between vegetation types, possibly due to differences in the ability of different vegetation types to structurally and physiologically adjust to drought cycles [49,50], as a result, the response duration of vegetation to dry and wet changes is different [51]. Vegetation relies on soil moisture to obtain water for photosynthesis, further controlling the stem-water dynamics, stomatal regulation and transpiration losses [52]. It is well known that cropland is easily affected by the profit and loss of precipitation, especially in the early stage of crop growth and development. Severe drought greatly reduces the vegetation index of cropland [53], however, agricultural management measures such as irrigation and fertilization can alleviate this harm to a certain extent [54]. The duration of its resistance to drought was higher than that of natural forest and grass, and the resistance duration of 29.1% of the cropland was more than 5 months (Figure 7a). At the same time, once the effective water replenishment arrives, the crops can quickly absorb the shallow soil moisture, and the resilience duration is also shorter than the other two vegetation types.
Among natural vegetation, forest benefit from strong root systems and well-developed tree canopies, and the resistance duration to drought is slightly longer than that of grasslands. Under water stress, forest will later turn to extract deep-water sources from continuous outcrops and the subcutaneous zone [55,56] in the wet season with higher terrestrial water storage, and has a greater ability to regulate stomatal openness and maintain basic metabolism. However, forest takes longer to recover vegetation greenness when the drought fades away through carbohydrate accumulation and water replenishment. Despite grassland relying mostly on shallow soil moisture, tolerating the dry periods, it has neither a strong root system nor few artificial intervention measures, and the structure is relatively simple. Therefore, the duration of resistance is the shortest, until sufficient effective precipitation is produced, and the grassland begins to gradually recover from the drought. In contrast, the duration resilience of grassland was longer than other types of vegetation (Figure 7b). More than 3% of the grassland recovered to normal after 4 months, whereas 56.1% of the grassland recovered within 3–4 months. Research has shown that the effects of drought on severely water-stressed grasslands were greater than those with less water-stressed grasslands [37], which explained why the drought threshold was lower in the border regions of Inner Mongolia (Figure 5a); they can endure drought on longer timescales, with greater severity.

5. Conclusions

In this study, NDVI and SPEI were used to present a comprehensive and systematic evaluation of vegetation stability in the MRYRB. Drought characteristics and stability parameters (resistance duration, resilience duration, drought threshold, and lag time) were quantified during the 2005/2006 drought event, and the main conclusions are as follows:
  • The vegetation in the study area was mainly less resistance and less resilience (40.9%), which was distributed in the northwest of the study area.
  • The start time of the drought is mainly concentrated in the summer and winter of 2005. The drought duration and severity present the similar space distribution characteristics. The northwestern part of the study area has a longer duration drought and severe drought severity, whereas the southeastern part is the opposite.
  • Most vegetation (89.4%) can return to the normal level within 100 days after the drought. The average drought threshold in the study area is −2.6, and the lag time of drought on vegetation is concentrated in 1–3 months.
This study promotes the understanding of the stability characteristics of vegetation on drought and provides the theoretical basis for reducing the negative impact of vegetation to resist drought, while helping alleviate the risk of drought pressure caused by global climate change.

Author Contributions

Conceptualization, X.S. and F.C.; methodology, F.C.; software, X.S.; validation, H.D., Y.L. and M.S.; formal analysis, X.S.; investigation, F.C.; resources, F.C.; data curation, H.D.; writing—original draft preparation, F.C.; writing—review and editing, X.S.; visualization, M.S.; supervision, Y.L.; project administration, X.S.; funding acquisition, X.S. All authors have read and agreed to the published version of the manuscript.

Funding

This research was funded by [National Natural Science Foundation of China] grant number [52079103].

Institutional Review Board Statement

Not applicable.

Informed Consent Statement

Not applicable.

Data Availability Statement

Not applicable.

Acknowledgments

Thanks for the product data provided by European Space Agency, Consejo Superior de Investigaciones Científicas and Resource and Environment Science and Data Center.

Conflicts of Interest

The authors declare no conflict of interest.

References

  1. Dai, A. Drought under global warming: A review. Wiley Interdiscip. Rev. Clim. Change 2011, 2, 45–65. [Google Scholar] [CrossRef] [Green Version]
  2. Wu, J.; Miao, C.; Zheng, H.; Duan, Q.; Lei, X.; Li, H. Meteorological and Hydrological Drought on the Loess Plateau, China: Evolutionary Characteristics, Impact, and Propagation. J. Geophys. Res.-Atmos. 2018, 123, 11569–11584. [Google Scholar] [CrossRef]
  3. Shi, M.; Yuan, Z.; Shi, X.; Li, M.; Chen, F.; Li, Y. Drought assessment of terrestrial ecosystems in the Yangtze River Basin, China. J. Clean. Prod. 2022, 362, 132234. [Google Scholar] [CrossRef]
  4. Zhu, Z.; Piao, S.; Myneni, R.B.; Huang, M.; Zeng, Z.; Canadell, J.G.; Ciais, P.; Sitch, S.; Friedlingstein, P.; Arneth, A. Greening of the Earth and its drivers. Nat. Clim. Change 2016, 6, 791–795. [Google Scholar] [CrossRef]
  5. Keenan, F.T.; David, Y.H.; Bohrer, G.; Dragoni, D.; Munger, J.W.; Schmid, H.P.; Andrew, D.R. Increase in forest water-use efficiency as atmospheric carbon dioxide concentrations rise. Nature 2013, 499, 324–327. [Google Scholar] [CrossRef]
  6. Ruppert, J.C.; Keith, H.; Zalmen, H.; Snyman, H.A.; Marcelo, S.; Walter, W.; Anja, L. Quantifying drylands’ drought resistance and recovery: The importance of drought intensity, dominant life history and grazing regime. Global Chang. Biol. 2015, 21, 1258–1270. [Google Scholar] [CrossRef]
  7. Zeiter, M.; Schärrer, S.; Zweifel, R.; Newbery, D.M.; Stampfli, A. Timing of extreme drought modifies reproductive output in semi-natural grassland. J. Veg. Sci. 2016, 27, 238–248. [Google Scholar] [CrossRef]
  8. Jian, D.; Ma, Z.; Chen, L.; Duan, J.; Mitchell, D.; Zheng, Z.; Lv, M.; Zhang, H. Effects of 1.5 °C and 2 °C of warming on regional reference evapotranspiration and drying: A case study of the Yellow River Basin, China. Int. J. Climatol. 2021, 41, 791–810. [Google Scholar] [CrossRef]
  9. Chen, L.; Huang, J.; Stadt, K.J.; Comeau, P.G.; Zhai, L.; Dawson, A.; Alam, S.A. Drought explains variation in the radial growth of white spruce in western Canada. Agr. For. Meteorol. 2017, 233, 133–142. [Google Scholar] [CrossRef] [Green Version]
  10. Duan, H.; Remko, A.D.; Huang, G.; Renee, A.S.; Choat, B.; Anthony, P.O.G.; David, T.T. Elevated [CO2] does not ameliorate the negative effects of elevated temperature on drought-induced mortality in Eucalyptus radiata seedlings. Plant Cell Environ. 2014, 37, 1598–1613. [Google Scholar] [CrossRef]
  11. Depardieu, C.; Girardin, M.P.; Nadeau, S.; Lenz, P.; Bousquet, J.; Isabel, N. Adaptive genetic variation to drought in a widely distributed conifer suggests a potential for increasing forest resilience in a drying climate. New Phytol. 2020, 227, 427–439. [Google Scholar] [CrossRef] [PubMed] [Green Version]
  12. Wei, M.; Li, H.; Adnan, A.M.; Dong, L.; Sun, Y.; Hu, W.; Gong, H.; Zhao, D.; Xiong, J.; Yao, S.; et al. Quantifying Drought Resistance of Drylands in Northern China from 1982 to 2015: Regional Disparity in Drought Resistance. Forests 2022, 13, 100. [Google Scholar] [CrossRef]
  13. Lloret, F.; Keeling, E.G.; Sala, A. Components of tree resilience: Effects of successive low-growth episodes in old ponderosa pine forests. Oikos 2011, 120, 1909–1920. [Google Scholar] [CrossRef]
  14. Andreas, S.; Bloor, J.M.G.; Markus, F.; Michaela, Z. High land-use intensity exacerbates shifts in grassland vegetation composition after severe experimental drought. Glob. Chang. Biol. 2018, 24, 2021–2034. [Google Scholar]
  15. Liu, Y.; You, C.; Zhang, Y.; Chen, S.; Zhang, Z.; Li, J.; Wu, Y. Resistance and resilience of grasslands to drought detected by SIF in inner Mongolia, China. Agr. For. Meteorol. 2021, 308, 108567. [Google Scholar] [CrossRef]
  16. Huang, K.; Xia, J. High ecosystem stability of evergreen broadleaf forests under severe droughts. Global Chang. Biol. 2019, 25, 3494–3503. [Google Scholar] [CrossRef]
  17. Li, X.; Piao, S.; Wang, K.; Wang, X.; Wang, T.; Ciais, P.; Chen, A.; Lian, X.; Peng, S.; Peñuelas, J. Temporal trade-off between gymnosperm resistance and resilience increases forest sensitivity to extreme drought. Nat. Ecol. Evol. 2020, 4, 1075–1083. [Google Scholar] [CrossRef]
  18. Pablo, G.P.; Nicolas, G.; Juan, G.; Maestre, F.T. Climate mediates the biodiversity–ecosystem stability relationship globally. Proc. Natl. Acad. Sci. USA 2018, 115, 8400–8405. [Google Scholar]
  19. Yang, J.; Tian, H.; Pan, S.; Chen, G.; Zhang, B.; Shree, D. Amazon drought and forest response: Largely reduced forest photosynthesis but slightly increased canopy greenness during the extreme drought of 2015/2016. Global Chang. Biol. 2018, 24, 1919–1934. [Google Scholar] [CrossRef]
  20. Zhang, Q.; Yao, Y.; Li, Y.; Huang, J.; Ma, Z.; Wang, Z.; Wang, S.; Wang, Y.; Zhang, Y. Progress and prospect on the study of causes and variation regularity of droughts in China. Acta Meteorol. 2020, 78, 500–521. (In Chinese) [Google Scholar]
  21. Yang, Q.; Li, Z.; Han, Y.; Gao, H. Responses of Baseflow to Ecological Construction and Climate Change in Different Geomorphological Types in The Middle Yellow River, China. Water 2020, 12, 304. [Google Scholar] [CrossRef] [Green Version]
  22. Omer, A.; Elagib, N.A.; Ma, Z.; Saleem, F.; Mohammed, A. Water scarcity in the Yellow River Basin under future climate change and human activities. Sci. Total Environ. 2020, 749, 141446. [Google Scholar] [CrossRef] [PubMed]
  23. Wang, W.; Yu, W. Prediction of Drought Characteristics in Middle Yellow River Basin Based on GM (1,1)-SVR Model. Anhui Agric. Sci. Bull. 2022, 28, 138–142. (In Chinese) [Google Scholar]
  24. Wei, P.; Zhu, W.; Zhao, Y.; Fang, P.; Zhang, X.; Yan, N.; Zhao, H. Extraction of Kenyan Grassland Information Using PROBA-V Based on RFE-RF Algorithm. Remote Sens. 2021, 13, 4762. [Google Scholar] [CrossRef]
  25. Michele, M.; Dominique, F.; Riad, B.; Mustapha, D.; Myriam, H.; Ismael, H.; Josh, H.; Mouanis, L.; Raul, L.-L.; Hamid, M.; et al. Evaluating NDVI Data Continuity Between SPOT-VEGETATION and PROBA-V Missions for Operational Yield Forecasting in North African Countries. IEEE Trans. Geosci. Remote Sens. 2016, 54, 795–804. [Google Scholar]
  26. Wang, W.; Guo, B.; Zhang, Y.; Zhang, L.; Ji, M.; Xu, Y.; Zhang, X.; Zhang, Y. The sensitivity of the SPEI to potential evapotranspiration and precipitation at multiple timescales on the Huang-Huai-Hai Plain, China. Theor. Appl. Climatol. 2020, 143, 87–99. [Google Scholar] [CrossRef]
  27. Askarimarnani, S.S.; Kiem, A.S.; Twomey, C.R. Comparing the Performance of Drought Indicators in Australia from 1900 to 2018. Int. J. Climatol. 2020, 41, 912–934. [Google Scholar] [CrossRef]
  28. Musei, S.K.; Nyaga, J.M.; Dubow, A.Z. SPEI-based spatial and temporal evaluation of drought in Somalia. J. Arid Environ. 2021, 184, 104296. [Google Scholar] [CrossRef]
  29. Xu, Q.; Jiao, Y.; Liu, C.; Liu, Z.; Ding, Y.; Zhang, H.; Tao, Y.; Zhang, Z. The spatial patterns and impact factors of stable oxygen and hydrogen isoscapes in pond water: A case study on the water-source forests of the Hani terraced fields in Yunnan, China. J. Hydrol. 2021, 603, 127097. [Google Scholar] [CrossRef]
  30. Yin, J.; Yuan, Z.; Li, T. The Spatial-Temporal Variation Characteristics of Natural Vegetation Drought in the Yangtze River Source Region, China. Int. J. Environ. Res. Public Health 2021, 18, 1613. [Google Scholar] [CrossRef]
  31. Isbell, F.; Craven, D.; Connolly, J.; Loreau, M.; Schmid, B.; Beierkuhnlein, C.; Bezemer, T.M.; Bonin, C.; Bruelheide, H.; de Luca, E.; et al. Biodiversity increases the resistance of ecosystem productivity to climate extremes. Nature 2015, 526, 574–577. [Google Scholar] [CrossRef] [PubMed]
  32. Jiang, W.; Zhu, X.; Wu, J.; Gu, L.; Ma, G.; Liu, X. Retrieval and analysis of coal fire temperature in Wuda coalfield, Inner Mongolia, China. Chinese Geogr. Sci. 2011, 21, 159–166. [Google Scholar] [CrossRef]
  33. Li, M.; Chu, R.; Sha, X.; Xie, P.; Ni, F.; Wang, C.; Jiang, Y.; Shen, S.; Towfiqul, I.A.R.M. Monitoring 2019 Drought and Assessing Its Effects on Vegetation Using Solar-Induced Chlorophyll Fluorescence and Vegetation Indexes in the Middle and Lower Reaches of Yangtze River, China. Remote Sens. 2022, 14, 2569. [Google Scholar] [CrossRef]
  34. Li, X.; Li, Y.; Chen, A.; Gao, M.; Slette, I.J.; Piao, S. The impact of the 2009/2010 drought on vegetation growth and terrestrial carbon balance in Southwest China. Agr. For. Meteorol. 2019, 269, 239–248. [Google Scholar] [CrossRef]
  35. Pi, G.; He, Z.; Zhang, L.; Yang, M.; You, M. Response of Vegetation to Meteorological Drought in Watershed at different Time Scales—A Case Study of Guizhou Province. Res. Soil Water Conserv. 2022, 29, 277–284. (In Chinese) [Google Scholar]
  36. Ding, Y.; Li, Z.; Peng, S. Global analysis of time-lag and -accumulation effects of climate on vegetation growth. Int. J. Appl. Earth Obs. Geoinf. 2020, 92, 102179. [Google Scholar] [CrossRef]
  37. Wei, X.; He, W.; Zhou, Y.; Ju, W.; Xiao, J.; Li, X.; Liu, Y.; Xu, S.; Bi, W.; Zhang, X.; et al. Global assessment of lagged and cumulative effects of drought on grassland gross primary production. Ecol. Indic. 2022, 136, 108646. [Google Scholar] [CrossRef]
  38. Gu, X.; Guo, E.; Yin, S.; Wang, Y.; Na, R.; Wan, Z. Assessment of the Cumulative and Lagging Effects of Drought on Vegetation Growth in Inner Mongolia. Acta Agrestia Sin. 2021, 29, 1301–1310. (In Chinese) [Google Scholar]
  39. Zhao, A.; Yu, Q.; Feng, L.; Zhang, A.; Pei, T. Evaluating the cumulative and time-lag effects of drought on grassland vegetation: A case study in the Chinese Loess Plateau. J. Environ. Manag. 2020, 261, 110214. [Google Scholar] [CrossRef]
  40. Brendan, C.; Brodribb, T.J.; Brodersen, C.R.; Duursma, R.A.; López, R.; Medlyn, B.E. Triggers of tree mortality under drought. Nature 2018, 558, 531–539. [Google Scholar]
  41. Gessler, A.; Schaub, M.; McDowell, N.G. The role of nutrients in drought-induced tree mortality and recovery. New Phytol. 2017, 214, 513–520. [Google Scholar] [CrossRef] [PubMed] [Green Version]
  42. Meng, X.H.; Evans, J.P.; Mccabe, M.F. The Impact of Observed Vegetation Changes on Land—Atmosphere Feedbacks During Drought. J. Hydrometeorol. 2014, 15, 759–776. [Google Scholar] [CrossRef] [Green Version]
  43. Liu, Y. Impacts of vegetation on drought trends. Chinese J. Atmos. Sci. 2016, 40, 142–156. (In Chinese) [Google Scholar]
  44. Jones, J.A.; Creed, I.F.; Hatcher, K.L.; Warren, R.J.; Adams, M.B.; Benson, M.H.; Boose, E.; Brown, W.A.; Campbell, J.L.; Covich, A.; et al. Ecosystem Processes and Human Influences Regulate Streamflow Response to Climate Change at Long-Term Ecological Research Sites. BioScience 2012, 62, 390–404. [Google Scholar] [CrossRef] [Green Version]
  45. Zhang, Y.; Guo, L.; Liang, C.; Zhao, L.; Wang, J.; Zhan, C.; Jiang, S. Encounter risk analysis of crop water requirements and effective precipitation based on the copula method in the Hilly Area of Southwest China. Agric. Water Manag. 2022, 266, 107571. [Google Scholar] [CrossRef]
  46. Huang, M.; Wang, X.; Keenan, T.F.; Piao, S. Drought timing influences the legacy of tree growth recovery. Global Chang. Biol. 2018, 24, 3546–3559. [Google Scholar] [CrossRef] [Green Version]
  47. Frank, D.; Reichstein, M.; Bahn, M.; Thonicke, K.; Frank, D.; Mahecha, M.D.; Smith, P.; van der Velde, M.; Vicca, S.; Babst, F.; et al. Effects of climate extremes on the terrestrial carbon cycle: Concepts, processes and potential future impacts. Global Chang. Biol. 2015, 21, 2861–2880. [Google Scholar] [CrossRef] [Green Version]
  48. Schwalm, C.R.; Anderegg, W.R.L.; Michalak, A.M.; Fisher, J.B.; Biondi, F.; Koch, G.; Litvak, M.; Ogle, K.; Shaw, J.D.; Wolf, A.; et al. Global patterns of drought recovery. Nature 2017, 548, 202–205. [Google Scholar] [CrossRef]
  49. Stuart-Haëntjens, E.; de Boeck, H.J.; Lemoine, N.P.; Mänd, P.; Kröel-Dulay, G.; Schmidt, I.K.; Jentsch, A.; Stampfli, A.; Anderegg, W.R.L.; Bahn, M.; et al. Mean annual precipitation predicts primary production resistance and resilience to extreme drought. Sci. Total Environ. 2018, 636, 360–366. [Google Scholar] [CrossRef]
  50. Wolf, S.; Keenan, T.F.; Fisher, J.B.; Baldocchi, D.D.; Desai, A.R.; Richardson, A.D.; Scott, R.L.; Law, B.E.; Litvak, M.E.; Brunsell, N.A.; et al. Warm spring reduced carbon cycle impact of the 2012 US summer drought. Proc. Natl. Acad. Sci. USA 2016, 113, 5880–5885. [Google Scholar] [CrossRef] [Green Version]
  51. Zhang, X.; Li, M.; Ma, Z.; Yang, Q.; LV, M.; Clark, R. Assessment of an Evapotranspiration Deficit Drought Index in Relation to Impacts on Ecosystems. Adv. Atmos. Sci. 2019, 36, 1273–1287. [Google Scholar] [CrossRef]
  52. Srinidhi, J.; Jew, D.; Ashutosh, S.; Budhaditya, H.; Manish, K.G. Probabilistic evaluation of vegetation drought likelihood and its implications to resilience across India. Global Planet. Chang. 2019, 176, 23–35. [Google Scholar]
  53. Corey, L.; Pedram, R.; Navin, R. Influence of extreme weather disasters on global crop production. Nature 2016, 529, 84–87. [Google Scholar]
  54. Jiang, Z.; Lian, Y.; Qin, X. Rocky desertification in Southwest China: Impacts, causes, and restoration. Earth-Sci. Rev. 2014, 132, 1–12. [Google Scholar] [CrossRef]
  55. Liu, J.; Shen, L.; Wang, Z.; Duan, S.; Wu, W.; Peng, X.; Wu, C.; Jiang, Y. Response of plants water uptake patterns to tunnels excavation based on stable isotopes in a karst trough valley. J. Hydrol. 2019, 571, 485–493. [Google Scholar] [CrossRef]
  56. Zhang, Y.; Xiao, X.; Zhou, S.; Ciais, P.; McCarthy, H.; Luo, Y. Canopy and physiological controls of GPP during drought and heat wave. Geophys. Res. Lett. 2016, 43, 3325–3333. [Google Scholar] [CrossRef] [Green Version]
Figure 1. The location of the middle reaches of the Yellow River basin, China. The background colors indicate the different vegetation types in the region.
Forests 13 01138 g001
Figure 2. The identification of drought characteristics and stability parameters by smoothed SPEI and standardized anomaly of NDVI (SANDVI), (a) drought duration and drought severity, (b) resistance duration and resilience duration, the definition: (c) flow diagram, (d) drought threshold and (e) the lag time.
Forests 13 01138 g002
Figure 3. The spatial patterns of vegetation (a) resistance, (b) resilience, and (c) stability in the MRYRB.
Forests 13 01138 g003
Figure 4. The spatial patterns of (a) the drought start time; (b) the drought end time; (c) the drought duration; (d) the drought severity. The start, end, duration and severity in (ad) were identified based on the smoothed SPEI.
Forests 13 01138 g004
Figure 5. The spatial patterns of (a) the damaged time; (b) the recovery time; (c) the resistance duration; (d) the resilience duration; (e) the drought threshold; (f) the lag time. (ad) were identified based on the standardized anomaly of NDVI. Areas with no data in (ef) represent drought without serious impact on vegetation.
Forests 13 01138 g005
Figure 6. The impacts of drought duration and drought severity on resistance duration and resilience duration. (a) impacts of drought severity in 2005/2006; (b) impacts of drought duration in 2005/2006.
Forests 13 01138 g006
Figure 7. The drought impact on divergent vegetation types (a) the resistance duration in 2005/2006; (b) the resilience duration in 2005/2006; Box−and−whisker plots (25th to 75th percentiles at the ends of the box. Median is indicated with a horizontal line in the interior of the box. Maximum and minimum values are at the ends of the whiskers) (c) the Pearson correlation coefficient between drought characteristics and vegetation stability parameters; all of the above passed the significance test (p < 0.01).
Forests 13 01138 g007
Table 1. Resistance and resilience levels division.
Resistance RangeResistance LevelResilience RangeResilience Level
<10less resistance<0.8less resilience
10–14fair resistance0.8–1.2fair resilience
>14more resistance>1.2more resilience
Publisher’s Note: MDPI stays neutral with regard to jurisdictional claims in published maps and institutional affiliations.

