
Livestock Grazing Impact on Species Composition and Richness Understory of the Pinus cembroides Zucc. Forest in Northeastern Mexico


Abstract
:1. Introduction
2. Materials and Methods
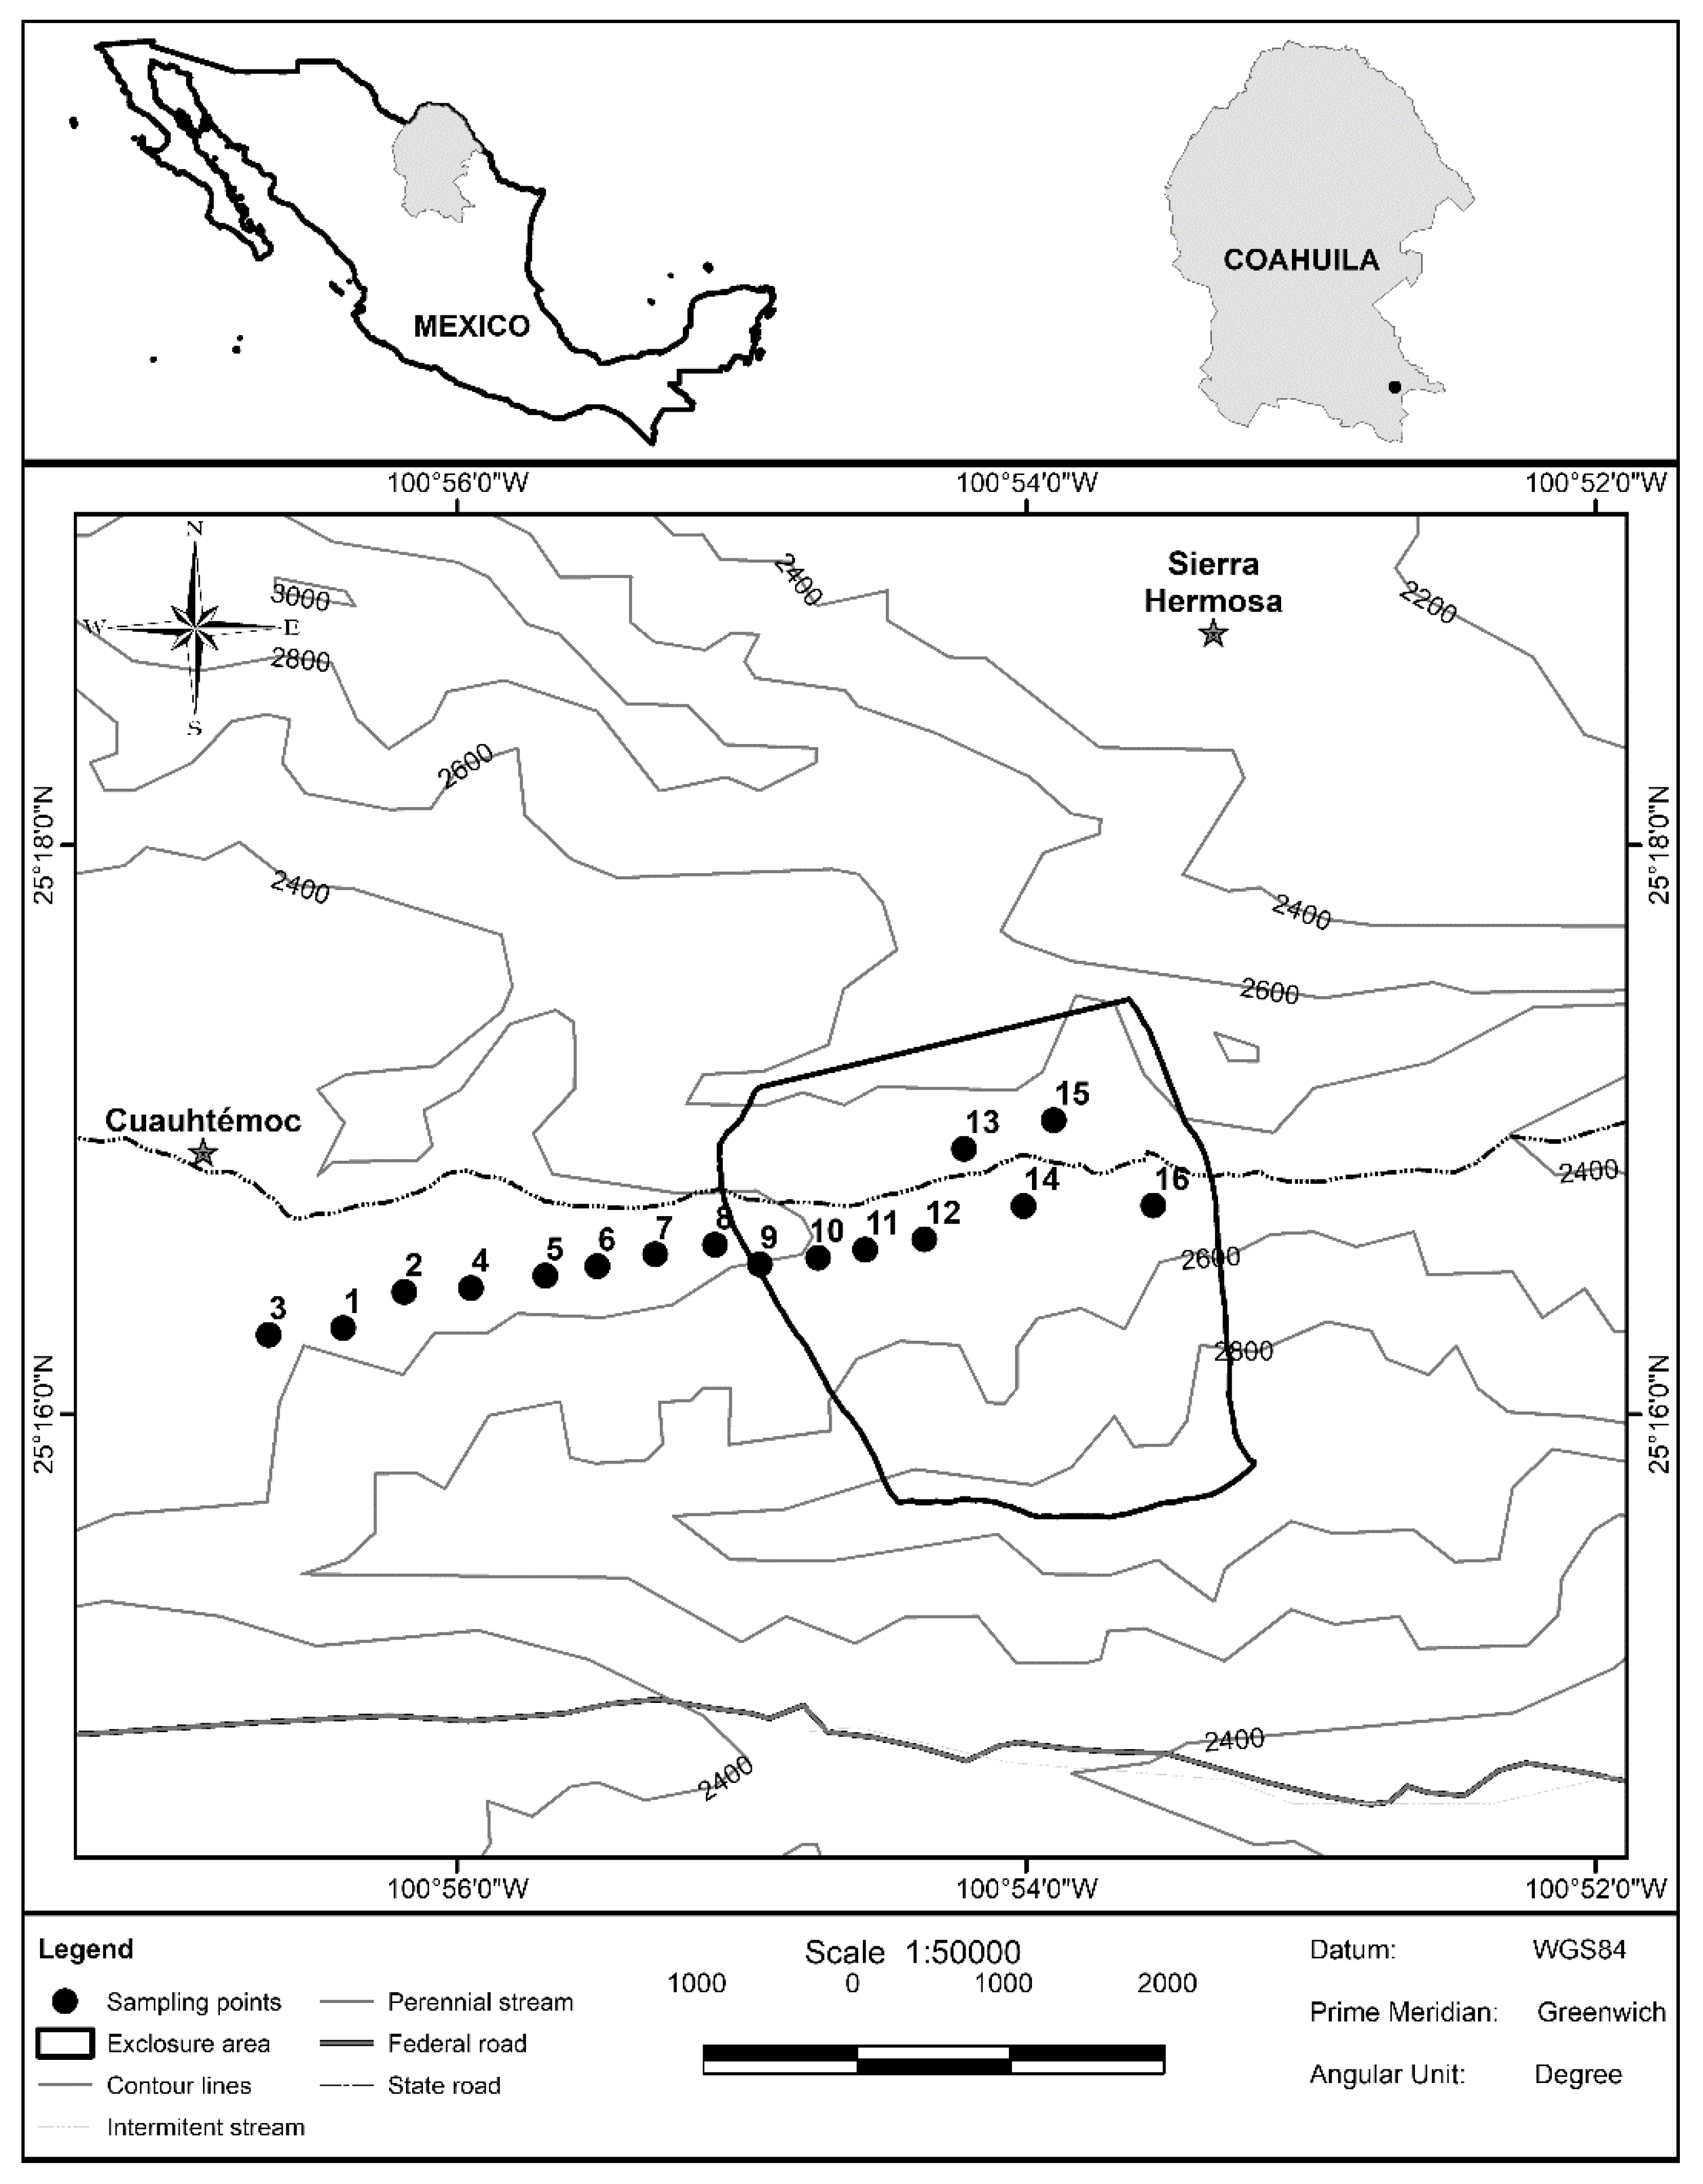
2.1. Study Site
2.2. Sampling Design
2.3. Statistical Analysis
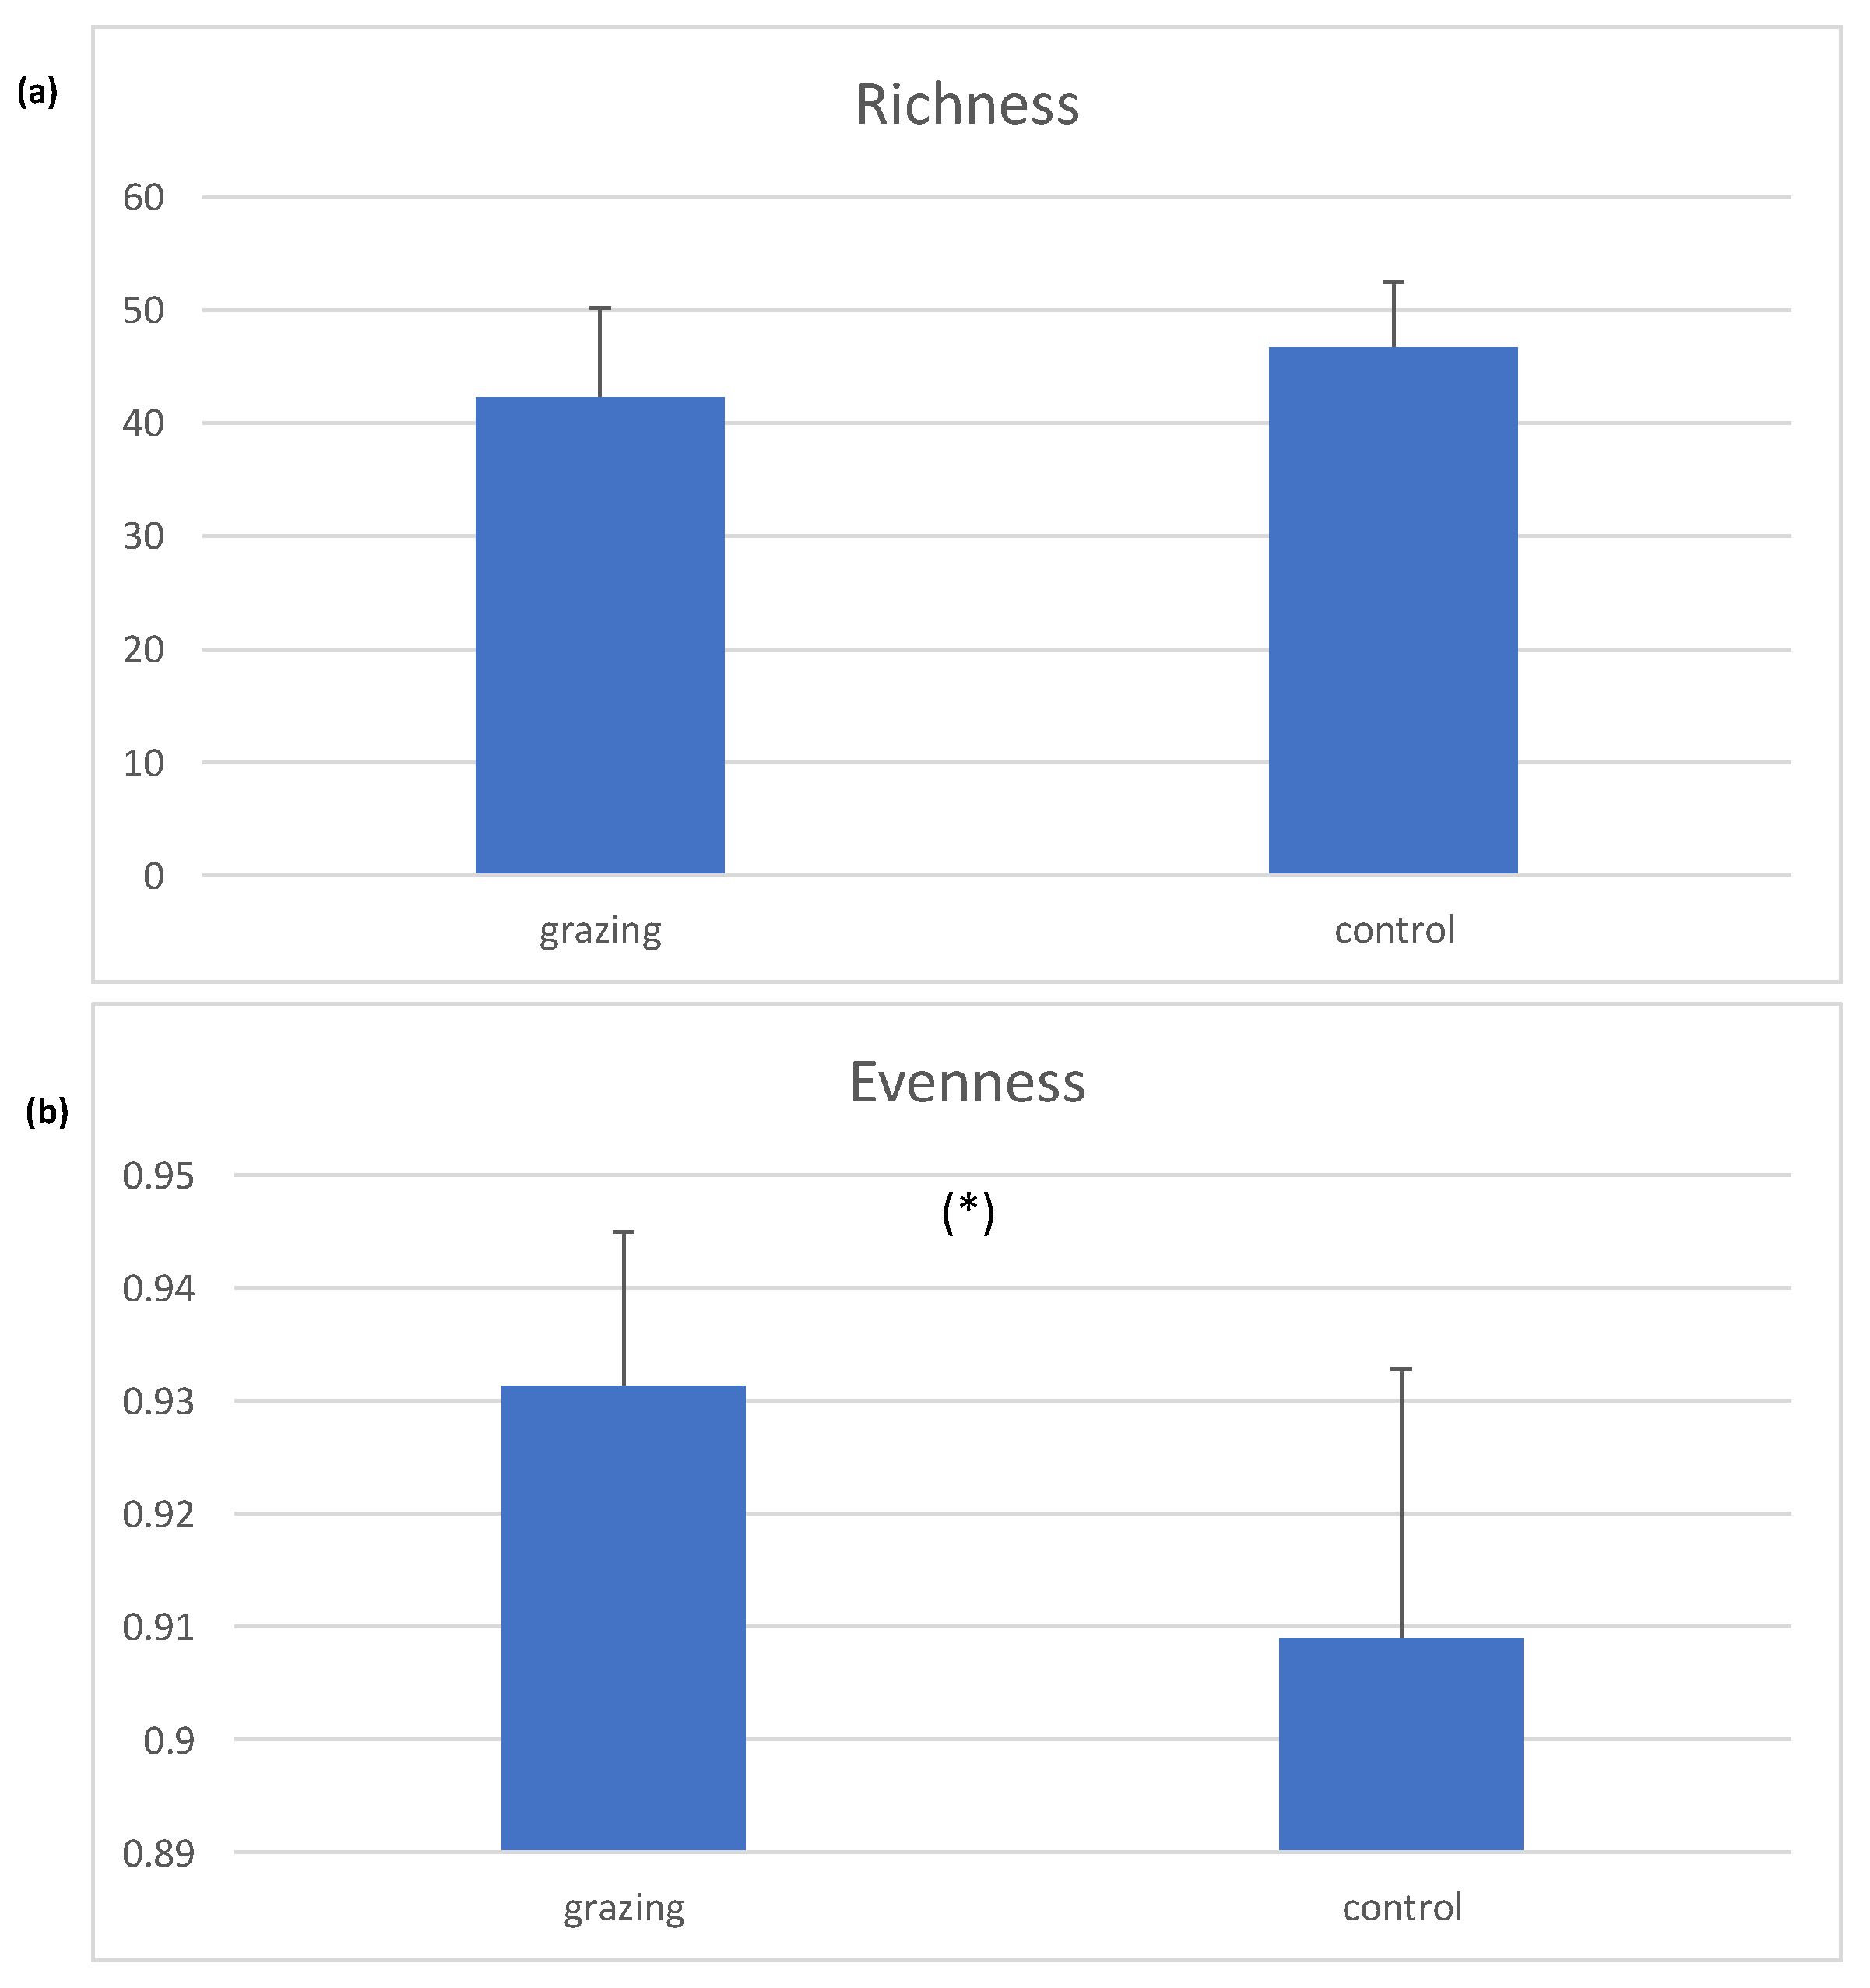
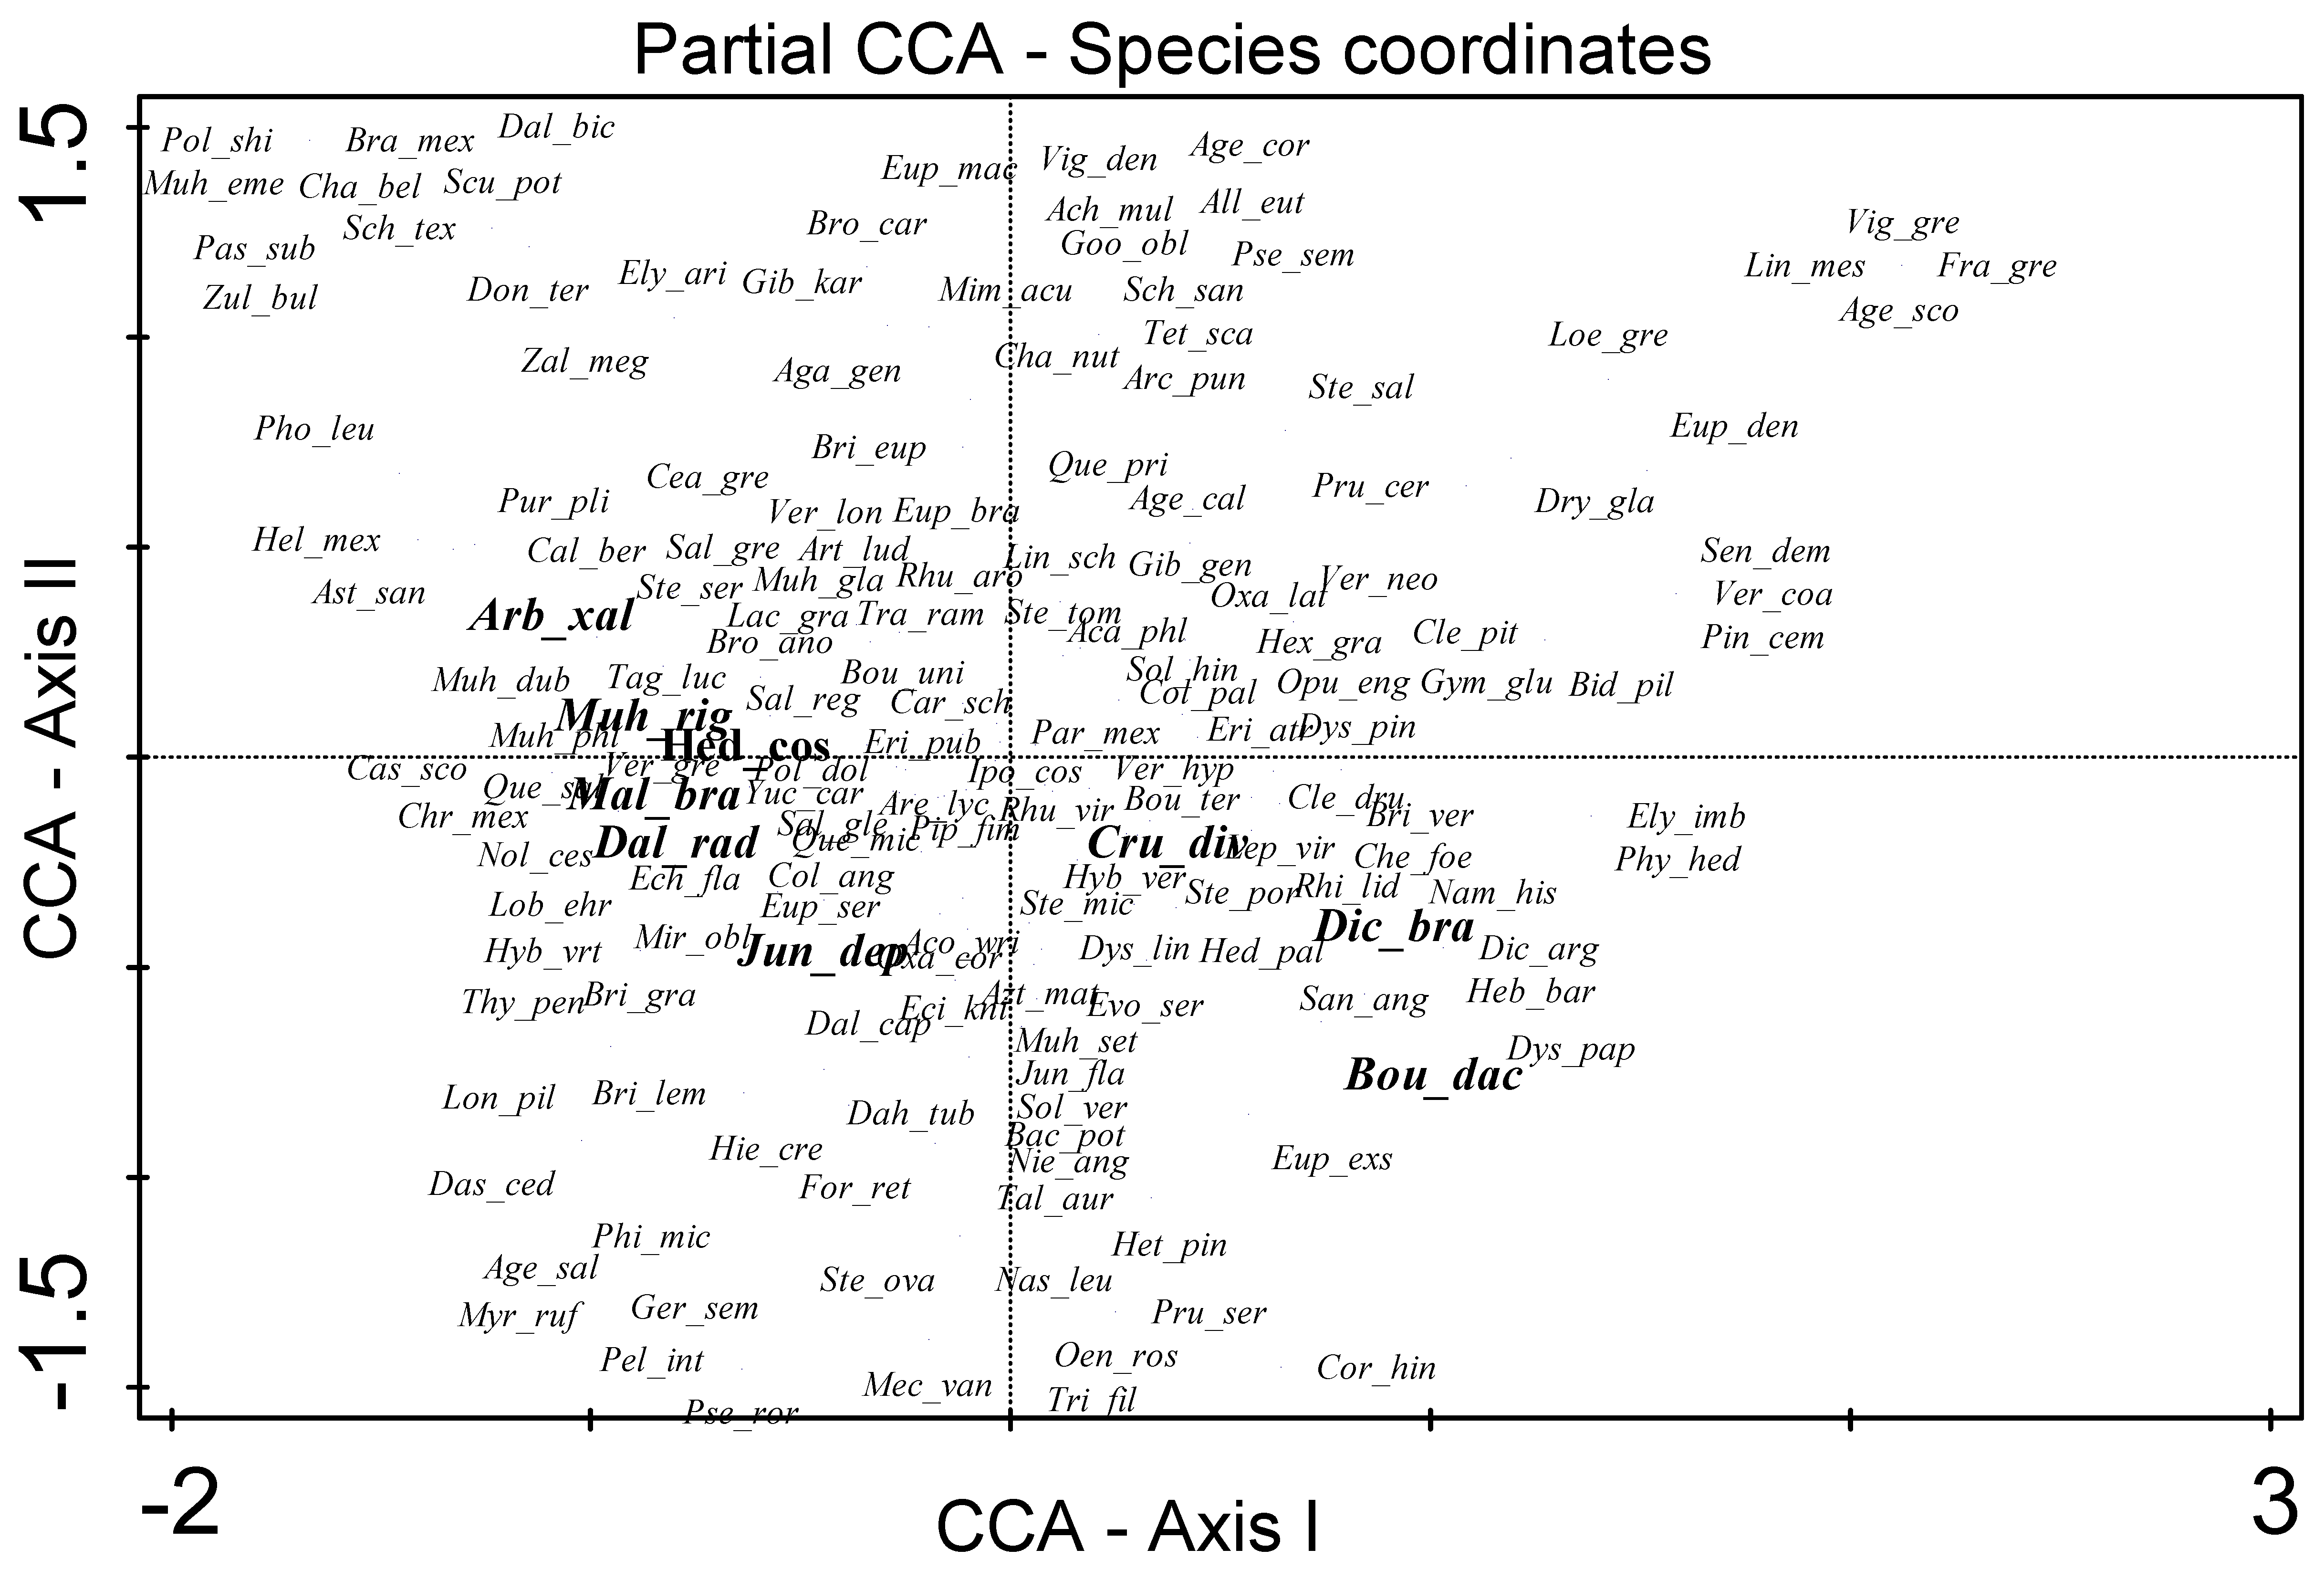
3. Results
4. Discussion
5. Conclusions
Author Contributions
Funding
Data Availability Statement
Acknowledgments
Conflicts of Interest
Appendix A. Species Family, Scientific Name and Life Form Found in This Study
| Family | Scientific Name | Species Abbreviations | Life Form |
| Acanthaceae | Dyschoriste linearis (Torr. & A. Gray) Kuntze | Dys lin | Herb |
| Elytraria imbricata (Vahl) Pers. | Ely imb | Herb | |
| Amaranthaceae | Chenopodium foetidum Lam. | Che foe | Herb |
| Anacardiaceae | Rhus aromatica Aiton | Rhu aro | Shrub |
| Rhus virens Lindh. ex A. Gray | Rhu vir | Shrub | |
| Apiaceae | Donnellsmithia ternata (S. Watson) Mathias & Constance | Don ter | Herb |
| Asparagaceae | Agave gentryi B. Ullrich | Aga gen | Shrub |
| Dasylirion cedrosanum Trel. | Das ced | Shrub | |
| Nolina cespitifera Trel. | Nol ces | Shrub | |
| Yucca carnerosana (Trel.) McKelvey | Yuc car | Shrub | |
| Asphodelaceae | Asphodelus fistulous L. | Asp fis | Herb |
| Asteraceae | Acourtia wrightii (A. Gray) Reveal & R.M. King | Aco wri | Herb |
| Ageratina calophylla (Greene) Molinari & Mayta | Age cal | Herb | |
| Ageratina saltillensis (B.L. Rob.) R.M. King & H. Rob. | Age sal | Shrub | |
| Ageratina scorodonioides (A. Gray) R.M. King & H. Rob. | Age sco | Herb | |
| Ageratum corymbosum Zuccagni | Age cor | Herb | |
| Artemisia ludoviciana Nutt. | Art lud | Herb | |
| Aztecaster matudae (Rzed.) G.L. Nesom | Azt mat | Shrub | |
| Baccharis potosina A. Gray | Bac pot | Shrub | |
| Bidens pilosa L. | Bid pil | Herb | |
| Brickellia eupatorioides (L.) Shinners | Bri eup | Herb | |
| Brickellia grandiflora (Hook.) Nutt. | Bri gra | Herb | |
| Brickellia lemmonii A. Gray | Bri lem | Herb | |
| Brickellia veronicifolia (Kunth) A. Gray | Bri ver | Shrub | |
| Chaetopappa bellioides (A. Gray) Shinners | Chae bel | Herb | |
| Chaptalia nutans (L.) Pol. | Cha nut | Herb | |
| Chrysactinia mexicana A. Gray | Chr mex | Shrub | |
| Dahlia tubulata P.D. Sørensen | Dah tub | Herb | |
| Dyssodia papposa (Vent.) Hitchc. | Dys pap | Herb | |
| Dyssodia pinnata (Cav.) B.L. Rob. | Dys pin | Herb | |
| Erigeron pubescens Kunth | Eri pub | Herb | |
| Gymnosperma glutinosum (Spreng.) Less. | Gym glu | Shrub | |
| Helianthella mexicana A. Gray | Hel mex | Herb | |
| Heterosperma pinnatum Cav. | Het pin | Herb | |
| Hieracium crepidispermum Fr. | Hie cre | Herb | |
| Lactuca graminifolia Michx. | Lac gram | Herb | |
| Pseudognaphalium roseum (Kunth) Anderb. | Pse ros | Herb | |
| Pseudognaphalium semiamplexicaule (DC.) Anderb. | Pse sem | Herb | |
| Sanvitalia angustifolia Engelm. ex A. Gray | San ang | Herb | |
| Solidago hintoniorum G.L. Nesom | Sol hin | Herb | |
| Stevia micrantha Lag. | Ste mic | Herb | |
| Stevia ovata Willd. | Ste ova | Herb | |
| Stevia porphyrea McVaugh | Ste por | Herb | |
| Stevia salicifolia Cav. | Ste sal | Shrub | |
| Stevia serrata Cav. | Ste ser | Herb | |
| Stevia tomentosa Kunth | Ste tom | Herb | |
| Tagetes lucida Cav. | Tag luc | Herb | |
| Tetraneuris scaposa (DC.) Greene | Tet sca | Herb | |
| Thymophylla pentachaeta (DC.) Small | Thy pen | Herb | |
| Verbesina coahuilensis A. Gray ex S. Watson | Ver coa | Herb | |
| Verbesina hypomalaca A. Gray ex S. Watson | Ver hyp | Herb | |
| Verbesina longipes Hemsl. | Ver lon | Herb | |
| Vernonia greggii A. Gray | Ver gre | Herb | |
| Viguiera dentata (Cav.) Spreng. | Vig den | Herb | |
| Viguiera greggii (A. Gray) S.F. Blake | Vig gre | Shrub | |
| Zaluzania megacephala Sch. Bip. | Zal meg | Herb | |
| Berberidaceae | Alloberberis eutriphylla (Fedde) C.C.Yu & K.F.Chung | All eut | Shrub |
| Boraginaceae | Nama hispida A. Gray | Nam his | Herb |
| Brassicaceae | Lepidium virginicum L. | Lep vir | Herb |
| Bromeliaceae | Tillandsia recurvata (L.) L. | Til rec | Epiphytic |
| Cactaceae | Coryphantha hintoniorum Dicht & A. Lüthy | Cor hin | Cacti |
| Echinocereus knippelianus Liebner | Ech kni | Cacti | |
| Opuntia engelmannii Salm-Dyck | Opu eng | Cacti | |
| Campanulaceae | Lobelia ehrenbergii Vatke | Lob ehr | Herb |
| Caprifoliaceae | Lonicera pilosa (Kunth) Spreng. | Lon pil | Vine |
| Caryophyllaceae | Arenaria lycopodioides Willd. ex D.F.K. Schltdl. | Are lyc | Herb |
| Drymaria glandulosa Bartl. | Dry gla | Herb | |
| Paronychia mexicana Hemsl. | Par mex | Herb | |
| Commelinaceae | Gibasis geniculata (Jacq.) Rohweder | Gib gen | Herb |
| Gibasis karwinskyana (Schult. f.) Rohweder | Gib kar | Herb | |
| Convolvulaceae | Dichondra argentea Humb. & Bonpl. ex Willd. | Dic arg | Herb |
| Dichondra brachypoda Wooton & Standl. | Dic bra | Herb | |
| Ipomoea costellata Torr. | Ipo cos | Herb | |
| Cupressaceae | Juniperus coahuilensis (Martínez) Gaussen | Jun coa | Shrub |
| Juniperus deppeana Steud. | Jun dep | Tree | |
| Juniperus flaccida Schltdl. | Jun fla | Tree | |
| Cyperaceae | Carex schiedeana Kunze | Car sch | Herb |
| Ericaceae | Arbutus xalapensis Kunth | Arb xal | Tree |
| Arctostaphylos pungens Kunth | Arc pun | Shrub | |
| Euphorbiaceae | Euphorbia brachycera Engelm. | Eup bra | Herb |
| Euphorbia dentata Michx. | Eup den | Herb | |
| Euphorbia exstipulata Engelm. | Eup exs | Herb | |
| Euphorbia macropus (Klotzsch & Garcke) Boiss. | Eup mac | Herb | |
| Euphorbia serrula Engelm. | Eup ser | Herb | |
| Evolvulus sericeus Sw. | Evo ser | Herb | |
| Tragia ramosa Torr. | Tra ram | Herb | |
| Fabaceae | Astragalus sanguineus Rydb. | Ast san | Herb |
| Cologania angustifolia Kunth | Col ang | Herb | |
| Cologania pallida Rose | Col pal | Herb | |
| Dalea bicolor Humb. & Bonpl. ex Willd. | Dal bic | Shrub | |
| Dalea capitata S. Watson | Dal cap | Shrub | |
| Dalea radicans S. Watson | Dal rad | Shrub | |
| Mimosa aculeaticarpa Ortega | Mim acu | Shrub | |
| Senna demissa (Rose) H.S. Irwin & Barneby | Sen dem | Herb | |
| Fagaceae | Quercus microphylla Née | Que mic | Shrub |
| Quercus pringlei Seemen | Que pri | Shrub | |
| Quercus saltillensis Trel. | Que sal | Shrub | |
| Geraniaceae | Geranium seemannii Peyr. | Ger sem | Herb |
| Hydrangeaceae | Philadelphus microphyllus A. Gray | Phi mic | Shrub |
| Lamiaceae | Hedeoma costata A. Gray | Hed cos | Herb |
| Salvia glechomifolia Kunth | Sal gle | Herb | |
| Salvia greggii A. Gray | Sal gre | Shrub | |
| Salvia regla Cav. | Sal reg | Shrub | |
| Scutellaria potosina Brandegee | Scu pot | Herb | |
| Liliaceae | Echeandia flavescens (Schult. & Schult. f.) Cruden | Ech fla | Herb |
| Linaceae | Linum schiedeanum Schltdl. & Cham. | Lin sch | Herb |
| Schoenocaulon texanum Scheele | Sch tex | Herb | |
| Nyctaginaceae | Mirabilis oblongifolia (A. Gray) Heimerl | Mir obl | Herb |
| Oleaceae | Forestiera reticulata Torr. | For ret | Shrub |
| Fraxinus greggii A. Gray | Fra gre | Shrub | |
| Onagraceae | Calylophus berlandieri Spach | Cal ber | Herb |
| Oenothera rosea L’Hér. ex Aiton | Oen ros | Herb | |
| Orchidaceae | Goodyera oblongifolia Raf. | Goo obl | Herb |
| Hexalectris grandiflora (A. Rich. & Galeotti) L.O. Williams | Hex gra | Herb | |
| Malaxis brachystachys (Lindl.) Rchb. f. | Mal bra | Herb | |
| Oxalidaceae | Oxalis corniculata L. | Oxa cor | Herb |
| Oxalis latifolia Kunth | Oxa lat | Herb | |
| Passifloraceae | Passiflora suberosa L. | Pas sub | Herb |
| Pinaceae | Pinus cembroides Zucc. | Pin cem | Tree |
| Pinus arizonica Engelm. var. stormiae Martínez | Pin ari | Tree | |
| Plantagiaceae | Mecardonia vandellioides (Kunth) Pennell | Mer van | Herb |
| Poaceae | Achnatherum multinode (Scribn. ex Beal) Valdés-Reyna & Barkworth | Ach mul | Herb |
| Bouteloua dactyloides (Nutt.) Columbus | Bou dac | Herb | |
| Bouteloua uniflora Vasey | Bou uni | Herb | |
| Brachypodium mexicanum (Roem. & Schult.) Link | Bra mex | Herb | |
| Bromus anomalus Rupr. ex E. Fourn. | Bro ano | Herb | |
| Bromus carinatus Hook. & Arn. | Bro car | Herb | |
| Elymus arizonicus (Scribn. & J.G. Sm.) Gould | Ely ari | Herb | |
| Muhlenbergia dubia E. Fourn. | Muh dub | Herb | |
| Muhlenbergia emersleyi Vasey | Muh eme | Herb | |
| Muhlenbergia glauca (Nees) B.D. Jacks. | Muh gla | Herb | |
| Muhlenbergia phleoides (Kunth) Columbus | Muh phl | Herb | |
| Muhlenbergia rigida (Kunth) Kunth | Muh rig | Herb | |
| Muhlenbergia setifolia Vasey | Muh set | Herb | |
| Nassella leucotricha (Trin. & Rupr.) R.W. Pohl | Nas leu | Herb | |
| Piptochaetium fimbriatum (Kunth) Hitchc. | Pip fim | Herb | |
| Schizachyrium sanguineum (Retz.) Alston | Sch san | Herb | |
| Trisetum filifolium Scribn. ex Beal | Tri fil | Herb | |
| Zuloagaea bulbosa (Kunth) E. Bess | Zul bul | Herb | |
| Polemoniaceae | Loeselia greggii S. Watson | Loe gre | Herb |
| Polygalaceae | Hebecarpa barbeyana (Chodat) J.R. Abbott | Heb bar | Herb |
| Polygala dolichocarpa S.F. Blake | Pol dol | Herb | |
| Polygala shinnersii W.H. Lewis | Pol shi | Herb | |
| Rhinotropis lindheimeri (A. Gray) J.R. Abbott | Rhi lin | Herb | |
| Polygonaceae | Eriogonum atrorubens Engelm. | Eio atr | Herb |
| Portulacaceae | Talinum aurantiacum Engelm. | Tal aur | Herb |
| Pteridaceae | Pellaea intermedia Mett. ex Kuhn | Pel int | Herb |
| Myriopteris rufa Fée | Myr ruf | Herb | |
| Ranunculaceae | Clematis drummondii Torr. & A. Gray | Cle dru | Herb |
| Clematis pitcheri Torr. & A. Gray | Cle pit | Herb | |
| Rhamnaceae | Ceanothus greggii A. Gray | Cea gre | Shrub |
| Rosaceae | Lindleya mespiloides Kunth | Lin mes | Shrub |
| Prunus cercocarpifolia Villarreal | Pru cer | Shrub | |
| Prunus serotina Ehrh. | Pru ser | Shrub | |
| Purshia plicata (D. Don) Henrickson | Pur pli | Shrub | |
| Rubiaceae | Bouvardia ternifolia (Cav.) Schltdl. | Bou ter | Shrub |
| Crusea diversifolia (Kunth) W.R. Anderson | Cru div | Herb | |
| Hedyotis palmeri (A. Gray) W.H. Lewis | Hed pal | Herb | |
| Santalaceae | Phoradendron leucarpum (Raf.) Reveal & M.C. Johnst. | Pho leu | Mistletoe |
| Scrophulariaceae | Castilleja scorzonerifolia Kunth | Cas sco | Herb |
| Solanaceae | Nierembergia angustifolia Kunth | Nie ang | Herb |
| Physalis hederifolia A. Gray | Phy hed | Herb | |
| Solanum verrucosum Schltdl. | Sol ver | Herb | |
| Verbenaceae | Verbena neomexicana Small | Ver neo | Herb |
| Violaceae | Hybanthus verbenaceus (Kunth) Loes. | Hyb ver | Herb |
| Hybanthus verticillatus (Ortega) Baill. | Hyb vrt | Herb |
References
- Arévalo, J.R.; de Nascimento, L.; Fernández-Lugo, S.; Mata, J.; Bermejo, L. Grazing effects on species composition in different vegetation types (La Palma, Canary Islands). Acta Oecol. 2011, 37, 230–238. [Google Scholar] [CrossRef]
- Teague, R.; Barnes, M. Grazing management that regenerates ecosystem function and grazingland livelihoods. Afr. J. Range Forage Sci. 2017, 34, 77–86. [Google Scholar] [CrossRef]
- Casado, M.A.; Castro, I.; Ramírez-Sanz, L.; Costatenorio, M.; De Miguel, J.M.; Pineda, F.D. Herbaceous plant richness and vegetation cover in Mediterranean grasslands and shrublands. Plant Ecol. 2004, 170, 83–91. [Google Scholar] [CrossRef]
- Arévalo, J.R.; Chinea, E.; Barquín, E. Pasture management under goat grazing in Canary Islands. Agric. Ecosyst. Environ. 2007, 118, 291–296. [Google Scholar] [CrossRef]
- Tarhouni, M.; Hmida, W.B.; Neffati, M. Long term changes in plant life forms as a consequence of grazing exclusion under arid climatic conditions. Land Degrad. Dev. 2017, 28, 1199–1211. [Google Scholar] [CrossRef]
- Challenger, A. Utilización y conservación de los ecosistemas terrestres de México: Pasado, presente y futuro. In Conabio-Instituto de Biología; UNAM-Agrupación Sierra Madre: Ciudad de México, Mexico, 1998. [Google Scholar]
- Gernandt, D.S.; Liston, A.; Piñero, D. Phylogenetics of Pinus subsections Cembroides and Nelsoniae inferred from cpDNA Sequences. Syst. Bot. 2003, 28, 657–673. [Google Scholar]
- Perry, J.P. The Pines of Mexico and Central America; Timber Press: Portland, OR, USA, 1991. [Google Scholar]
- González-Elizondo, M.S.; González-Elizondo, M.; Tena-Flores, J.A.; Ruacho-González, L.; López-Enríquez, L.L. Vegetación de la sierra madre occidental, México: Una síntesis. Acta Bot. Mex. 2012, 100, 351–403. [Google Scholar] [CrossRef] [Green Version]
- Rzedowski, J. Vegetación de México. 1era. Edición Digital; Comisión Nacional para el Conocimiento y Uso de la Biodiversidad: Ciudad de México, Mexico, 2006. [Google Scholar]
- Anonymous. Decreto del Área Natural Protegida, con Carácter de Zona Sujeta a Conservación Ecológica, un Área de la Serranía Conocida Como Zapalinamé; Periódico Oficial del Estado: Saltillo, Mexico, 1996. [Google Scholar]
- Encina-Domínguez, J.A.; Estrada-Castillón, E.; Villarreal-Quintanilla, J.A.; Villaseñor, J.L.; Cantú-Ayala, C.M.; Arévalo, J.R. Floristic richness of the Sierra de Zapalinamé, Coahuila, México. Phytotaxa 2016, 283, 1–42. [Google Scholar] [CrossRef]
- Li, M.H.; Du, Z.; Pan, H.L.; Yan, C.F.; Xiao, W.F.; Lei, J.P. Effects of neighboring woody plants on target trees with emphasis on effects of understorey shrubs on overstorey physiology in forest communities: A mini-review. Community Ecol. 2012, 13, 117–128. [Google Scholar] [CrossRef]
- UAAAN. Programa de Manejo de la Zona Sujeta a Conservación Ecológica “Sierra de Zapalinamé”; Secretaria de Desarrollo Social, Gobierno del estado de Coahuila, Universidad Autónoma Agraria Antonio Narro: Saltillo, Mexico, 1998. [Google Scholar]
- Encina-Domínguez, J.A.; Villarreal-Quintanilla, J.A.; Estrada-Castillón, E.; Rueda-Moreno, O. Situación actual de la vegetación de la Sierra de Zapalinamé, Coahuila, México. Bot. Sci. 2019, 97, 630–648. [Google Scholar] [CrossRef]
- Arévalo, J.R.; Encina-Domínguez, J.A.; Mellado, M.; García-Martínez, J.E.; Cruz-Anaya, A. Impact of 25 years of grazing on the forest structure of Pinus cembroides in northeast México. Acta Oecol. 2021, 111, 103743. [Google Scholar] [CrossRef]
- Lemmon, P.E. A new instrument for measuring forest overstory density. J. For. 1957, 55, 667–668. [Google Scholar]
- Encina-Domínguez, J.A.; Arévalo-Sierra, J.R.; Estrada-Castillón, E.; Mellado-Bosque, M. Environmental and soil variables affecting the structure and floristic woody composition of oak forests of northeastern Mexico. Turk. J. Agric. For. 2018, 42, 262–271. [Google Scholar] [CrossRef]
- Nelson, D.W.; Sommer, L.E. Total Carbon, Organic Carbon and Organic Matter. In Methods of Soil Analysis, Part 2. Chemical and Microbiological Properties, 2nd ed.; ASA-SSSA: Madison, WI, USA, 1982. [Google Scholar]
- Olsen, S.R.; Cole, C.V.; Watanabe, F.S.; Dean, L.A. Estimation of Available Phosphorus in Soils by Extraction with Sodium Bicarbonate; USDA Circular No. 939; U.S. Department of Agriculture: St. Paul, MN, USA, 1954; pp. 1–19.
- SEMARNAT. Norma Oficial Mexicana NOM-021-SEMARNAT-2000. Establece las Especificaciones de Fertilidad, Salinidad y Clasificación de Suelos. Estudios, Muestreo y Análisis; Diario Oficial de la Federación; Secretaria de Medio Ambiente y Recursos Naturales: Ciudad de México, Mexico, 2000. [Google Scholar]
- Fernández-Linares, L.C.; Rojas-Avelizapa, N.G.; Roldan-Carrillo, T.G.; Ramírez-Islas, M.E.; Zegarra-Martínez, H.G.; Uribe-Hernández, R.; Reyes-Ávila, R.J.; Flores-Hernández, D.; Arce-Ortega, J.M. Manual de Técnicas de Análisis de Suelos Aplicadas a la Remediación de Sitios Contaminados; Instituto Mexicano del Petróleo, Secretaría de Medio Ambiente y Recursos Natural, Instituto Nacional de Ecología: Ciudad de México, Mexico, 2006. [Google Scholar]
- Anderson, M.; Gorley, R.N.; Clarke, R.K. Permanova+ for Primer: Guide to Software and Statistical Methods; PRIMER-E: Plymouth, UK, 2008. [Google Scholar]
- Smith, B.; Wilson, J.B. A consumer’s guide to evenness indices. Oikos 1996, 76, 70–82. [Google Scholar] [CrossRef]
- Hill, M.O.; Gauch, H.J., Jr. Detrended Correspondence Analysis: An improved ordination technique. Vegetatio 1980, 42, 47–58. [Google Scholar] [CrossRef]
- ter Braak, C.J.F.; Ŝmilauer, P. Canoco Reference Manual and User’s Guide to Canoco for Windows: Software for Canonical Community Ordination (Version 5.1); Microcomputer Power: Ithaca, NY, USA, 2018. [Google Scholar]
- McCune, B.; Grace, J.B.; Urban, D.L. Analysis of Ecological Communities; MjM Software Design: Gleneden Beach, OR, USA, 2002; Volume 28. [Google Scholar]
- De Cáceres, M.; Legendre, P.; Moretti, M. Improving indicator species analysis by combining groups of sites. Oikos 2010, 119, 1674–1684. [Google Scholar] [CrossRef]
- Oksanen, J.; Blanchet, F.G.; Friendly, M.; Kindt, R.; Legendre, P.; McGlinn, D.; Minchin, P.R.; O’Hara, R.B.; Simpson, G.L.; Solymos, P.; et al. Vegan: Community Ecology Package. R Package Version 2.5-7. 2020. Available online: https://CRAN.R-project.org/package=vegan (accessed on 1 April 2022).
- Zainelabdeen, Y.M.; Yan, R.; Xin, X.; Yan, Y.; Ahmed, A.I.; Hou, L.; Zhang, Y. The Impact of Grazing on the Grass Composition in Temperate Grassland. Agronomy 2020, 10, 1230. [Google Scholar] [CrossRef]
- Kakinuma, K.; Terui, A.; Sasaki, T.; Koyama, A.; Undarmaa, J.; Okuro, T.; Takeuchi, K. Detection of vegetation trends in highly variable environments after grazing exclusion in Mongolia. J. Veg. Sci. 2017, 28, 965–974. [Google Scholar] [CrossRef]
- Noy-Meir, I.; Gutman, M.; Kaplan, Y. Responses of Mediterranean grassland plants to grazing and protection. J. Ecol. 1989, 77, 290–310. [Google Scholar] [CrossRef]
- Milchunas, D.G.; Lauenroth, W.K. Quantitative effects of grazing on vegetation and soil over a global range of environments. Ecol. Monogr. 1993, 63, 327–366. [Google Scholar] [CrossRef]
- Fernández-Lugo, S.; de Nascimento, L.; Mellado, M.; Bermejo, L.A.; Arévalo, J.R. Vegetation change and chemical soil composition after four years of goat grazing exclusion in a Canary Islands pasture. Agric. Ecosyst. Environ. 2009, 132, 276–282. [Google Scholar] [CrossRef]
- Becerra, J.; Ezcurra, E. Glandular hairs in the Arbutus xalapensis complex in relation to herbivory. Am. J. Bot. 1986, 73, 1427–1430. [Google Scholar] [CrossRef]
- Kerley, G.I.H.; Tiver, F.; Whitford, W.G. Herbivory of clonal populations: Cattle browsing affects reproduction and population structure of Yucca elata. Oecologia 1993, 93, 12–17. [Google Scholar] [CrossRef] [PubMed]
- Olff, H.; Ritchie, M.E. Effects of herbivores on grassland plant diversity. Ecol. Evol. 1998, 13, 261–265. [Google Scholar] [CrossRef] [Green Version]
- Osem, Y.; Perevolotsky, A.; Kigel, J. Site productivity and plant size explain the response of annual species to grazing exclusion in a Mediterranean semi-arid rangeland. J. Ecol. 2004, 92, 297–309. [Google Scholar] [CrossRef]
- Huston, M.A. Biological Diversity: The Coexistence of Species on Changing Landscapes; Cambridge University Press: Cambridge, UK, 1994. [Google Scholar]
- Cingolani, A.M.; Cabido, M.R.; Renison, D.; Solís-Neffa, V. Combined effects of environment and grazing on vegetation structure in Argentine granite grasslands. J. Veg. Sci. 2003, 14, 223–232. [Google Scholar] [CrossRef]
- Milchunas, D.G.; Sala, O.E.; Lauenroth, W.K. A generalized model of the effects of grazing by large herbivores on grasslands community structure. Am. Nat. 1988, 132, 87–106. [Google Scholar] [CrossRef]
- Hillebrand, H. Opposing effects of grazing and nutrients on diversity. Oikos 2003, 100, 592–600. [Google Scholar] [CrossRef]
- Altesor, A.; Oesterheld, M.; Leoni, E.; Lezama, F.; Rodríguez, C. Effect of grazing on community structure and productivity of a Uruguayan grassland. Plant Ecol. 2005, 179, 83–91. [Google Scholar] [CrossRef]
- Peco, B.; Sánchez, A.M.; Azcárate, F.M. Abandonment in grazing systems: Consequences for vegetation and soil. Agric. Ecosyst. Environ. 2006, 113, 284–294. [Google Scholar] [CrossRef]
- Schultz, N.L.; Morgan, J.W.; Lunt, I.D. Effects of grazing exclusion on plant species richness and phytomass accumulation vary across a regional productivity gradient. J. Veg. Sci. 2011, 22, 130–142. [Google Scholar] [CrossRef]
- McPherson, G.R.; Wright, H.A. Effects of cattle grazing and Juniperus pinchotii canopy cover on herb cover and production in western Texas. Am. Midl. Nat. 1990, 123, 144–151. [Google Scholar] [CrossRef]
- Rutherford, M.C.; Powrie, L.W. Impacts of heavy grazing on plant species richness: A comparison across rangeland biomes of South Africa. S. Afr. J. Bot. 2013, 87, 146–156. [Google Scholar] [CrossRef] [Green Version]
- Valdés-Reyna, J. Gramíneas de Coahuila; Comisión Nacional para el Conocimiento y Uso de la Biodiversidad: Ciudad de Mèxico, Mexico, 2015. [Google Scholar]
- CONABIO (Comisión Nacional para el Conocimiento y Uso de la Biodiversidad). Malezas de México. 2021. Available online: http://www.conabio.gob.mx/malezasdemexico/2inicio/paginas/lista-plantas-generos.htm (accessed on 15 April 2021).
- SEMARNAT (Secretaría del Medio Ambiente y Recursos Naturales). Norma Oficial Mexicana NOM-059-SEMARNAT-2010 que Determina las Especies Nativas de México de Flora y Fauna Silvestres—Categorías de Riesgo y Especificaciones para su Inclusión, Exclusión o Cambio—Lista de Especies en Riesgo; 2nd Section; Diario Oficial de la Federación: Ciudad de Mèxico, Mexico, 30 December 2010. [Google Scholar]
- Arévalo, J.R.; Delgado, J.D.; Otto, R.; Naranjo, A.; Salas, M.; Fernández-Palacios, J.M. Distribution of alien vs. native plant species in roadside communities along an altitudinal gradient in Tenerife and Gran Canaria (Canary Islands). Perspect. Plant Ecol. Evol. Syst. 2005, 7, 185–202. [Google Scholar] [CrossRef]
- Campbell, K.J.; Donlan, C.J. A review of feral goat eradication on islands. Conserv. Biol. 2005, 19, 62–74. [Google Scholar] [CrossRef]
- Carrete, M.; Serrano, D.; Illera, J.C.; López, G.; Vögeli, M.; Delgado, A.; Tella, J. Goats, birds, and emergent diseases: Apparent and hidden effects of exotic species in an island environment. Ecol. Appl. 2009, 19, 840–853. [Google Scholar] [CrossRef]
- Gangoso, L.; Donazar, J.; Scholz, S.; Palacios, C.J.; Hiraldo, F. Contradiction in conservation of island ecosystems: Plants, introduced herbivores and avian scavengers in the Canary Islands. Biodivers. Conserv. 2006, 15, 2231–2248. [Google Scholar] [CrossRef] [Green Version]


| % Cover | ||||||||||
| Plots | Treatment (1) | Alt (m) | Slope | Grass * | Woody * | Rock | Soil * | Litter * | Canopy | |
| PG1 | Grazed | 2351 | 10 | 25 | 25 | 3 | 1 | 60 | 53.6 | |
| PG2 | Grazed | 2346 | 11 | 60 | 5 | 2 | 2 | 20 | 47.2 | |
| PG3 | Grazed | 2342 | 39 | 20 | 10 | 3 | 10 | 10 | 56.6 | |
| PG4 | Grazed | 2356 | 28 | 30 | 15 | 15 | 20 | 10 | 52.8 | |
| PG5 | Grazed | 2372 | 10 | 40 | 10 | 2 | 30 | 15 | 55.6 | |
| PG6 | Grazed | 2372 | 10 | 55 | 15 | 1 | 30 | 20 | 49.8 | |
| PG7 | Grazed | 2379 | 9 | 50 | 10 | 1 | 30 | 20 | 52 | |
| PG8 | Grazed | 2394 | 10 | 45 | 10 | 1 | 45 | 15 | 55.2 | |
| Average | 2364.0 | 15.9 | 40.6 | 12.5 | 3.5 | 21.0 | 21.3 | 52.9 | ||
| SD | 18.1 | 11.3 | 14.5 | 6.0 | 4.7 | 15.6 | 16.2 | 3.2 | ||
| PC2 | Control | 2419 | 10 | 80 | 5 | 1 | 2 | 2 | 55.4 | |
| PC3 | Control | 2436 | 10 | 70 | 10 | 2 | 5 | 3 | 57.2 | |
| PC4 | Control | 2450 | 12 | 70 | 10 | 1 | 2 | 7 | 43.6 | |
| PC5 | Control | 2468 | 10 | 85 | 5 | 1 | 2 | 10 | 52.2 | |
| PC6 | Control | 2466 | 11 | 85 | 7 | 1 | 1 | 2 | 36.6 | |
| PC7 | Control | 2498 | 11 | 65 | 5 | 3 | 15 | 7 | 53.6 | |
| PC8 | Control | 2501 | 11 | 70 | 5 | 1 | 1 | 10 | 42 | |
| Average | 2458.4 | 10.8 | 75.6 | 6.5 | 1.4 | 4.0 | 5.8 | 49.8 | ||
| SD | 30.5 | 0.7 | 7.8 | 2.3 | 0.7 | 4.7 | 3.3 | 7.9 | ||
| % | % | ppm | µS/cm | meq/100 g | ||||||
| Plots | pH | OM | TN | P Ols | EC | Ca | Mg | Na | K | CEC |
| PG1 | 7.5 | 15.5 | 0.63 | 21.65 | 1048 | 4.4 | 12.4 | 10,463.2 | 0.2 | 39 |
| PG2 | 7.2 | 13.8 | 0.64 | 20.13 | 1223 | 12 | 16 | 12,202 | 0.2 | 12 |
| PG3 | 5.2 | 14.5 | 0.81 | 25.36 | 1387 | 12 | 6 | 13,852 | 0.28 | 29 |
| PG4 | 7.4 | 17.5 | 0.75 | 11.36 | 1471 | 12 | 8 | 14,690 | 0.18 | 30 |
| PG5 | 4.0 | 14.5 | 0.47 | 8.35 | 1580 | 10 | 10 | 15,780 | 0.31 | 25 |
| PG6 | 7.6 | 6.9 | 0.4 | 17.37 | 1262 | 20 | 4.8 | 12,595.2 | 0.22 | 21 |
| PG7 | 6.8 | 7.8 | 0.27 | 3.01 | 916 | 8.4 | 11.6 | 9140 | 0.26 | 20 |
| PG8 | 2.3 | 6.2 | 0.26 | 3.28 | 374 | 12 | 20 | 3708 | 0.22 | 30 |
| Avg | 6.0 | 12.1 | 0.5 | 13.8 | 1157.6 | 11.4 | 11.1 | 11,553.8 | 0.2 | 25.8 |
| Std | 2.0 | 4.4 | 0.2 | 8.5 | 383.4 | 4.4 | 5.1 | 3837.0 | 0.0 | 8.2 |
| PC1 | 7.3 | 17.8 | 0.58 | 11.36 | 1238 | 8.4 | 12 | 12,359.6 | 0.22 | 30 |
| PC2 | 4.0 | 7.4 | 0.27 | 11.64 | 971 | 10.8 | 9.2 | 9690 | 0.2 | 24 |
| PC3 | 7.3 | 18.2 | 0.5 | 6.71 | 1282 | 14 | 10 | 12,796 | 0.41 | 32 |
| PC4 | 7.7 | 7.8 | 0.31 | 3.56 | 1022 | 8.8 | 12 | 10,199.2 | 0.17 | 30 |
| PC5 | 7.5 | 9.1 | 0.46 | 10.54 | 970 | 8 | 4 | 9688 | 0.27 | 25 |
| PC6 | 7.6 | 24.5 | 0.77 | 17.65 | 1366 | 14 | 6 | 13,640 | 0.17 | 14 |
| PC7 | 7.3 | 14.5 | 0.77 | 17.65 | 1027 | 10 | 10.4 | 10,249.6 | 0.23 | 25 |
| PC8 | 7.0 | 17.5 | 0.71 | 18.89 | 1365 | 15.2 | 16.8 | 13,618 | 0.27 | 12 |
| Avg | 6.9 | 14.6 | 0.5 | 12.3 | 1155.1 | 11.2 | 10.1 | 11,530.1 | 0.2 | 24.0 |
| Std | 1.2 | 6.1 | 0.2 | 5.5 | 174.8 | 2.9 | 3.9 | 1744.0 | 0.1 | 7.4 |
Publisher’s Note: MDPI stays neutral with regard to jurisdictional claims in published maps and institutional affiliations. |
© 2022 by the authors. Licensee MDPI, Basel, Switzerland. This article is an open access article distributed under the terms and conditions of the Creative Commons Attribution (CC BY) license (https://creativecommons.org/licenses/by/4.0/).
Share and Cite
Encina-Domínguez, J.A.; Estrada-Castillón, E.; Mellado, M.; González-Montelongo, C.; Arévalo, J.R. Livestock Grazing Impact on Species Composition and Richness Understory of the Pinus cembroides Zucc. Forest in Northeastern Mexico. Forests 2022, 13, 1113. https://doi.org/10.3390/f13071113
Encina-Domínguez JA, Estrada-Castillón E, Mellado M, González-Montelongo C, Arévalo JR. Livestock Grazing Impact on Species Composition and Richness Understory of the Pinus cembroides Zucc. Forest in Northeastern Mexico. Forests. 2022; 13(7):1113. https://doi.org/10.3390/f13071113
Chicago/Turabian StyleEncina-Domínguez, Juan A., Eduardo Estrada-Castillón, Miguel Mellado, Cristina González-Montelongo, and José Ramón Arévalo. 2022. "Livestock Grazing Impact on Species Composition and Richness Understory of the Pinus cembroides Zucc. Forest in Northeastern Mexico" Forests 13, no. 7: 1113. https://doi.org/10.3390/f13071113