Article

Canopy Transpiration and Stomatal Conductance Dynamics of Ulmus pumila L. and Caragana korshinskii Kom. Plantations on the Bashang Plateau, China

1
School of Geographical Sciences, Hebei Normal University, Shijiazhuang 050024, China
2
Hebei Key Laboratory of Environmental Change and Ecological Construction, Shijiazhuang 050024, China
3
Hebei Technology Innovation Center for Remote Sensing Identification of Environmental Change, Shijiazhuang 050024, China
4
School of Land Science and Space Planning, Hebei GEO University, Shijiazhuang 050031, China
5
International Science and Technology Cooperation Base of Hebei Province, Hebei International Joint Research Center for Remote Sensing of Agricultural Drought Monitoring, Hebei GEO University, Shijiazhuang 050031, China
6
Hebei Province Collaborative Innovation Center for Sustainable Utilization of Water Resources and Optimization of Industrial Structure, Hebei GEO University, Shijiazhuang 050031, China
7
College of Geography and Land Engineering, Yuxi Normal University, Yuxi 653100, China
*
Author to whom correspondence should be addressed.
Forests 2022, 13(7), 1081; https://doi.org/10.3390/f13071081
Submission received: 17 June 2022 / Revised: 4 July 2022 / Accepted: 8 July 2022 / Published: 9 July 2022
(This article belongs to the Special Issue Forest Ecohydrology: From Theory to Practice)

Abstract

:
Constructing protective forests to control water and soil erosion is an effective measure to address land degradation in the Bashang Plateau of North China, but forest dieback has occurred frequently due to severe water deficits in recent decades. However, transpiration dynamics and their biophysical control factors under various soil water contents for different forest functional types are still unknown. Here, canopy transpiration and stomatal conductance of a 38-year-old Ulmus pumila L. and a 20-year-old Caragana korshinskii Kom. were quantified using the sap flow method, while simultaneously monitoring the meteorological and soil water content. The results showed that canopy transpiration averaged 0.55 ± 0.34 mm d−1 and 0.66 ± 0.32 mm d−1 for U. pumila, and was 0.74 ± 0.26 mm d−1 and 0.77 ± 0.24 mm d−1 for C. korshinskii in 2020 and 2021, respectively. The sensitivity of canopy transpiration to vapor pressure deficit (VPD) decreased as soil water stress increased for both species, indicating that the transpiration process is significantly affected by soil drought. Additionally, canopy stomatal conductance averaged 1.03 ± 0.91 mm s−1 and 1.34 ± 1.22 mm s−1 for U. pumila, and was 1.46 ± 0.90 mm s−1 and 1.51 ± 1.06 mm s−1 for C. korshinskii in 2020 and 2021, respectively. The low values of the decoupling coefficient (Ω) showed that canopy and atmosphere were well coupled for both species. Stomatal sensitivity to VPD decreased with decreasing soil water content, indicating that both U. pumila and C. korshinskii maintained a water-saving strategy under the stressed water conditions. Our results enable better understanding of transpiration dynamics and water-use strategies of different forest functional types in the Bashang Plateau, which will provide important insights for planted forests management and ecosystem stability under future climate changes.

1. Introduction

Afforestation is an important ecological measure for restoring fragile and degraded land. China has the largest afforested area in the world, with the area of planted forests accounting for about 23% of the global plantation area [1]. The area of planted forests in China now stands at about 69.33 × 10⁶ ha. Planted forests can effectively contribute to improving the functions of water and soil conservation, sand-fixing, carbon storage, and adjusting the microclimate of weak ecological environment systems [2,3]. However, under the influence of global climate change-induced drought and human activities, these planted forests, especially in arid and semiarid regions, have suffered severe canopy dieback and mortality approximately 30–35 years after planting [4,5]. Immense afforestation may consume too much water and cause a severe water deficit, and, compared with native plantation species, introduced plantation species cause a greater reduction in soil water availability, negatively impacting ecosystem services and functions [6,7]. Transpiration and related water-use strategies are fundamental to understanding the physiological processes of plantations and play a vital role in their survival and growth, especially in semiarid and arid regions, where water availability is greatly affected by the increased frequency and intensity of droughts [8,9]. However, previous studies have shown that the effects of excessive water loss caused by transpiration and its environmental driving factors differ significantly, resulting in different growth performances among different functional types [10,11,12]. Therefore, it is imperative to understand the transpiration processes and dynamics of planted tree and shrub species and how these processes change from their normal functions.
Transpiration, the plant process in which water is consumed from the soil and released into the atmosphere, is an important parameter in understanding forest hydrological processes and further determining the forest water balance [13,14]. The accurate quantification of forest transpiration is essential for tree physiology and ecohydrology [15,16]. Based on their advantages of simple operation, relatively low cost, fewer limitations in environmental conditions, and increasingly robust features, sap flow measurements have been considered the most practical method to estimate tree transpiration at both the individual and stand scales [17,18]. Environmental factors, including solar radiation, air temperature, wind speed, vapor pressure deficit (VPD), and soil water content, have significant impacts on the transpiration process. These abiotic factors can be divided into two aspects: evaporative demand (potential evapotranspiration, PET) and water supply [19]. In semiarid and arid regions, soil water availability is a critical factor for plantation growth and vegetation productivity due to its influence on plant transpiration [20]. Previous studies showed that soil water stress in plantations occurs when relative extractable water content (REW) is below a threshold of 0.4 [21,22]. A linear or nonlinear relationship, including exponential and polynomial functions, was found between transpiration and evaporative demand when REW > 0.4, whereas, when REW < 0.4, increased soil water stress influenced transpiration, which was expressed following exponential and polynomial functions for evaporative demand for different planted forests [23]. Moreover, transpiration is regulated via canopy stomatal conductance (Gc) in response to variations in VPD and soil water content. High VPD causes a decrease in canopy stomatal conductance. In order to prevent irreversible damage to tree hydraulic traits, transpiration then gradually increases nonlinearly with increasing VPD, and is maintained or decreases when the canopy stomata begin to close. However, different specific nonlinear functions, such as exponential functions [24], logarithmic functions, and polynomial functions [25], have been reported for different plantation types in different artificial ecosystems. Additionally, reduced soil water availability may decrease hydraulic conductance from soil to leaves, causing canopy stomatal closure to avoid embolism and hydraulic failure, and thereby reducing tree transpiration. Denham et al. quantified the collaborative influence of soil water content and VPD along a hydro-climatological gradient, and indicated that a more sensitive relationship between canopy stomatal conductance and soil water content was found in dry than in wet sites [26]. Most climate models predict that soil droughts will be more frequent and more severe in semiarid and arid regions [27]. However, few studies have explored the impact of environmental factors on transpiration and Gc under different soil water availability conditions, and influenced by climate change-induced drought. Moreover, it is also unclear whether these relationships exhibit interspecific differences among different forest functional types.
The Bashang Plateau is one of the most vulnerable and sensitive portions of northern China, and is a major source of dust and sand storms that affect Beijing and its surrounding areas. Land degradation and desertification are the most serious environmental problems in this area. A series of afforestation projects have been implemented by China’s government during the past four decades, e.g., the Grain-for-Green Program, the Three-North Shelterbelt Program, and the Beijing-Tianjin Sand Source Restoration Project, to address land degradation and improve the regional ecological environment [28,29]. Many fast-growing and stress-tolerant species, such as Populus simonii Carr, Pinus sylvestris var. mongolica Litv, Ulmus pumila L, and Caragana korshinskii Kom were planted to improve vegetation cover and control wind and sand erosion. The degree of desertification on the Bashang Plateau has improved significantly during the past four decades. However, these plantations have frequently suffered canopy dieback and mortality in recent years. The main reason for this is related to water deficiency, which affected plantations’ transpiration dynamics and water-use strategies. U. pumila is a major native tree species and C. korshinskii is an introduced shrub species. Nevertheless, the transpiration processes of the two functional types are still not fully understood, and the biophysical control factors of transpiration under various soil water availability conditions are still unknown. The objectives of this study were to explore: (1) canopy transpiration and stomatal conductance processes during the growing season for U. pumila (native species) and C. korshinskii (introduced species); and (2) the biophysical mechanisms of canopy transpiration control under different soil water content conditions. The results can provide a deep understanding of the water-use dynamics of planted tree and shrub species, and thus provide scientific guidance for afforestation species selection and optimal allocation.

2. Materials and Methods

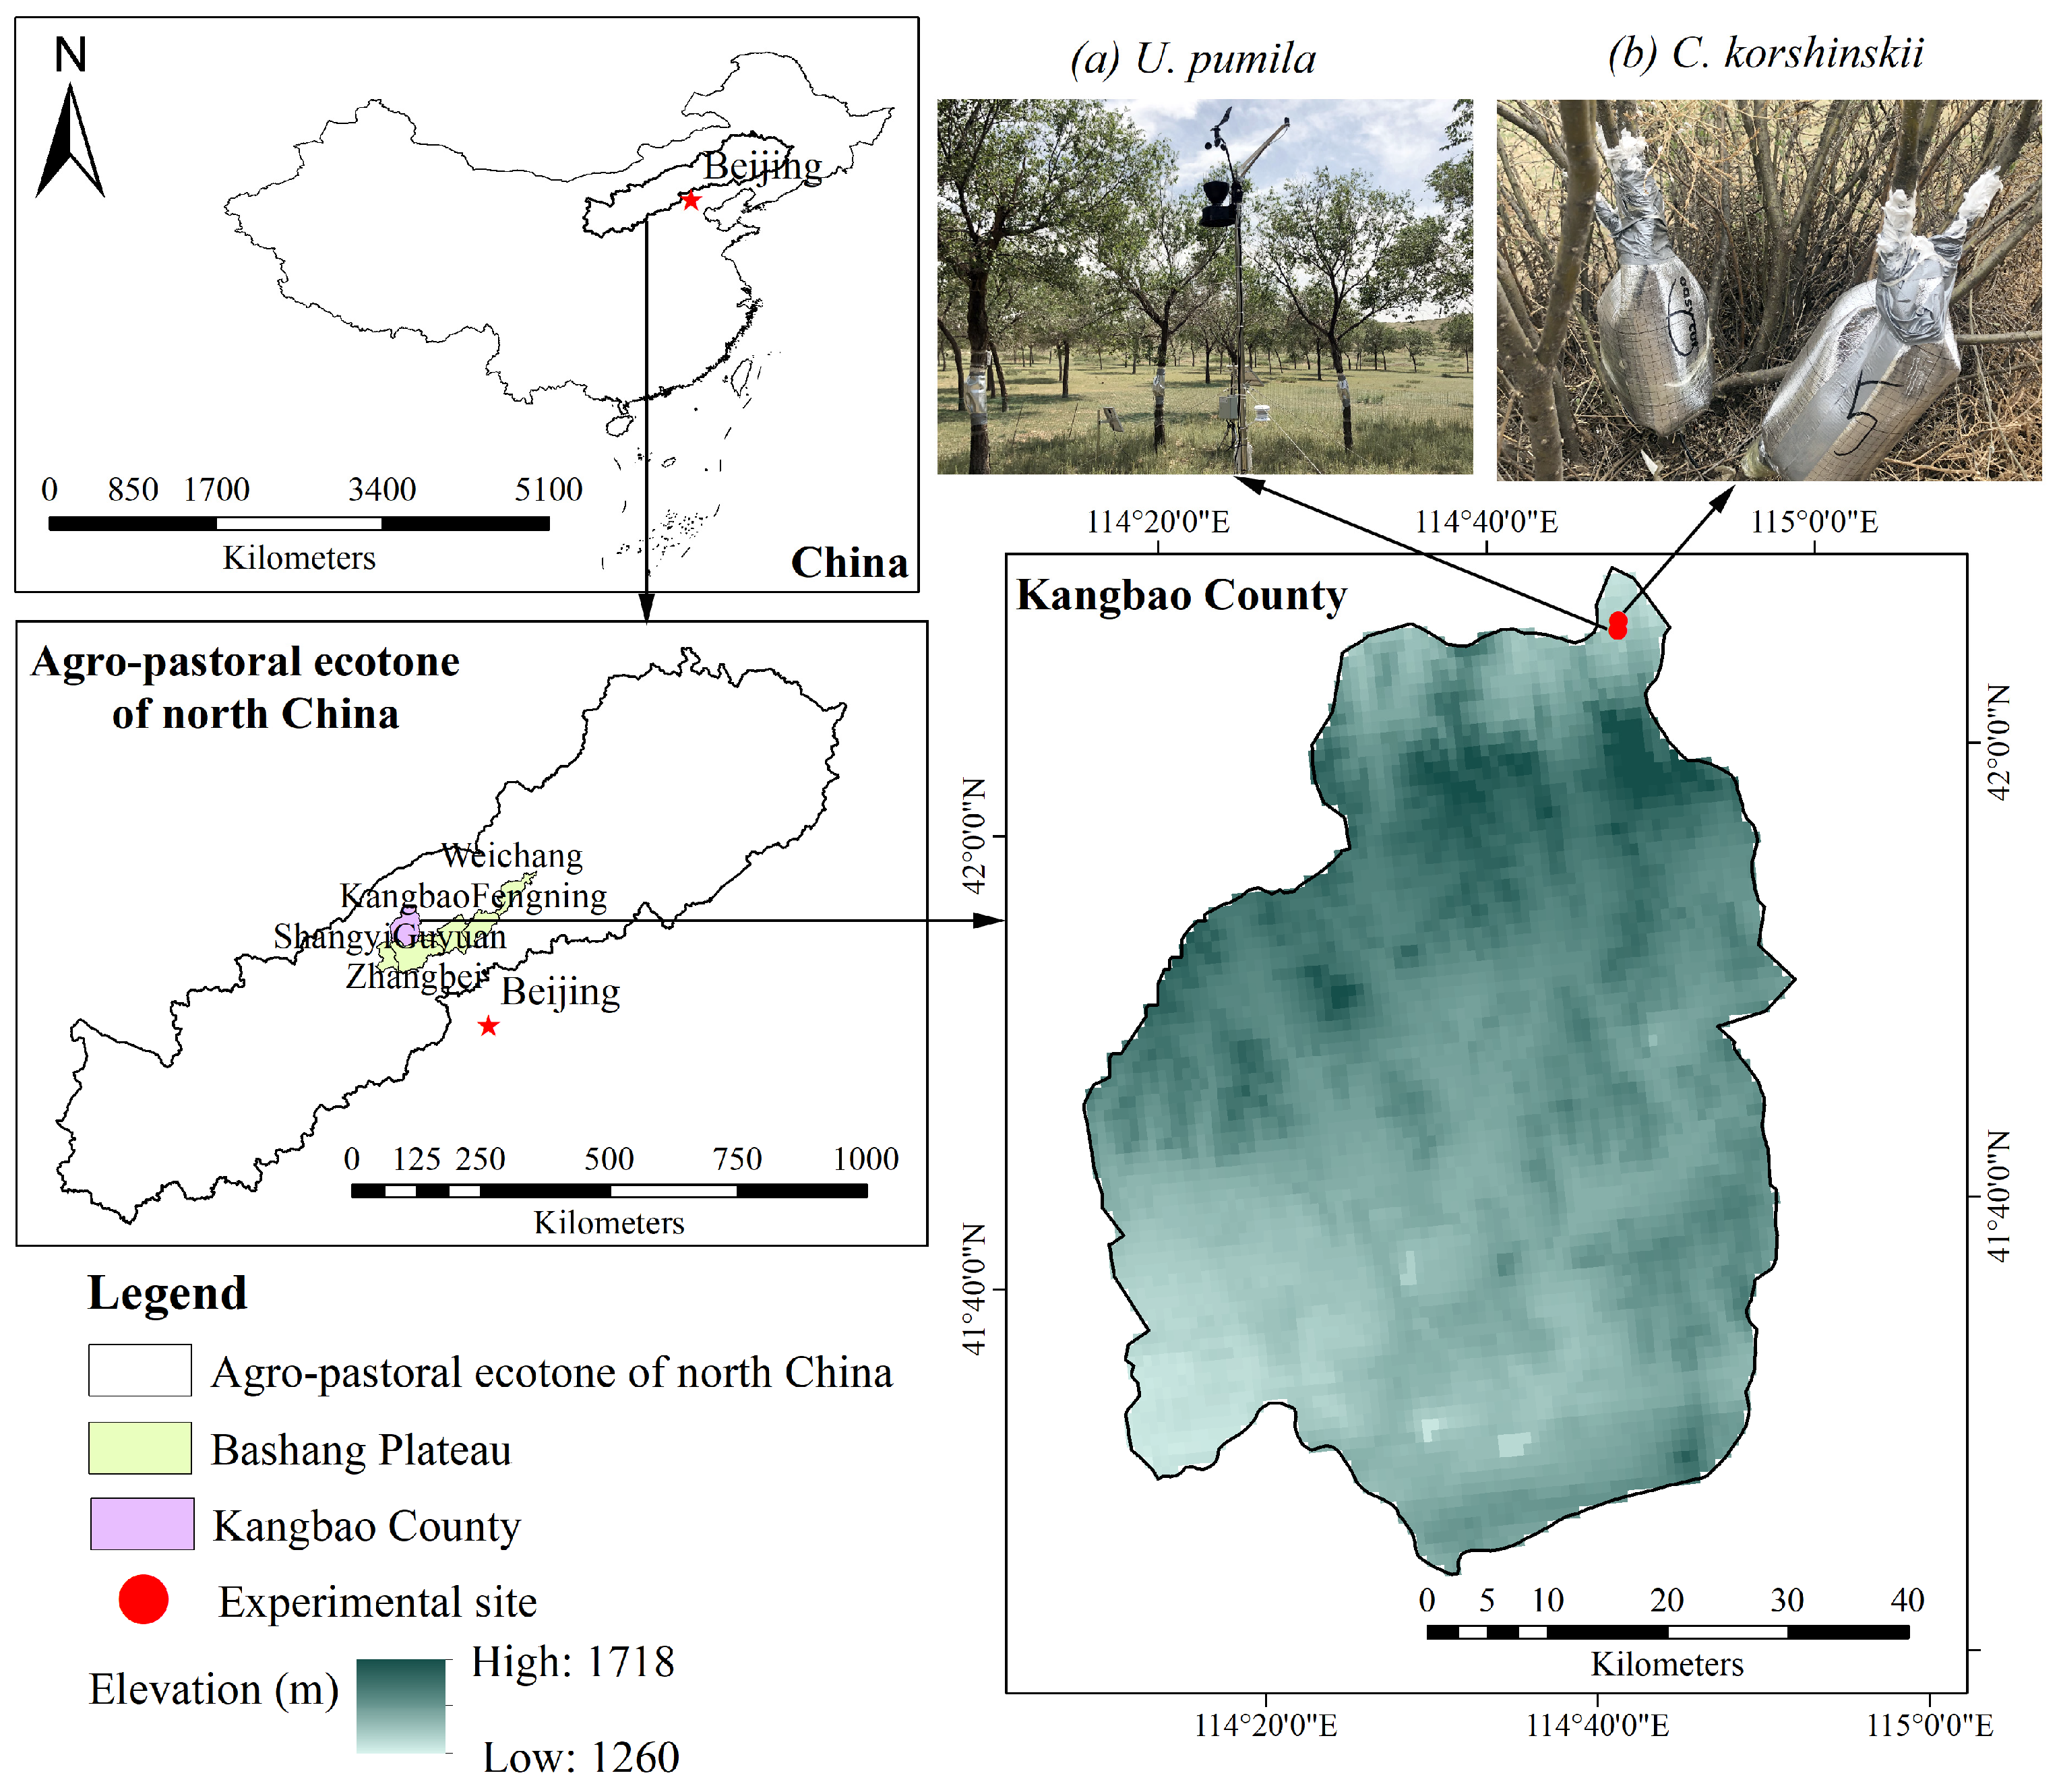
2.1. Site Description

Our study was conducted in the Kangbao pasture region, Kangbao County, Zhangjiakou City, Hebei Province, China (Figure 1). This area is located in the temperate climate zone. The average annual air temperature is about 2.3 °C, and the average annual precipitation is 330 mm, with over 85% falling between May and September. The mean annual potential evapotranspiration is 880 mm and the mean wind speed is 3.15 m s−1. The major soil type is chestnut soil. The main growing season runs from May to September. The dominant tree species here are U. pumila, P. simonii, and Pinus sylvestris var. mongolica Litv, and the dominant shrub species are C. korshinskii, Hippophae rhamnoides Linn, and Armeniaca sibirica (L.) Lam.
This experiment was conducted in stands of U. pumila (114°47′ E, 42°06′ N, altitude 1325 m) and C. korshinskii (114°48′ E, 42°07′ N, altitude 1305 m) in 2020 and 2021. The two sites were approximately 3.0 km apart. A plot having an area of 20 by 20 m was set up in each of the U. pumila and C. korshinskii stands. The U. pumila were about 38 years old and the C. korshinskii were about 20 years old. The corresponding maximum leaf area indexes (LAI) were 0.31 and 0.43 m2 m−2, respectively. The mean diameter at breast height (DBH, 1.3 m) of U. pumila was 16.60 cm and the mean stem basal diameter (SBD, 10–15 cm above the ground) of C. korshinskii was 2.38 cm. The physical characteristics of the soil differed between the U. pumila and C. korshinskii stands. The soil particle size distribution was 39.64% sand (0.05–2 mm), 50.85% silt (0.002–0.05 mm), and 9.69% clay (<0.002 mm) in the U. pumila stand, and 52.89% sand, 39.25% silt, and 7.86% clay in the C. korshinskii stand. The soil organic matter (SOM) in the U. pumila stand at the 0–100 cm depth was 1.34%, and that of the C. korshinskii stand was 0.85% (Table 1).

2.2. Measurement of Sap Flux Density and Estimation of Canopy Transpiration

Measurements of sap flow were carried out using Granier-type thermal dissipation probes (TDPs) between 1 May and 30 September in 2020 and 2021 [30]. The sensors consisted of a pair of probes having a 20 mm length and 2 mm diameter, each of which had a cooper constant thermocouple. Based on the distributions of DBH and SBD, six sampled trees in the U. pumila stand and six sampled stems in the C. korshinskii stand were selected for sap flux measurements. The probes were inserted into the north-facing side of the truck (stem) at a height of 1.3 m (sampled U. pumila) and 15 cm (sampled C. korshinskii) above ground level to minimize exposure to the sun. In order to protect the probes against physical damage, solar radiation, temperature fluctuations, and rain, they were mounted in waterproof silicone and covered with an aluminum cover. The temperature differences between heated and reference probes were recorded on a data logger at 10 min intervals (CR1000, Campbell Scientific Inc., Logan, UT, USA). The sap flux density (Fd) was estimated using the standard calibration for the TDP method:
F d = 0.714 × ( Δ T m a x Δ T Δ T ) 1.231
where Fd (mL cm−2 min−1) is the sap flux density, ΔT (°C) is the temperature difference between the two probes at any given time, and ΔTmax (°C) is the maximum temperature difference between sensors when the sap flux density is close to zero. Due to the fact that we only used one pair of probes per sample tree, azimuthal and radial variations in sap flux within trees were ignored In calculating canopy transpiration per area of ground (Ec, mm h−1); we multiplied the mean Fd for each sample tree (Fd-avg) by the total sapwood area of the study plot per unit area of ground:
E c = F d a v g × A s i A g × 600
where Fd-avg is the average sap flux density of sampled trees (or shrubs), Ag is the ground surface area of the studied plots (400 m2), and Asi is the total sapwood area in the studied plot. In order to measure the sapwood area of U. pumila, the staining method was applied to 19 trees both inside and outside the plot. Exponential growth function relationships between sapwood and DBH ( A s = 27.10 × e 0.09 D B H , n = 19 , R 2 = 0.83 ) were established. Furthermore, we used the stem basal cross-sectional area as the scalar to estimate the Ec and stand transpiration for the C. korshinskii stand. The total sapwood area in the plot was 6016.04 cm2 and 6877.70 cm2 for the U. pumila and C. korshinskii stands, respectively.

2.3. Meteorological Data and Soil Water Measurement

Precipitation (P, mm), air temperature (Ta, °C), relative humidity (RH, %), wind speed (u2, m s−1), and photosynthetically active radiation (PAR, μmol m−2 s−1) were measured continuously with an Onset HOBO U21 automatic weather station (Onset Computer Corp., Bourne, MA, USA) located in the open areas neighboring the U. pumila plantation stand. Air temperature and relative humidity were measured at a height of 1.5 m, and precipitation, wind speed, and photosynthetically active radiation were measured at a height of 2.0 m (Figure 1). These variables were recorded every 10 min as averages using data loggers of the CR1000 series (Campbell Scientific, Logan, UT, USA). VPD (kPa) was derived from air temperature and the relative humidity:
V P D = 0.611 × exp ( 17.502 T a T a + 240.97 ) × ( 1 R H )
The soil volumetric water content (θ, %) was continuously monitored at a single location in U. pumila and C. korshinskii stands with an EC–5TE sensor (Decagon, Inc. Decagon, USA). Both EC–5TE sensors were installed at depths of 0–10 cm, 10–20 cm, 20–40 cm, 40–60 cm, and 60–100 cm below the ground surface. Measurements were taken every 10 s, and the 30 min averages were recorded by CR1000 data loggers (Campbell Scientific, Logan, UT, USA). The soil water content values used in the paper were averaged for the depths of 0–100 cm for each plot. Relative extractable soil water (REW) was calculated using averaged θ across 0–100 cm:
R E W = θ θ m i n θ m a x θ m i n
where θmin and θmax are the minimum and maximum daily average soil water content, respectively, during May–September in 2020 and 2021.
To account for climate impacts on stand canopy transpiration, daily potential evapotranspiration (PET, mm d−1) was calculated by the Penman–Monteith equation based on FAO–56 [31]:
P E T = 0.408 Δ ( R n G ) + γ ( 900 ( T a + 273 ) ) u 2 V P D Δ + γ ( 1 + 0.34 u 2 )
where Rn is the net radiation (MJ m−2 d−1), G is the soil heat flux density (G ≈ 0 for daily scale), γ is the psychrometric constant (kPa °C−1), and Δ is the slope of the vapor pressure curve (kPa °C−1).

2.4. Canopy Conductance and Decoupling Coefficient

Gc (mm s−1) was calculated by multiplying the conductance coefficient (KG) by Ec and dividing the result by VPD [32]:
G c = K G × E c V P D
where KG is the conductance coefficient as a function of air temperature (115.8 + 0.4236 Ta, kPa m3 kg−1), which accounts for the temperature effect on the psychometric constant, the latent heat of vaporization, and the specific heat and density of air.
We estimated the decoupling coefficient (0 < Ω < 1) as a means of quantifying the degree of coupling between the canopy and atmosphere. Canopies are aerodynamically well coupled to the atmosphere when Ω approaches 0, and canopy transpiration is determined primarily by stomatal opening. As Ω approaches 1, stomatal control on canopy transpiration becomes weaker, and canopy transpiration is more influenced by solar radiation. The Ω was estimated as follow [33]:
Ω = 1 1 + [ γ ( Δ + γ ) ] ( g a G c )
where ga is the aerodynamic conductance (m s−1), calculated as follows:
g a = 1 + 0.54 U z [ ln ( z d ) z 0 ] 2
where Uz is the wind speed above the canopy (m s−1), which is derived from the measured wind speed at a 2.0 m height (u2). z is usually equal to the canopy height (m), z0 is the roughness height (usually 0.1 * H, where H is the canopy height) and d is the displacement height (0.75 * H).

2.5. Data Analysis

In the present study, significant differences in daily Ec, Gc, and Ω between the two growing seasons and the two planted forests were tested using two-way repeated measures ANOVA. The differences in the micrometeorological variables during the two growing seasons of 2020 and 2021 were testing using a paired samples t-test. Then, the relationships between PAR, VPD, and Ec were mainly analyzed using an exponential threshold function after partitioning the data into two classes (stressed water conditions: REW < 0.40 and non-stressed water conditions: REW > 0.40), as follows:
E c = a ( 1 e b x )
where a and b are the fitting parameters, and x is the corresponding meteorological variable.
The response of Gc to VPD was quantified using a linear logarithmic function [34]:
G c = m ln V P D + G r e f
where m is the canopy conductance’s sensitivity to VPD and Gref is the reference canopy conductance when VPD = 1 kPa. An upper boundary line was derived based on the data of Ec at least one standard deviation greater than the mean Ec of each VPD (0.5 kPa) interval, from which the parameters of m and Gref were determined.
All statistical analyses were performed using the SPSS 21 software program (SPSS Inc., Chicago, IL, USA) and all the figures were created using Sigmaplot 11.0 software (Hearne Scientific Software Plc, Melbourne, Australia).

3. Results

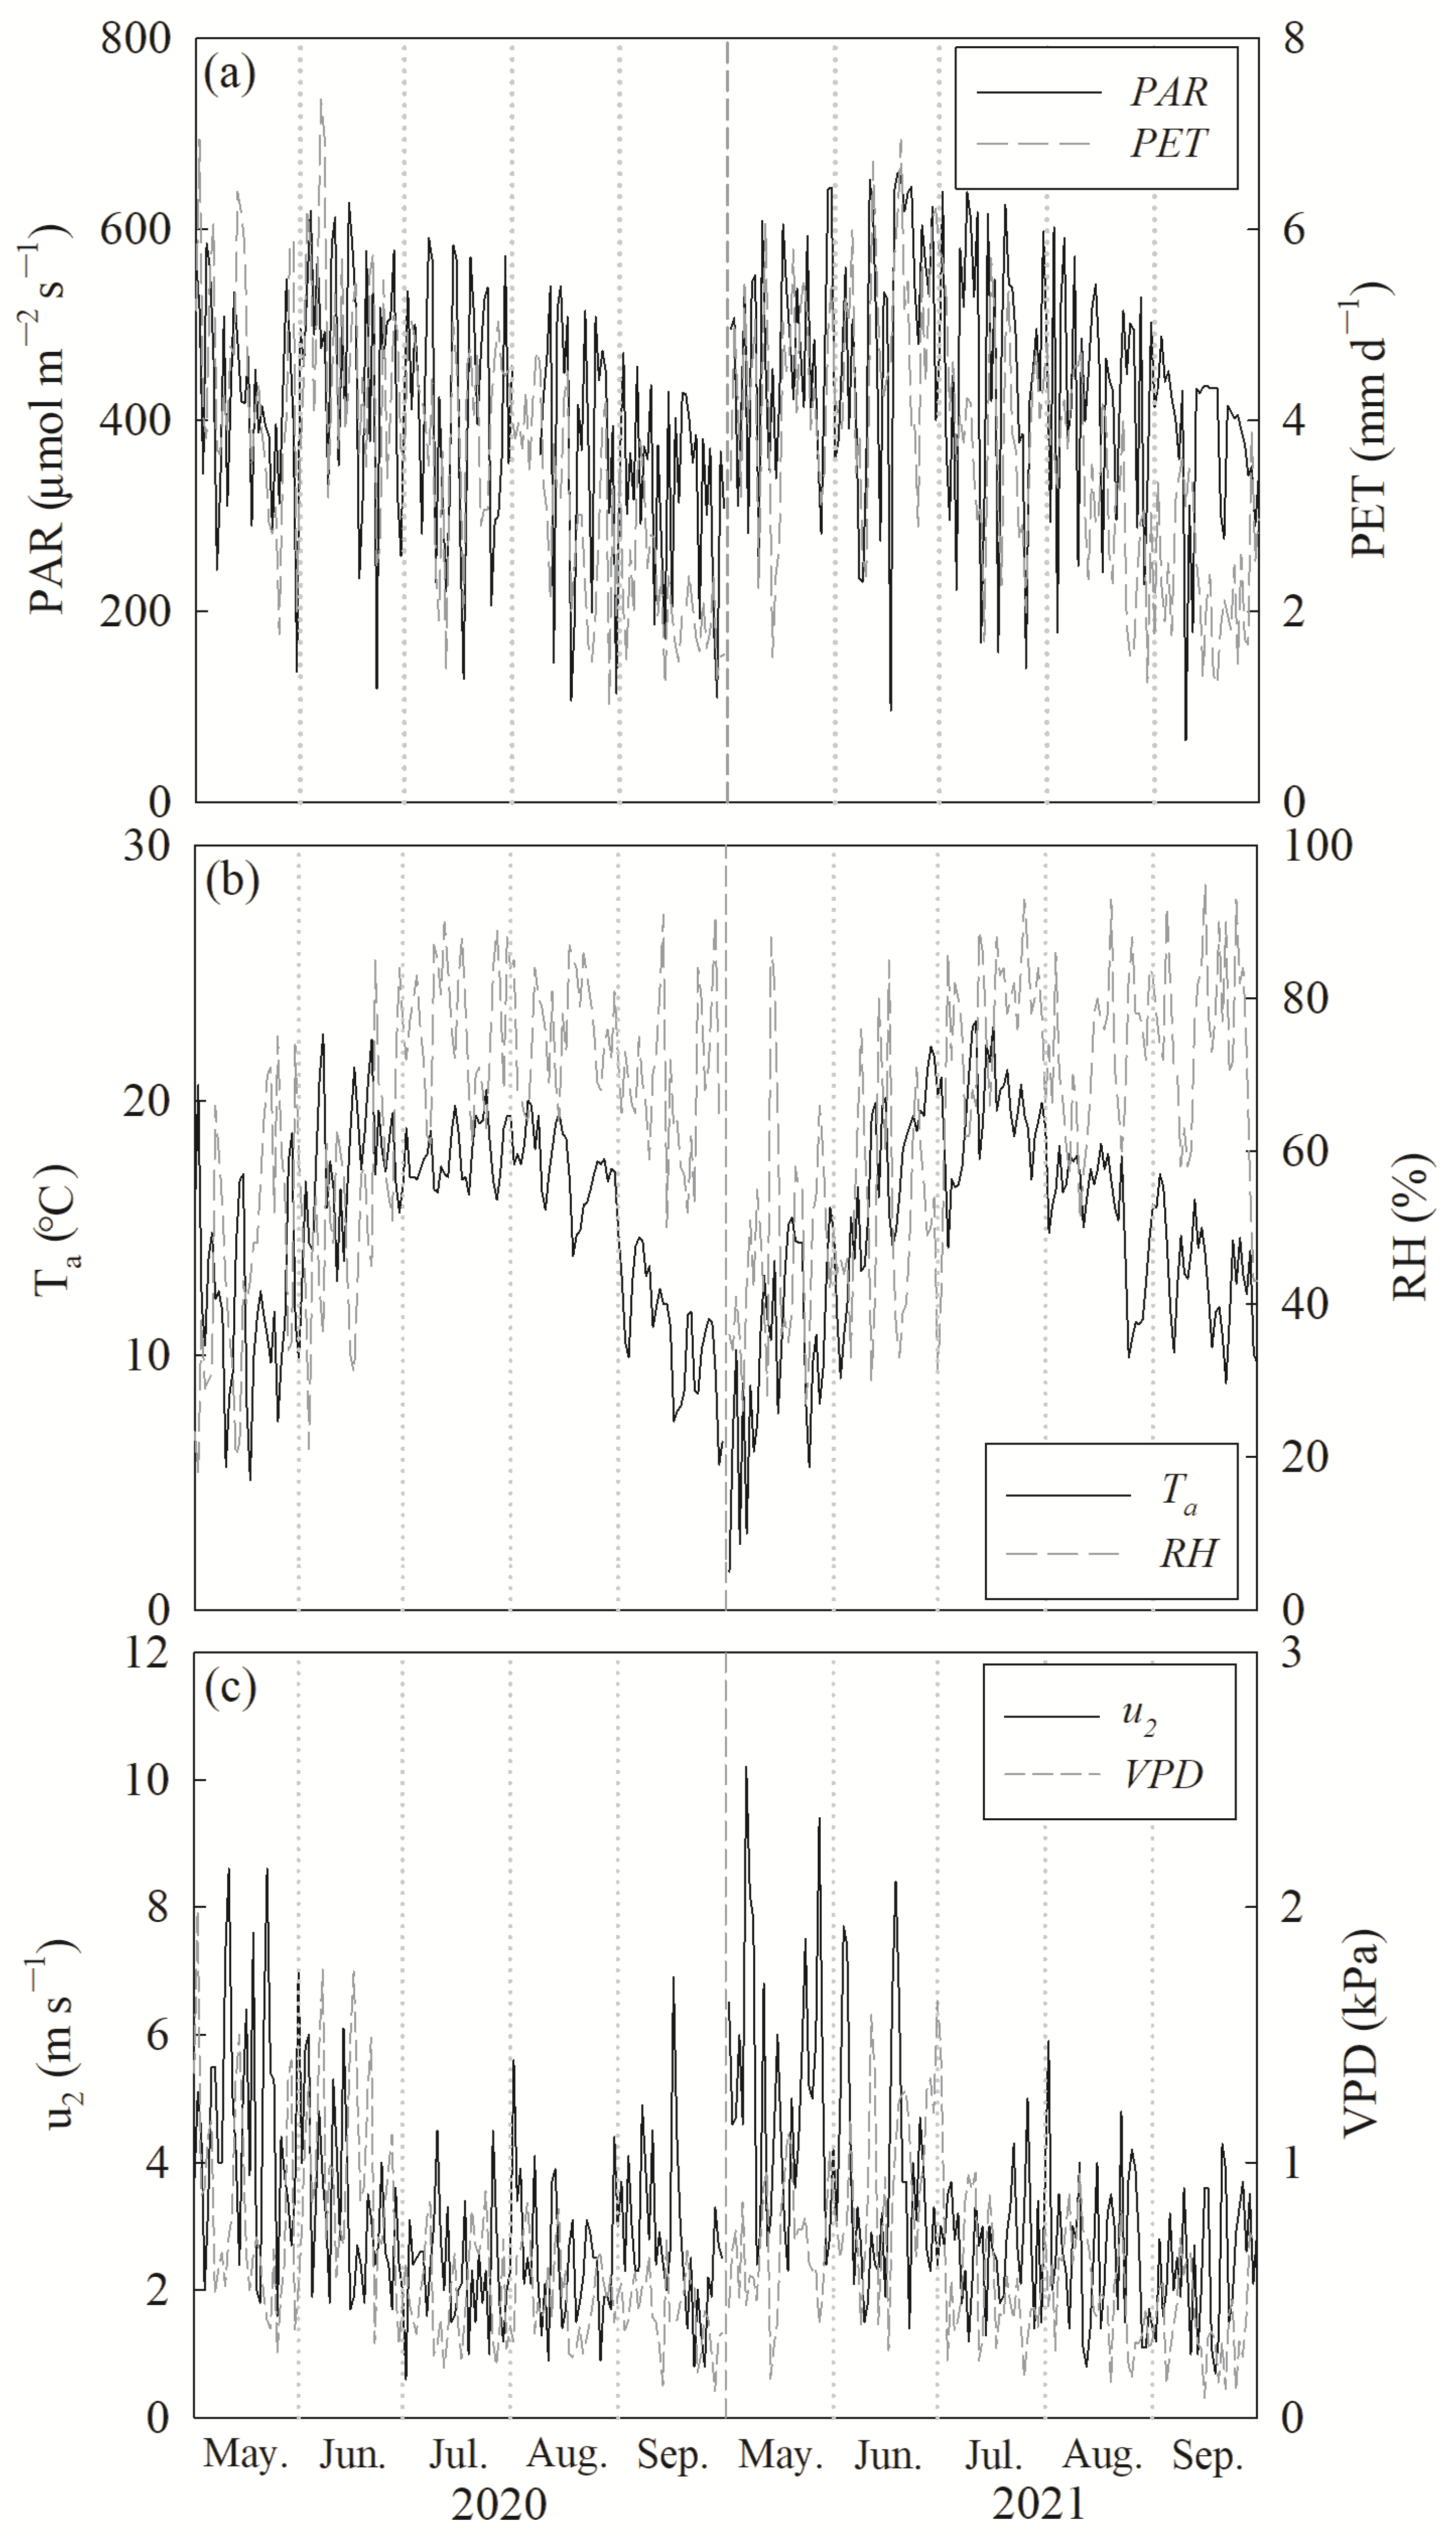
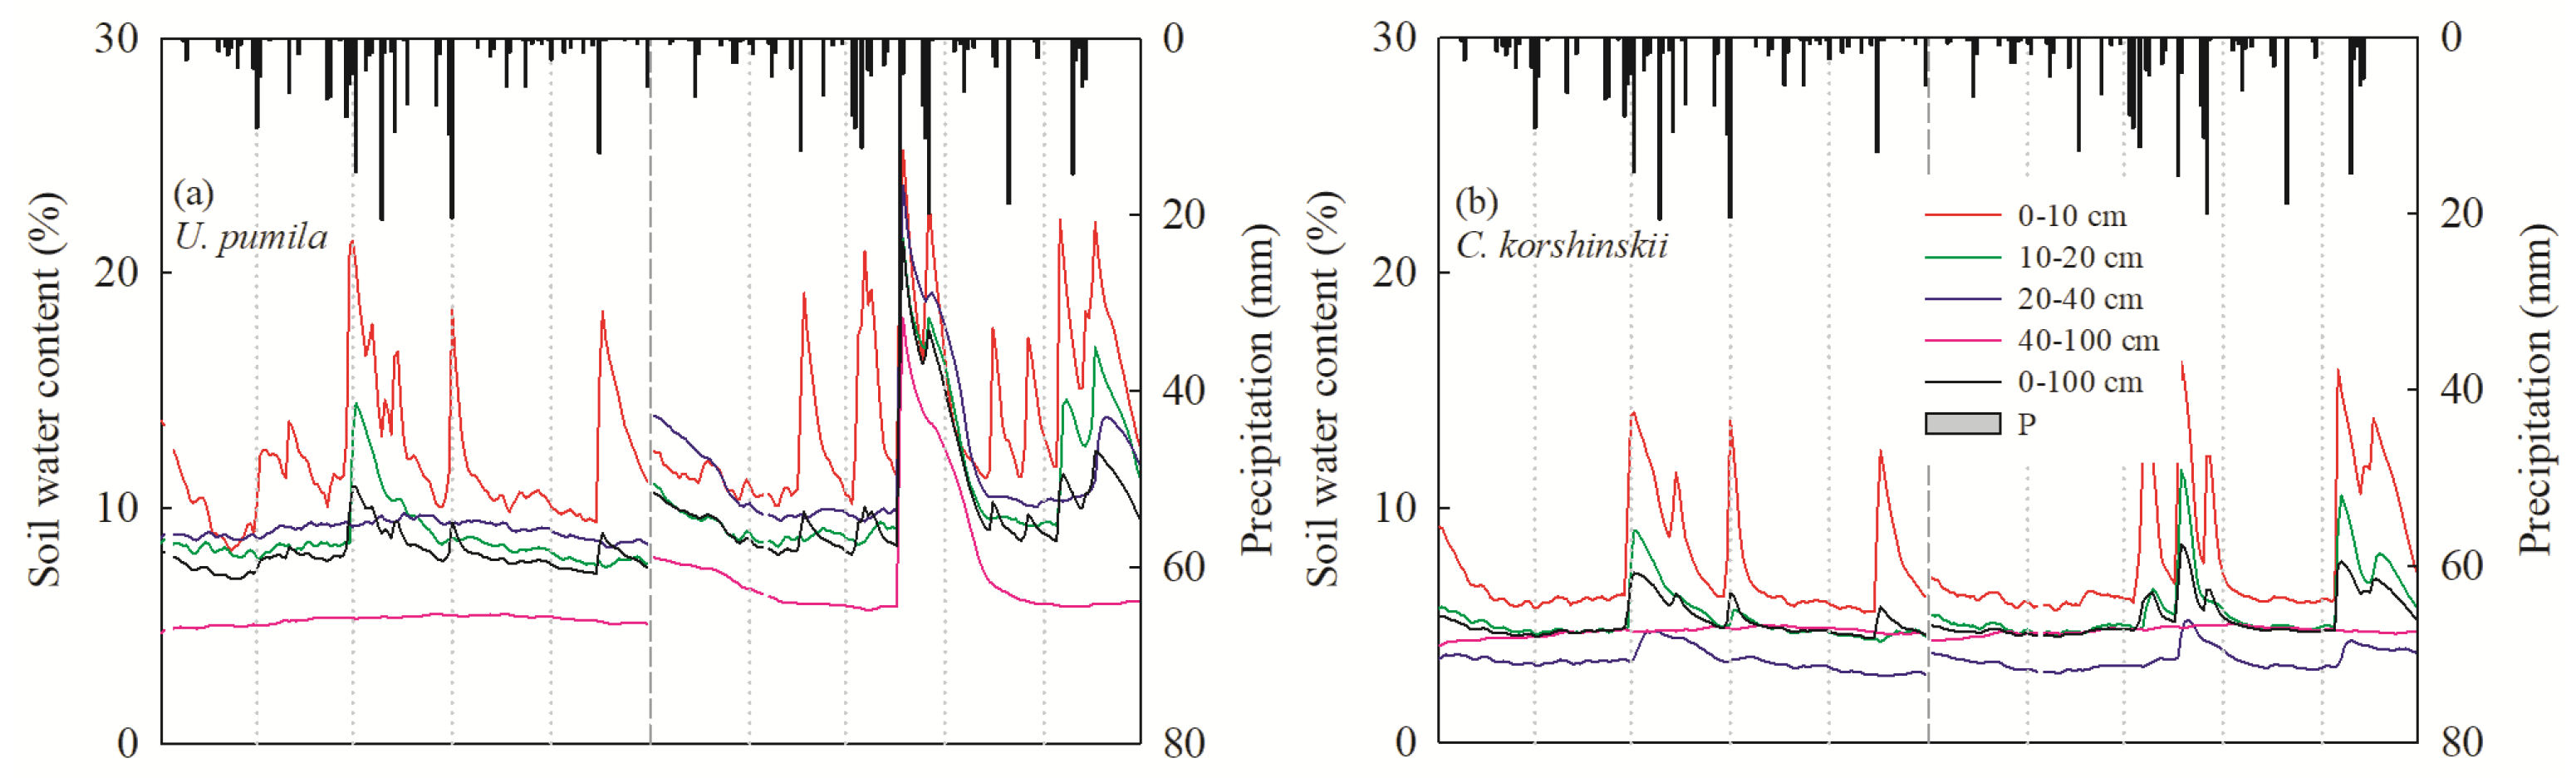
3.1. Environmental Variables

During the growing season (May–September), the total precipitation was 256 and 283 mm in 2020 and 2021, respectively (Figure 2), accounting for 88.90% and 98.31% of the long-term average precipitation (288 mm, 1980–2020). The photosynthetically active radiation was 402.47 ± 124.65 μmol m−2 s−1 and 442.56 ± 126.41 μmol m−2 s−1, whereas PET averaged 3.65 ± 1.36 mm d−1 and 3.72 ± 1.30 mm d−1 during the growing season in 2020 and 2021, respectively (Figure 2a). During both growing seasons, daily air temperatures displayed marked seasonal variations, with a range of 5.1 to 22.6 °C and 1.5 to 23.1 °C, and mean values of 15.14 ± 3.88 °C and 15.02 ± 4.28 °C, in 2020 and 2021, respectively (Figure 2b). The average VPD was 0.63 ± 0.35 kPa and 0.61 ± 0.32 kPa, whereas u2 was 3.11 ± 1.56 m s−1 and 3.31 ± 1.77 m s−1 in 2020 and 2021, respectively (Figure 2c). The mean soil water content at the 0–100 cm soil layer was 8.03% for U. pumila and 5.09% for C. korshinskii in 2020, and 10.42% for U. pumila and 5.33% for C. korshinskii in 2021. The soil water content in the 0–40 cm layer increased quickly after precipitation events, whereas that of the 40–100 cm layer was stable during the growing season. In the vertical profile, the soil water content in the 40–100 cm layer was lower than that in other profiles in U. pumila, whereas the lowest soil water content occurred at 20–40 cm in C. korshinskii (Figure 3).

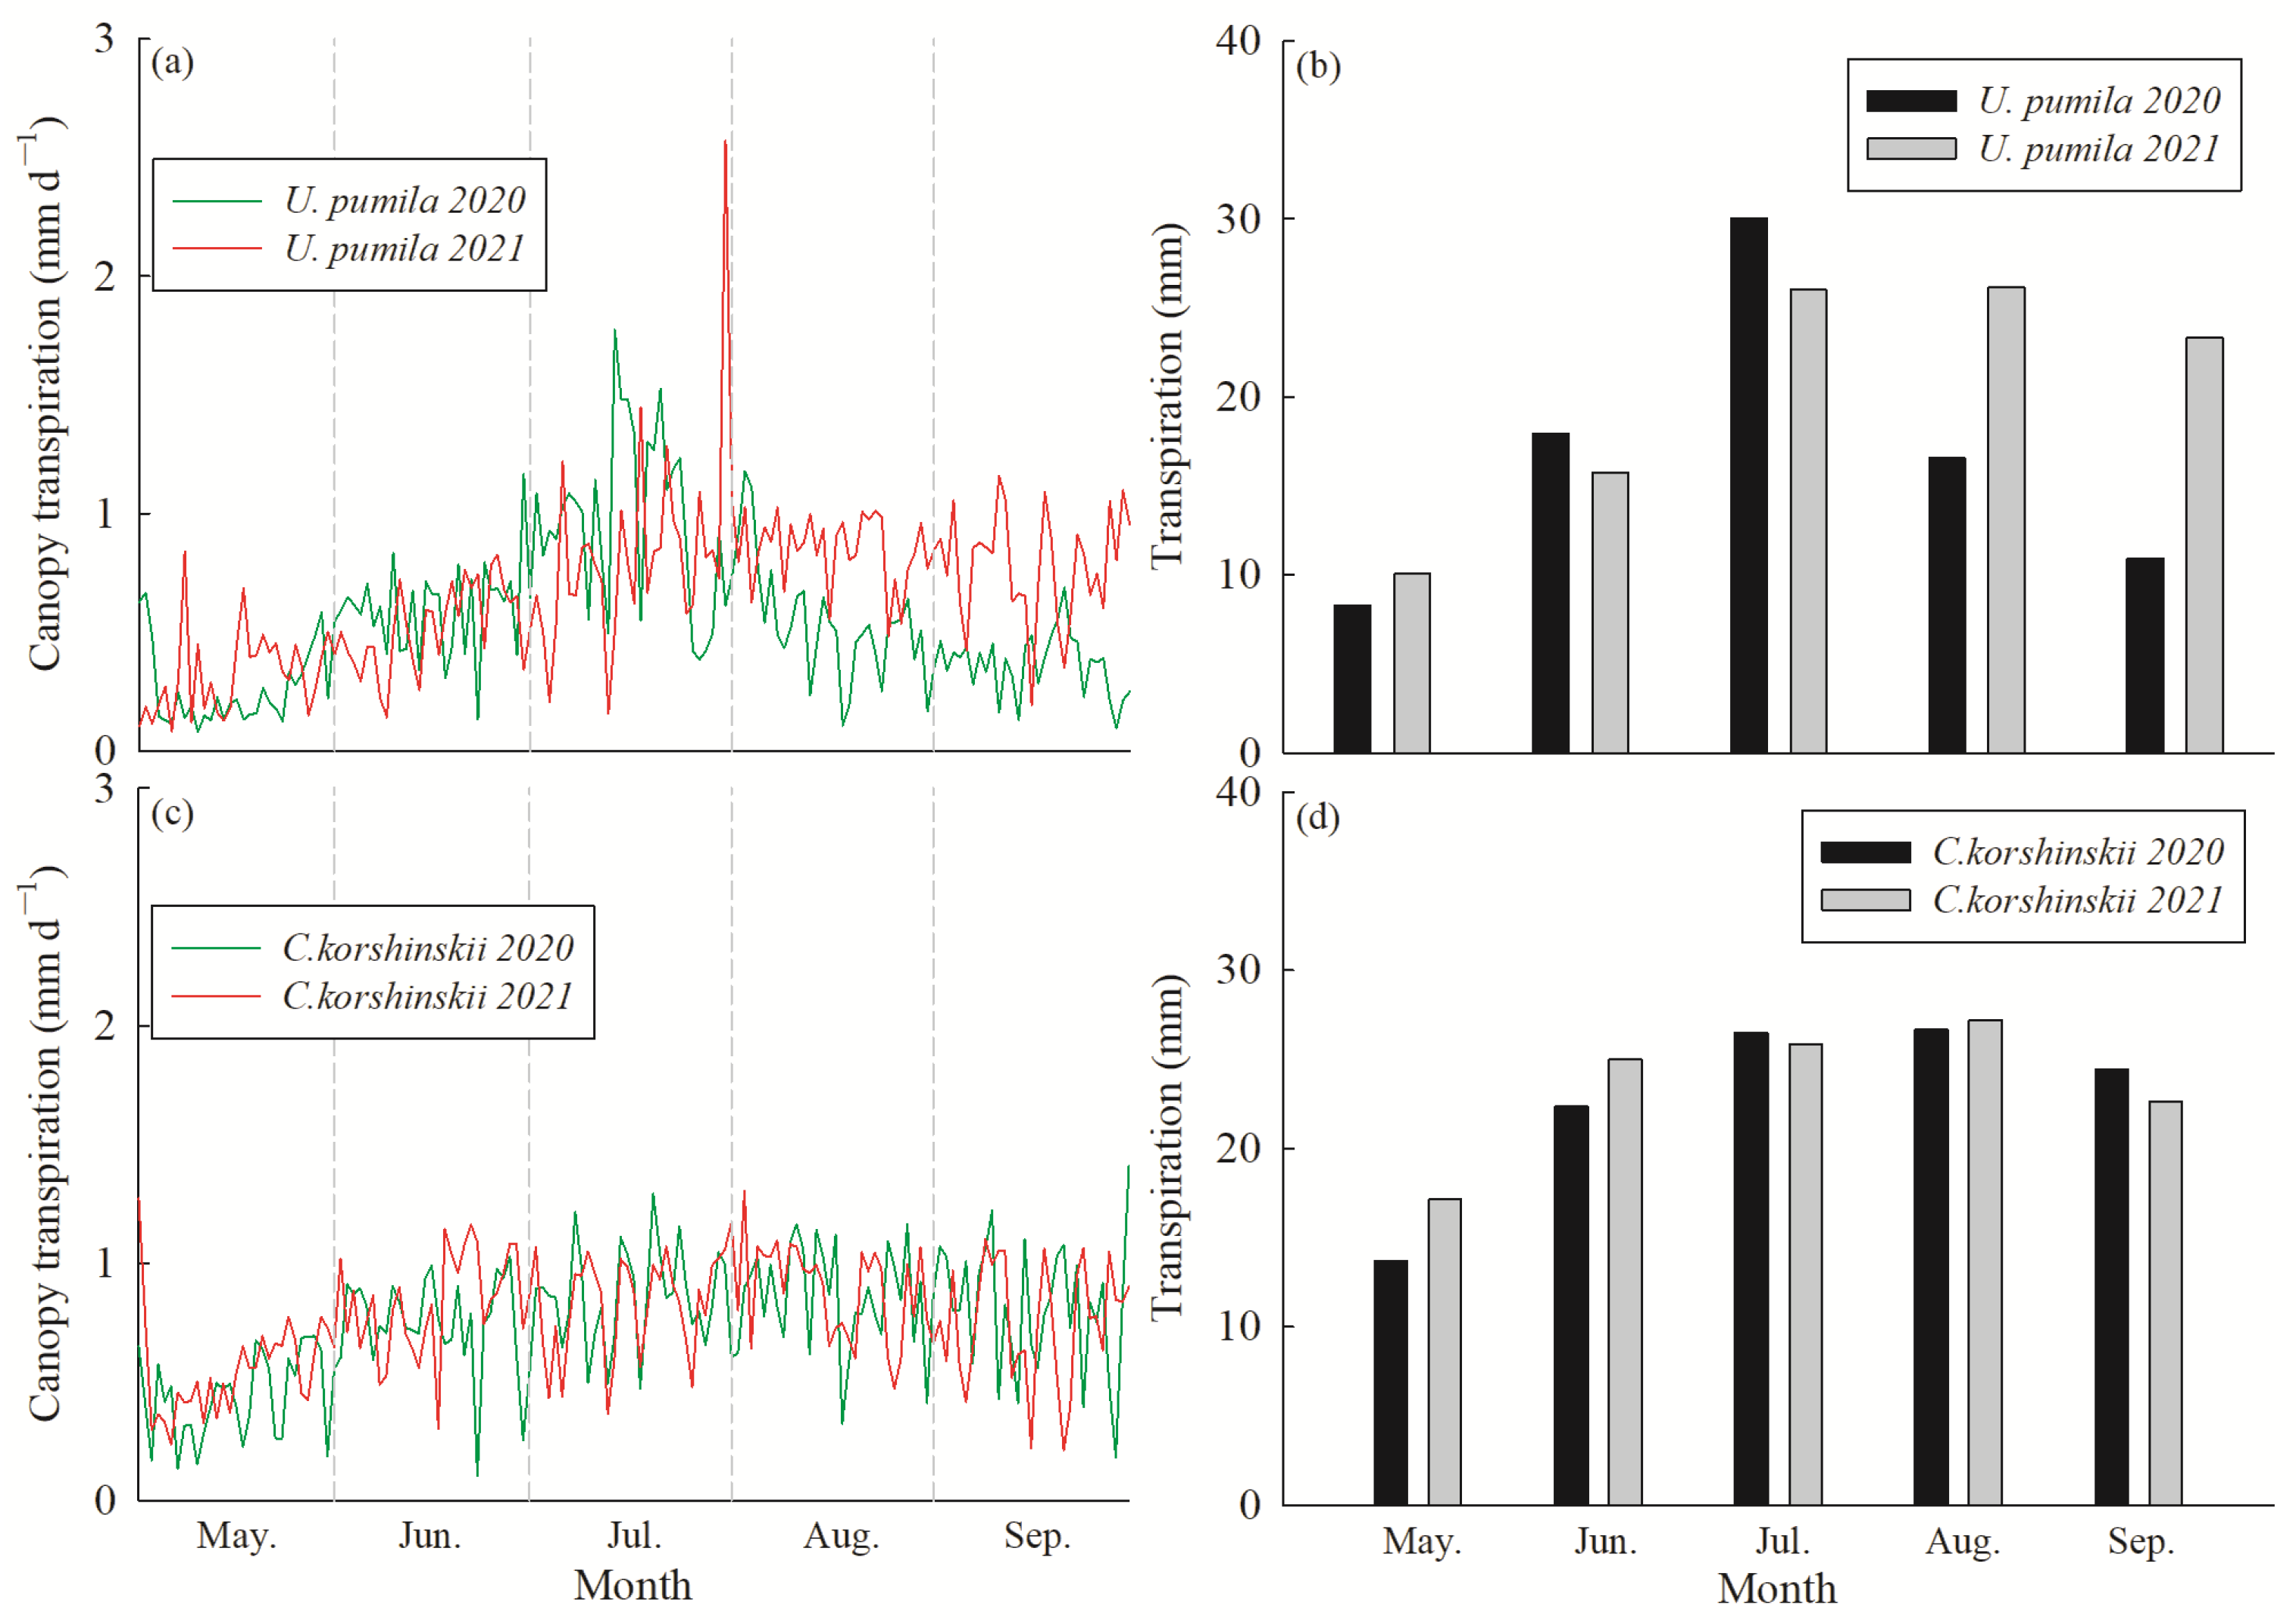
3.2. Canopy Transpiration per Unit Ground Area

During the measurement period, Ec for the U. pumila stand ranged from 0.08 to 1.77 mm d−1, with a mean value of 0.55 ± 0.34 mm d−1 in 2020; whereas, in 2021, Ec ranged from 0.08 to 2.57 mm d−1, with a mean value of 0.66 ± 0.32 mm d−1. For C. korshinskii, Ec ranged from 0.10 to 1.41 mm d−1 and from 0.21 to 1.30 mm d−1, with mean values of 0.74 ± 0.26 mm d−1 and 0.77 ± 0.24 mm d−1 in 2020 and 2021, respectively (Figure 4a,c). The accumulated Ec over the entire growing season was 83.72 and 113.65 mm for U. pumila in 2020 and 2021, respectively, accounting for 32.70% and 40.14% of the precipitation over the same period. The accumulated Ec was 101.29 and 117.77 mm for the C. korshinskii stand in 2020 and 2021, respectively, accounting for 39.57% and 41.60% of the precipitation over the same period (Figure 4b,d).

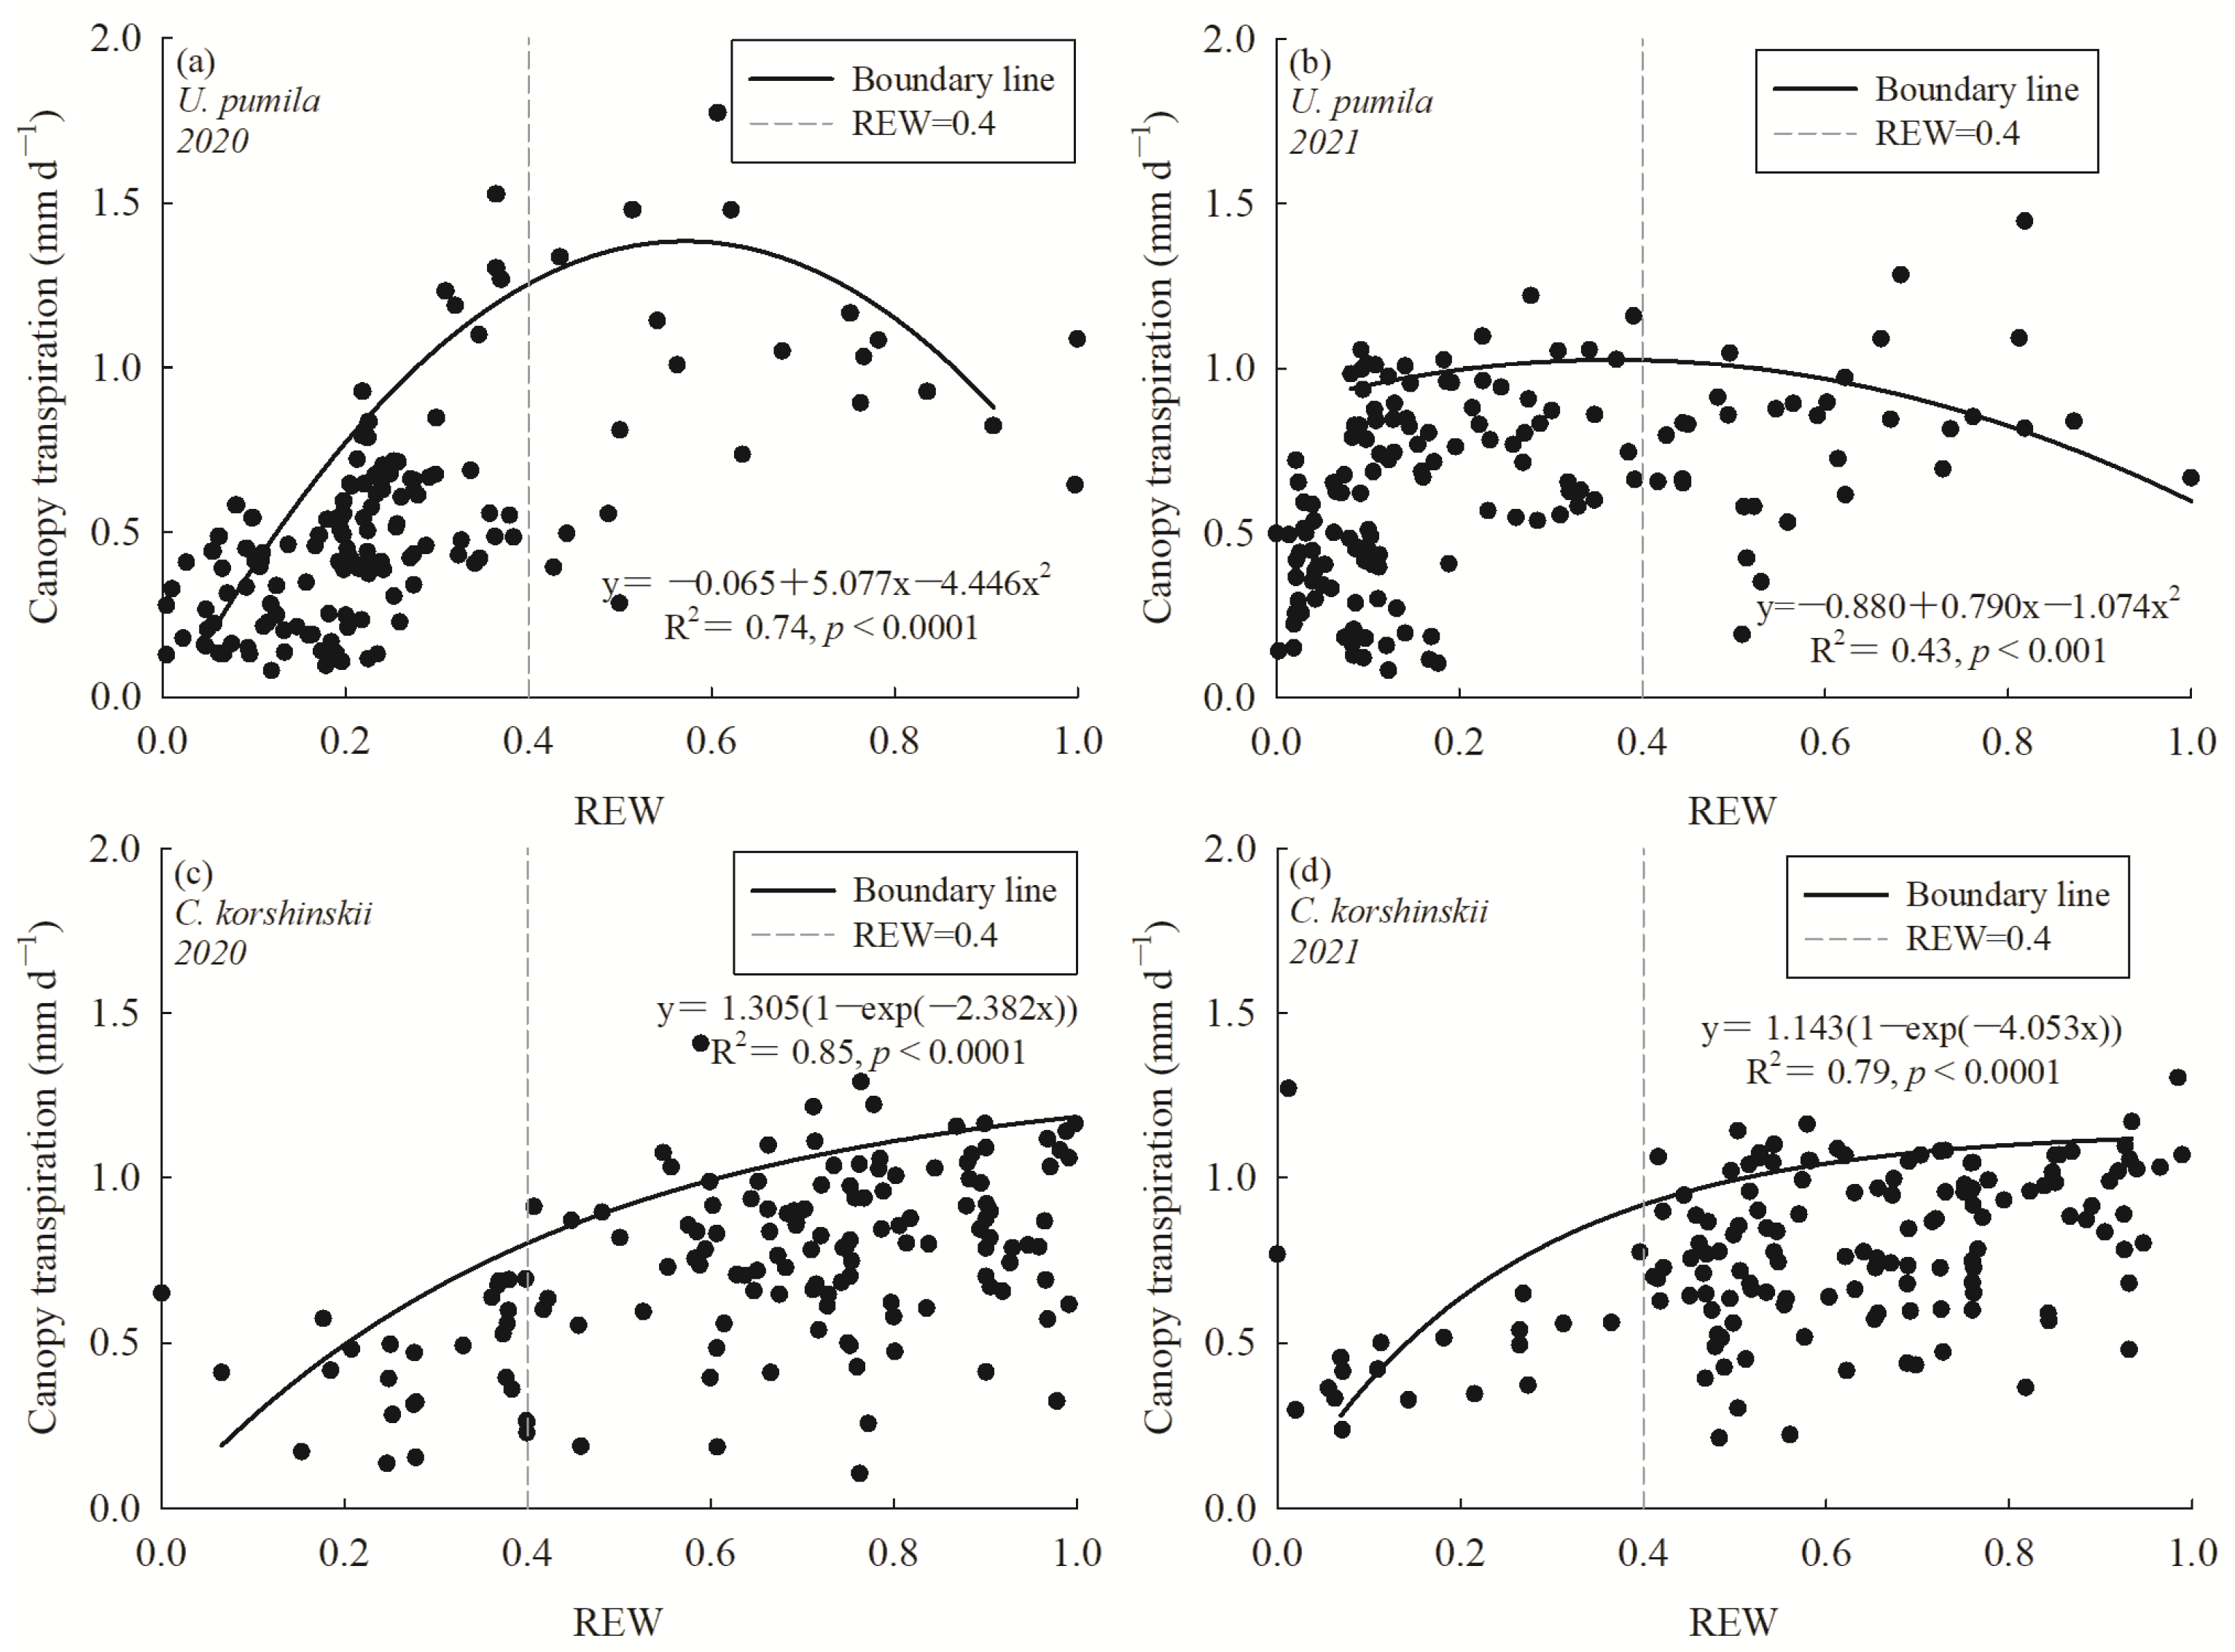
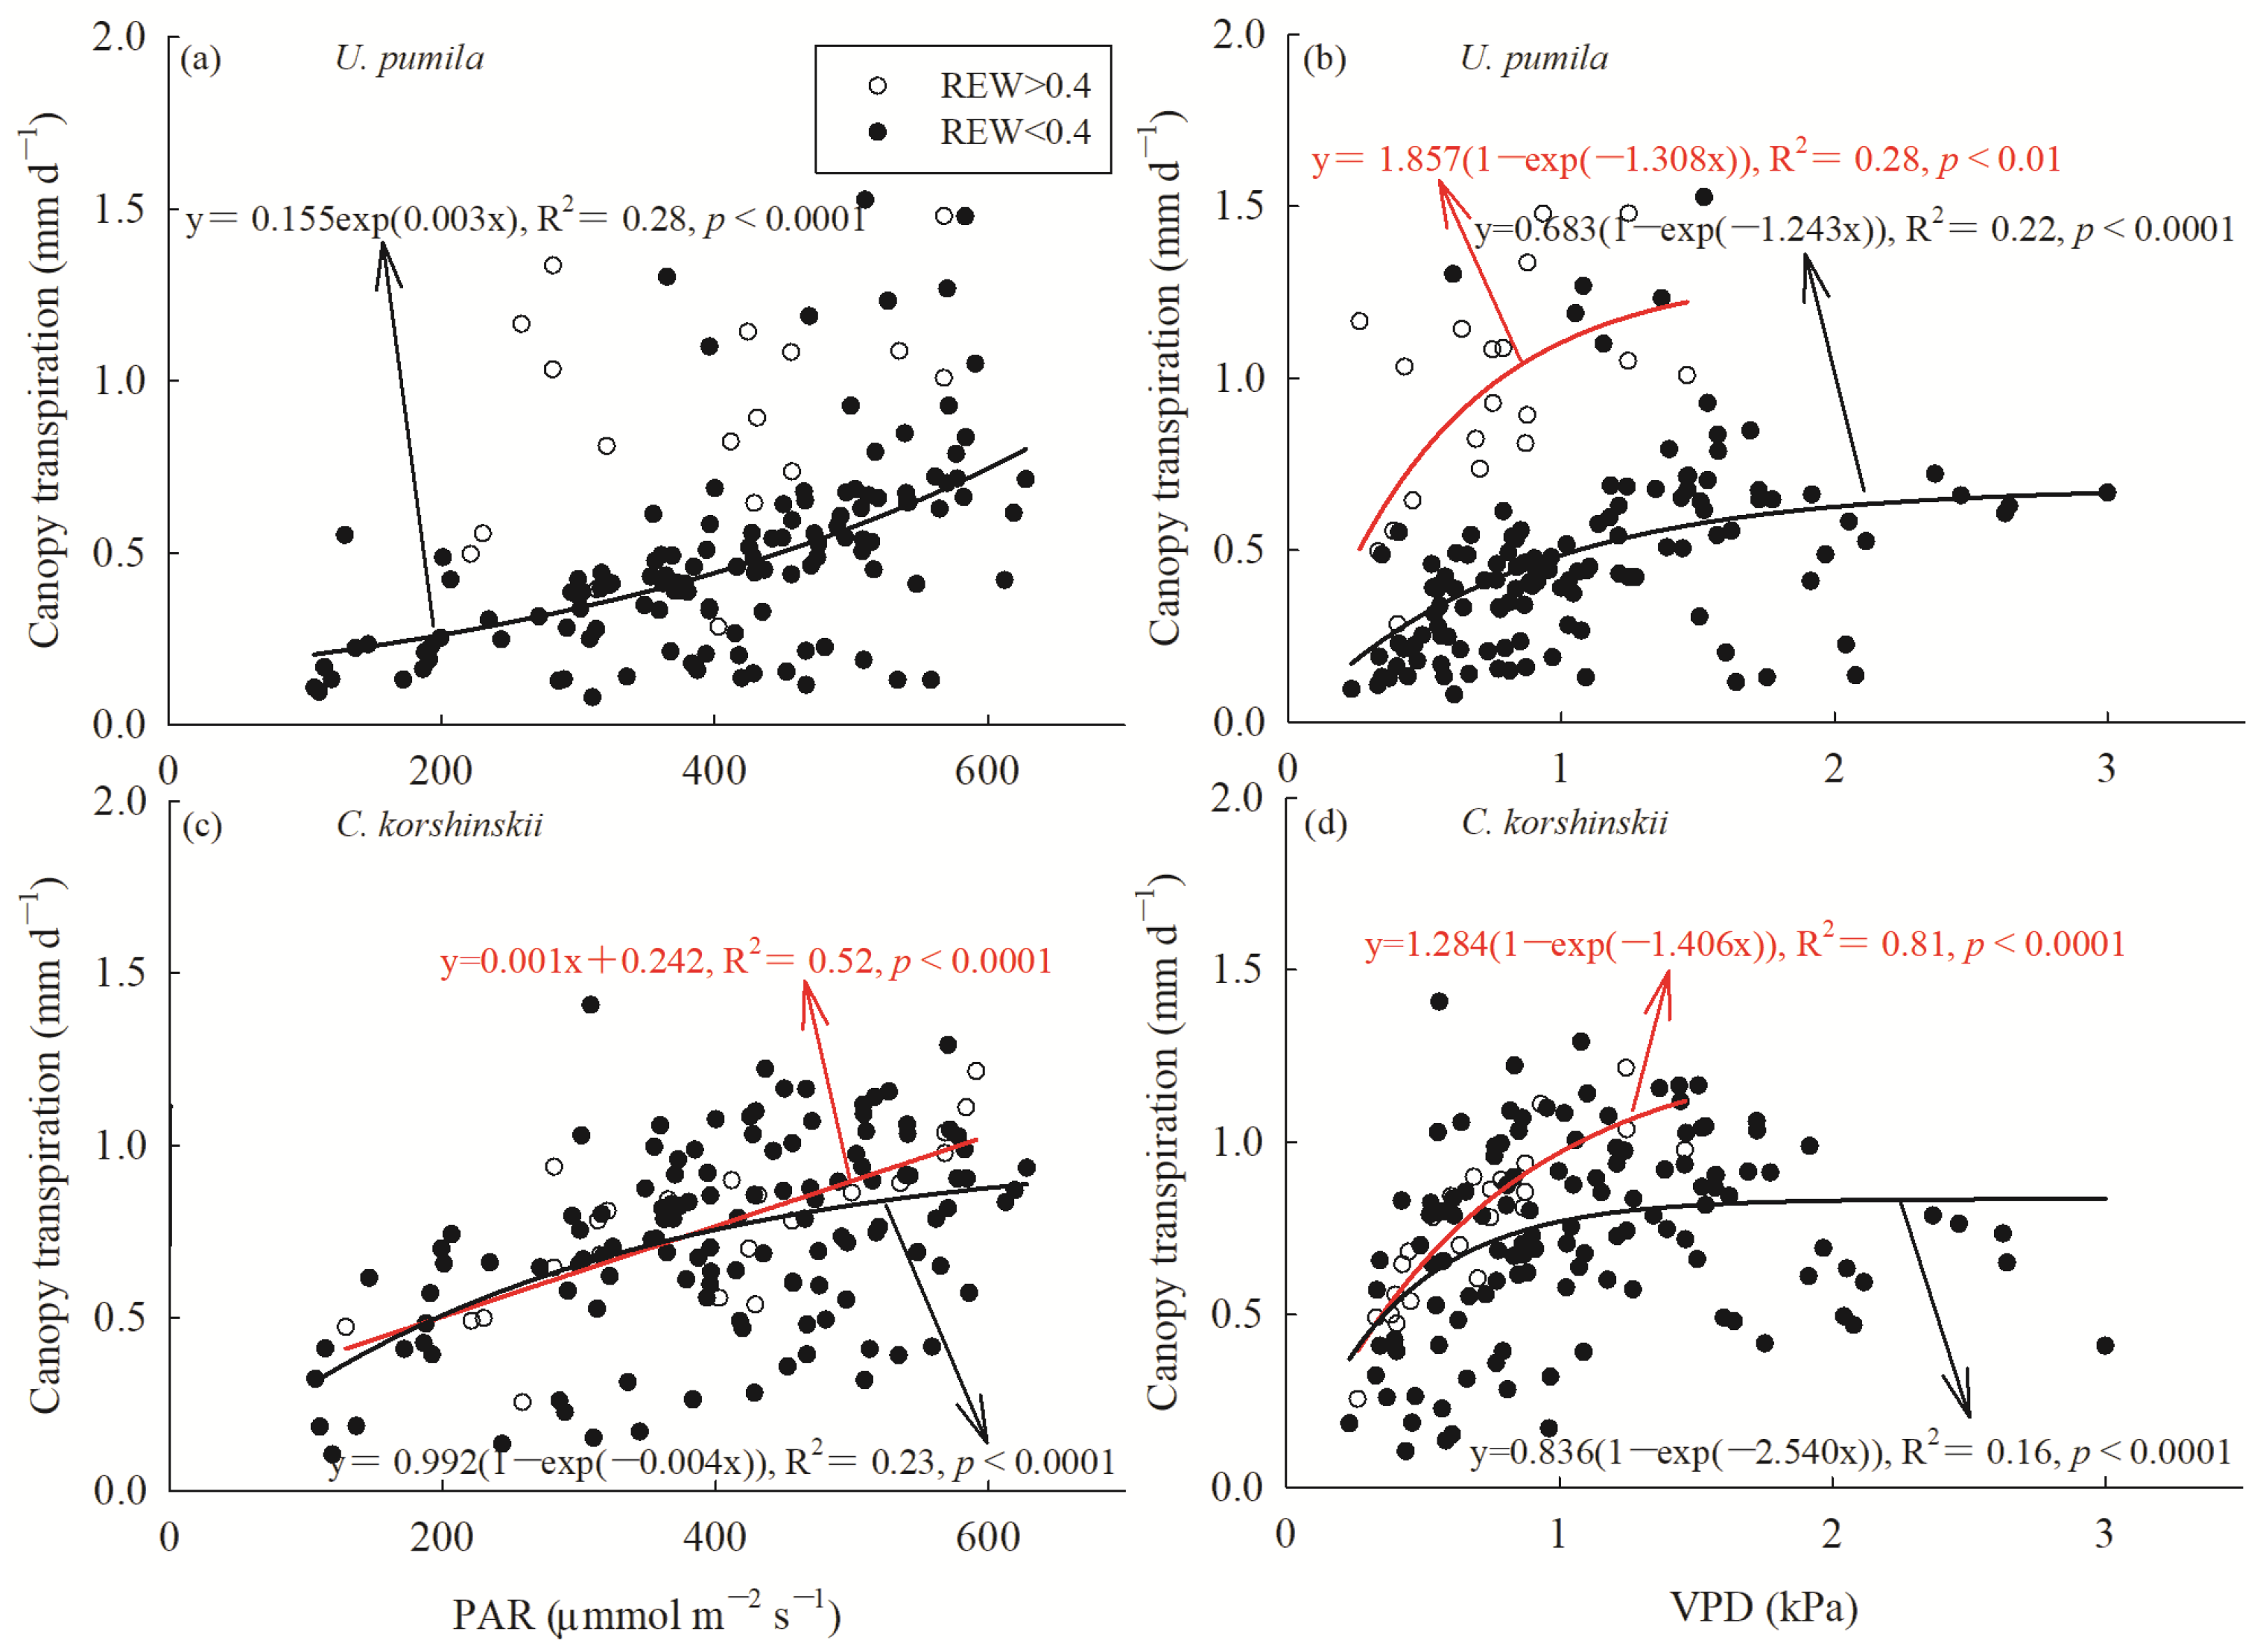
3.3. Response of Canopy Transpiration to Environmental Variables

Statistical analysis indicated that the positive effect of environmental variables on Ec had a ranking of θ > Ta > PAR > u2 > VPD > PET in 2020 and PAR > u2 > θ > Ta > P > PET in 2021 for U. pumila. The positive effect of environmental variables on Ec had a ranking of PAR > θ > u2 > Ta > VPD > P in 2020 and P > θ > Ta > VPD > PAR > u2 > PET in 2021 for C. korshinskii (Table 2). This suggests that PAR, θ, and VPD were major determinants of transpiration for both U. pumila and C. korshinskii.
The Ec responded to REW following a quadratic polynomial function for U. pumila both in 2020 and 2021 (Figure 5a,b). Ec reached the maximum values when REW = 0.4–0.5 in 2020 and REW = 0.4 in 2021. The Ec responded to REW following a saturated exponential function for C. korshinskii both in 2020 and 2021 (Figure 5c,d). Ec rapidly increased with rising REW when REW < 0.4, Ec then increased slowly when REW > 0.4, and, finally, Ec tended to be saturated at 1.31 and 1.14 mm when REW was close to 1 in 2020 and 2021, respectively. Additionally, the response of Ec to PAR and VPD was affected by different soil water conditions. The Ec increased with an increasing PAR and VPD for U. pumila under REW < 0.40, while it tended to be saturated when VPD reached 2.0 kPa (Figure 6a,b). PAR and VPD explained 28% and 22% of the variation in Ec for U. pumila under REW < 0.40, respectively, whereas Ec maintained a high value and stability when REW > 0.4. The Ec increased significantly with an increasing PAR and VPD for C. korshinskii under different soil water conditions (Figure 6c,d). The Ec exhibited an exponentially saturating response to VPD and tended to level off at 1.5 kPa under REW < 0.4, and there was no obvious threshold value of Ec under REW > 0.4. VPD explained 16% and 81% of the variation in Ec for C. korshinskii under REW < 0.40 and REW > 0.4, respectively, whereas PAR explained 23% and 52% of the variation in Ec for C. korshinskii under REW < 0.40 and REW > 0.4, respectively.

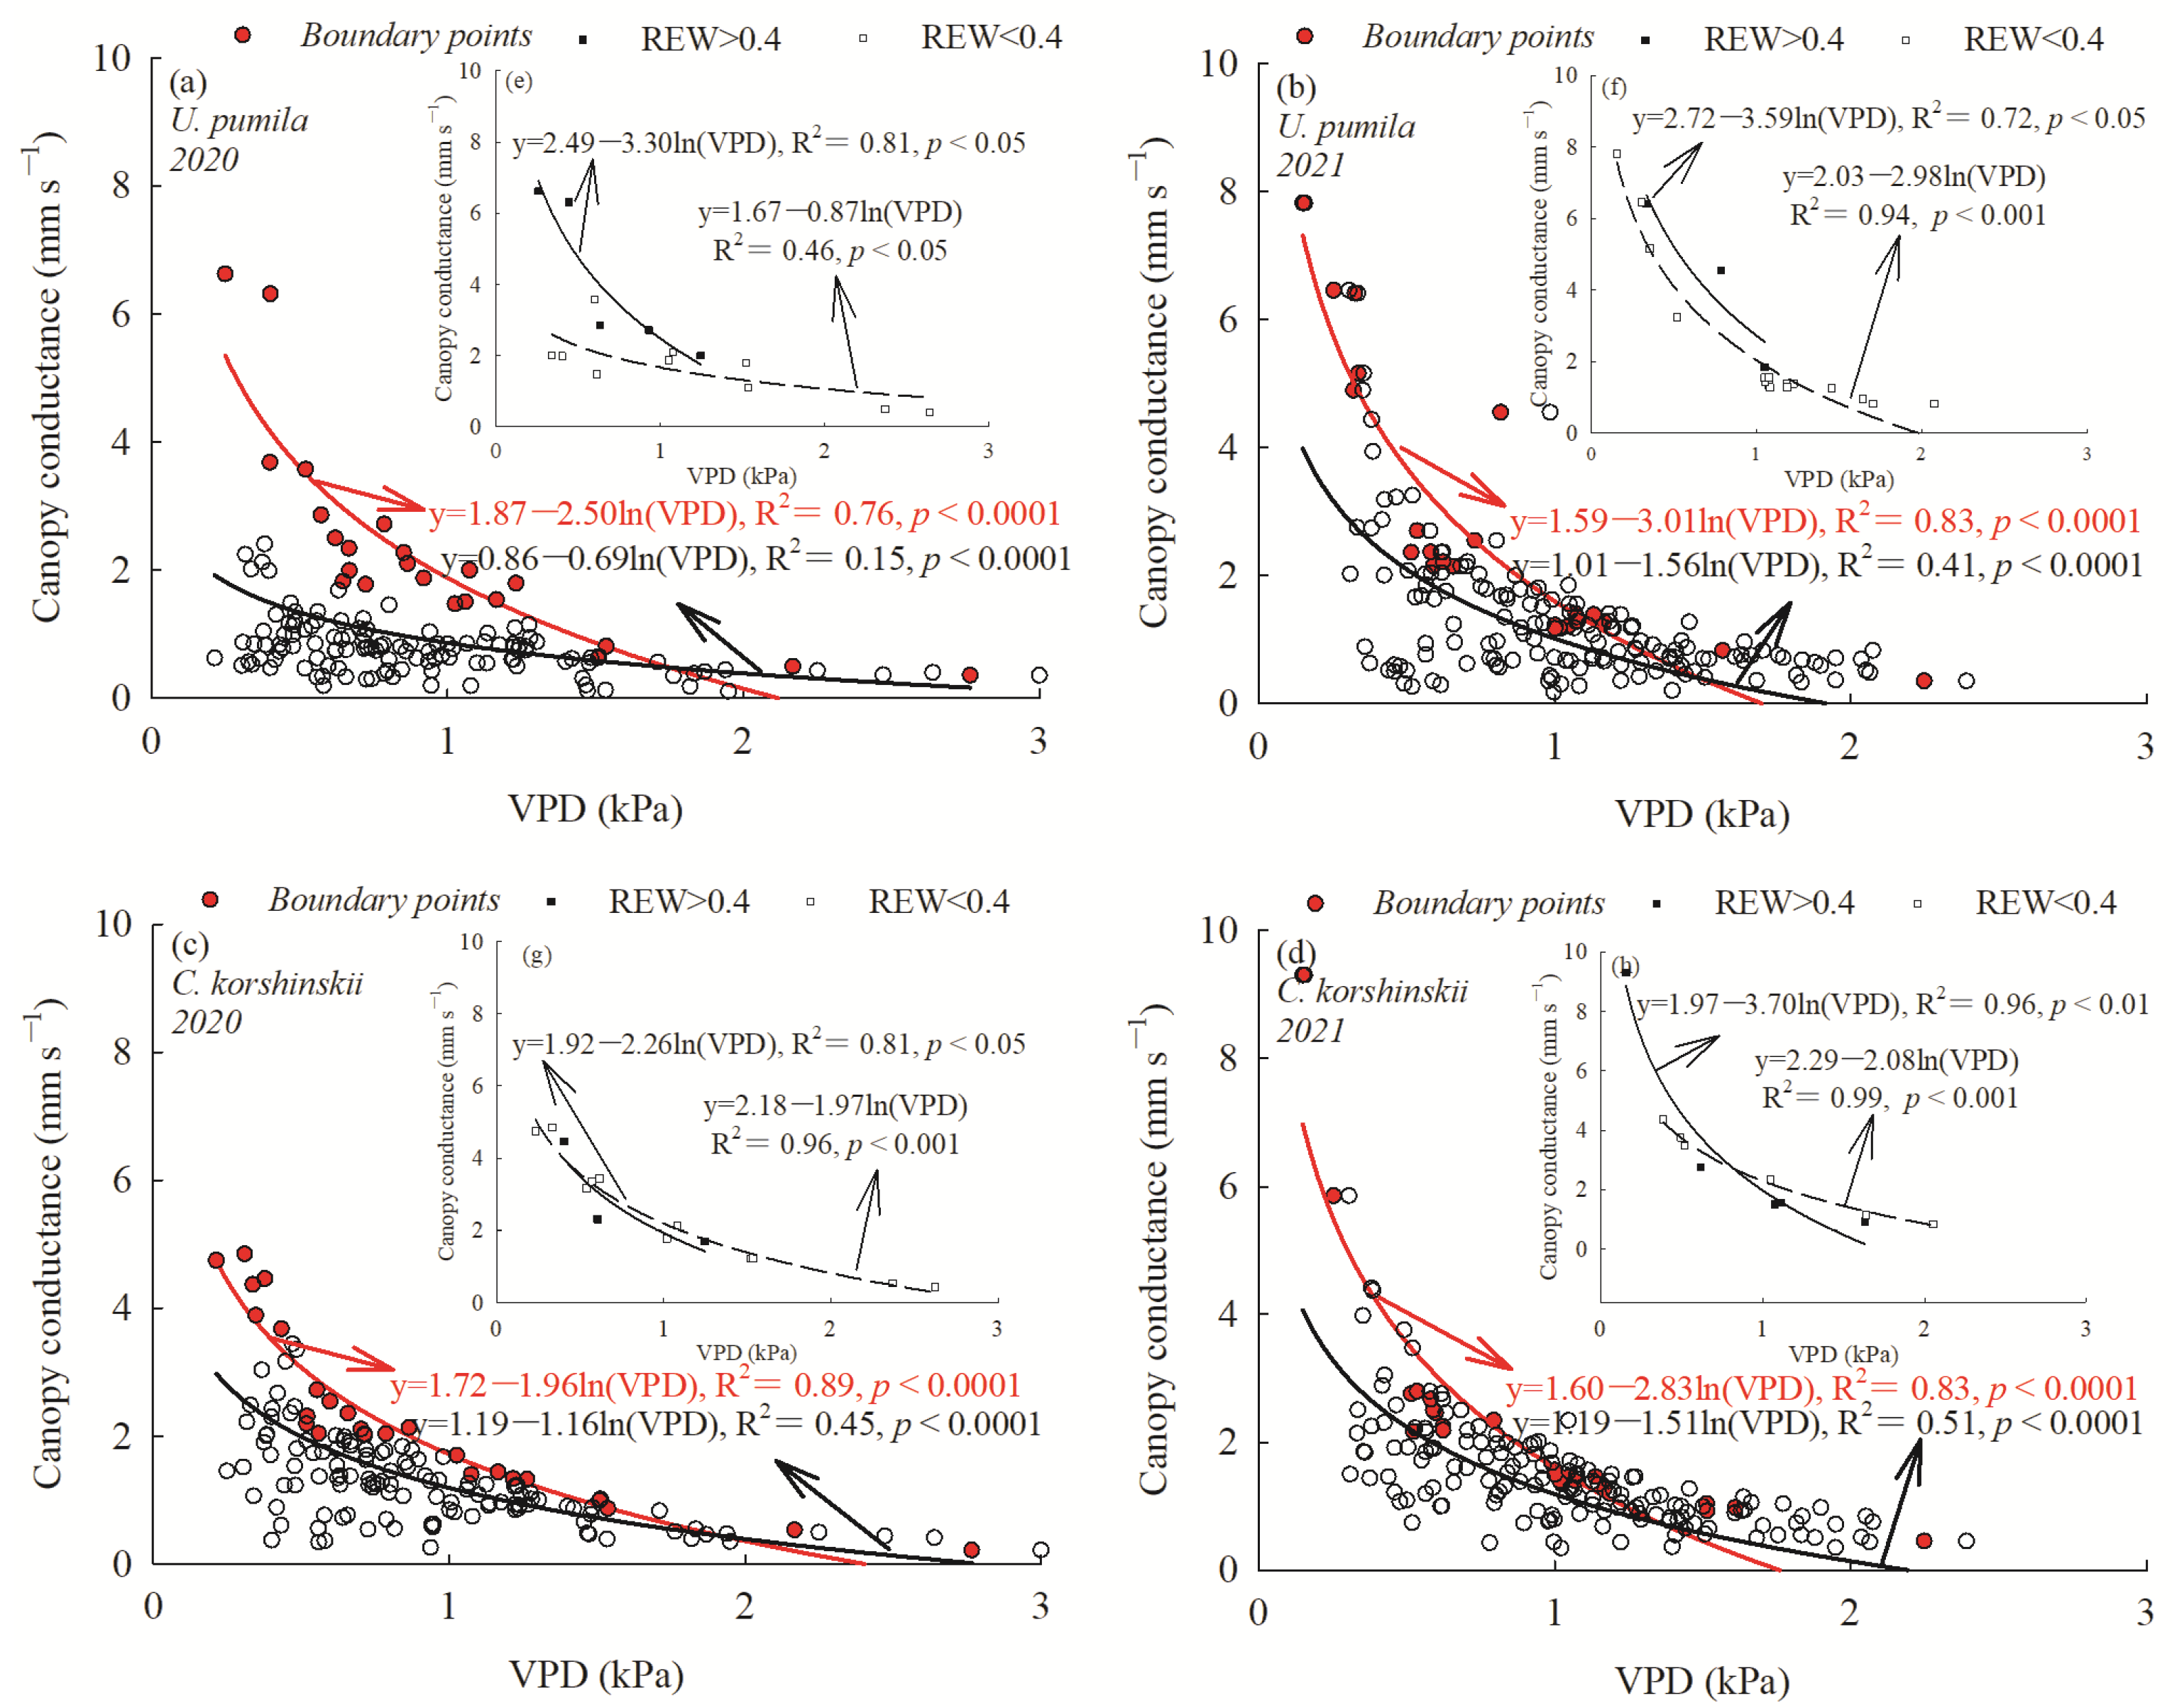
3.4. Response of Canopy Stomatal Conductance to VPD

The Gc showed similar seasonal variations for U. pumila and C. korshinskii during 2020 and 2021. The maximum monthly Gc of U. pumila was 1.98 ± 1.07 mm s−1 and 2.02 ± 1.42 mm s−1 in July during 2020 and 2021, respectively. However, in both years, the Gc of C. korshinskii was significantly higher in July–September than in May–June (F = 15.517, p < 0.001 in 2020 and F = 11.477, p < 0.001 in 2021) (Figure 7). The Gc significantly decreased with an increase in VPD for both afforestation species (Figure 8). VPD explained 15% and 41% of total variation in Gc for U. pumila in 2020 and 2021, respectively (Figure 8a,b), and 45% and 51% of total variation in Gc for C. korshinskii in 2020 and 2021, respectively (Figure 8c,d). In addition, m had a significantly higher effect in 2021 than in 2020 for U. pumila (3.01 > 2.50) and C. korshinskii (2.83 > 1.96) after applying boundary line analysis, whereas no significant difference in the reference canopy stomatal conductance (Gref) was observed for the two planted species. Moreover, the higher Gc of U. pumila and C. korshinskii when REW > 0.4 than when REW < 0.4 (U. pumila: 2.46 > 0.78, F = 26.383, p < 0.001 in 2020; C. korshinskii: 2.02 > 1.36, F = 14.359, p < 0.001 in 2021) indicates the significant effect of soil water content on canopy stomatal conductance. m was also higher under REW > 0.4 conditions than under REW < 0.4 conditions for both of the planted species (U. pumila: 3.30 > 0.87 in 2020 and 3.59 > 2.98 in 2021; C. korshinskii: 2.26 > 1.97 in 2020 and 3.70 > 2.08 in 2021) (Figure 8e–h).
Throughout the measurement period, the daily Ω of U. pumila ranged from 0.0001 to 0.0112, with mean values of 0.0015 ± 0.0014 and 0.0020 ± 0.0019 in 2020 and 2021, respectively (Figure 7). The daily Ω of C. korshinskii ranged from 0.0003 to 0.0145, with mean values of 0.0024 ± 0.0016 and 0.0024 ± 0.0018 in 2020 and 2021, respectively. No differences were found for the value of Ω between 2020 and 2021 for both U. pumila (F = 5.896, p = 0.016) and C. korshinskii (F = 0.021, p = 0.884).

4. Discussion

4.1. Canopy Transpiration of U. pumila and C. korshinskii

The Ec of the U. pumila stand in this study was 0.55 and 0.66 mm d−1, which is similar to the values reported for Mongolian pine planted in the southeastern Keerqin Sandy Land [35] and half-mature Mongolian pine planted in the Rare Psammophytes Protection Botanical Base [36], but significantly lower than those of Chinese pine (0.7 mm d−1), Mongolian pine (1.1 mm d−1), and Populus × xiaozhuanica plantations (1.2–1.5 mm d−1) planted in the Keerqin Sandy Land [16]; Populus simonii (175.2 kg d−1) planted on the Loess Plateau [37]; and Populus euphratica Oliv. planted in the lower reaches of the Heihe River Basin [38]. The Ec of the C. korshinskii stand in this study was 0.74 and 0.77 mm d−1 in the two seasons, respectively. These values are lower than those for the same species planted in the Loess Plateau under different precipitation regions [37,39]. Compared with other major planted shrubs, a similar range of transpiration was reported for a Vitex negundo L. plantation (107.21 mm cumulative in the growing season), but a higher transpiration of Hippophae rhamnoides L. was found in the Loess Plateau (122.33–180.28 mm cumulative in the growing season) [11]. This may be related to the higher evaporative demand in drier and colder regions and the lower soil water availability in the Bashang Plateau. The mean annual precipitation in our study site was 100–150 mm lower than that for planted forests in the Keerqin Sandy Land and the Loess Plateau. In addition, a relatively lower soil water content may also increase the hydraulic resistance of the soil–root system, preventing water movement between soil and plant leaves, which ultimately decreases plantations’ transpiration rate [40]. Finally, short heights and small sapwood areas, resulting from severe canopy dieback and planted forest degradation, were found for the U. pumila stand in this study (Table 2), and canopy transpiration was thus exhibited at a lower level.
Ec responded to REW as a saturated exponential function for C. korshinskii in this study (Figure 5c,d), which was in agreement with results reported for broadleaved and coniferous trees under different climates [41], a larch plantation in the semiarid Northwest China [42], a black locust plantation [43], and C. korshinskii [44] on the Loess Plateau. However, the REW threshold in this study is similar to or relatively higher than those in the studies reported above. Li et al. indicated that the REW threshold is generally higher under dry conditions than under wet conditions [23]. Averaged soil water content of the C. korshinskii stand was 5.09% in 2020 and 5.33% in 2021, which was lower than those in the plantations reported above (Figure 3b). Ec presented a polynomial pattern in REW for U. pumila in this study (Figure 5a,b), which was consistent with that in Haloxylon ammodendron and Calligonum mongolicum in Northwest China [45]. The reason that Ec was lower during the higher REW period is linked to the much lower VPD and Ta when compared to the dry period (Figure 2 and Figure 6b). The daily Ec of both the U. pumila and C. korshinskii stands increased with increasing PAR and VPD, and Ec tended to be saturated at high VPD values. These results are similar to those reported for poplar trees [16], Mongolian pine [46], and other planted species [12]. In both plantations, however, the VPD threshold decreased as soil water content decreased, ranging from non-stressed to water stressed. An obvious VPD threshold was observed at approximately 2.0 kPa for the U. pumila stand and 1.5 kPa for the C. korshinskii stand when REW < 0.4. Liu et al. indicated that the utilization of surface soil water gradually increased with the increase in the degree of degradation of the agroforestry shelterbelts [47]. We then concluded that the U. pumila and C. korshinskii stands primarily obtained water from the shallow and middle soil layers because of the root distribution pattern and the degree of canopy dieback. As soil water decreased, the increasing whole-tree hydraulic resistance triggered canopy stomatal closure, and hence limited the response of transpiration to major environmental variables. In addition, the Ω values (Figure 6) were also lower than those reported for mature Mongolian pine (0.041), half-mature Mongolian pine (0.15), and young Mongolian pine (0.18) [36], and Schima superba (0.22) [48]. The smaller LAI of the U. pumila (0.31) and C. korshinskii (0.43) plantations in this study, compared to that of the Mongolian pine (0.96–1.54) in the Horqin desert and the Mu Us desert, indicates that decreasing the canopy resistance resulted in strong canopy–atmosphere coupling. Therefore, under high VPD conditions, canopy stomata must be closed to prevent water potential from dropping below the threshold and thus inhibiting tree transpiration. Moreover, a relatively lower VPD threshold under water stress was observed for both C. korshinskii (1.5 kPa) and U. pumila (2.0 kPa), indicating that the transpiration process of the two species was affected significantly by soil drought [49]. Planted species usually have a shallower fine root distribution and lower stem and leaf hydraulic conductivity [38,50]. As concluded above, the transpiration process and water-use strategy of U. pumila and C. korshinskii were revealed in the Bashang Plateau, and further research on the water-use pattern of typical planted forests should be undertaken in the future. However, in the present study, we did not investigate seasonal variations in LAI and its effects on canopy transpiration during the growing season for U. pumila and C. korshinskii. Additional studies on canopy transpiration and stomatal conductance combined with different plantation ages and densities would provide further insights into the ecohydrological processes and afforestation management on the Bashang Plateau.

4.2. Canopy Stomatal Conductance of U. pumila and C. korshinskii

The Gc values were significantly higher under non-stressed conditions than under stressed conditions for both plantations, indicating the strong limitations of soil water on canopy stomatal conductance. In addition, the significantly nonlinear negative relationship between Gc and VPD in both the U. pumila and C. korshinskii plantations suggested that stronger stomatal regulation of canopy transpiration responded to higher VPD. Stomatal closure thus played an important role in maintaining water status to avoid a catastrophic loss of xylem function [51]. This drought adaptation mechanism can be characterized as a water-saving strategy, consistent with those reported for P. sylvestris plantations [36,52,53].
We also found that the parameters of m and Gref for the U. pumila plantation were higher than those for the C. korshinskii plantation (Figure 8). This was contrary to the findings of Song et al. [46], who observed that, in comparison with Mongolian pine (an introduced species), Chinese pine (a native species) had relatively higher values of m and Gref. We further suggest that m and Gref for both the U. pumila and C. korshinskii plantations were higher under REW > 0.4 than under REW < 0.4 (Figure 8e–h), indicating that the sensitivity of canopy stomatal conductance to VPD decreased with soil drought; this was consistent with the findings of Novick et al. [54], Jiao et al. [19] on the Loess Plateau, and Song et al. [35] in the Horqin desert. Soil drought can negatively affect the hydraulic conductance of soil-to-plant leaf transporting paths and decrease m values, thus limiting the transpiration rate. Grossiord et al. indicated that reduced soil water availability negated the benefits of stomatal and hydraulic adjustments and resulted in reduced transpiration in juniper [55]. Similar results were found for grapevines, both in pot grown and field-grown experiments [56]. Therefore, further decreasing hydraulic conductance to prevent xylem cavitation as soil water stress increases results in a less sensitive response of Gc to VPD. This may be one of the important reasons why planted forests are vulnerable to dieback and degradation. Further research on the hydraulic traits of typical planted forests should be undertaken in the future.

5. Conclusions

In the present study, canopy transpiration and stomatal conductance were estimated for an U. pumila and a C. korshinskii stand. During the growing season, canopy transpiration was 83.72 and 113.65 mm in 2020 and 2021, respectively, for the U. pumila stand, and 101.29 and 117.77 mm in 2020 and 2021, respectively, for the C. korshinskii stand. Transpiration of U. pumila and C. korshinskii were better correlated to soil water content, photosynthetically active radiation, and VPD. Both planted species showed reduced VPD sensitivity of canopy transpiration as soil water decreased, indicating the transpiration process was affected significantly by soil drought. The VPD threshold was 1.50 and 2.0 kPa for U. pumila and C. korshinskii, respectively. Furthermore, the transpiration of both planted species was mainly regulated by stomatal opening due to low values of the decoupling coefficients (0.0015 and 0.0020 for U. pumila; 0.0024 for C. korshinskii). Both U. pumila and C. korshinskii gradually displayed a reduced canopy stomatal conductance with increasing VPD, but decreasing stomatal sensitivity to VPD in response to soil drought was also observed. Based on the results above, we conclude that both U. pumila and C. korshinskii plantations exhibited water-saving strategies under a cold and arid environment on the Bashang Plateau. These findings provide a deeper understanding of transpiration dynamics of different forest functional types on the Bashang Plateau, which may be applied for afforestation management in semiarid regions.

Author Contributions

Conceptualization, Y.Z.; methodology, Y.Z. and W.L.; investigation, J.Z. and N.W.; data curation, H.Y. and B.X.; Supervision, X.W.; Writing—original draft, Y.Z.; Writing—review and editing, Y.Z. and W.L. All authors have read and agreed to the published version of the manuscript.

Funding

This research was funded by the National Natural Science Foundation of China (No. 42101019, 42001027, 51909052), Natural Science Foundation of Hebei Province (D2019205274, D2019403115, D2021403023), Science and Technology Project of Hebei Education Department (QN2019152, BJK2022022), Key Laboratory of Agricultural Water Resources & Hebei Key Laboratory of Agricultural Water-Saving, Center for Agricultural Resources Research, Institute of Genetics and Developmental Biology (KFKT201903), Science Foundation of Hebei Normal University (L2018B22), Special soft science research project of Hebei Provincial Science and Technology Plan (21557401D).

Informed Consent Statement

Not applicable.

Acknowledgments

We thank the reviewers and editors for their work.

Conflicts of Interest

The authors declare no conflict of interest.

References

  1. Peng, S.; Piao, S.; Zeng, Z.; Ciais, P.; Zhou, L.; Li, L.Z.; Myneni, R.B.; Yin, Y.; Zeng, H. Afforestation in China cools local land surface temperature. Proc. Natl. Acad. Sci. USA 2014, 111, 2915–2919. [Google Scholar] [CrossRef] [PubMed] [Green Version]
  2. Zhang, M.; Wei, X. Deforestation, forestation, and water supply. Science 2021, 371, 990–991. [Google Scholar] [CrossRef] [PubMed]
  3. Zhang, B.; Tian, L.; Yang, Y.; He, X. Revegetation does not decrease water yield in the Loess Plateau of China. Geophys. Res. Lett. 2022, 49, e2022GL098025. [Google Scholar] [CrossRef]
  4. Zhu, J.; Li, F.; Xu, M.; Kang, H.; Wu, X. The role of ectomycorrhizal fungi in alleviating pine decline in semiarid sandy soil of northern China: An experimental approach. Ann. For. Sci. 2008, 65, 1. [Google Scholar] [CrossRef] [Green Version]
  5. Song, L.; Zhu, J.; Zheng, X.; Wang, K.; Lü, L.; Zhang, X.; Hao, G. Transpiration and canopy conductance dynamics of Pinus sylvestris var. mongolica in its natural range and in an introduced region in the sandy plains of Northern China. Agric. For. Meteorol. 2020, 281, 107830. [Google Scholar] [CrossRef]
  6. Caldeira, M.C.; Lecomte, X.; David, T.S.; Pinto, J.G.; Bugalho, M.N.; Werner, C. Synergy of extreme drought and shrub invasion reduce ecosystem functioning and resilience in water-limited climates. Sci. Rep. 2015, 5, 15110. [Google Scholar] [CrossRef] [PubMed] [Green Version]
  7. Wu, H.; Li, X.; Jiang, Z.; Chen, H.; Zhang, C.; Xiao, X. Contrasting water use pattern of introduced and native plants in an alpine desert ecosystem, Northeast Qinghai–Tibet Plateau, China. Sci. Total Environ. 2016, 542, 182–191. [Google Scholar] [CrossRef] [PubMed]
  8. Anderegg, W.R.; Anderegg, L.D.; Kerr, K.L.; Trugman, A.T. Widespread drought-induced tree mortality at dry range edges indicates that climate stress exceeds species’ compensating mechanisms. Glob. Chang. Biol. 2019, 25, 3793–3802. [Google Scholar] [CrossRef] [PubMed]
  9. Ji, Y.; Zhou, G.; Li, Z.; Wang, S.; Zhou, H.; Song, X. Triggers of widespread dieback and mortality of poplar (Populus spp.) plantations across northern China. J. Arid Environ. 2020, 174, 104076. [Google Scholar] [CrossRef]
  10. Yu, S.; Guo, J.; Liu, Z.; Wang, Y.; Ma, J.; Li, J.; Liu, F. Assessing the impact of soil moisture on canopy transpiration using a modified Jarvis-Stewart model. Water 2021, 13, 2720. [Google Scholar] [CrossRef]
  11. Fang, W.; Lu, N.; Liu, J.; Jiao, L.; Zhang, Y.; Wang, M.; Fu, B. Canopy transpiration and stand water balance between two contrasting hydrological years in three typical shrub communities on the semiarid Loess Plateau of China. Ecohydrology 2019, 12, e2064. [Google Scholar] [CrossRef]
  12. Urban, J.; Rubtsov, A.V.; Urban, A.V.; Shashkin, A.V.; Benkova, V.E. Canopy transpiration of a Larix sibirica and Pinus sylvestris forest in Central Siberia. Agric. For. Meteorol. 2019, 271, 64–72. [Google Scholar] [CrossRef]
  13. Munoz-Villers, L.E.; Holwerda, F.; Alvarado-Barrientos, M.S.; Geissert, D.R.; Dawson, T.E. Reduced dry season transpiration is coupled with shallow soil water use in tropical montane forest trees. Oecologia 2018, 188, 303–317. [Google Scholar] [CrossRef]
  14. He, Q.; Yan, M.; Miyazawa, Y.; Chen, Q.; Cheng, R.; Otsuki, K.; Yamanaka, N.; Du, S. Sap flow changes and climatic responses over multiple-year treatment of rainfall exclusion in a sub-humid black locust plantation. For. Ecol. Manag. 2020, 457, 117730. [Google Scholar] [CrossRef]
  15. Zhang, Z.; Zhao, P.; Zhao, X.; Zhou, J.; Zhao, P.; Zeng, X.; Hu, Y.; Ouyang, L. The tree height-related spatial variances of tree sap flux density and its scale-up to stand transpiration in a subtropical evergreen broadleaf forest. Ecohydrology 2018, 11, e1979. [Google Scholar] [CrossRef]
  16. Song, L.; Zhu, J.; Zhang, T.; Wang, K.; Wang, G.; Liu, J. Higher canopy transpiration rates induced dieback in poplar (Populus × xiaozhuanica) plantations in a semiarid sandy region of Northeast China. Agric. Water Manag. 2021, 243, 106414. [Google Scholar] [CrossRef]
  17. Bosch, D.D.; Marshall, L.K.; Teskey, R. Forest transpiration from sap flux density measurements in a Southeastern Coastal Plain riparian buffer system. Agric. For. Meteorol. 2014, 187, 72–82. [Google Scholar] [CrossRef]
  18. Chen, Z.; Zhang, Z.; Sun, G.; Chen, L.; Xu, H.; Chen, S. Biophysical controls on nocturnal sap flow in plantation forests in a semi-arid region of northern China. Agric. For. Meteorol. 2020, 284, 107904. [Google Scholar] [CrossRef]
  19. Jiao, L.; Lu, N.; Fang, W.; Li, Z.; Wang, J.; Jin, Z. Determining the independent impact of soil water on forest transpiration: A case study of a black locust plantation in the Loess Plateau, China. J. Hydrol. 2019, 572, 671–681. [Google Scholar] [CrossRef]
  20. Dymond, S.F.; Bradford, J.B.; Bolstad, P.V.; Kolka, R.K.; Sebestyen, S.D.; DeSutter, T.M. Topographic, edaphic, and vegetative controls on plant-available water. Ecohydrology 2017, 10, e1897. [Google Scholar] [CrossRef]
  21. Granier, A.; Bréda, N.; Biron, P.; Villette, S. A lumped water balance model to evaluate duration and intensity of drought constraints in forest stands. Ecol. Model. 1999, 116, 269–283. [Google Scholar] [CrossRef]
  22. MacKay, S.L.; Arain, M.A.; Khomik, M.; Brodeur, J.J.; Schumacher, J.; Hartmann, H.; Peichl, M. The impact of induced drought on transpiration and growth in a temperate pine plantation forest. Hydrol. Process. 2012, 26, 1779–1791. [Google Scholar] [CrossRef] [Green Version]
  23. Li, Z.; Yu, P.; Wang, Y.; Webb, A.A.; He, C.; Wang, Y.; Yang, L. A model coupling the effects of soil moisture and potential evaporation on the tree transpiration of a semi-arid larch plantation. Ecohydrology 2017, 10, e1764. [Google Scholar] [CrossRef]
  24. Chang, X.; Zhao, W.; Liu, H.; Wei, X.; Liu, B.; He, Z. Qinghai spruce (Picea crassifolia) forest transpiration and canopy conductance in the upper Heihe River Basin of arid northwestern China. Agric. For. Meteorol. 2014, 198, 209–220. [Google Scholar] [CrossRef]
  25. Ouyang, L.; Zhao, P.; Rao, X.; Zhu, L.; Ni, G. Interpreting the water use strategies of plantation tree species by canopy stomatal conductance and its sensitivity to vapor pressure deficit in South China. For. Ecol. Manag. 2022, 505, 119940. [Google Scholar] [CrossRef]
  26. Denham, S.O.; Oishi, A.C.; Miniat, C.F.; Wood, J.D.; Yi, K.; Benson, M.C.; Novick, K.A. Eastern US deciduous tree species respond dissimilarly to declining soil moisture but similarly to rising evaporative demand. Tree Physiol. 2021, 41, 944–959. [Google Scholar] [CrossRef] [PubMed]
  27. Grossiord, C.; Sevanto, S.; Dawson, T.E.; Adams, H.D.; Collins, A.D.; Dickman, L.T.; Newman, B.D.; Stockton, E.A.; McDowell, N.G. Warming combined with more extreme precipitation regimes modifies the water sources used by trees. New Phytol. 2017, 213, 584–596. [Google Scholar] [CrossRef] [PubMed]
  28. Wang, H.; Sun, B.; Yu, X.; Xin, Z.; Jia, G. The driver-pattern-effect connection of vegetation dynamics in the transition area between semi-arid and semi-humid northern China. Catena 2020, 194, 104713. [Google Scholar] [CrossRef]
  29. Chu, X.; Zhan, J.; Wang, C.; Hameeda, S.; Wang, X. Households’ Willingness to Accept Improved Ecosystem Services and Influencing Factors: Application of Contingent Valuation Method in Bashang Plateau, Hebei Province, China. J. Environ. Manag. 2020, 255, 109925. [Google Scholar] [CrossRef]
  30. Granier, A. Evaluation of transpiration in a Douglas-fir stand by means of sap flow measurements. Tree Physiol. 1987, 3, 309–320. [Google Scholar] [CrossRef]
  31. Allen, R.G.; Pereira, L.S.; Raes, D.; Smith, M. Crop evapotranspiration-Guidelines for computing crop water requirements-FAO Irrigation and drainage paper 56. Fao Rome 1998, 300, D05109. [Google Scholar]
  32. Naithani, K.J.; Ewers, B.E.; Pendall, E. Sap flux-scaled transpiration and stomatal conductance response to soil and atmospheric drought in a semi-arid sagebrush ecosystem. J. Hydrol. 2012, 464, 176–185. [Google Scholar] [CrossRef]
  33. Kumagai, T.O.; Saitoh, T.M.; Sato, Y.; Morooka, T.; Manfroi, O.J.; Kuraji, K.; Suzuki, M. Transpiration, canopy conductance and the decoupling coefficient of a lowland mixed dipterocarp forest in Sarawak, Borneo: Dry spell effects. J. Hydrol. 2004, 287, 237–251. [Google Scholar] [CrossRef]
  34. Oren, R.; Sperry, J.; Katul, G.; Pataki, D.; Ewers, B.; Phillips, N.; Schäfer, K. Survey and synthesis of intra-and interspecific variation in stomatal sensitivity to vapour pressure deficit. Plant Cell Environ. 1999, 22, 1515–1526. [Google Scholar] [CrossRef] [Green Version]
  35. Song, L.; Zhu, J.; Li, X.; Wang, K.; Wang, G.; Sun, H. Transpiration of Pinus sylvestris var. mongolica trees at different positions of sand dunes in a semiarid sandy region of Northeast China. Trees 2022, 36, 749–762. [Google Scholar] [CrossRef]
  36. Deng, J.; Yao, J.; Zheng, X.; Gao, G. Transpiration and canopy stomatal conductance dynamics of Mongolian pine plantations in semiarid deserts, Northern China. Agric. Water Manag. 2021, 249, 106806. [Google Scholar] [CrossRef]
  37. Wang, S.; Fan, J.; Ge, J.; Wang, Q.; Fu, W. Discrepancy in tree transpiration of Salix matsudana, Populus simonii under distinct soil, topography conditions in an ecological rehabilitation area on the Northern Loess Plateau. For. Ecol. Manag. 2019, 432, 675–685. [Google Scholar] [CrossRef]
  38. Li, W.; Si, J.; Yu, T.; Li, X. Response of Populus euphratica Oliv. sap flow to environmental variables for a desert riparian forest in the Heihe River Basin, Northwest China. J. Arid Land 2016, 8, 591–603. [Google Scholar] [CrossRef] [Green Version]
  39. Jian, S.; Zhao, C.; Fang, S.; Yu, K. Evaluation of water use of Caragana korshinskii and Hippophae rhamnoides in the Chinese Loess Plateau. Can. J. For. Res. 2015, 45, 15–25. [Google Scholar] [CrossRef]
  40. Ghimire, C.P.; Bruijnzeel, L.A.; Lubczynski, M.W.; Zwartendijk, B.W.; Odongo, V.O.; Ravelona, M.; Van Meerveld, H. Transpiration and stomatal conductance in a young secondary tropical montane forest: Contrasts between native trees and invasive understorey shrubs. Tree Physiol. 2018, 38, 1053–1070. [Google Scholar] [CrossRef]
  41. Granier, A.; Loustau, D.; Bréda, N. A generic model of forest canopy conductance dependent on climate, soil water availability and leaf area index. Ann. For. Sci. 2000, 57, 755–765. [Google Scholar] [CrossRef]
  42. Wang, Y.; Wang, Y.; Li, Z.; Yu, P.; Han, X. Interannual variation of transpiration and its modeling of a larch plantation in semiarid Northwest China. Forests 2020, 11, 1303. [Google Scholar] [CrossRef]
  43. Wu, Y.; Huang, M.; Warrington, D.N. Black locust transpiration responses to soil water availability as affected by meteorological factors and soil texture. Pedosphere 2015, 25, 57–71. [Google Scholar] [CrossRef]
  44. She, D.; Xia, Y.; Shao, M.; Peng, S.; Yu, S. Transpiration and canopy conductance of Caragana korshinskii trees in response to soil moisture in sand land of China. Agrofor. Syst. 2013, 87, 667–678. [Google Scholar] [CrossRef]
  45. Ji, X.; Zhao, W.; Kang, E.; Jin, B.; Xu, S. Transpiration from three dominant shrub species in a desert-oasis ecotone of arid regions of Northwestern China. Hydrol. Process. 2016, 30, 4841–4854. [Google Scholar] [CrossRef]
  46. Song, L.; Zhu, J.; Zheng, X.; Wang, K.; Zhang, J.; Hao, G.; Wang, G.; Liu, J. Comparison of canopy transpiration between Pinus sylvestris var. mongolica and Pinus tabuliformis plantations in a semiarid sandy region of Northeast China. Agric. For. Meteorol. 2022, 314, 108784. [Google Scholar] [CrossRef]
  47. Liu, Z.; Jia, G.; Yu, X. Variation of water uptake in degradation agroforestry shelterbelts on the North China Plain. Agric. Ecosyst. Environ. 2020, 287, 106697. [Google Scholar] [CrossRef]
  48. Zhang, Z.Z.; Zhao, P.; McCarthy, H.R.; Zhao, X.H.; Niu, J.F.; Zhu, L.W.; Ni, G.Y.; Ouyang, L.; Huang, Y.Q. Influence of the decoupling degree on the estimation of canopy stomatal conductance for two broadleaf tree species. Agric. For. Meteorol. 2016, 221, 230–241. [Google Scholar] [CrossRef]
  49. Du, S.; Wang, Y.; Kume, T.; Zhang, J.; Otsuki, K.; Yamanaka, N.; Liu, G. Sapflow characteristics and climatic responses in three forest species in the semiarid Loess Plateau region of China. Agric. For. Meteorol. 2011, 151, 1–10. [Google Scholar] [CrossRef]
  50. Liu, Y.; Wang, A.; An, Y.; Lian, P.; Wu, D.; Zhu, J.; Meinzer, F.C.; Hao, G. Hydraulics play an important role in causing low growth rate and dieback of aging Pinus sylvestris var. mongolica trees in plantations of Northeast China. Plant Cell Environ. 2018, 41, 1500–1511. [Google Scholar] [CrossRef]
  51. Gao, J.; Zhao, P.; Shen, W.; Niu, J.; Zhu, L.; Ni, G. Biophysical limits to responses of water flux to vapor pressure deficit in seven tree species with contrasting land use regimes. Agric. For. Meteorol. 2015, 200, 258–269. [Google Scholar] [CrossRef]
  52. Leo, M.; Oberhuber, W.; Schuster, R.; Grams, T.E.; Matyssek, R.; Wieser, G. Evaluating the effect of plant water availability on inner alpine coniferous trees based on sap flow measurements. Eur. J. For. Res. 2014, 133, 691–698. [Google Scholar] [CrossRef]
  53. Song, L.; Zhu, J.; Li, M.; Zhang, J.; Zheng, X.; Wang, K. Canopy transpiration of Pinus sylvestris var. mongolica in a sparse wood grassland in the semiarid sandy region of Northeast China. Agric. For. Meteorol. 2018, 250, 192–201. [Google Scholar] [CrossRef]
  54. Novick, K.A.; Ficklin, D.L.; Stoy, P.C.; Williams, C.A.; Bohrer, G.; Oishi, A.C.; Papuga, S.A.; Blanken, P.D.; Noormets, A.; Sulman, B.N. The increasing importance of atmospheric demand for ecosystem water and carbon fluxes. Nat. Clim. Chang. 2016, 6, 1023–1027. [Google Scholar] [CrossRef] [Green Version]
  55. Grossiord, C.; Sevanto, S.; Borrego, I.; Chan, A.M.; Collins, A.D.; Dickman, L.T.; Hudson, P.J.; McBranch, N.; Michaletz, S.T.; Pockman, W.T. Tree water dynamics in a drying and warming world. Plant Cell Environ. 2017, 40, 1861–1873. [Google Scholar] [CrossRef] [PubMed] [Green Version]
  56. Romero, P.; Botía, P.; Keller, M. Hydraulics and gas exchange recover more rapidly from severe drought stress in small pot-grown grapevines than in field-grown plants. J. Plant Physiol. 2017, 216, 58–73. [Google Scholar] [CrossRef] [PubMed]
Figure 1. Geographical research sites in this study, namely, the (a) U. pumila site and (b) C. korshinskii site on the Bashang Plateau.
Forests 13 01081 g001
Figure 2. Daily variations in (a) photosynthetically active radiation (PAR) and daily potential evapotranspiration (PET), (b) temperature (Ta) and relative humidity (RH), (c) wind speed (u2) and vapor pressure deficit (VPD).
Forests 13 01081 g002
Figure 3. Daily precipitation and volumetric soil water content (0–100 cm) from May 1 to September 30 in (a) U. pumila and (b) C. korshinskii.
Forests 13 01081 g003
Figure 4. Variations in daily canopy transpiration of per ground area (Ec, a,c), and monthly transpiration (b,d) for U. pumila and C. korshinskii.
Forests 13 01081 g004
Figure 5. Response of canopy transpiration per ground area to the relative extractable soil water and boundary line analysis for U. pumila and C. korshinskii in 2020 (a,c) and 2021 (b,d).
Forests 13 01081 g005
Figure 6. Relationships between canopy transpiration per ground area and daily environmental variables for U. pumila and C. korshinskii under stressed (REW < 0.40) and non-stressed (REW > 0.4) conditions across the measurement periods of 2020: (a,c) photosynthetically active radiation; (b,d) vapor pressure deficit.
Forests 13 01081 g006
Figure 7. Seasonal variations in daily mean canopy conductance per ground area (Gc) and mean decoupling coefficient (Ω) for U. pumila and C. korshinskii during the growing season of 2020 (a,c) and 2021 (b,d); monthly Gc and Ω for U. pumila and C. korshinskii of 2020 (e,g) and 2021 (f,h).
Forests 13 01081 g007
Figure 8. Relationships between canopy conductance per ground area and daily vapor pressure deficit in the measurement periods (black line) and boundary line analysis (red line) for U. pumila and C. korshinskii in 2020 (a,c) and 2021 (b,d); boundary line analysis under stressed (REW < 0.4) and non-stressed (REW > 0.4) conditions for U. pumila and C. korshinskii in 2020 (e,g) and 2021 (f,h).
Forests 13 01081 g008
Table 1. Detailed information about vegetation characteristics and soil properties of U. pumila and C. korshinskii stands.
SpeciesVegetation CharacteristicsSoil Properties (%)
AgeDBH/SBD (cm)SA
(cm2)
LAI
(m2 m−2)
Soil Particle-Size DistributionsSOM
SandSiltClay
U. pumila3816.60120.630.3139.4650.859.691.34
C. korshinskii202.382.650.4352.8939.257.860.85
Note: DBH = diameter at breast height; SBD = stem basal diameter; SA = sapwood area; LAI = leaf area index; SOM = soil organic matter.
Table 2. Correlation coefficients between canopy transpiration (Ec) and environmental factors for U. pumila and C. korshinskii in 2020 and 2021.
PARTaRHVPDu2pPETθ
U. pumilaEc (2020)0.522 **0.615 **-0.366 **−0.404 *-0.277 **0.691 **
Ec (2021)0.513 **0.369 **--−0.508 **−0.253 **0.176 *0.502 **
C. korshinskiiEc (2020)0.475 **0.362 **-0.354 **−0.462 **−0.262 **-0.474 **
Ec (2021)0.349 **0.402 **-0.389 **−0.330 **−0.497 **0.185 *0.444 **
Note: PAR = photosynthetically active radiation; Ta = air temperature; RH = relative humidity; VPD = vapor pressure deficit; u2 = wind speed; P = precipitation; PET = daily potential evapotranspiration; θ = soil water content. ** indicates p < 0.01, * indicates p < 0.05.
Publisher’s Note: MDPI stays neutral with regard to jurisdictional claims in published maps and institutional affiliations.

