Article

Allometric Equations for the Biomass Estimation of Calophyllum inophyllum L. in Java, Indonesia

1
Research Center for Ecology and Ethnobiology, National Research and Innovation Agency, Jalan Raya Jakarta-Bogor Km 46, Cibinong 16911, Indonesia
2
Research Center for Plant Conservation, Botanic Gardens, and Forestry, National Research and Innovation Agency, Jalan Raya Jakarta-Bogor Km 46, Cibinong 16911, Indonesia
3
Center for International Forestry Research (CIFOR), Bogor 16115, Indonesia
4
School of Ecosystem and Forest Science, University of Melbourne, Parkville, VIC 3010, Australia
5
Research Center for Biomass and Bioproducts, National Research and Innovation Agency, Jalan Raya Jakarta-Bogor Km 46, Cibinong 16911, Indonesia
6
Global Forestry Division, National Institute of Forest Science, 57, Hoegi-ro, Dongdaemun-gu, Seoul 02455, Korea
7
Wildlife Conservation Research Unit, Department of Zoology, University of Oxford, Recanati-Kaplan Centre, Tubney House, Abingdon Road, Tubney, Oxfordshore OX13 5QL, UK
8
Centre for Forestry Instrument Standard Assessment, Ministry of Environment and Forestry, Yogyakarta 55582, Indonesia
*
Author to whom correspondence should be addressed.
Forests 2022, 13(7), 1057; https://doi.org/10.3390/f13071057
Submission received: 12 May 2022 / Revised: 22 June 2022 / Accepted: 24 June 2022 / Published: 5 July 2022
(This article belongs to the Special Issue Biomass Estimation and Carbon Stocks in Forest Ecosystems)

Abstract

:
Reliable data on CO2 quantification is increasingly important to quantify the climate benefits of forest landscape restoration and international commitments, such as the Warsaw REDD+ Framework and Nationally Determined Contributions under the Paris Agreement. Calophyllum inophyllum L. (nyamplung as a local name or tamanu tree for the commercial name) is an increasingly popular tree species in forest landscape restoration and bioenergy production for a variety of reasons. In this paper, we present allometric equations for aboveground biomass (AGB), belowground biomass (BGB), and total above- and belowground biomass (TABGB) predictions of C. inophyllum L. Data collection was carried out twice (2017 and 2021) from 40 trees in Java, Indonesia. Allometric equations using the natural logarithm of diameter at breast height (lnDBH) and ln height (lnH) for biomass prediction qualified the model’s fit with statistical significance at 95% of the confidence interval for AGB, BGB, and TABGB predictions. The results showed that the linear models using both lnDBH and lnH were well fit and accurate. However, the model with lnDBH is more precise than the model using lnH. Using lnDBH as a predictor, the R2 values were 0.923, 0.945, and 0.932, and MAPE were 24.7, 37.0, and 25.8 for AGB, BGB, and TABGB, respectively. Using lnH as a predictor, the R2 values were 0.887, 0.918, and 0.898 and MAPE were 37.4, 49.0, and 39.8 for AGB, BGB, and TABGB, respectively. Consequently, the driven allometric equations can help accurate biomass quantification for carbon-trading schemes of C. inophyllum L.

1. Introduction

Forests are one of the essential ecosystems acting as a carbon sink, therefore, deforestation and forest degradation have long become a global concern. Rehabilitative activities such as afforestation, reforestation, and wetland re-wetting have been accepted as removal activities to increase carbon sequestration from the atmosphere. In this regard, the implementation of reforestation and afforestation in degraded lands should account for CO2 reduction outcomes for international commitments. Accurate CO2 emissions by sources and removals by sinks are essential for measuring, reporting, and verifying (MRV) the Warsaw REDD+ Framework [1,2,3] and for implementing Nationally Determined Contributions (NDC) under the Paris Agreement [4,5].
Organic carbon in trees is stored as biomass. Although the amount of carbon in tree biomass may vary from one species to another, it is assumed that 50% dry weight of biomass consists of organic carbon [6,7]. An accurate estimation of carbon stock or biomass is obtained by a destructive method, harvesting and weighing the trees [6,8]; however, this method destroys the tree and is time-consuming and expensive [5,9,10]. An alternative method is the use of allometric equations. An allometric equation is constructed by developing a relationship between the amount of biomass or carbon from the destructive sampling and forest parameters, such as diameter at breast height (DBH), tree height, and wood density [11,12,13,14,15].
Studies of biomass or forest carbon stock are commonly focused on aboveground biomass (AGB) [1,8,16,17,18] with few exploring belowground biomass (BGB) due to difficulties in measuring the biomass of root systems [7,19]. It is labor-intensive, requiring excavation of the entire root system [20,21]. The root system provides a significant amount to the TABGB because some of the carbon resulting from the photosynthesis process is distributed to the root [22], and it is an essential element in the terrestrial carbon balance [15,23]. The root system stores a considerable amount of carbon. Globally each year, fine root systems perform 33% of net primary productivity (NPP) [24]. In a broadleaf deciduous forest in a tropical region, the percentage of roots to the total aboveground biomass (TAGB) was 34% [25].
The BGB results presented in this paper were obtained by direct measurement through digging. Although this method is labor-intensive and costly, direct harvesting produces high accuracy [23]. This method may also destroy the environment surrounding the trees owing to the extent of the root system from the standing tree [26]. To avoid the destruction of the environment, developing an allometric equation for BGB prediction is the right choice, as shown by several researchers [19,27,28]. Once an allometric equation is built, it can be applied to predict biomass in other places with similar plant characteristics.
Various allometric equations have been developed for biomass prediction. The equations can be general or specific for a certain species or local purposes. Reviews of allometric equations for biomass prediction have been conducted to improve the accuracy of prediction or to develop software, such as the GlobAllomeTree, an international online platform that provides access to a tree allometric database [27]. However, there are limited data for biofuel plants, although these biofuel plants play important roles in reducing CO2 by carbon sequestration and through the utilization of biofuel products for replacing fossil fuels. Meanwhile, the development of allometric equations for biofuel plants is essential because an allometric equation of biomass can be used to predict the amount of carbon sequestered by plants. Therefore, developing allometric equations for predicting biomass or carbon stock supports the Government of Indonesia in achieving its NDC. Equations can be used to calculate increment or decrement of carbon stock. In the NDC, the Government committed to reduce GHG emissions by 29% independently and 41% with international support compared to business as usual (BaU) emissions within 2020–2030 [28]. For adaptation, one of the key programs is the utilization of degraded land for renewable energy through rehabilitation using species that produce energy and research and development to support biomass energy plantations and bioenergy industries [28].
Based on the reviewed literature, only a few allometric equations of biofuel plants have been developed [29,30,31,32]. An allometric equation of Jatropha curcas L. was developed that showed the basal diameter of the trees is a suitable predictor for estimating total AGB in Burkina Faso [29]. Using 39 tree samples, allometric equations for biomass estimation of J. curcas L. were developed in Senegal’s Peanut Basin, and they produced high adjusted R2 (0.97 to 0.98) [30]. Meanwhile, Rao et al. [32] constructed allometric models to predict the total standing biomass of Pongamia pinnata L. This study has revealed that collar diameter is the most suitable predictor for total standing biomass.
Among these numerous specific allometric equations, it is hard to find an allometric equation for Calophyllum sp. Only one published paper presented allometric equations using Calophyllum elatum Bedd. [33]. Meanwhile, C. inophyllum L. has the potential to produce biofuel [34], and it can also be used to rehabilitate degraded lands. Hence, it is in line with the NDC program of the Government. Owing to the absence of an allometric equation to predict the biomass carbon stock of Calophyllum sp., the importance of measuring root biomass as a carbon sink, and to support the NDC program, a study was conducted with the purpose of developing allometric equations to predict the AGB, BGB, and TABG of C. inophyllum L.

2. Materials and Methods

2.1. Study Area

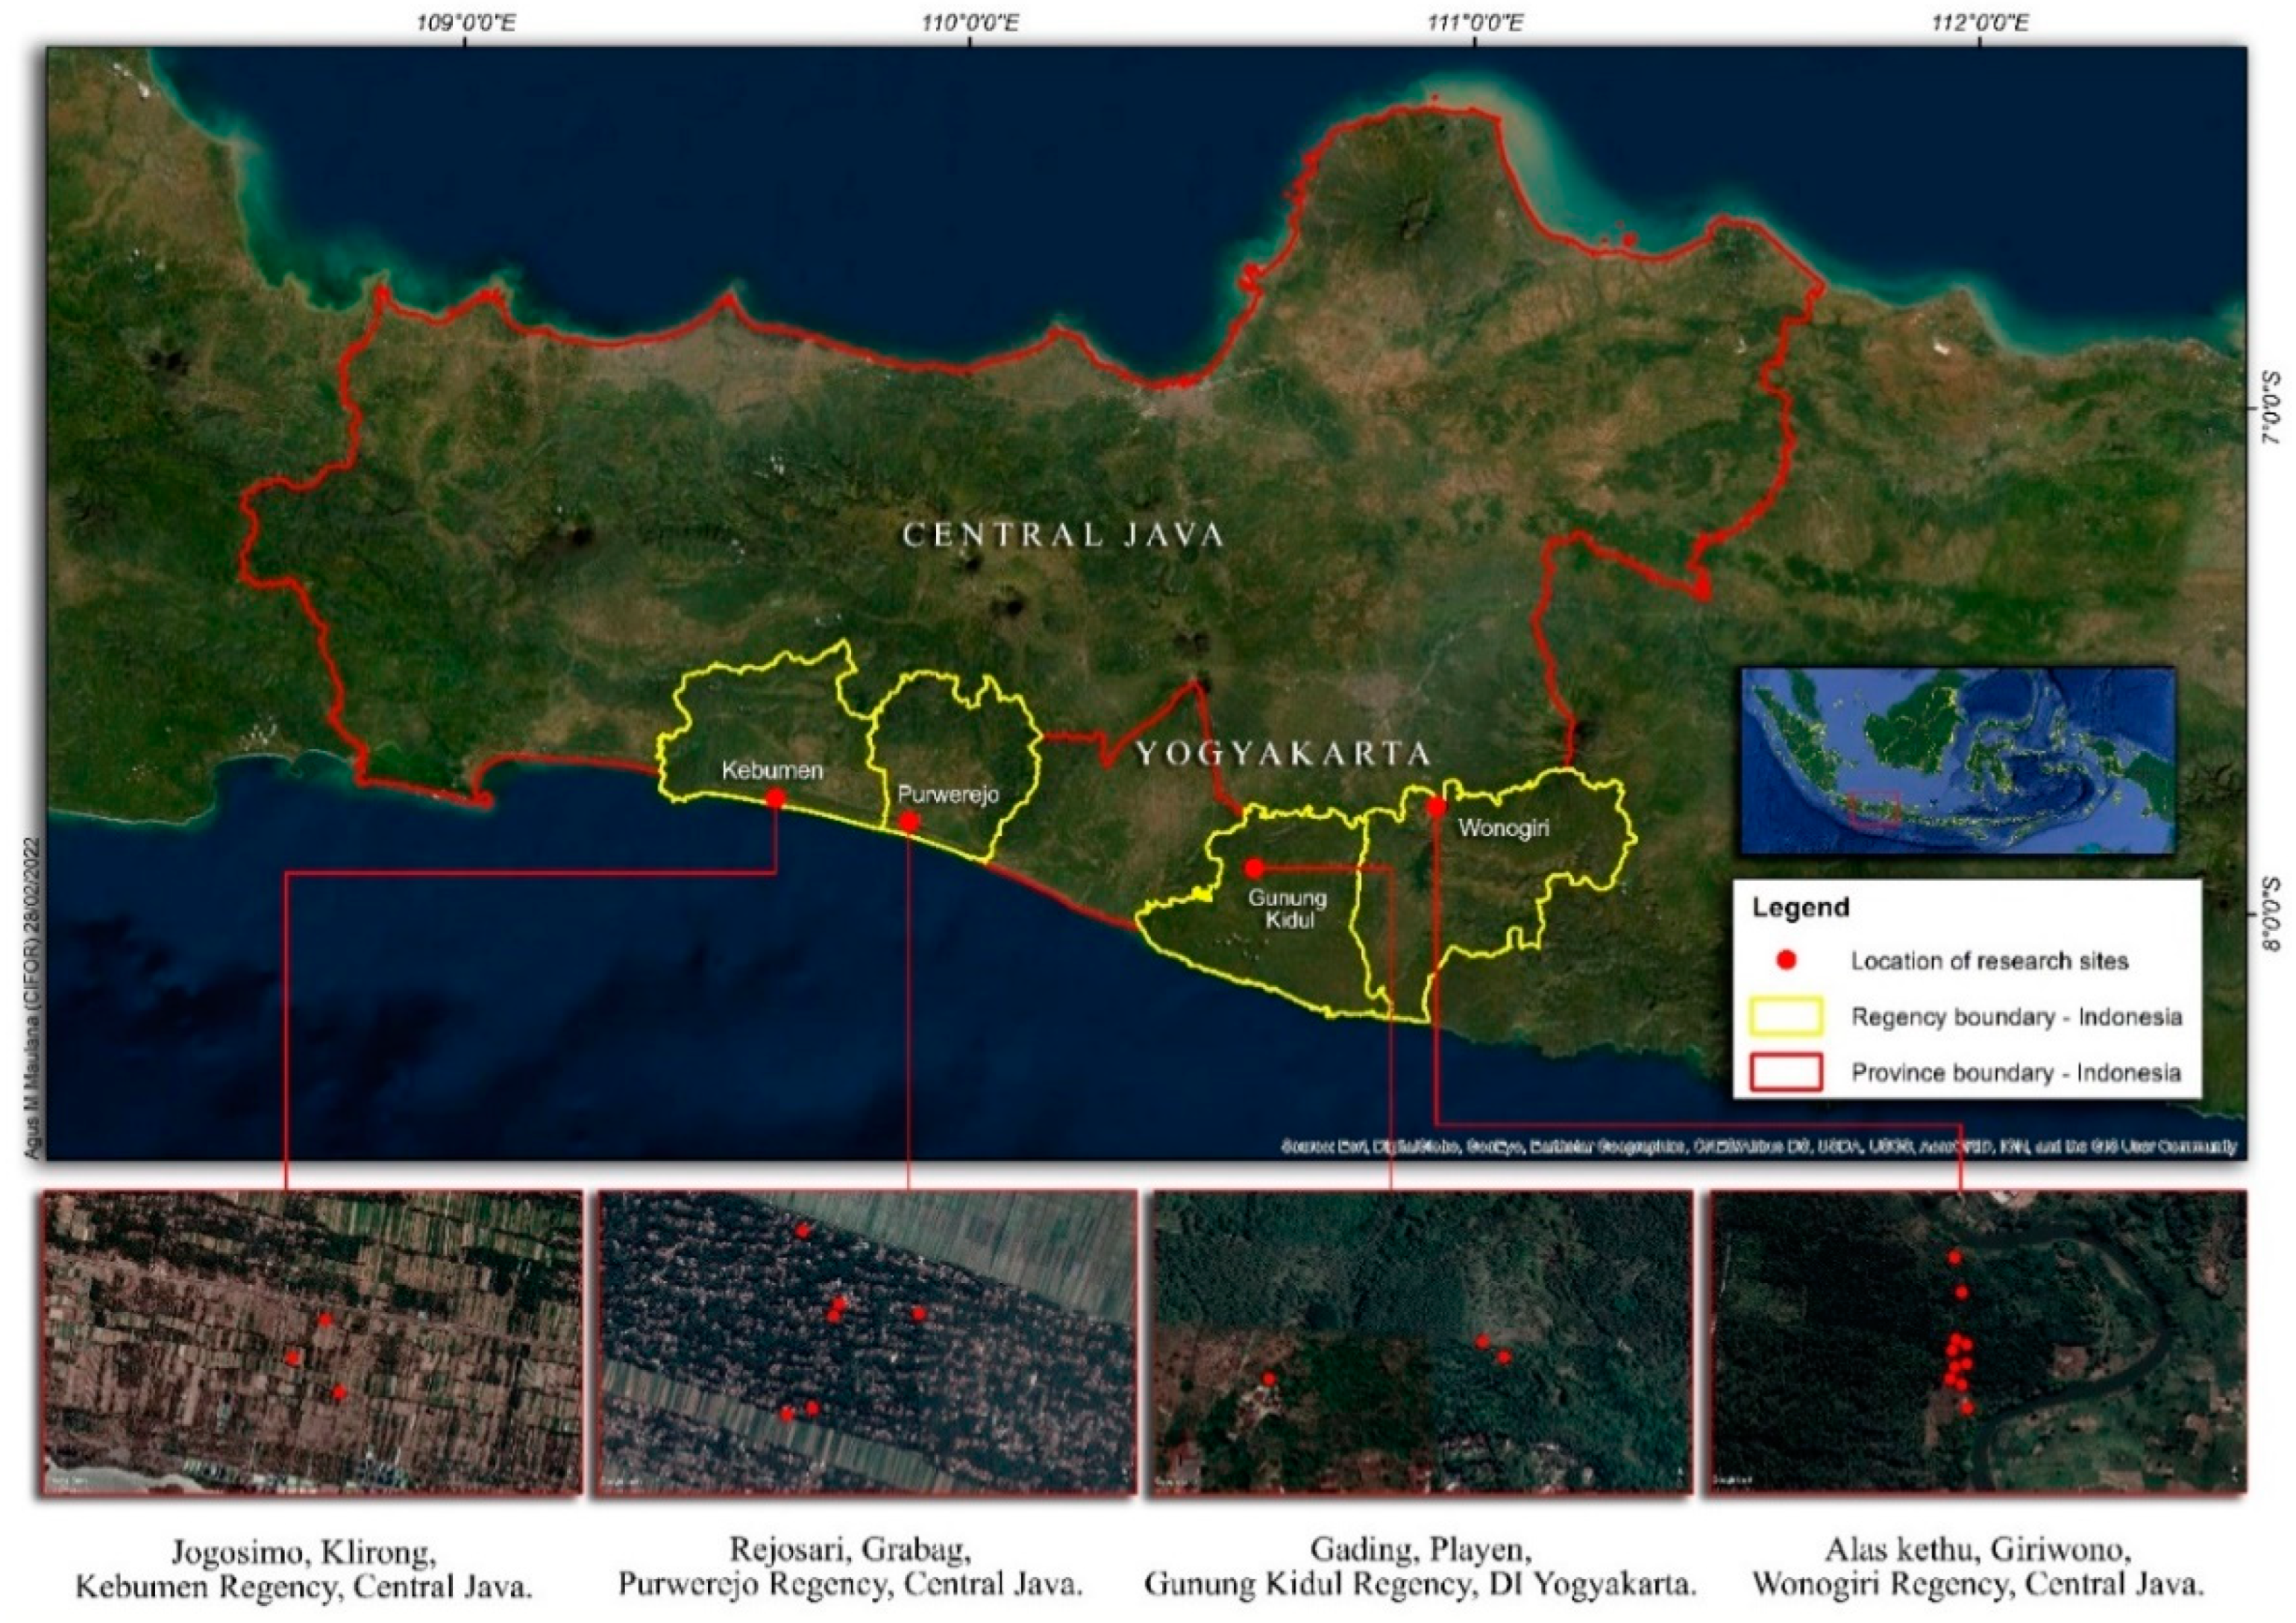
The study was conducted in Wonogiri, Purworejo, and Kebumen regencies in Central Java Province and in Gunung Kidul Regency in the Special District (Daerah Istimewa) of Yogyakarta. A map of the study areas is provided in Figure 1, and the description of each study area is presented in Table 1.

2.2. Tree Selection and Sampling

Data collection was carried out twice. The first collection was in July 2017 in Wonogiri. The second collection was in October 2021 in Wonogiri, Gunung Kidul, Purworejo, and Kebumen. The number of tree samples was 29 from Wonogiri, 3 from Gunung Kidul, 6 from Purworejo, and 2 from Kebumen regencies. To obtain sample trees from small to large DBH, a purposive sampling was used to select the trees. The number of tree samples from every study area was different because in the Wonogiri study area the trees were of the same age so differences in DBH were small, on the other hand, developing allometric equations needs large DBH ranges. To obtain larger DBH, tree samplings were conducted in the other study areas from the local communities, however, only a few tree samples were obtained for destructive sampling. The C. inophyllum L. plants belonging to the local communities were grown naturally and unintentionally planted. The ages and the planting spacings were not known.
The sample trees in the Wonogiri study site commonly had two or three branches less than one (1) meter from the ground. In this case, the stem with the biggest DBH was considered the trunk (the main stem). The sample trees outside the Wonogiri study area mostly had branches more than two (2) meters above the ground. The DBH and the total height of the sample trees were measured before and after cutting the trees.
The tree sampling was based on the Korea Forest Research Institute [35], Basuki et al. [6], Ketterings et al. [8], and adapted to the tree condition. The tree samples were partitioned into the main stem (trunk), big branches (diameter > 6 cm), small branches (diameter 3–6 cm), twigs (diameter < 3 cm), leaves, stump (tree stem 20 cm above the ground), and roots. The tree was cut to a remaining 20 cm stump above the ground and the trunk was cut for every 2 m length or adjusted to the tree condition [35]. The roots’ grooves surrounding the stump were traced. All of the roots were dug manually. Most of the roots were big; fine roots were rarely found. The length of a root can reach 4.2 m from the center of the tree with a diameter of the root of 42 cm for a tree with a DBH of 74 cm.
The fresh weight of the whole tree was measured in the field. Owing to the differences in tree sizes and components, the scales for weighing the tree components were different. The capacity of the scales to weigh the fresh weight of the trunk and the root was 100–200 kg for the study sites of Wonogiri and Gunung Kidul, 400 kg for Purworejo, and 400–8000 kg for Kebumen. The stump, branches, twigs, and leaves were weighed using scales with a capacity of 50–100 kg. An electric scale with a capacity of 5 kg was used to weigh the fruit, flower, and tree samples for laboratory analysis.
The samples of the trunk and the branches were taken from the base, middle, and tip of each component. These samples were taken following a disc shape with a thickness of approximately 5 cm or depended on the tree condition. For the small branches, twigs, and leaves, the samples were at least 250 g. The samples of flowers and fruits were 250 g or depended on their availability. Each of the samples was weighed and marked. Three samples were taken from each tree component and stored in plastic bags for laboratory analysis.
The samples were used to analyze the moisture content and to calculate the dry weight. The samples were dried at a temperature of 85 °C in an oven until they reached constant weight. All these activities were conducted in the CIFOR laboratory. The dry weight of the tree components was calculated using Equation (1). The total dry weight of a tree was the sum of the dry weight of each tree component, which are roots, stump, trunk, big and small branches, twigs, leaves, and flowers and fruits, if any.
DW   tree   component = FW   component   ×   DW FW   of   corresponding   samples
where DW = dry weight; FW = Fresh weight.

2.3. Determining the Age of the Tree Samples

The age of the tree samples was determined using the simplest approach as explained by Worbes et al., [36]. This method was also used by Köhl for analyzing tree age in a tropical forest in Suriname [37]. The tree ring analysis to determine the age was conducted for the samples without information of the planting time (Gunung Kidul, Purworejo, and Kebumen study areas). After drying the stem discs as mentioned above, the samples were polished with a sanding machine to get the visibility of the ring zone. The number of rings was calculated using a Leica M50 binocular microscope (Leica, Wetzal, Germany) and a camera at the magnifying level of 6.3. The result of the analysis is presented in Table 2.

2.4. Data Analysis

The allometric model was first developed using ln(DBH) as a predictor variable; later, the ln(H) was also used as a single predictor variable to predict the biomass (AGB, BGB, and TABGB). The total height was used instead of the bole height because of differences in the tree architecture in Wonogiri from the other study sites. The majority of the trees in Wonogiri had big branches less than one (1) meter from the ground, therefore, the bole height was very short.
At the first and the second fieldwork, only 40 suitable sample trees were obtained for developing allometric equations. These data were divided into two groups. The first group consisted of 30 sample trees and these were used to develop the allometric models. This division was based on the research finding that revealed that the ideal proportion between data for model development and data for validation was 70/30 [38]. However, due to data limitation, we used a 30/10 ratio. The second group was composed of 10 sample trees for validation of the developed models. This validation is known as a true validation method [4]. In this regard, the data for validation was not used for model development. We preferred this validation model because in reality the developed model will be used to predict data outside the study area, so the data will be totally different from the data for developing the model.
The analyses were conducted on the AGB, BGB, and TABGB. The dependent variable was tree biomass and the independent variables were DBH and the total H of the sample trees. Before constructing the allometric equations, the data were graphed using scatter plots to observe the relationship between the independent and the dependent variables. In this research, the allometric equations for the tree components were not analyzed because in NDC, REDD+, and carbon trading, the total amount of carbon is used instead of carbon in tree components.
The allometric equations were performed in natural logarithmic transformation because the transformation corrects data for heteroscedasticity [39]. The presence of heteroscedasticity can be identified by plotting the residual on the y-axis vs. the predicted values in the x-axis. If the scatter plot does not show any pattern, it means the data are free from heteroscedasticity and vice versa. With this transformation, the variances of the entire data were synchronized to meet the prerequisite of the linear regression [40]. Although the transformation qualifies for linear regression analysis, it needs a correction factor (CF) to back-transform the biomass calculation [40,41]. The CF was calculated using Equation (2).
CF = exp ( SEE 2 2 )
SEE = Standard Error of the Estimation
SEE = [ Log   Y i Log   Ŷ i N 2 ] 2
where Ln Yi = natural log the measured dry weight of the biomass; Ln Ŷi = natural log the predicted dry weight of the biomass; N = the number of tree samples.
The allometric models using ln(DBH) and ln(H) are not integrated as independent variables because these variables have a significant Pearson correlation at a 95% confidence interval. The p-value (2-tailed) is 0.000. In addition to this high correlation, ln (DBH) and ln(H) have a high Variance Inflation Factor (VIF), which is 12.8. The VIF value of more than 5 (five) shows collinearity between DBH and H. Consequently, the equations are not suitable for biomass prediction.
Validation was carried out after the allometric equations were performed. The equations based on ln(DBH) and ln(H) were applied to the 10 independent data separated from the collected 40 tree samples. The CF for every equation was applied after the data were back-transformed. The accuracy of the allometric models was evaluated using the coefficient of determination (R2), the slope of the regression, mean absolute percentage error (MAPE), Paired t-test, Confidence Interval (CI) [6], and 1:1 line [42,43].
MAPE = 100 n   i = 1 n | M p M o M o |
where n = the number of tree samples; Mp = Predicted biomass; Mo = Observed biomass.

3. Results

3.1. Characteristics of the Tree Samples for Developing Allometric Equations

Characteristics and dry weight of the sample trees for developing allometric equations are presented in Table 3. On average, the comparison of biomass stored in the root (BGB) to that stored aboveground (AGB) of the trees was 18:82%.

3.2. Model Comparison and Validation

The developed allometric equations are presented in Table 4. The constant or ln (c) values of the allometric equations predicted by ln(DBH) are statistically significant at 95% of confidence interval with p = 0.009 (**), p = 0.000(***), and p = 0.011(**) for AGB, BGB, and TABGB, respectively. Using ln(H) as the predictor variable, all of the biomass equations have constant values highly significant at 95% of the confidence interval with p = 0.000 (***). Using ln(DBH) or ln(H) as a single predictor, the ᾳ (slope of the equation) values are significant at 95% of confidence interval with p = 0.000 (***) for all AGB, BGB, and TABGB, respectively.
The CF used for back-transforming of the natural logarithmic values of AGB and TABGB predicted by ln(DBH) are similar, the highest CF is for back-transforming BGB. Using ln(H) as the predictor for the biomass, the CF values are also similar, as presented in Table 4. Those CF values are closer to 1.
Table 5 shows the characteristics of the dry weight biomass of 10 destructive tree samples for validation. These validation data were randomly taken from the available data with the caution that the DBH is not larger than the DBH or H for data for constructing the allometric model.
Calculations of mean bias by using 10 independent data for validation are presented in Table 6. The MAPE values from the allometric equations using ln(DBH) as an independent variable are lower than that using ln(H). Among the components of the trees, the highest bias of the predictions is found in the root prediction (BGB).
The Paired t-test differences between the measured and the predicted are presented in Table 7. The 95% of CI of the mean from various allometric models is provided in Table 8. The bias of the prediction can also be examined from the scatter plot biomass values of the measured and the predicted, as graphed in Figure 2.

4. Discussion

In general, most of the biomass is located in the trunk, therefore, the increase in DBH increases the AGB and TABGB [6]. In contrast, the increase in DBH decreases the foliage biomass, which consists of leaves and twigs. This result is in line with research conducted in the Mediterranean on Phillyrea latifolia L., the foliage of which contributes 15% of the AGB [19]. This result is slightly lower than that in the current study, which is 17%.
The dry weight of the BGB in this study is 2.6 kg/tree to 730.7 kg/tree. In comparison, Huynh et al. [44] found the amount of BGB of Corymbia citriodora subspecies variegate (spotted gum) varied from 11.2 to 70.2 kg/tree and from 64.4 to 387.6 kg/tree, respectively, for 9- and 20-year-old trees in Australia. The comparison of the BGB to AGB was 18%. This value is similar to the research conducted in a lowland primary dipterocarp forest in the Pasoh Forest Reserve, Peninsular Malaysia [45]. Meanwhile, the average Pinus pinaster (Ait.) stores 20% of its biomass in the stump and root system, based on a study in Southwestern France [46]; and, for J. curcas L., the ratio between BGB to AGB was 26% for 5-year-old plants [31].
Allometric equations using ln(DBH) and ln(H) for biomass prediction of C. inophyllum L. have qualified the model’s goodness of fit, statistically significant at 95% of the confidence interval for AGB, BGB, and TABGB predictions. The significant values of the regression coefficients are essential since these determine the accuracy of the prediction. When the coefficient of the regression is significant, the changes in the independent variable will significantly change the predicted biomass according to the equation. Although the ln(DBH) and ln(H) can be used to predict the C. inophyllum L. biomass, the MAPE values of the ln(H) are higher than those of ln(DBH), therefore, in this case, the ln(DBH) is a better predictor than ln(H). In addition, the R2 of the allometric models developed using ln(DBH) are higher than those using ln(H), therefore, the standard error of the estimation of allometric models using ln(DBH) is lower than those of ln(H) (Table 4).
The biomass prediction using ln(DBH) as a single independent variable produces a high R2, consequently, adding ln(H) to the allometric model only slightly increases R2, which is in line with the previous study carried out by Basuki et al. [6]. Using ln(DBH) as a single variable to predict AGB, BGB, and TABGB produces R2 of 0.923; 0.945; and 0.932, respectively. Incorporating ln(H) to ln(DBH) for the prediction of ABG, BGB, and TABGB slightly increases R2 to 0.926; 0.952; and 0.935, respectively. However, the standard error of the regression coefficient increases or even the coefficient of (ln(H)) is not significant. Using ln(H) as a single variable to predict AGB, BGB, and TABGB produces ᾳ (the regression coefficient) values of 3.095, 3.533, and 3.154, respectively. Incorporating ln(H) to ln(DBH) for AGB, BGB, and TABGB prediction produces a coefficient of ln(H) of 0.857, 1.206, and 0.906, respectively. Similar results were also produced from a previous study in the prediction of biomass in secondary forests in the Amazon [47] and subtropical forests in Guangzhou, Southern China [48].
The relatively high MAPE values may relate to the number of sample trees. The lack of big sample trees will cause an increase in bias. Applying allometric equations constructed from small sample sizes will cause bias until 70%, with standard deviation varying from −4% to +193% [13]. Therefore, additional large tree samples may increase the accuracy of biomass prediction. As a comparison, a study undertaken in evergreen broadleaf forests in Vietnam showed that an allometric model that used DBH as an independent variable produced a MAPE of 30%, and incorporating H in the prediction could reduce MAPE to 27.4–28% [49].
In addition to the above explanation, the high MAPE values can be caused by different human interventions and biophysical conditions in the study areas. In Wonogiri, the study area is located in the demonstration plot of the Center for Biotechnology Research and Development and Forest Plant Breeding, the planting spacing is regular, and the C. inophyllum L. plants more maintained. The stands in these plots mostly have big branches less than one (1) meter from the ground that are intended to produce more branches and fruits for biofuel. Unlike C. inophyllum L. in Wonogiri, the C. inophyllum L. in the other study areas grew naturally, without maintenance, and freely competed with other plants. The soil in the Gunung Kidul study area was shallow and derived from limestone, whereas in the other study areas, the soils were deep and from sediment deposits. Besides these factors, rainfall differences were also high. In the Wonogiri study area, the mean annual rainfall was less than 2000 mm/year; in Gunung Kidul it was around 2200 mm/year; and the highest was in the Purworejo and the Kebumen study areas with annual rainfall more than 3000 mm/year. All of these factors highly influence the growth of C. inophyllum L., and they cause high variations in the increase in biomass and the increase in DBH and H. Consequently, when allometric equations are applied to the independent data, the MAPE is high. However, the statistical analysis shows that the measured and the predicted biomass are not significantly different. This means the allometric equations are suitable for estimating C. inophyllum L. in other places within the diameter range used for developing the applied equations. Observing the 95% CI of the mean presented in Table 7 shows that the prediction of BGB and TABGB using ln(DBH) are within the range of the measured values, except the minimum value of the predicted AGB, which is lower than that of the measured. However, for the 95% CI predicted using ln(H), all of the minimum values of AGB, BGB, and TABG are far lower than that of the measured. This is another indication that ln(DBH) is a better predictor than ln(H) in the current study.
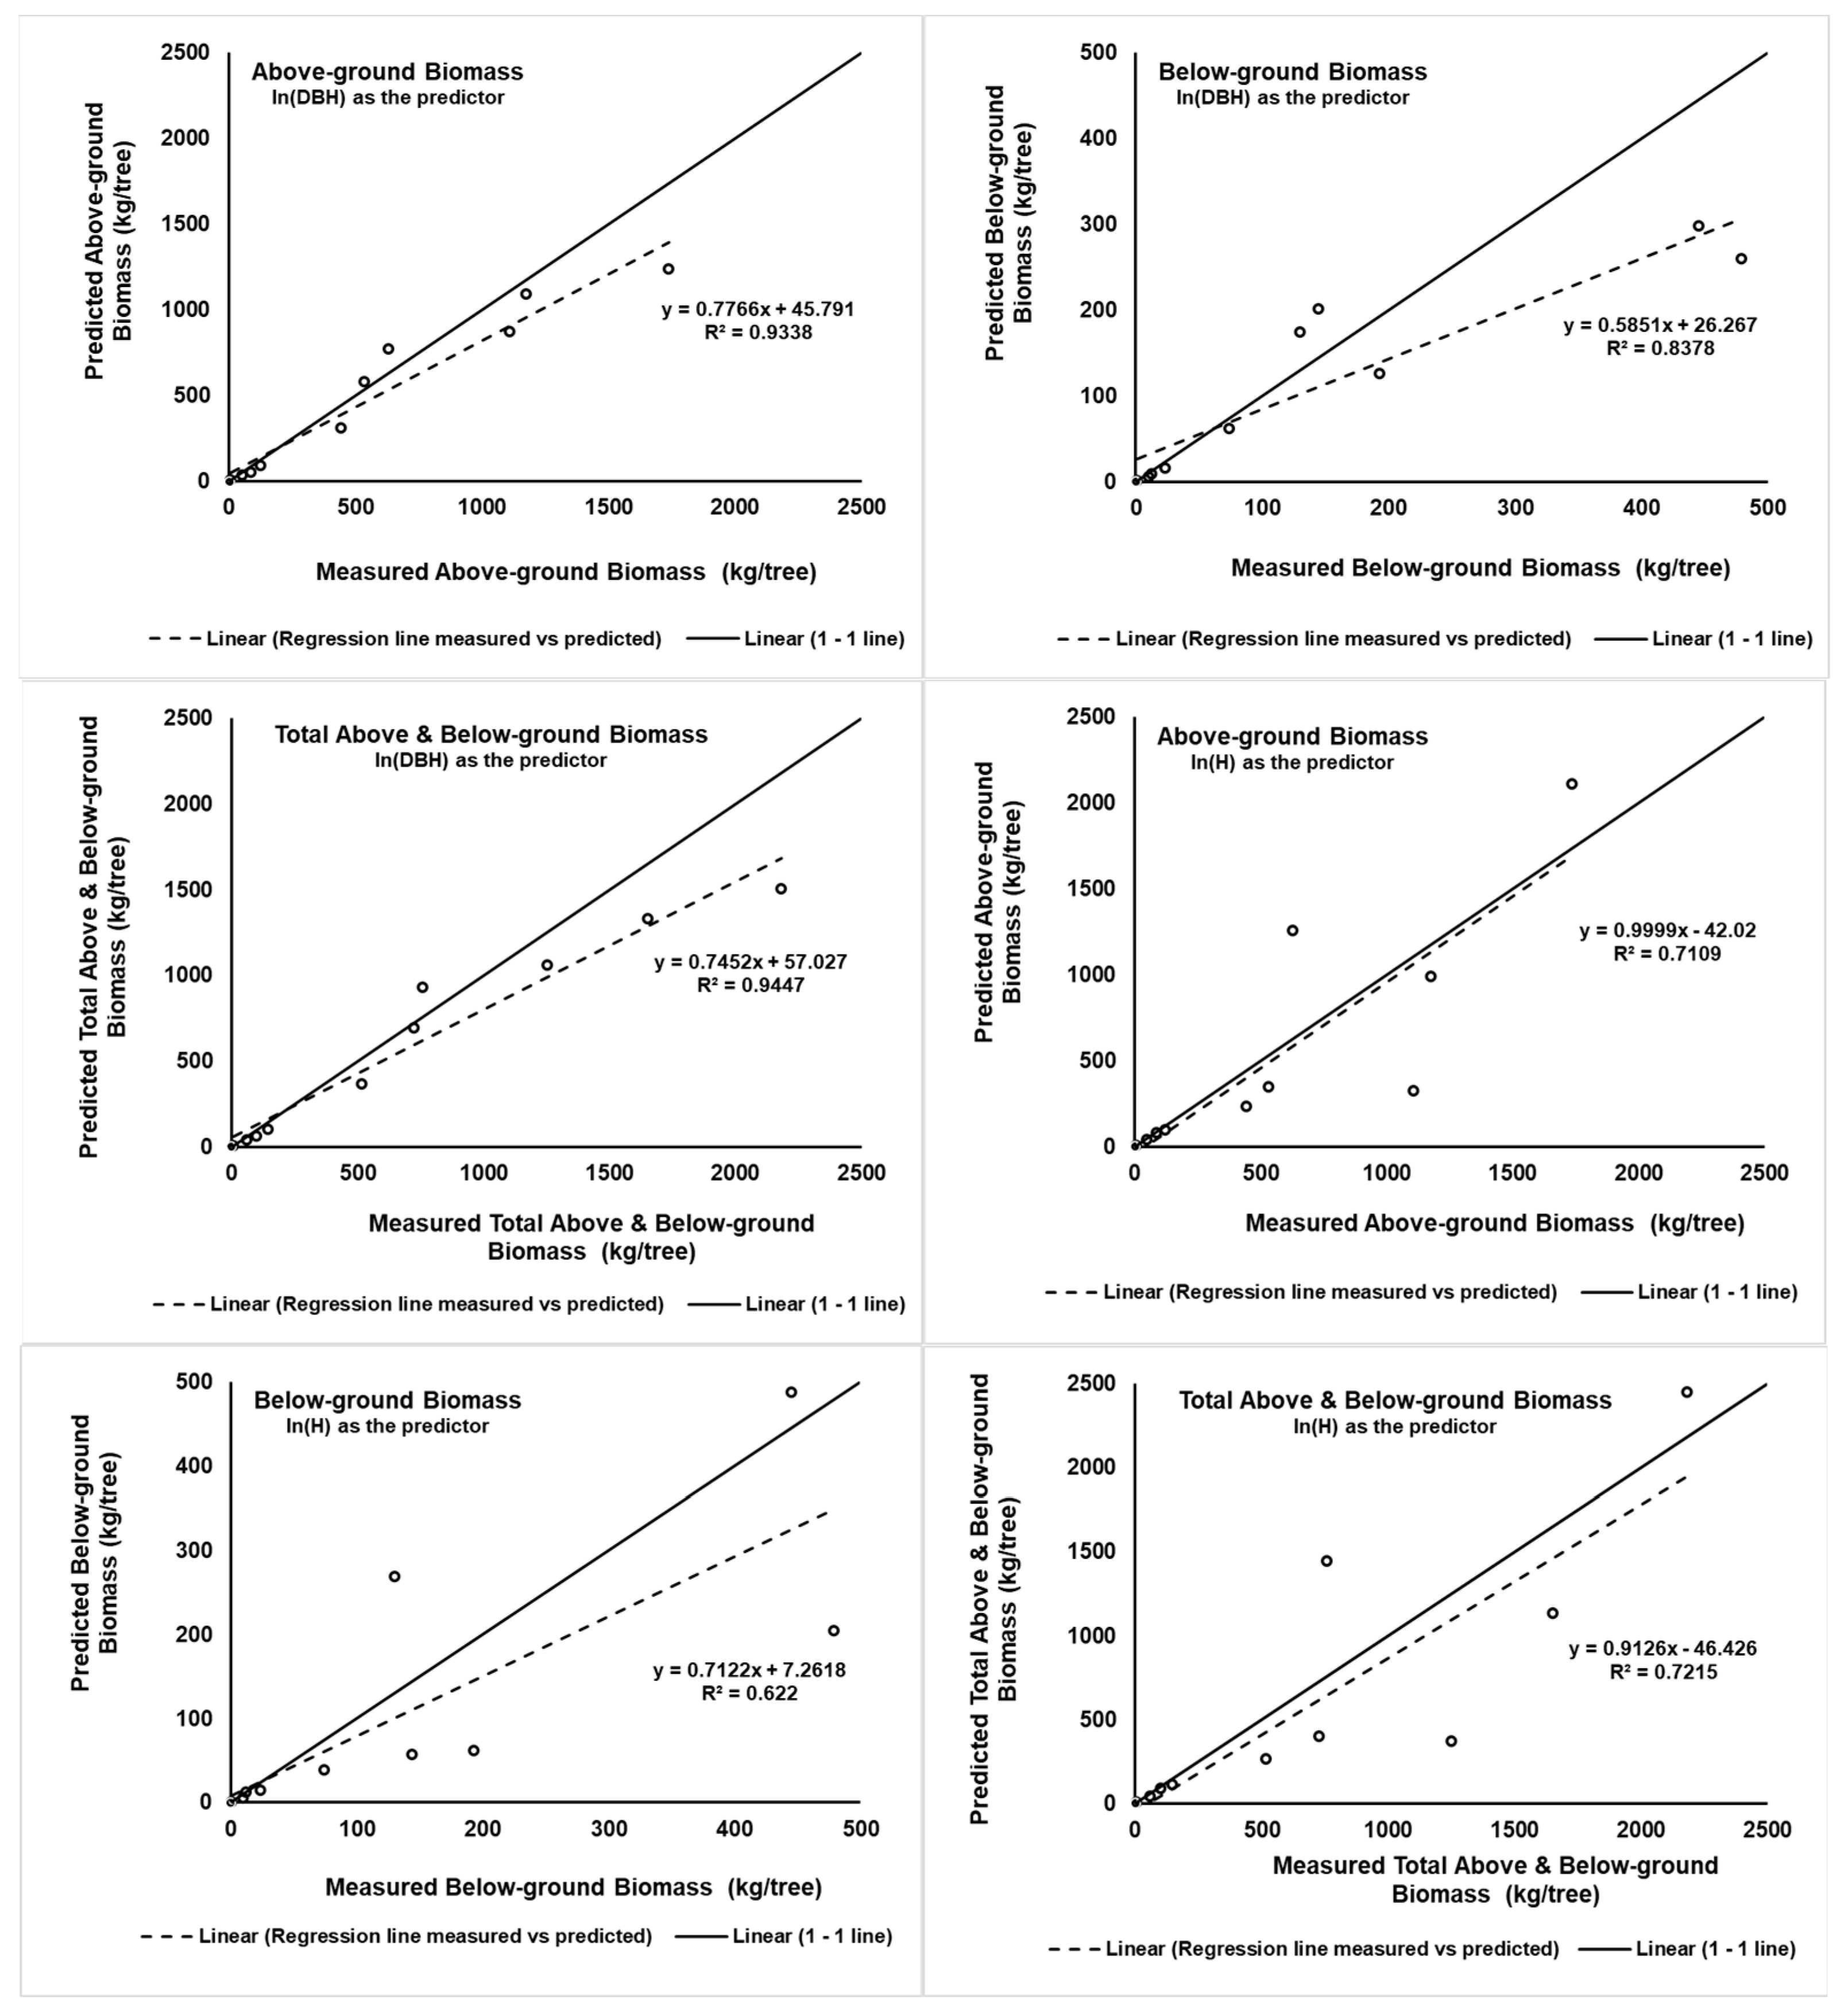
The 1:1 line shown in Figure 2 indicates that the closer the values to the 1–1 line, the lower the bias of the prediction. Using ln(DBH) as the predictor shows that the larger the DBH, the lower the prediction of biomass becomes. After the AGB, BGB, and TABGB reach amounts around 630, 144, and 760 kg/tree, the predictions are lower than the line 1:1 (Figure 2). This pattern is different from the pattern when using ln(H) as the predictor. The prediction of the AGB, BGB, and TABGB can be lower or higher than the 1:1 line at a high amount of biomass.
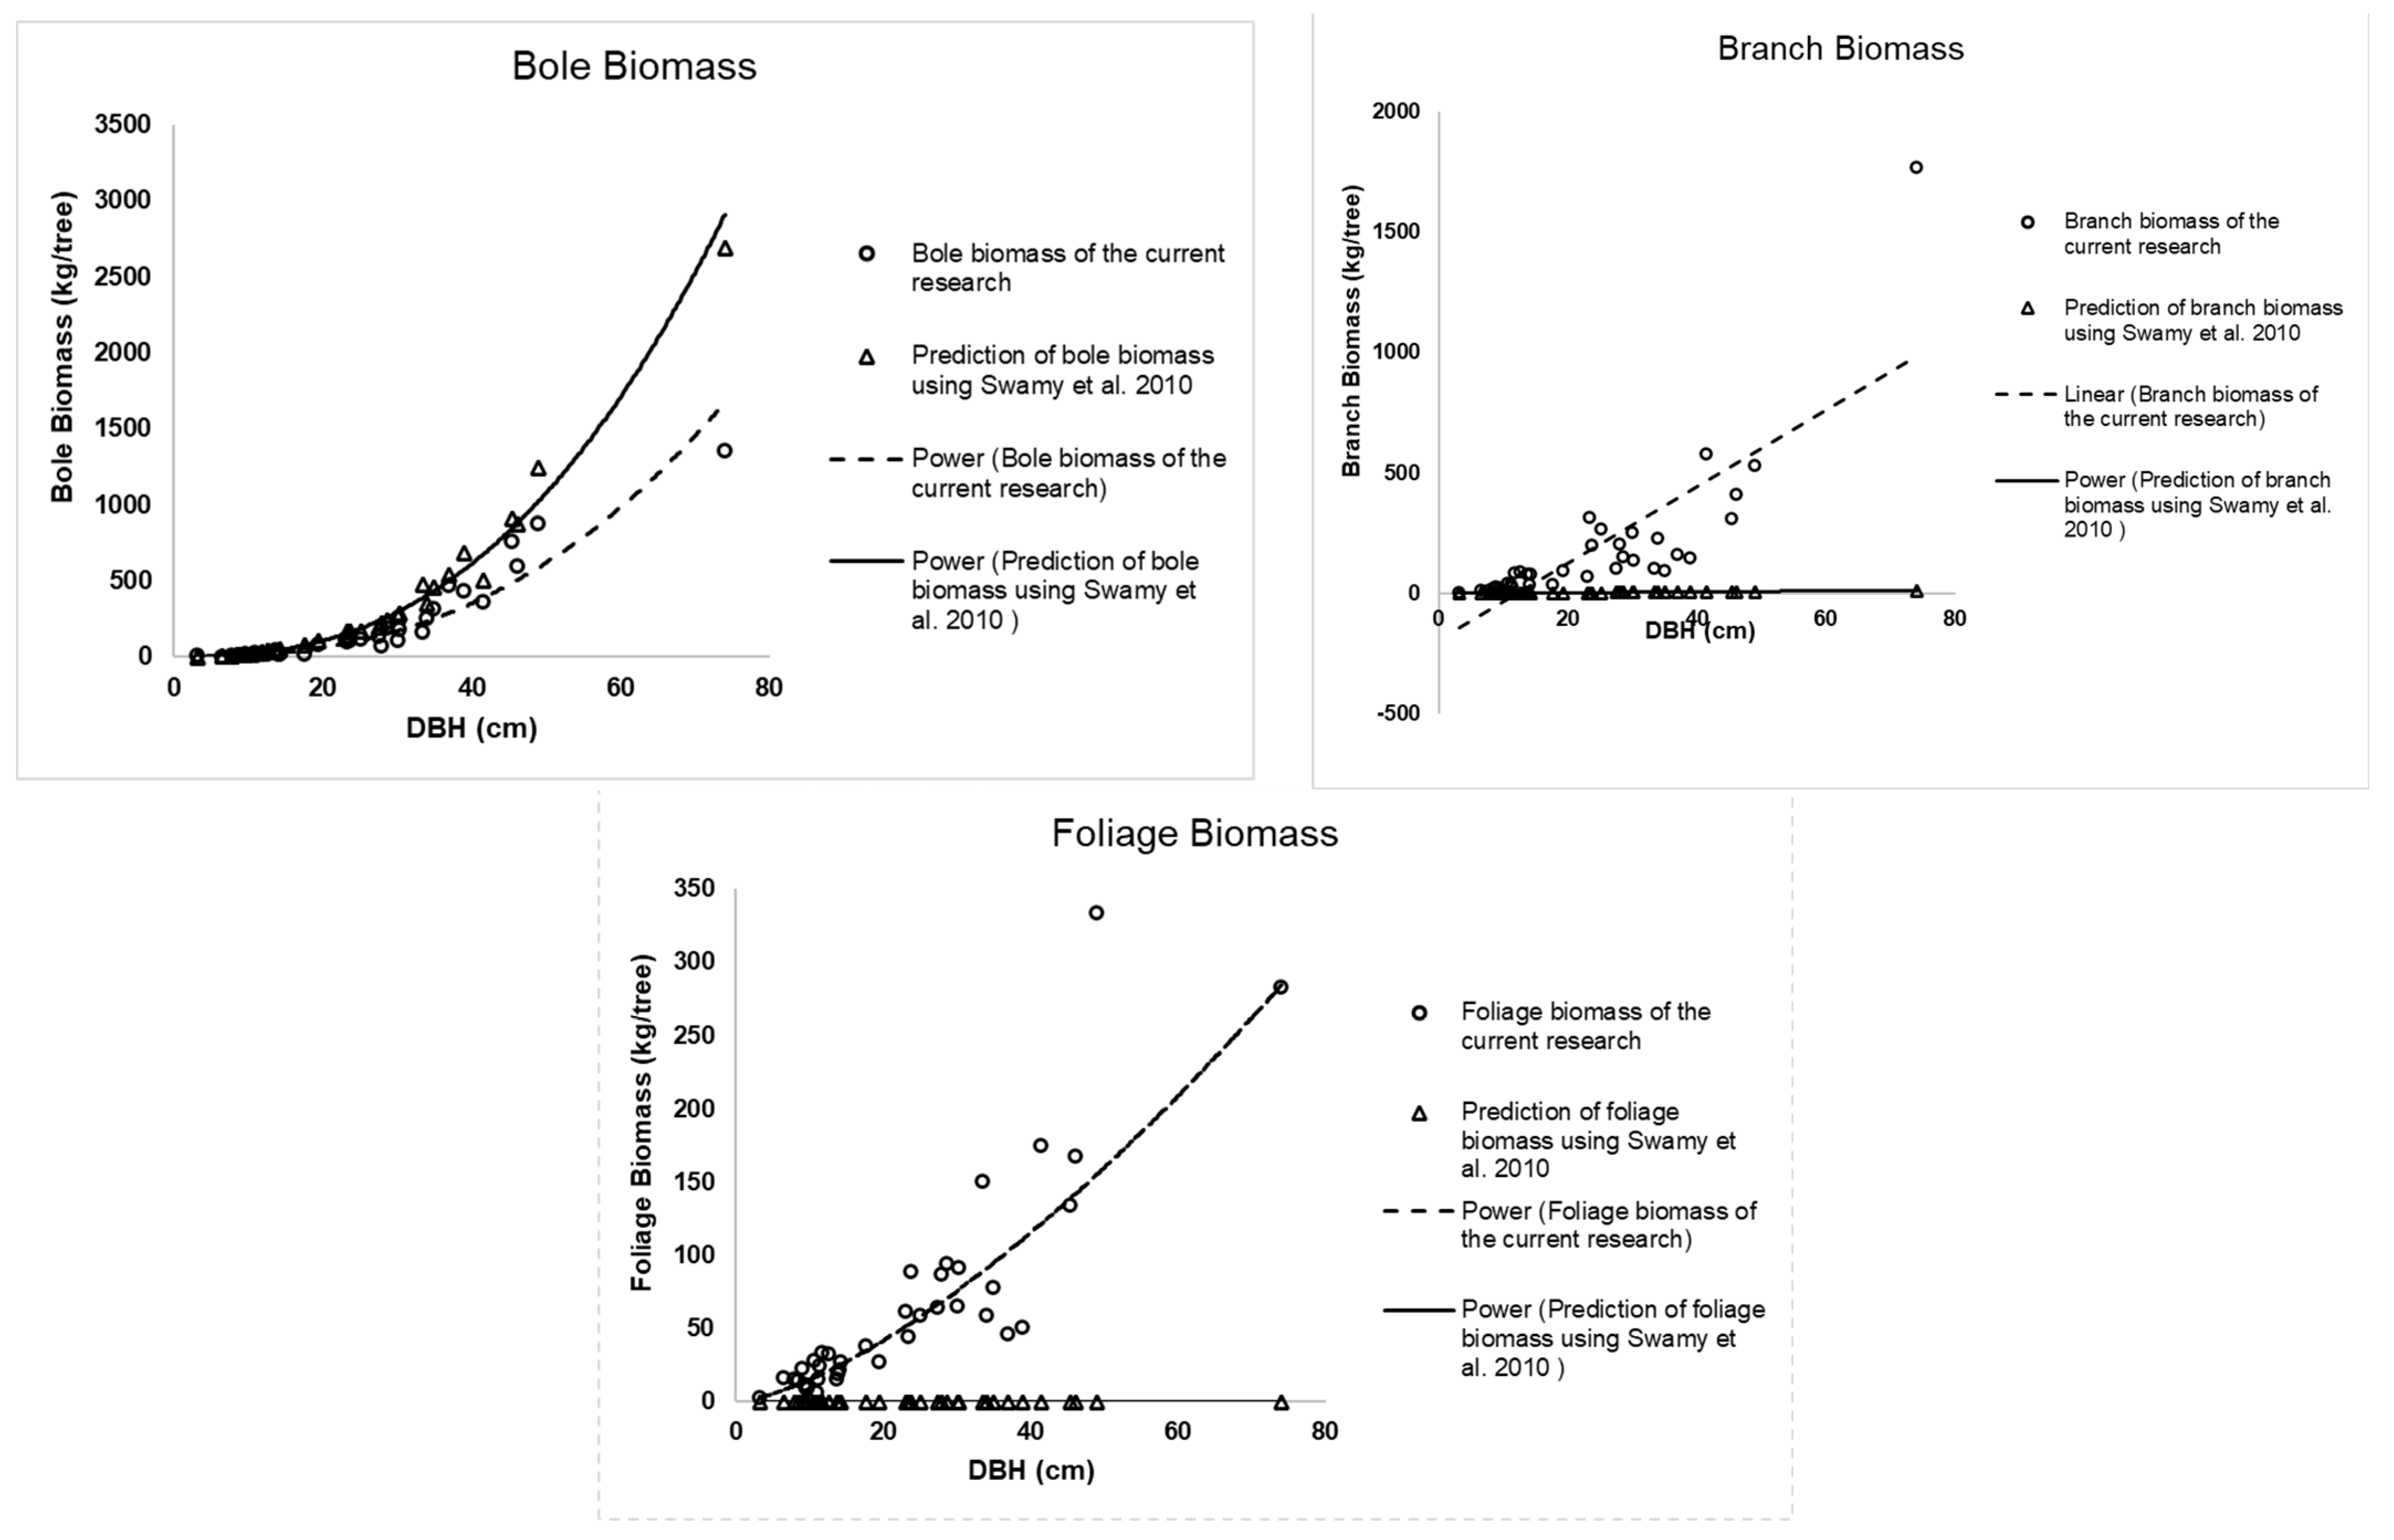
Based on the literature review, so far only one published paper presented allometric equations for Calophyllum sp. In this paper, Swamy et al. [33] presented three allometric equations of bole, branches, and foliage for C. elatum Bedd. As a comparison, those three allometric equations were applied to our data (40 tree samples) that have been used for developing and validating the current allometric equation presented in this paper. The results are presented in Figure 3. The MAPE of boles, branches, and foliages are 91%, 90%, and 99%, respectively. This shows that the applied equations do not fit our data. It may be the different characteristics of the species.
The allometric equations derived from this study can be used to accurately determine AGB and BGB and the carbon storage of C. inophyllum L. trees, particularly for reforestation projects in a similar geographical zone. The use of these site-specific equations is preferred to reduce uncertainty in carbon estimation [15]. The high precision of the allometric equation would satisfy the monitoring requirements of carbon-trading schemes [18,50]. Further, accurate models of carbon gain during reforestation are needed for assessing potential carbon sequestration under different scenarios of land-use change [51]. The developed allometric equations can be applied to measure biomass or carbon stock supporting DNC implementation, especially for developing biofuel plants for rehabilitation of degraded lands.

5. Conclusions

Allometric equations using ln(DBH) and ln(H) for biomass prediction of C. inophyllum L. have qualified the model’s goodness of fit with statistical significance at 95% of the confidence interval for AGB and TABGB predictions. The significant values of the regression coefficients are essential because these determine the accuracy of the prediction. The accuracy is also shown by non-significant differences between the measured and the predicted biomass. In addition, the linear models using both ln(DBH) and ln(H) are well fit and accurate, but the model with ln(DBH) is more precise than the model using ln(H). This is because the allometric equations using ln(DBH) produce higher Adjusted R2 and lower MAPE than allometric equations using ln(H). The models using ln(DBH) as a predictor are ln(AGB) = −0.972 + 2.078 ln(DBH), ln(BGB) = −3.559 + 2.359 ln(DBH), and ln(TABGB) = −0.917 + 2.115 ln(DBH), respectively. The MAPE of BGB is the highest compared to that of AGB and TABGB for biomass prediction using ln(DBH) and ln(H).
Consequently, the driven allometric equations can help accurate biomass or carbon quantification for the implementation of NDC, carbon-trading schemes in tropical forests, and reforestation projects with C. inophyllum L. in similar geographical zones. This research suggests further studies in different regions, including subtropical and temperate climates and with various tree species for biofuel. Moreover, the model should be established based on different plantation practices (monoculture, mixed species, agroforestry, etc.), soil conditions, and interventions (management, trimming, etc.). Policy-makers, project implementors, farmers, and other stakeholders can benefit from a wider range of research into accurate carbon measurement and tree species selection for carbon-pricing initiatives.

Author Contributions

T.M.B., B.L., H.B., S.A., Y.A., E.C., R.K., A.-R.Y. and Y.B.S., discussing the concept and designing each section of the manuscript. T.M.B., B.L., S.A., Y.A., N.S.W., Y.B.S. and E.W. conducting data collection. T.M.B., B.L., S.A. and N.S.W. analyzing the data. T.M.B., B.L., H.B., S.A., N.S.W., Y.A., E.C., S.S., R.K., A.-R.Y., Y.B.S. and E.W. preparing the draft, writing, and reviewing the manuscript. Funding acquisition, E.C., H.B. and Y.A. All authors have read and agreed to the published version of the manuscript.

Funding

This study was funded by the National Institute of Forest Science (NIFoS), Republic of Korea.

Data Availability Statement

Not applicable.

Acknowledgments

This study was supported by a research project of the National Institute of Forest Science. Many thanks and appreciation are also extended to Arif Priyanto, Sudarso, and Didik who helped in the destructive sampling for data collection in the field, and also special thanks to Agus Muhamad Maulana (CIFOR) for drawing the map of the study area.

Conflicts of Interest

The authors declare no conflict of interest.

References

  1. Bareke, T.; Addi, A. Allometric Equation for Aboveground Biomass Estimation of Galiniera Saxifraga (Hochst.) Bridson in Gesha-Sayilem Forest, Southwestern Ethiopia. Asian J. For. 2021, 5, 76–82. [Google Scholar] [CrossRef]
  2. Daba, D.E.; Soromessa, T. The Accuracy of Species-Specific Allometric Equations for Estimating Aboveground Biomass in Tropical Moist Montane Forests: Case Study of Albizia Grandibracteata and Trichilia Dregeana. Carbon Balance Manag. 2019, 14, 18. [Google Scholar] [CrossRef] [PubMed]
  3. Vorster, A.G.; Evangelista, P.H.; Stovall, A.E.L.; Ex, S. Variability and Uncertainty in Forest Biomass Estimates from the Tree to Landscape Scale: The Role of Allometric Equations. Carbon Balance Manag. 2020, 15, 8. [Google Scholar] [CrossRef] [PubMed]
  4. Aguilar, F.J.; Nemmaoui, A.; Peñalver, A.; Rivas, J.R.; Aguilar, M.A. Developing Allometric Equations for Teak Plantations Located in the Coastal Region of Ecuador from Terrestrial Laser Scanning Data. Forests 2019, 10, 1050. [Google Scholar] [CrossRef] [Green Version]
  5. Brahma, B.; Nath, A.J.; Deb, C.; Sileshi, G.W.; Sahoo, U.K.; Kumar Das, A. A Critical Review of Forest Biomass Estimation Equations in India. Trees For. People 2021, 5, 100098. [Google Scholar] [CrossRef]
  6. Basuki, T.M.; van Laake, P.E.; Skidmore, A.K.; Hussin, Y.A. Allometric Equations for Estimating the Above-Ground Biomass in Tropical Lowland Dipterocarp Forests. For. Ecol. Manag. 2009, 257, 1684–1694. [Google Scholar] [CrossRef]
  7. Zhang, Y.; Liang, S.; Yang, L. A Review of Regional and Global Gridded Forest Biomass Datasets. Remote Sens. 2019, 11, 2744. [Google Scholar] [CrossRef] [Green Version]
  8. Ketterings, Q.M.; Coe, R.; van Noordwijk, M.; Ambagau’, Y.; Palm, C.A. Reducing Uncertainty in the Use of Allometric Biomass Equations for Predicting Above-Ground Tree Biomass in Mixed Secondary Forests. For. Ecol. Manag. 2001, 146, 199–209. [Google Scholar] [CrossRef]
  9. Ounban, W.; Puangchit, L.; Diloksumpun, S. Development of General Biomass Allometric Equations for Tectona Grandis Linn.f. and Eucalyptus Camaldulensis Dehnh. Plantations in Thailand. Agric. Nat. Resour. 2016, 50, 48–53. [Google Scholar] [CrossRef] [Green Version]
  10. Widagdo, F.R.A.; Xie, L.; Dong, L.; Li, F. Origin-Based Biomass Allometric Equations, Biomass Partitioning, and Carbon Concentration Variations of Planted and Natural Larix Gmelinii in Northeast China. Glob. Ecol. Conserv. 2020, 23, e01111. [Google Scholar] [CrossRef]
  11. Basuki, T.M. Quantifying Tropical Forest Biomass. Ph.D. Dissertation, Faculty of Geo-Information and Earth Observation, ITC, University of Twente, Enschede, The Netherlands, 2012. [Google Scholar]
  12. Djomo, A.N.; Picard, N.; Fayolle, A.; Henry, M.; Ngomanda, A.; Ploton, P.; McLellan, J.; Saborowski, J.; Adamou, I.; Lejeune, P. Tree Allometry for Estimation of Carbon Stocks in African Tropical Forests. Forestry 2016, 89, 446–455. [Google Scholar] [CrossRef]
  13. Duncanson, L.; Rourke, O.; Dubayah, R. Small Sample Sizes Yield Biased Allometric Equations in Temperate Forests. Sci. Rep. 2015, 5, 17153. [Google Scholar] [CrossRef] [PubMed] [Green Version]
  14. Kuyah, S.; Dietz, J.; Muthuri, C.; Jamnadass, R.; Mwangi, P.; Coe, R.; Neufeldt, H. Allometric Equations for Estimating Biomass in Agricultural Landscapes: I. Aboveground Biomass. Agric. Ecosyst. Environ. 2012, 158, 216–224. [Google Scholar] [CrossRef]
  15. Yuen, J.Q.; Fung, T.; Ziegler, A.D. Review of Allometric Equations for Major Land Covers in SE Asia: Uncertainty and Implications for above- and below-Ground Carbon Estimates. For. Ecol. Manag. 2016, 360, 323–340. [Google Scholar] [CrossRef]
  16. Fayolle, A.; Ngomanda, A.; Mbasi, M.; Barbier, N.; Bocko, Y.; Boyemba, F.; Couteron, P.; Fonton, N.; Kamdem, N.; Katembo, J.; et al. A Regional Allometry for the Congo Basin Forests Based on the Largest Ever Destructive Sampling. For. Ecol. Manag. 2018, 430, 228–240. [Google Scholar] [CrossRef]
  17. Martínez-Sánchez, J.L.; Martínez-Garza, C.; Cámara, L.; Castillo, O. Species-Specific or Generic Allometric Equations: Which Option Is Better When Estimating the Biomass of Mexican Tropical Humid Forests? Carbon Manag. 2020, 11, 241–249. [Google Scholar] [CrossRef]
  18. Pothong, T.; Elliott, S.; Chairuangsri, S.; Chanthorn, W.; Shannon, D.P.; Wangpakapattanawong, P. New Allometric Equations for Quantifying Tree Biomass and Carbon Sequestration in Seasonally Dry Secondary Forest in Northern Thailand. New For. 2022, 53, 217–236. [Google Scholar] [CrossRef]
  19. Marziliano, P.A.; Lafortezza, R.; Medicamento, U.; Lorusso, L.; Giannico, V.; Colangelo, G.; Sanesi, G. Estimating Belowground Biomass and Root/Shoot Ratio of Phillyrea Latifolia L. in the Mediterranean Forest Landscapes. Ann. For. Sci. 2015, 72, 585–593. [Google Scholar] [CrossRef] [Green Version]
  20. Finér, L.; Ohashi, M.; Noguchi, K.; Hirano, Y. Factors Causing Variation in Fine Root Biomass in Forest Ecosystems. For. Ecol. Manag. 2011, 261, 265–277. [Google Scholar] [CrossRef]
  21. Vogt, K.A.; Vogt, D.J.; Bloomfield, J. Analysis of Some Direct and Indirect Methods for Estimating Root Biomass and Production of Forests at an Ecosystem Level. Plant Soil 1998, 200, 71–89. [Google Scholar] [CrossRef]
  22. Addo-Danso, S.D.; Prescott, C.E.; Smith, A.R. Methods for Estimating Root Biomass and Production in Forest and Woodland Ecosystem Carbon Studies: A Review. For. Ecol. Manag. 2016, 359, 332–351. [Google Scholar] [CrossRef]
  23. Qi, Y.; Wei, W.; Chen, C.; Chen, L. Plant Root-Shoot Biomass Allocation over Diverse Biomes: A Global Synthesis. Glob. Ecol. Conserv. 2019, 18, e00606. [Google Scholar] [CrossRef]
  24. Jackson, R.B.; Mooney, H.A.; Schulze, E.-D. A Global Budget for Fine Root Biomass, Surface Area, and Nutrient Contents. Proc. Natl. Acad. Sci. USA 1997, 94, 7362–7366. [Google Scholar] [CrossRef] [PubMed] [Green Version]
  25. Vogt, K.A.; Vogt, D.J.; Palmiotto, P.A.; Boon, P.; O’Hara, J.; Asbjornsen, H. Review of Root Dynamics in Forest Ecosystems Grouped by Climate, Climatic Forest Type and Species. Plant Soil 1995, 187, 159–219. [Google Scholar] [CrossRef]
  26. Danjon, F.; Barker, D.H.; Drexhage, M.; Stokes, A. Using Three-Dimensional Plant Root Architecture in Models of Shallow-Slope Stability. Ann. Bot. 2007, 101, 1281–1293. [Google Scholar] [CrossRef] [Green Version]
  27. Henry, M.; Bombelli, A.; Trotta, C.; Alessandrini, A.; Birigazzi, L.; Sola, G.; Vieilledent, G.; Santenoise, P.; Longuetaud, F.; Valentini, R.; et al. GlobAllomeTree: International Platform for Tree Allometric Equations to Support Volume, Biomass and Carbon Assessment. IForest-Biogeosci. For. 2013, 6, 326–330. [Google Scholar] [CrossRef] [Green Version]
  28. Ministry of Environment and Forestry. Updated National Determined Contribution Republic of Indonesia. 2021. p. 46. Available online: http://ditjenppi.menlhk.go.id/reddplus/images/adminppi/adaptasi/dokumen/Updated_NDC.pdf (accessed on 22 June 2022).
  29. Bayen, P.; Bognounou, F.; Lykke, A.M.; Ouédraogo, M.; Thiombiano, A. The Use of Biomass Production and Allometric Models to Estimate Carbon Sequestration of Jatropha Curcas L. Plantations in Western Burkina Faso. Environ. Dev. Sustain. 2016, 18, 143–156. [Google Scholar] [CrossRef]
  30. Degerickx, J.; Almeida, J.; Moonen, P.C.J.; Vervoort, L.; Muys, B.; Achten, W.M.J. Impact of Land-Use Change to Jatropha Bioenergy Plantations on Biomass and Soil Carbon Stocks: A Field Study in Mali. GCB Bioenergy 2016, 8, 443–455. [Google Scholar] [CrossRef]
  31. Diédhiou, I.; Diallo, D.; Mbengue, A.A.; Hernandez, R.R.; Bayala, R.; Diémé, R.; Diédhiou, P.M.; Sène, A. Allometric Equations and Carbon Stocks in Tree Biomass of Jatropha Curcas L. in Senegal’s Peanut Basin. Glob. Ecol. Conserv. 2017, 9, 61–69. [Google Scholar] [CrossRef]
  32. Rao, G.R.; Raju, B.M.; Reddy, P.S.; Kumar, P.S. Developing Allometric Equations for Prediction of Total Standing Biomass of Pongamia Pinnata L.: An Important Biodiesel Plant. J. Sci. Ind. Res. 2017, 76, 320–324. [Google Scholar]
  33. Swamy, S.L.; Dutt, C.B.S.; Murthy, M.S.R.; Mishra, A.; Bargali, S.S. Floristics and Dry Matter Dynamics of Tropical Wet Evergreen Forests of Western Ghats, India. Curr. Sci. 2010, 99, 353–364. [Google Scholar]
  34. Leksono, B.; Hendrati, R.L.; Windyarini, E.; Hasnah, T. Variation in biofuel potential of twelve Calophyllum Inophyllum populations in indonesia. Indones. J. For. Res. 2014, 1, 127–138. [Google Scholar] [CrossRef]
  35. Choi, W.Y.; Kim, R.H.; Son, Y.M.; Lee, K.H.; Lee, S.W.; Park, I.H.; Son, Y.; Lee, Y.J. Survey Manual for Biomass and Soil Carbon; Korea Forest Research Institute: Seoul, Korea, 2010; ISBN 978-89-8176-581-1. [Google Scholar]
  36. Worbes, M.; Herawati, H.; Martius, C. Tree Growth Rings in Tropical Peat Swamp Forests of Kalimantan, Indonesia. Forests 2017, 8, 336. [Google Scholar] [CrossRef] [Green Version]
  37. Köhl, M.; Neupane, P.R.; Lotfiomran, N. The Impact of Tree Age on Biomass Growth and Carbon Accumulation Capacity: A Retrospective Analysis Using Tree Ring Data of Three Tropical Tree Species Grown in Natural Forests of Suriname. PLoS ONE 2017, 12, e0181187. [Google Scholar] [CrossRef] [PubMed]
  38. Nguyen, Q.H.; Ly, H.-B.; Ho, L.S.; Al-Ansari, N.; Le, H.V.; Tran, V.Q.; Prakash, I.; Pham, B.T. Influence of Data Splitting on Performance of Machine Learning Models in Prediction of Shear Strength of Soil. Math. Probl. Eng. 2021, 2021, 1–15. [Google Scholar] [CrossRef]
  39. Roxburgh, S.H.; Paul, K.I.; Clifford, D.; England, J.R.; Raison, R.J. Guidelines for Constructing Allometric Models for the Prediction of Woody Biomass: How Many Individuals to Harvest? Ecosphere 2015, 6, art38. [Google Scholar] [CrossRef] [Green Version]
  40. Sprugel, D.G. Correcting for Bias in Log-Transformed Allometric Equations. Ecology 1983, 64, 209–210. [Google Scholar] [CrossRef]
  41. Son, Y.; Hwang, J.W.; Kim, Z.S.; Lee, W.K.; Kim, J.S. Allometry and Biomass of Korean Pine (Pinus Koraiensis) in Central Korea. Bioresour. Technol. 2001, 78, 251–255. [Google Scholar] [CrossRef]
  42. Anitha, K.; Verchot, L.V.; Joseph, S.; Herold, M.; Manuri, S.; Avitabile, V. A Review of Forest and Tree Plantation Biomass Equations in Indonesia. Ann. For. Sci. 2015, 72, 981–997. [Google Scholar] [CrossRef] [Green Version]
  43. Sileshi, G.W. A Critical Review of Forest Biomass Estimation Models, Common Mistakes and Corrective Measures. For. Ecol. Manag. 2014, 329, 237–254. [Google Scholar] [CrossRef]
  44. Huynh, T.; Applegate, G.; Lewis, T.; Pachas, A.N.A.; Hunt, M.A.; Bristow, M.; Lee, D.J. Species-Specific Allometric Equations for Predicting Belowground Root Biomass in Plantations: Case Study of Spotted Gums (Corymbia Citriodora Subspecies Variegata) in Queensland. Forests 2021, 12, 1210. [Google Scholar] [CrossRef]
  45. Niiyama, K.; Kajimoto, T.; Matsuura, Y.; Yamashita, T.; Matsuo, N.; Yashiro, Y.; Ripin, A.; Kassim Abd, R.; Noor, N.S. Estimation of Root Biomass Based on Excavation of Individual Root Systems in a Primary Dipterocarp Forest in Pasoh Forest Reserve, Peninsular Malaysia. J. Trop. Ecol. 2010, 26, 271–284. [Google Scholar] [CrossRef]
  46. Augusto, L.; Achat, D.L.; Bakker, M.R.; Bernier, F.; Bert, D.; Danjon, F.; Khlifa, R.; Meredieu, C.; Trichet, P. Biomass and Nutrients in Tree Root Systems-Sustainable Harvesting of an Intensively Managed Pinus Pinaster (Ait.) Planted Forest. GCB Bioenergy 2015, 7, 231–243. [Google Scholar] [CrossRef]
  47. Nelson, B.W.; Mesquita, R.; Pereira, J.L.G.; Garcia Aquino de Souza, S.; Teixeira Batista, G.; Bovino Couto, L. Allometric Regressions for Improved Estimate of Secondary Forest Biomass in the Central Amazon. For. Ecol. Manag. 1999, 117, 149–167. [Google Scholar] [CrossRef]
  48. Zhao, H.; Li, Z.; Zhou, G.; Qiu, Z.; Wu, Z. Site-Specific Allometric Models for Prediction of Above-and Belowground Biomass of Subtropical Forests in Guangzhou, Southern China. Forests 2019, 10, 862. [Google Scholar] [CrossRef] [Green Version]
  49. Huy, B.; Kralicek, K.; Poudel, K.P.; Phuong, V.T.; Khoa, P.V.; Hung, N.D.; Temesgen, H. Allometric Equations for Estimating Tree Aboveground Biomass in Evergreen Broadleaf Forests of Viet Nam. For. Ecol. Manag. 2016, 382, 193–205. [Google Scholar] [CrossRef]
  50. Mahmood, H.; Siddique, M.; Costello, L.; Birigazzi, L.; Abdullah, S.; Henry, M.; Siddiqui, B.; Aziz, T.; Ali, S.; Al Mamun, A.; et al. Allometric Models for Estimating Biomass, Carbon and Nutrient Stock in the Sal Zone of Bangladesh. IForest-Biogeosci. For. 2019, 12, 69–75. [Google Scholar] [CrossRef] [Green Version]
  51. Preece, N.D.; van Oosterzee, P.; Unda, G.C.H.; Lawes, M.J. National Carbon Model Not Sensitive to Species, Families and Site Characteristics in a Young Tropical Reforestation Project. For. Ecol. Manag. 2017, 392, 115–124. [Google Scholar] [CrossRef]
Figure 1. Map of the study areas in Central Java and Daerah Istimewa Yogyakarta, Indonesia.
Forests 13 01057 g001
Figure 2. Distribution of the measured vs. predicted biomass on the 1–1 line.
Forests 13 01057 g002
Figure 3. Comparison of the measured biomass of the current study and the predicted biomass using the allometric equations of Swamy et al. [35].
Forests 13 01057 g003
Table 1. Description of study areas.
LocationAnnual Rainfall (mm)Air Temperature (°C)SoilSlope
(%)
Notes
Giriwono Village, Wonogiri Regency, Central Java187820–38Deep soil Solum with alluvium, soil texture of clay loam and sandy loam0–10The location is in the demonstration plot of the Center for Biotechnology Research and Development and Forest Plant Breeding. The plot area is about 2 ha, however, not all of the area was planted with C. inophyllum L. At the beginning of planting time (2011), the plot consists of 452 trees, with a spacing of 5 × 5 m.
Gading Village, Playen District, Gunung Kidul Regency, Central Java219823–32Shallow soil solum, with soil texture of sandy clay loam10–15The C. inophyllum L. trees were planted in home gardens of the local communities, with irregular spacing.
Rejosari Village, Grabag District, Purworejo Regency, Central Java312320–32Deep soil solum and unclear soil horizon, loam texture0–5The C. inophyllum L. trees were planted in home gardens of the local communities, with irregular spacing.
Jogosimo Village, Klierong District, Kebumen Regency, Central Java312223–32Deep soil solum and unclear soil horizon, dominated by a sand fraction0–5The C. inophyllum L. trees were planted in home gardens of the local communities, with irregular spacing.
Table 2. The age of tree samples.
NoLocationDBH (cm)Age (Year)Note
1Wonogiri3.3–17.66Planting in 2011 and cutting in 2017
2Wonogiri23.1–30.310Planting in 2011 and cutting in 2021
3Gunung Kidul34.030Determined using tree ring analysis
4Gunung Kidul28.638Determined using tree ring analysis
5Gunung Kidul37.046Determined using tree ring analysis
6Purworejo39.035Determined using tree ring analysis
7Purworejo45.441Determined using tree ring analysis
8Purworejo46.230Determined using tree ring analysis
9Purworejo33.539Determined using tree ring analysis
10Purworejo35.024Determined using tree ring analysis
11Purworejo49.038Determined using tree ring analysis
12Kebumen41.544Determined using tree ring analysis
13Kebumen74.058Determined using tree ring analysis
Table 3. Characteristic of the destructive tree samples of the 30 trees.
VariableMinimumMaximumMean
DBH (cm)6.674.021.3 ± 2.6
H (m)4.724.011.4 ± 0.5
AGB (kg/tree)22.73407.6347.4 ± 115.5
BGB (kg/tree)2.6730.769.2 ± 24.6
TABGB (kg/tree)25.34138.3416.6 ± 140.0
Note: aboveground biomass (AGB), belowground biomass (BGB), and total above- and belowground biomass (TABGB) are based on the dry weight.
Table 4. Allometric equations for aboveground biomass, belowground biomass, and total above- and belowground biomass (using 30 tree samples).
Allometric EquationCoefficientStandard Error of the CoefficientAdjusted R2Standard Error of EstimationCF
SymbolValue
ln(AGB) = ln(c) + α ln(DBH)ln(c)−0.972 **0.3270.9230.3621.003
α2.078 ***0.111
ln(BGB) = ln(c) + α ln(DBH)ln(c)−3.559 ***0.3110.9450.3421.077
α2.359 ***0.106
ln(TABGB)= ln(c) + α ln(DBH)ln(c)−0.917 **0.3120.9320.3441.002
α2.115 ***0.106
ln(AGB) = ln(c) + α ln(H)ln(c)−2.311 ***0.4890.8870.4361.003
α3.095 ***0.204
ln(BGB) = ln(c) + α ln(H)ln(c)−5.123 ***0.4670.9180.4171.003
α3.533 ***0.195
ln(TABGB) = c + α ln(H)ln(c)−2.286 ***0.4720.8980.4221.003
α3.154 ***0.197
Note: The statistical analyses were significant at 95%, CI = confidence interval, *** = p ≤ 0.001, ** = p ≤ 0.01. AGB = Aboveground biomass, BGB = Belowground biomass, TABGB = Total above- and belowground biomass are based on dry weight, DBH = diameter at breast height, H = height.
Table 5. Characteristics of the 10 sample trees for validation.
VariableMinimumMaximumMean
DBH (cm)3.349.027.2 ± 5.3
H (m)3.624.613.1 ± 2.1
AGB (kg/tree)6.71737.4589.6 ± 184.2
BGB (kg/tree)1.0479.1151.4 ± 55.8
TABGB (kg/tree)7.72182.5741.0 ± 235.4
Note: diameter at breast height (DBH), height (H), aboveground biomass (AGB), belowground biomass (BGB), and total above- and belowground biomass (TABGB) are based on the dry weight.
Table 6. The mean absolute percentage error of the validation.
Number of Sample TreesEquationMAPE (%)
10ln(AGB) = −0.972 + 2.078 ln(DBH)24.7
10ln(BGB) = −3.599 + 2.359 ln(DBH)37.0
10ln(TABGB) = −0.917 + 2.115 ln(DBH)25.8
10ln(AGB) = −2.311 + 3.095 ln(H)37.4
10ln(BGB) = −5.123 + 3.533 ln(H)49.0
10ln(TABGB) = −2.286 + 3.154 ln(H)39.8
Note: Diameter at breast height (DBH), height (H), aboveground biomass (AGB), belowground biomass (BGB), and total above- and belowground biomass (TABGB) are based on dry weight.
Table 7. Paired t-test differences between the measured and the predicted of the 10 independent validation data.
EquationAverage (kg/Tree)Paired Differences
MeasuredPredictedt-ValueSig (Two-Tailed)
ln(AGB) = −0.972 + 2.078 ln(DBH)589.64503.711.5320.160 ns
ln(BGB) = −3.599 + 2.359 ln(DBH)151.37114.841.3410.212 ns
ln(TABGB) = −0.917 + 2.115 ln(DBH)741.01609.251.7930.106 ns
ln(AGB) = −2.311 + 3.095 ln(H)589.64547.550.3580.728 ns
ln(BGB) = −5.123 + 3.533 ln(H) 151.37115.071.0400.325 ns
ln(TABGB) = −2.286 + 3.154 ln(H)741.01629.850.8230.432 ns
Note: diameter at breast height (DBH), height (H), aboveground biomass (AGB), belowground biomass (BGB), and total above- and belowground biomass (TABGB) are based on dry weight, ns = none significance at 95% confidence interval.
Table 8. The confidence interval of the mean of various allometric models.
ParameterMeasuredPredictedAllometric Model for Prediction
95% CI Lower limit of AGB mean (kg/tree)172.8168.7ln(AGB) = −0.972 + 2.078 ln(DBH)
95% CI Upper limit of AGB mean (kg/tree)1006.4838.7ln(AGB) = −0.972 + 2.078 ln(DBH)
95% CI Lower limit of BGB mean (kg/tree)25.234.2ln(BGB) = −3.599 + 2.359 ln(DBH)
95% CI Upper limit of BGB mean (kg/tree)277.5195.5ln(BGB) = −3.599 + 2.359 ln(DBH)
95% CI Lower limit of TABGB mean (kg/tree)208.4218.6ln(TABGB) = −0.917 + 2.115 ln(DBH)
95% CI Upper limit of TABGB mean (kg/tree)1273.61213.4ln(TABGB) = −0.917 + 2.115 ln(DBH)
95% CI Lower limit of AGB mean (kg/tree)172.853.3ln(AGB) = −2.311 + 3.095 ln(H)
95% CI Upper limit of AGB mean (kg/tree)1006.41041.8ln(AGB) = −2.311 + 3.095 ln(H)
95% CI Lower limit of BGB mean (kg/tree)25.21.1ln(BGB) = −5.123 + 3.533 ln(H)
95% CI Upper limit of BGB mean (kg/tree)277.5229.0ln(BGB) = −5.123 + 3.533 ln(H)
95% CI Lower limit of TABGB mean (kg/tree)208.457.6ln(TABGB) = −2.286 + 3.154 ln(H)
95% CI Upper limit of TABGB mean (kg/tree)1273.61202.0ln(TABGB) = −2.286 + 3.154 ln(H)
Note: diameter at breast height (DBH), height (H), aboveground biomass (AGB), belowground biomass (BGB), and total above- and belowground biomass (TABGB) are based on dry weight.
Publisher’s Note: MDPI stays neutral with regard to jurisdictional claims in published maps and institutional affiliations.

