Article

The Use of UAV-Acquired Multiband Images for Detecting Rockfall-Induced Injuries at Tree Crown Level

1
Department of Forestry and Forest Renewable Resources, Biotechnical Faculty, University of Ljubljana, 1000 Ljubljana, Slovenia
2
Flycom Technologies d.o.o., Ljubljanska cesta 24a, 4000 Kranj, Slovenia
*
Author to whom correspondence should be addressed.
Forests 2022, 13(7), 1039; https://doi.org/10.3390/f13071039
Submission received: 29 May 2022 / Revised: 19 June 2022 / Accepted: 29 June 2022 / Published: 1 July 2022
(This article belongs to the Section Forest Inventory, Modeling and Remote Sensing)

Abstract

:
In this paper, we present an identification of rockfall-injured trees based on multiband images obtained by an unmanned aerial vehicle (UAV). A survey with a multispectral camera was performed on three rockfall sites with versatile tree species (Fagus sylvatica L., Larix decidua Mill., Pinus sylvestris L., Picea abies (L.) Karsten, and Abies alba Mill.) and with different characterizations of rockfalls and rockfall-induced injuries. At one site, rockfall injuries were induced in the same year as the survey. At the second site, they were induced one year after the initial injuries, and at the third site, they were induced six years after the first injuries. At one site, surveys were performed three years in a row. Multiband images were used to extract different vegetation indices (VIs) at the tree crown level and were further studied to see which VIs can identify the injured trees and how successfully. A total of 14 VIs were considered, including individual multispectral bands (green, red, red edge, and near-infrared) by using regression models to differentiate between the injured and uninjured groups for a single year and for three consecutive years. The same model was also used for VI differentiations among the recorded injury groups and size of the injuries. The identification of injured trees based on VIs was possible at the sites where rockfall injuries were induced at least one year before the UAV survey, and they could still be identifiable six years after the initial injuries. At the site where injuries were induced only four months before the UAV survey, the identification of injured trees was not possible. VIs that could explain the largest variability (R2 > 0.3) between injured and uninjured trees were: inverse ratio index (IRVI), green–red vegetation index (GRVI), normalized difference vegetation index (NDVI), normalized ratio index (NRVI), and ratio vegetation index (RVI). RVI was the most successful, explaining 40% of the variance at two sites. R2 values only increased by a few percentages (up to 10%) when the VIs of injured trees were observed over a period of three years and mostly did not change significantly, thus not indicating if the vitality of the trees increased or decreased. Differentiation among the injured groups did not show promising results, while, on the other hand, there was a strong correlation between the VI values (RVI) and the size of the injury according to the basal area of the trees (so-called injury index). Both in the case of broadleaves and conifers at two sites, the R2 achieved a value of 0.82. The presented results indicate that the UAV-acquired multiband images at the tree crown level can be used for surveying rockfall protection forests in order to monitor their vitality, which is crucial for maintaining the protective effect through time and space.

1. Introduction

Mountainous regions are exposed to various slope processes of which rockfalls are one of the most common ones [1]. Rockfalls occur due to the weathering of bedrock on steep and exposed slopes and are defined as a detachment of individual rocks that are transported downslope [2]. Their volumes vary in size from a few cubic meters to several thousand (even millions in extreme, catastrophic events) cubic meters [3]. Since they occur almost instantly, without any warning signs, and are hardly predictable, they pose a huge risk to human activities, cause damage, and even cause human fatalities [4].
The forests that cover areas prone to rockfall activity represent an important ecosystem-based disaster risk reduction (Eco-DRR) since they can protect people, settlements, and infrastructure against the negative impacts of rockfalls [5]. Forests with protective effects against rockfalls can reduce their: (i) onset probability (by reducing the likelihood of the initiation of rockfalls), (ii) propagation probability (by reducing their spatial occurrence), and (iii) intensity (both size and velocity) [5,6,7,8,9]. Individual trees can stop rocks or can reduce the kinetic energy of larger rocks by dissipating their energy through the impact with trees [10,11,12]. In the case of rockfalls, large impacts of energy are experienced at the point of contact of the rock mass with a tree [13,14]. A tree can disperse or absorb the kinetic energy of the rock in several ways: through the root system, deformation or oscillation of the trunk, or local penetration at the point of the rock’s impact. Consequently, the kinetic energy of the rocks can be reduced, and the rocks can stop at the location of impact completely. Rockfall impacts can induce strong and widespread anatomical responses in trees. The following responses can occur [15,16]: (i) abrupt suppression of tree growth due to the decapitation of branch loss, (ii) presence of callus tissue and traumatic resin duct, (iii) eccentric growth and formation of reaction wood following stem tilting, and (iv) abrupt growth release due to the elimination of neighboring trees and thus improved growth conditions.
The impact of rocks on trees can physically injure them to the point when the protection function of the forest is diminished in terms of both efficiency as well as extent [7,8]. Larger rockfall events are in this context especially critical since the protection effect of the forest can be reduced significantly in a short period of time [7,17]. Due to rockfall injuries, trees can be affected in the long term, which might impact their growth and survival. Additionally, they will be less prone to abiotic and biotic disturbances, further leading to a decreased protection effect and, in the end, to the death of the trees [9]. To ensure the continuous protection effect of forests against rockfalls, it is necessary that these forests are properly monitored and managed in order to maintain the protection effectiveness [6,7,11]. Because of increased human activities in areas that are prone to rockfall hazard, the importance of forests with protective functions is becoming more significant [17], especially if considering the changing climate, increased frequency of natural disturbances in forests, and possible increased rockfall frequency [18]. The need for inventorying and monitoring the protection effect of forests against rockfalls (and also other natural hazards, such as avalanches and debris flows) is therefore crucial.
Since rockfall protection forests are located on steep slopes that are hardly accessible and, most importantly, dangerous for various field work operations, the use of unmanned aerial vehicles (UAVs) shows a promising new solution for monitoring protection forests on a local scale. The main advantages for the use of UAVs in forestry are that they can provide remote sensing data with high spatial (tree level) and temporal accuracy; they can be used on demand, and their missions can be planned flexibly to the terrain’s features and by avoiding poor weather conditions [19,20]. UAVs combined with different sensors (e.g., RGB cameras, lidar, multispectral, hyperspectral cameras, etc.) [21] can provide various 3D data about the forest. Based on the literature review, Dainelli et al. [22,23] structured the use of UAV remote sensing data in forestry into the following spheres: (i) tree detection and inventory parameters, (ii) aboveground biomass/volume estimation, (iii) pest and disease detection, (iv) species recognition and invasive plant detection, and (v) conservation, restoration, and fire monitoring. In the case of rockfall protective forests, there is great interest in extracting tree sizes and their spatial distribution [24] in order to study the optimal protection effects against rockfalls and to simulate potential release and runout areas of rockfalls within the forest [25,26,27]. As impacts on the trees are mechanical and with that, the most vital parts of the tree can be injured, one of the possible applications of UAV remote sensing data would be monitoring protection forest vitality through multispectral imagery. To maintain long-term efficiency of protection forests, it is necessary to detect the vitality loss of trees and forest stands at an early stage. With early detection of deterioration of the protection effect, it is possible to take action, e.g., silvicultural or technical, with which the protective effect can be maintained or restored in a way that there is no negative effect of rockfalls on human activities.
UAVs combined with high-resolution spectral sensors, e.g., multispectral or hyperspectral, allow an acquisition of data at a close range and at tree levels, possibly providing data on a long-term scale using indicators that are measured by the spectral reflectance [28,29]. In general, data on the tree crown scale can be retrieved more consistently than, e.g., with satellite imagery. In addition, different illumination conditions can be better taken into account, and, consequently, vegetation indices (VIs) can be calculated more consistently on smaller spatial scales [30]. Following the changes in different spectral traits, it is possible to detect changes in the amount of photosynthetically active pigments (e.g., chlorophyll, xanthophyll, α, β carotene, and xanthophyll) [29]. For example, by tracking chlorophyll fluorescence, it is possible to detect variations in photosynthetic efficiency [28]. A healthy tree will produce more chlorophyll than a tree that has been under stress due to, e.g., lack of nutrients and water. A change in a photosynthetic production can be reflected so that this tree will have larger amounts of green and red reflectance [31]. For studying vegetation conditions, many VIs based on spectral bands have been developed, and they form combinations of surface reflectance at two or more wavelengths [32].
The most frequently used VI is the normalized difference vegetation index (NDVI), which measures the reflectance peak at a near-infrared region, and it is one of the most useful vegetation indices for detecting discoloration that has been caused by physiological stress over time [33]. The VI values can, due to the high spatial resolution of UAV multispectral images (cm), be extracted at the tree crown level. Approaches, such as pixel-based (PB) and geographic object-based (GEOBIA) classification, allow for an automatic extraction of different objects from multispectral imagery [34]. PB methods use individual pixels of the multispectral images as a minimum mapping unit, while GEOBIA enables pixels to be grouped into different shapes and sizes, correspondingly to the common spectral, spatial, and geometric features [35,36]. Several authors used these two approaches for segmentation of tree crowns, e.g., of olive trees [34], parklands [37], coniferous and deciduous tree species [38], palm oil crowns [39], tree species diversity [40], and invasive plants [41]. These methods are less successful in detecting trees with high tree density and dense understory vegetation [37].
Thus far, spectral data for the analysis of tree vitality in forestry were mostly focused on assessing the vitality of the forest in relation to the dynamics of biotic natural disturbances, such as diseases, insect outbreaks (especially damage and early detection of bark beetles) [31,33,42,43,44,45,46,47,48], and meteorological disasters, such as damage by hurricanes [49]. In this paper, we wanted to investigate the use of the UAV-acquired multiband images for studying the early detection of trees or parts of forest stands where tree vitality is affected due to geomorphologic abiotic disturbances (e.g., rockfalls, avalanches, and debris slides). Therefore, our main motivation was to analyze whether it is possible to use a multispectral sensor combined with UAVs for the detection and mapping of trees injured by rockfall impacts. The focus of the study was on rockfall propagation and deposit areas where it could be possible to identify trees with differences in the spectral signature (resulted in VIs) because of the different injury intensity of the trees. The study was conducted in areas where no other abiotic or biotic disturbances were present in a forest stand, and trees were not injured due to other reasons, such as logging. Moreover, our goal was to use a remote sensing technique that could be used by a wider forest community (e.g., forest rangers, planners, etc.); this means that it is a quick and low-cost solution, which enables a quick analysis of the forest vitality in the protection forest at the tree level. Accordingly, the goals of the study were to: (i) assess the use of UAV-acquired multispectral data for delineation of injured trees due to rockfalls in forest stands with different species and severity of rockfall injuries and (ii) analyze if it is possible to differentiate among different rockfall injury categories.

2. Materials and Methods
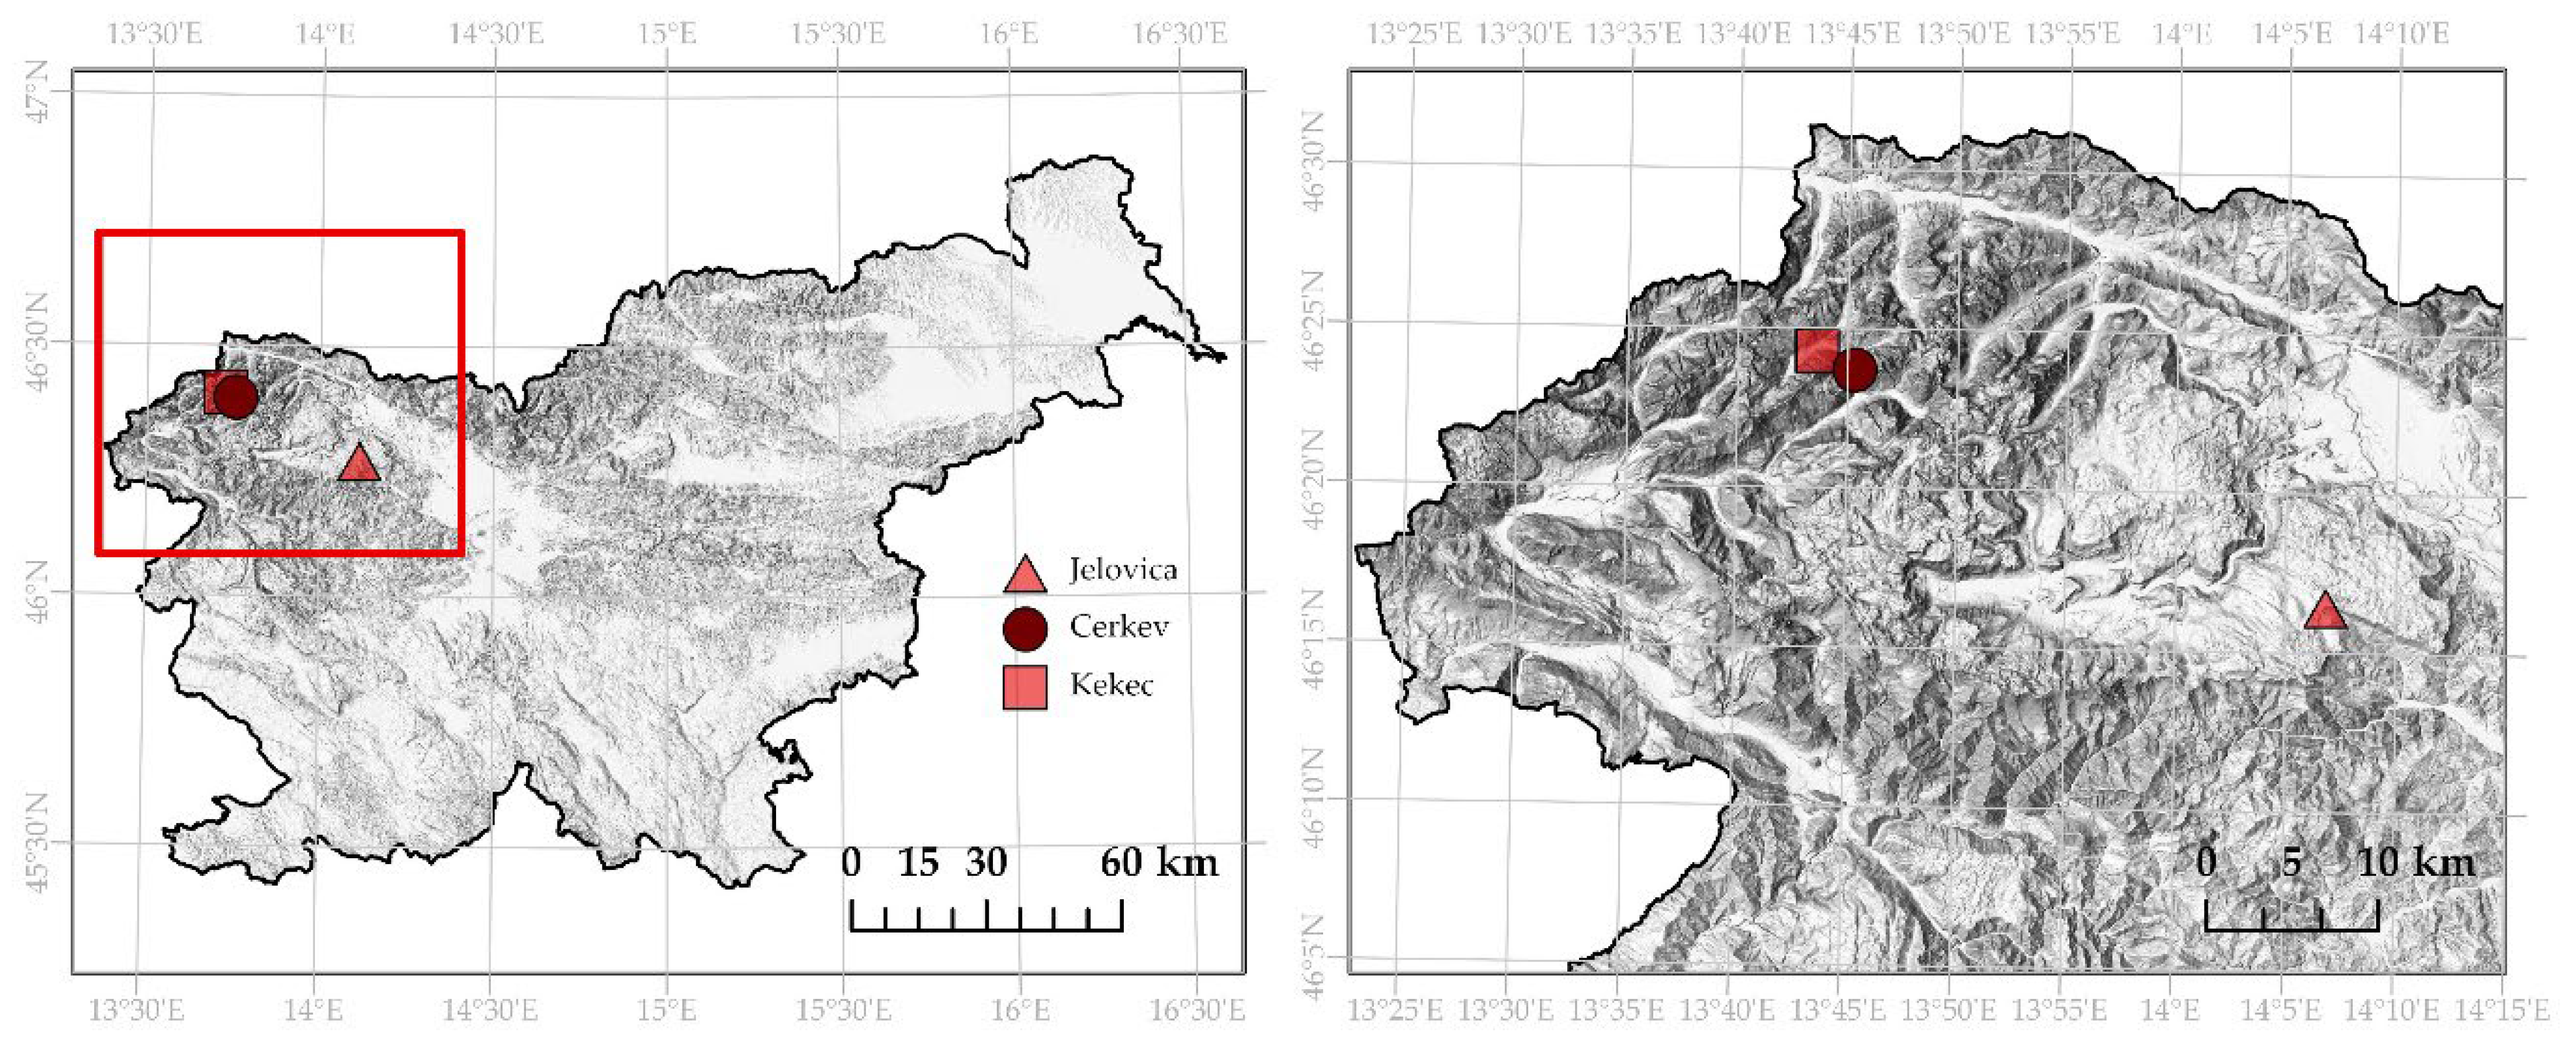
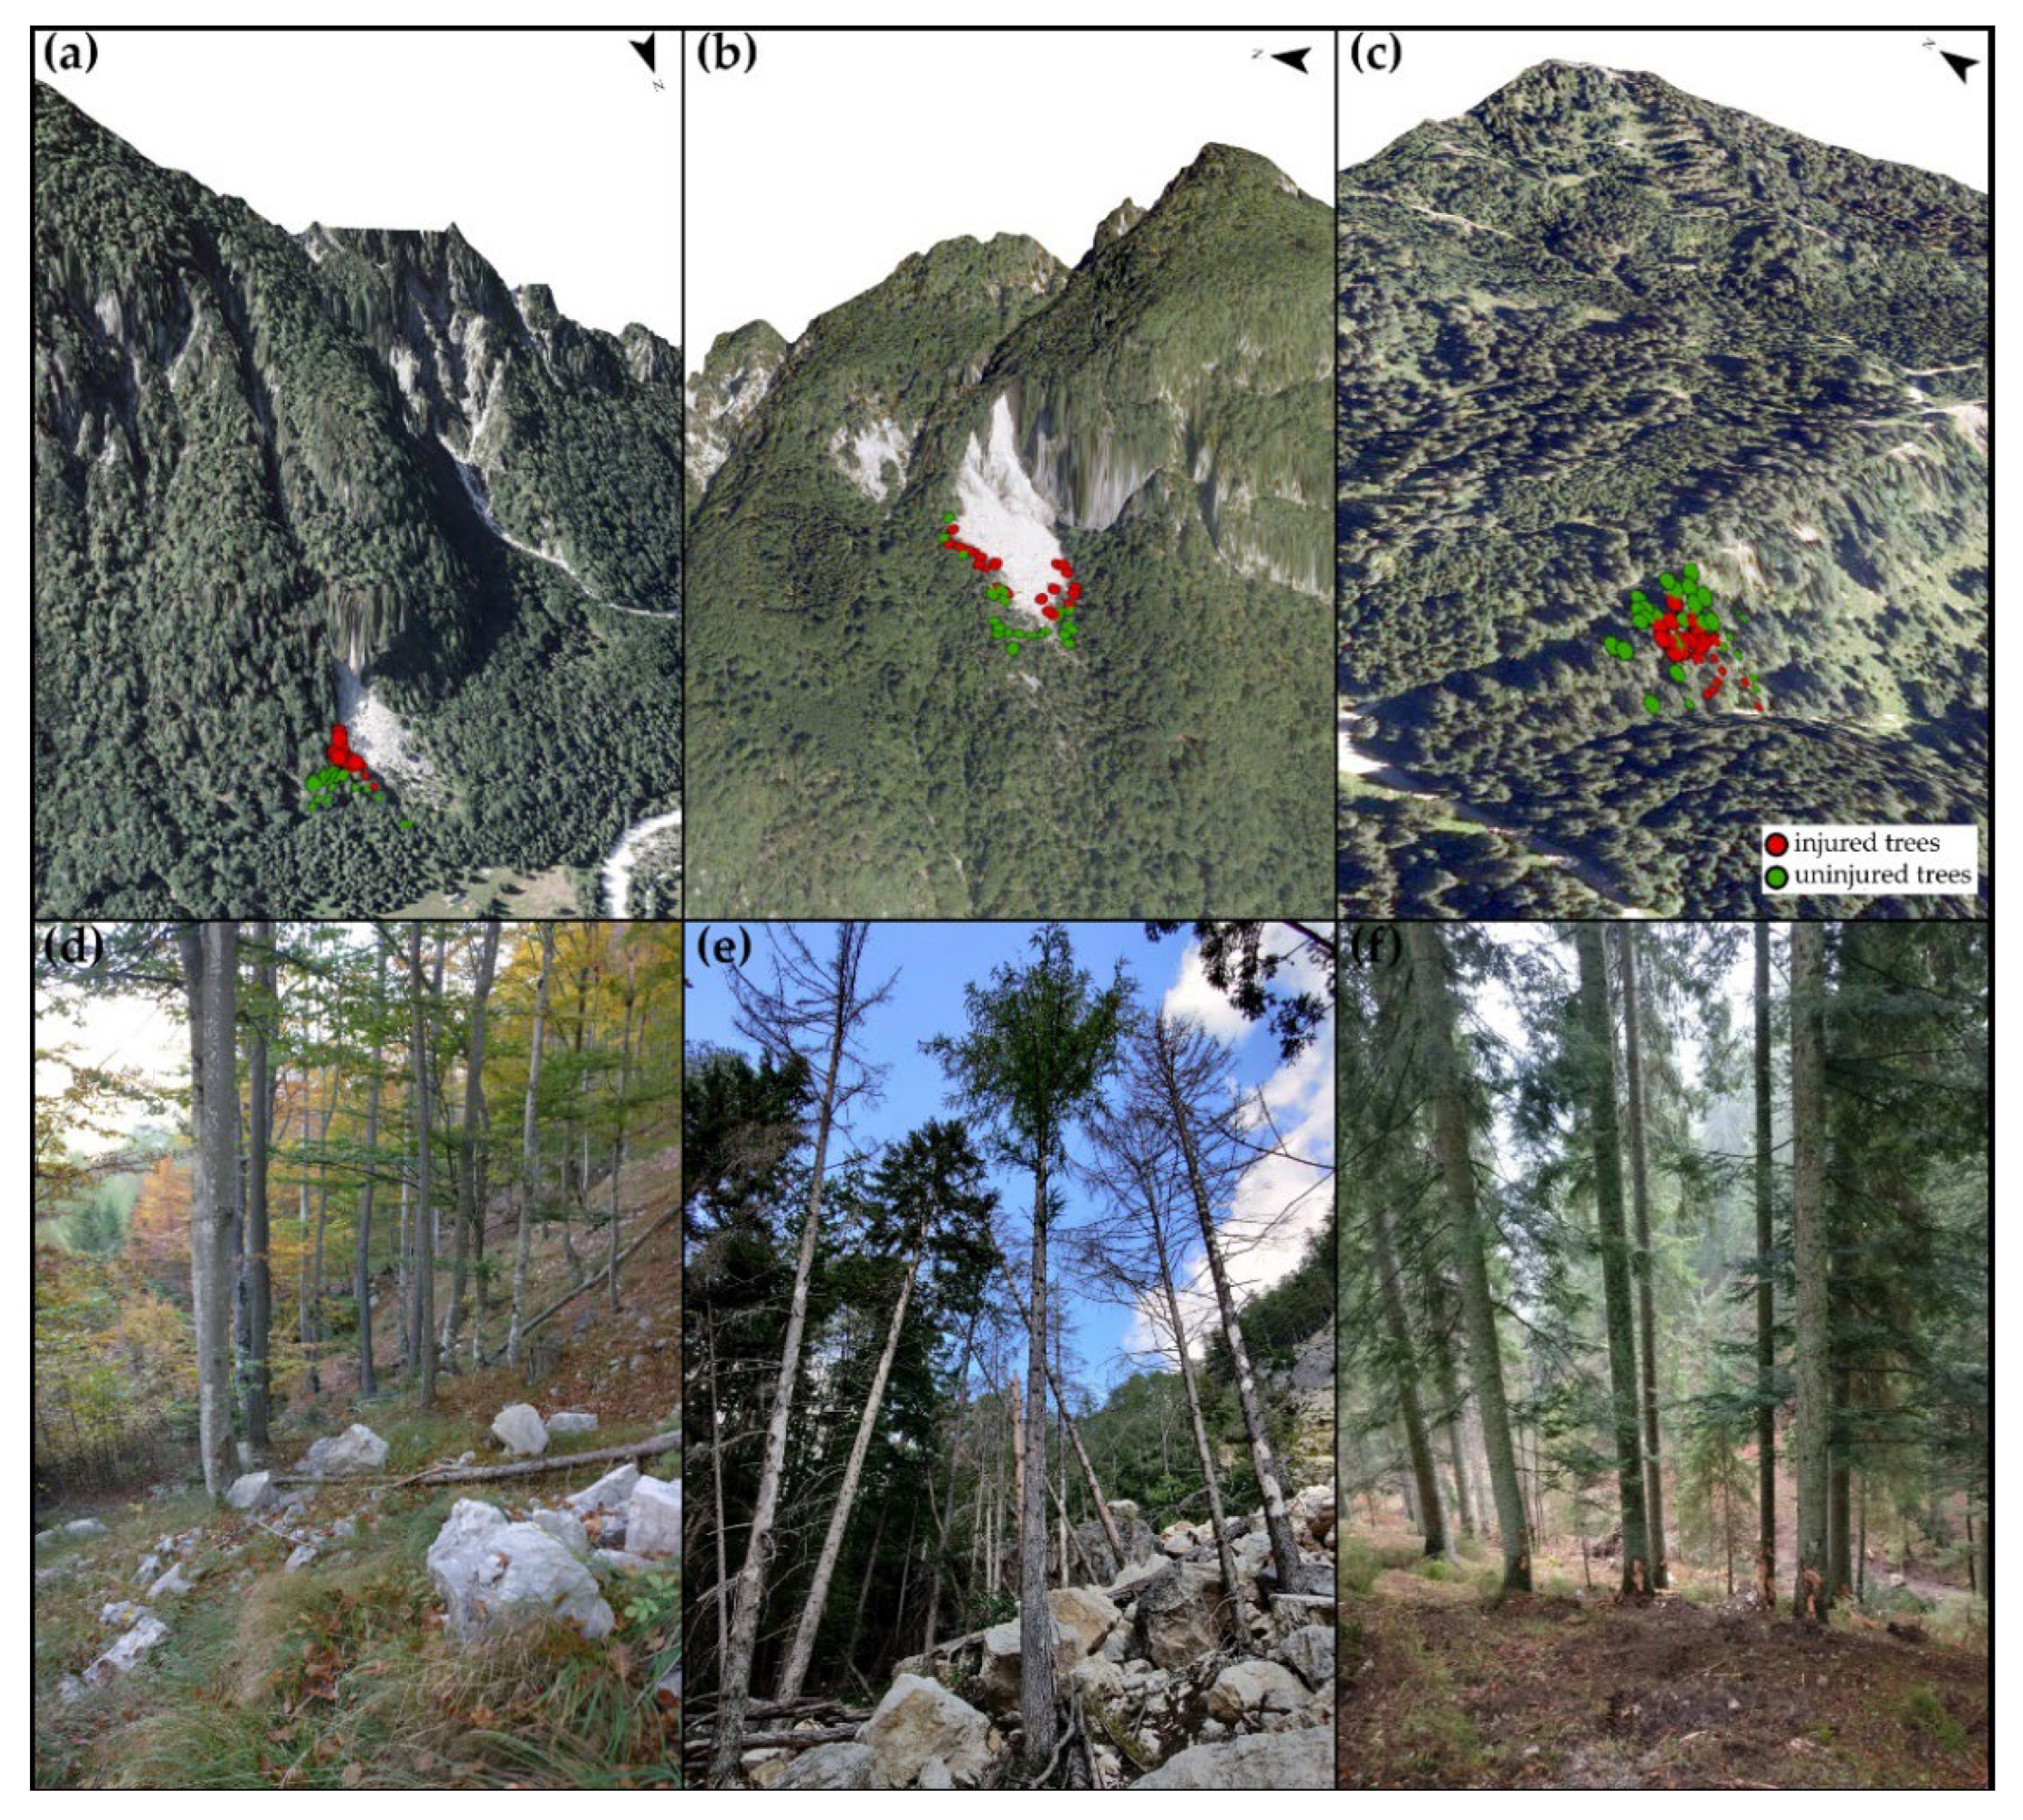
2.1. Study Sites

There are three study sites: two are located in Triglav National Park, in the Trenta Valley, in the northwestern part of Slovenia (sites called Kekec and Cerkev), while the third site is located on the Jelovica Plateau (site called Jelovica) (Figure 1 and Figure 2). Each of the sites is characterized by different forest structures, rockfall activities, and terrain features.
Sites that are located in the Trenta Valley are geotectonically part of the Southern Alps and part of the Julian Alps Overthrust [50,51,52]. Fractures in this area have dominant transversal Dinaric (NE–SW) and Dinaric directions (NE–SE) [53]. Dachstein limestone (0.5 to 5 m thick) of the Norian–Rhaetian age is present at both rockfalls, and, typically, limestone passes into dolomite in vertical and lateral directions [53]. Both sites are characterized by the slope that is highly susceptible to rockfall activity, which can be observed both by past rockfall deposits as well as freshly deposited rocks. The cause of rockfall activity is mostly characterized by the freeze–thaw cycle in the spring and extreme rainfall in the autumn [53,54], while rockfall in this area can also be earthquake-induced due to the location on the seismically active area between the Alps and Mediterranean Sea [55,56].
In the case of the Kekec site, the rockfall source is a 10–50 m-high, north-facing rock cliff. The Anemono trifoliate-Fagetum forest community [57] covers the area directly below the rock cliff. The prevailing tree species is Fagus sylvatica L., while individual Larix decidua Mill. trees are also present. Part of the forested area has been affected by the larger rockfall in April 2012 when part of the forest cover was completely diminished, and rocks of various volumes stopped in the forested area, causing injuries of different sizes. The latest larger event at the site occurred in March 2020 when approximately 11,000 m3 [58] of material collapsed from the rock cliff. The majority of rockfall deposits reached volumes up to 3 m3.
A similar situation is present at the Cerkev rockfall. The rockfall source area is represented by a vertical rocky (fall height 150 m), west-facing cliff. On the rockfall slope, it is possible to observe that rockfall activity has been present for longer time periods (older rocks and changed vegetation cover in comparison to the majority of the slope), while the last larger rockfall event at this site occurred in April 2017 [58] when approximately 29,000 m3 of rock material was released. The majority of the material was deposited directly below the rock cliff, while individual fragmented rocks were transported further down the slope affecting diminishing parts of the forest and causing different injuries to other trees. The Anemono-trifoliate-Fagetum forest community covers the rockfall runout zone, with Fagus sylvatica L. being the dominant tree species. However, in the nearest vicinity of past rockfall deposits, other tree species are present, such as Pinus sylvestris L., Picea abies (L.) Karsten, Larix decidua Mill., and Pinus mugo. The majority of the rock deposits had volumes up to 7 m3.
The Jelovica site is not susceptible to rockfall activity; however, in April 2019 (9–10 April 2019), a rockfall experiment (as a part of the ROCKtheALPS project, Interreg Alpine Space) [59] was conducted on this specific site where rocks up to 1 m3 were being pushed down the slope. The purposes of the experiment were, e.g., to reconstruct the rock trajectories and velocity, record impacts to the ground and trees, and study the consequences of the rock impacts on tree vitality. The Jelovica Plateau has a distinctive overthrust and an imbricate geological structure due to the Alpine orogeny and later block tectonics. The main fractures have a NW–SE direction, while transverse fractures occur as well. Jelovica is a high karst plateau that is mainly represented by sedimentary carbon rocks; in smaller areas, Keratophyre and Pyroclastic rocks can be found [60]. The specific site that is part of this research consists of thick-layered limestone, dolomitized limestone, and dolomite (Upper Trias and Lower Liassic) [61]. The site on the Jelovica is part of the Homogyno Sylvestris-Fagetum forest community, and the slope used in this research is mainly covered by Abies alba Mill. and Picea abies (L.) Karsten.

2.2. Field Survey—Recording Tree Injury Parameters

The first step of the research was to identify the injured trees due to rockfall activity at each study site. This required a field survey directly on the rockfall slopes and marking the trees that were used in the research. To compare and identify the injured trees later on the multispectral images, healthy and uninjured trees due to rockfall or any other geomorphological process were marked as well. The social status of the trees that were included in the study had to be dominant (crown of the trees extend above the general level of the canopy) or codominant (trees that reach the general level of the canopy) since these trees form a canopy cover, and their crown can be identified in the multispectral images. The precondition of including the tree in the research was also that it had to be located within the rockfall runout area so that all trees were exposed to the same rockfall activity and site conditions. The rockfall runout area was determined based on the location of past rock deposits. At all three sites, all presently injured trees were included in the research. At the Jelovica site, all trees were located within an area of 0.7 ha, at the Cerkev site, within an area of 3 ha, and in the case of the Kekec site, within an area of 1.6 ha. The locations of the trees were surveyed using a Leica Viva TS12 total station and Leica Zeno20 with GG04 Smart Antenna with an accuracy of 0.010–0.030 m.
Each injured and uninjured tree was given an ID number, and basic dendrometric parameters were recorded for it (e.g., tree species, diameter at breast height—DBH, social status of the tree, and description of its vitality). At the Cerkev rockfall, 23 injured and 22 uninjured trees were recorded, including tree species Larix decidua Mill., Pinus sylvestris L., and and Picea abies (L.) Karsten. At the Jelovica site, 22 injured trees and 27 uninjured trees were recorded, including tree species Picea abies (L.) Karsten and Abies alba Mill. The Kekec site had only one tree species present, namely Fagus sylvatica L., and we recorded 11 injured and 14 uninjured trees. The average DBHs at each site are given in Table 1.
As we wanted to examine not only if there are differences in the VI values of injured and uninjured trees, but also if it is possible to differentiate among different tree categories and extents of injuries, we performed a detailed field survey of rockfall injuries on trees. The design of the inventory of injuries was based on the research work of tree injuries in rockfall-injured forest stands [62,63,64]. In order to record only rockfall-induced injuries, injuries on the downslope side of the trees, injuries located higher on the tree stem in comparison to most injuries, and injuries with an unusually long vertical extent that could be caused by falling neighboring trees, were omitted. Based on previous rockfall inventories and injuries that were observed at all three research sites, we defined the categories for every rockfall injury (Figure 3). All tree injury categories are presented in Table 2.
After defining a category of injury, the parameters, such as injury height on the tree stem, size (diameters 1 and 2), shape of the injury, and injury stage were recorded as well. Based on the injury shape, it was possible do define an area of impact for each injury, while the stage of the injury indicates when the injury was caused [65]. The survey of injuries was based in a Survey123 application by ESRI [66] and on a one-to-many relationship, meaning that an individual tree could have multiple tree injuries. The results of the field survey were directly available in a .dbf table. For each rockfall injury, we also recorded a photograph.

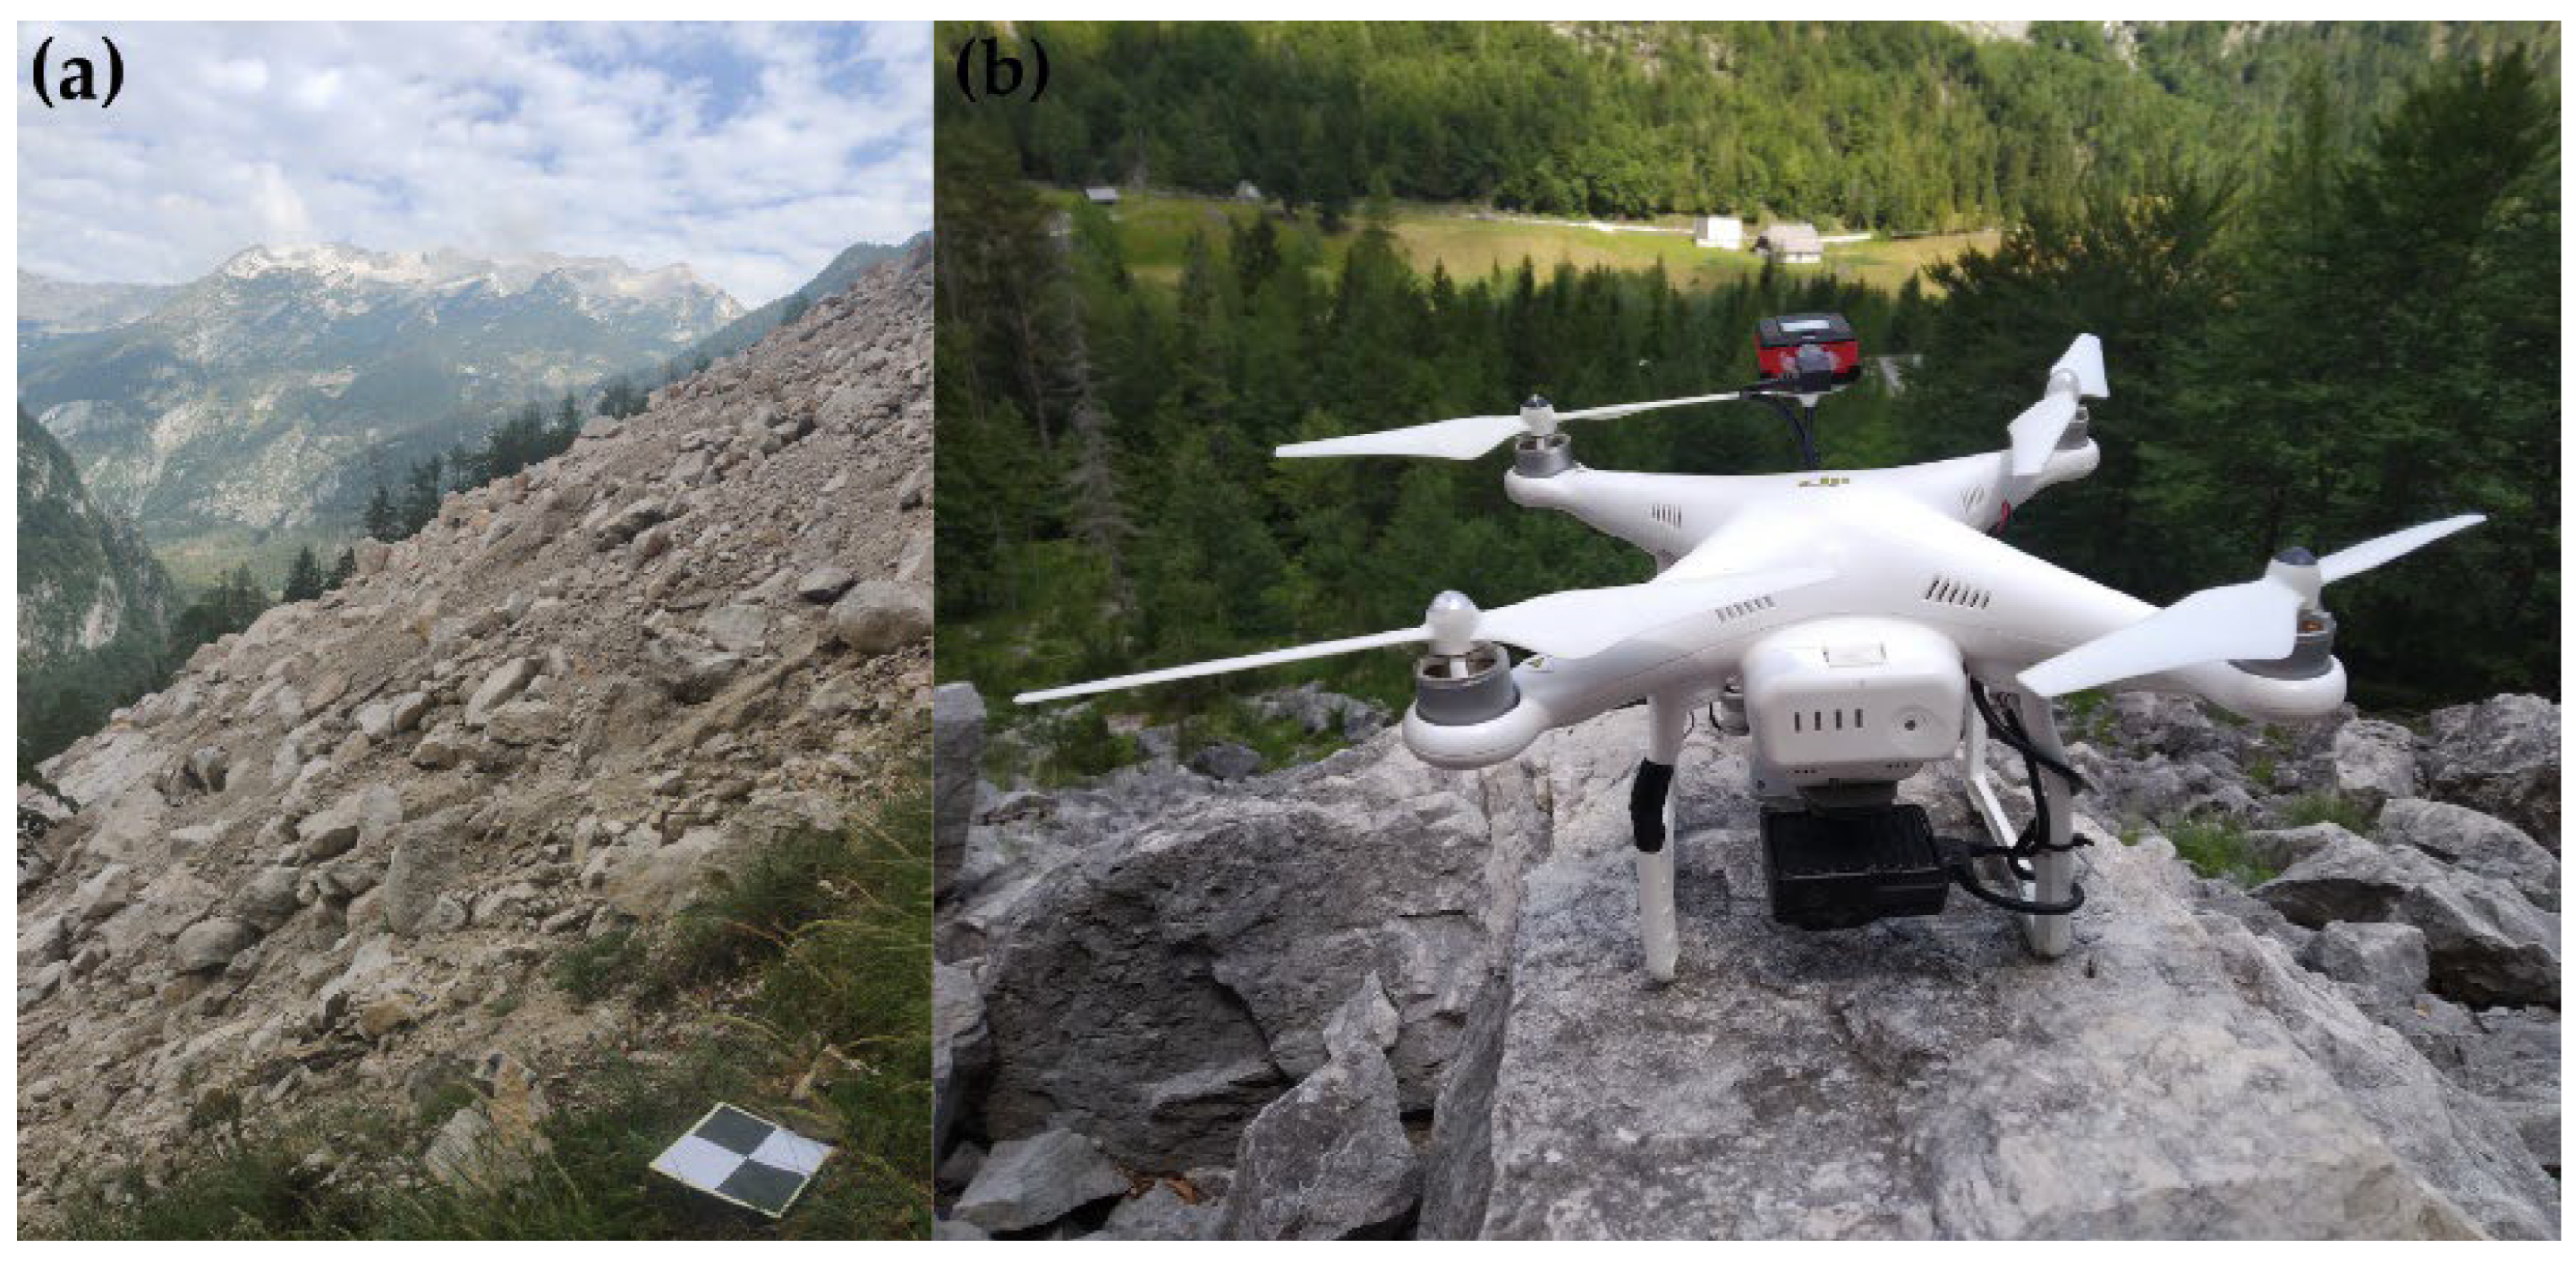
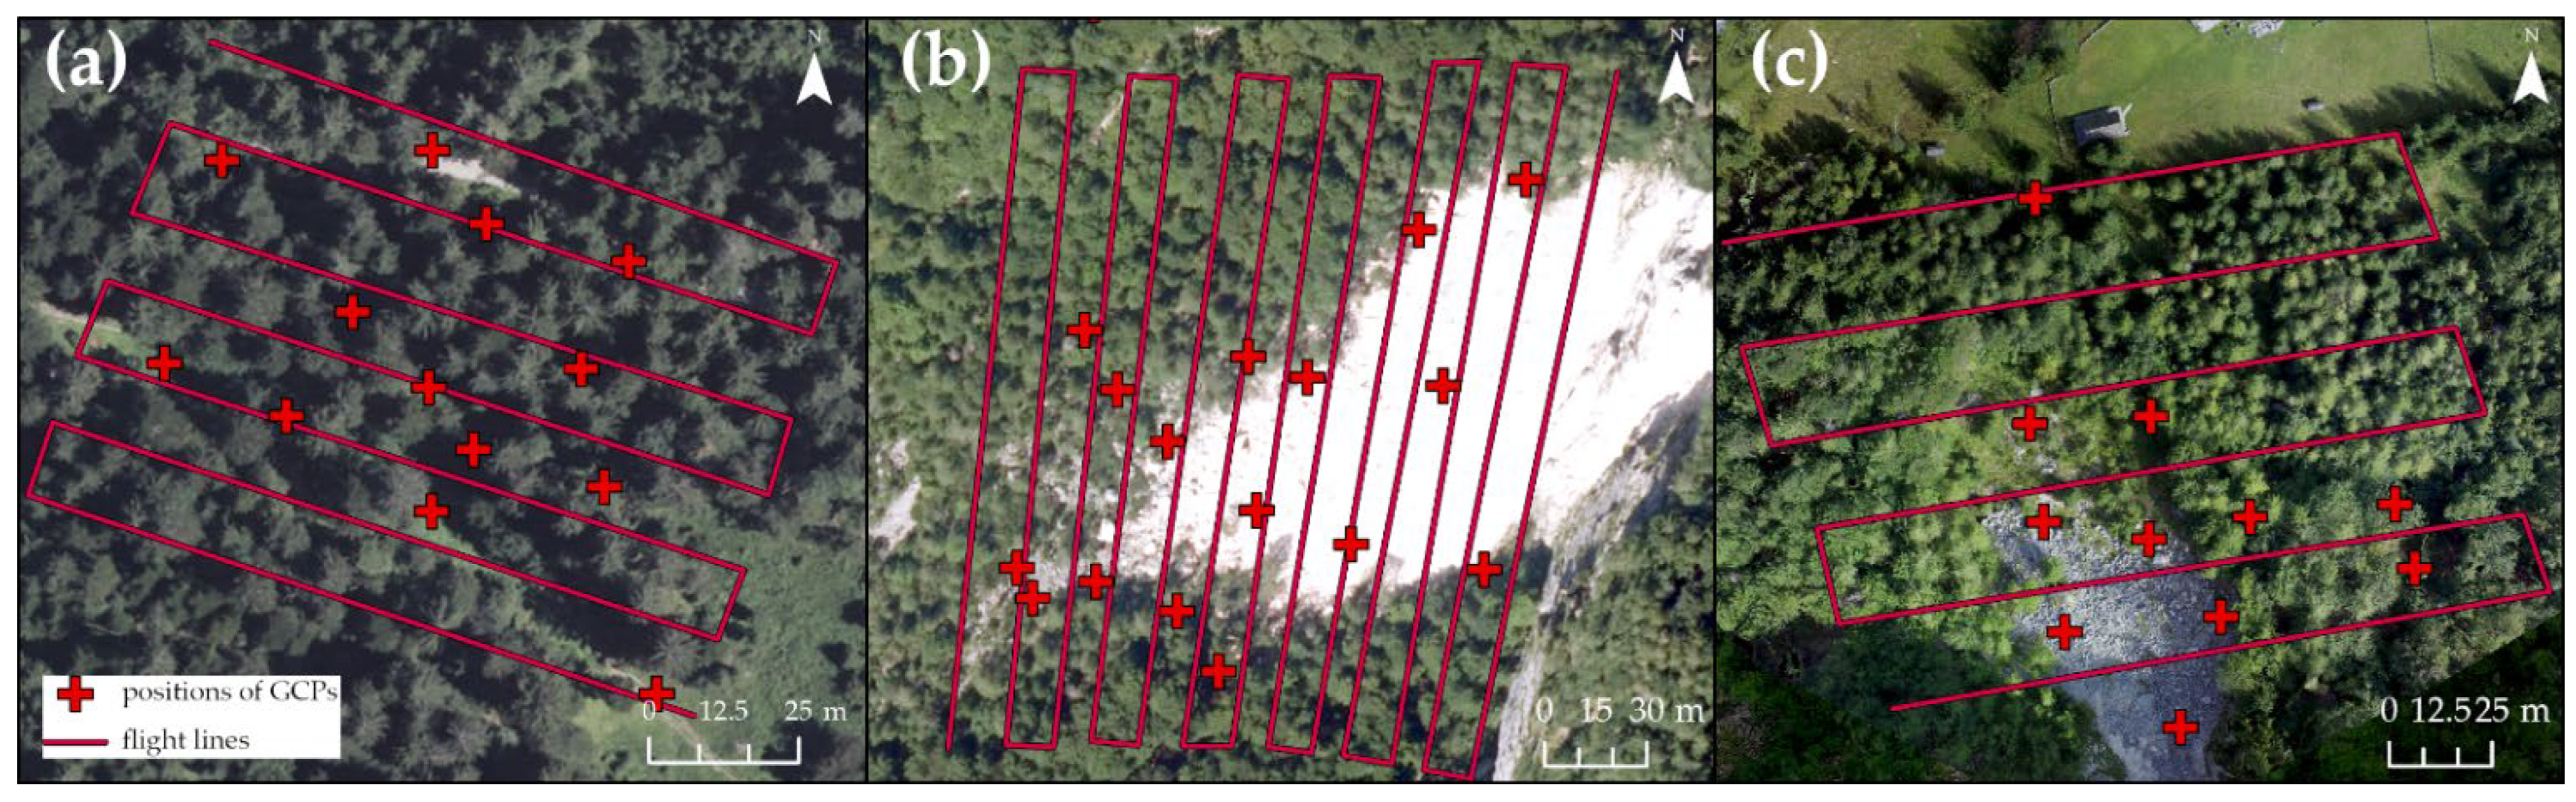
2.3. UAV Image Acquisition

Multispectral data were collected with the Parrot Sequoia multispectral sensor with RGB camera [67] mounted on the DJI Phantom 3 UAV (Figure 4). The camera was designed to support vegetation studies and therefore provides imagery in four narrow bands, namely green (530–570 nm), near-infrared (790 ± 40 nm), red (660 ± 40 nm), and red edge (735 ± 10 nm), via separate imaging sensors that operate simultaneously. The monochrome sensors have a focal length of 3.98 nm and a resolution of 1280 × 960 pixels. In addition to the main camera, the Parrot Sequoia has the second sensor—a sunshine sensor that calibrates the measured spectral radiation by the main sensor. Combined with Pix4D software, the Parrot Sequoia provides absolute reflectance calibration measurements without the need to use a radiometric calibration target. A fully integrated sunshine sensor captures and logs the current lightning conditions and automatically calibrates outputs of the camera so that the measurements are absolute, and the evaluation of collected data is more consistent [68].
The multispectral images were obtained in different time periods for each rockfall. At the Jelovica site, the UAV survey was conducted in the same year the injuries were inflicted on the trees, on 16 August 2019. At the Kekec site, the UAV survey was conducted six years after the rockfall events, on 3 July 2018. At the most active rockfall site, Cerkev, multiple UAV surveys were performed. The first one was one year after the first injuries, on 4 July 2018; the second survey was on 15 August 2019, and a third one was on 14 August 2020. In order to minimize variations in the solar angle and to prevent shadow cast, the flights were performed between 11 am and 3 pm [69]. The UAV surveys were executed manually (Figure 5). The survey was carried out with the side and front overlap of at least 80%–60%, while the flight height was approximately 80 m, and images were taken in nadir angle. Given the steep terrain, we planned the flights accordingly to the elevation changes based on a digital elevation model (generated from lidar data) with a resolution of 1 m. Before the flights, the ground control points (GCPs) were set throughout the surveyed area and were measured with real kinematics GNSS receiver, namely using the Leica Zeno20 with GG04 Smart Antenna, which provided accuracy of individual points between 0.010 and 0.030 m.

2.4. Processing of UAV Data

The multispectral images were processed using Pix4DMapper (Version 4.6.4) by Pix4D (Prilly, Switzerland) [70]. Three main products were produced with it: (i) point clouds, (ii) digital surface models, and (iii) multispectral reflectance orthomosaics. Multispectral images were loaded into Pix4D as a multispectral camera where camera GPS data and calibration and radiometric parameters are recognized. Initial aerial triangulation was performed based on GNSS data of images provided by the Sequoia Camera and the onboard inertial measurement unit. The ground control points (GCPs) were measured manually (Figure 4). Orthomosaics for individual bands (green, near-infrared, red, and red edge) were calculated for each site and were resampled to the same resolution—11 cm.
Based on the orthomosaics of individual bands, different VIs were calculated. VIs were chosen based on the possibility of their calculations due to the camera bands and the common use of the indices in the literature [71]. We wanted to test a variety of indices to determine the most promising ones and their characteristics. The list containing the full names of all VIs and their formulas for calculation is available in Appendix A. VIs that were used for separation between injured and uninjured trees can be divided as conventional ratios or differential indices (IRVI, RVI, DVI, GVI, and GRVI and VREI, RTVI, MTCI, CIrdg, and CIg) and indices corrected and derived from the traditional indices (normalized difference VIs—NDVI and NRVI and GNDVI, ReNDVI, and NDVIrdg) [72]. VIs provide an abstract number that in every pixel reproduces the relationship between the bands used. In addition to the VIs, we also used all spectral bands in the analyses.

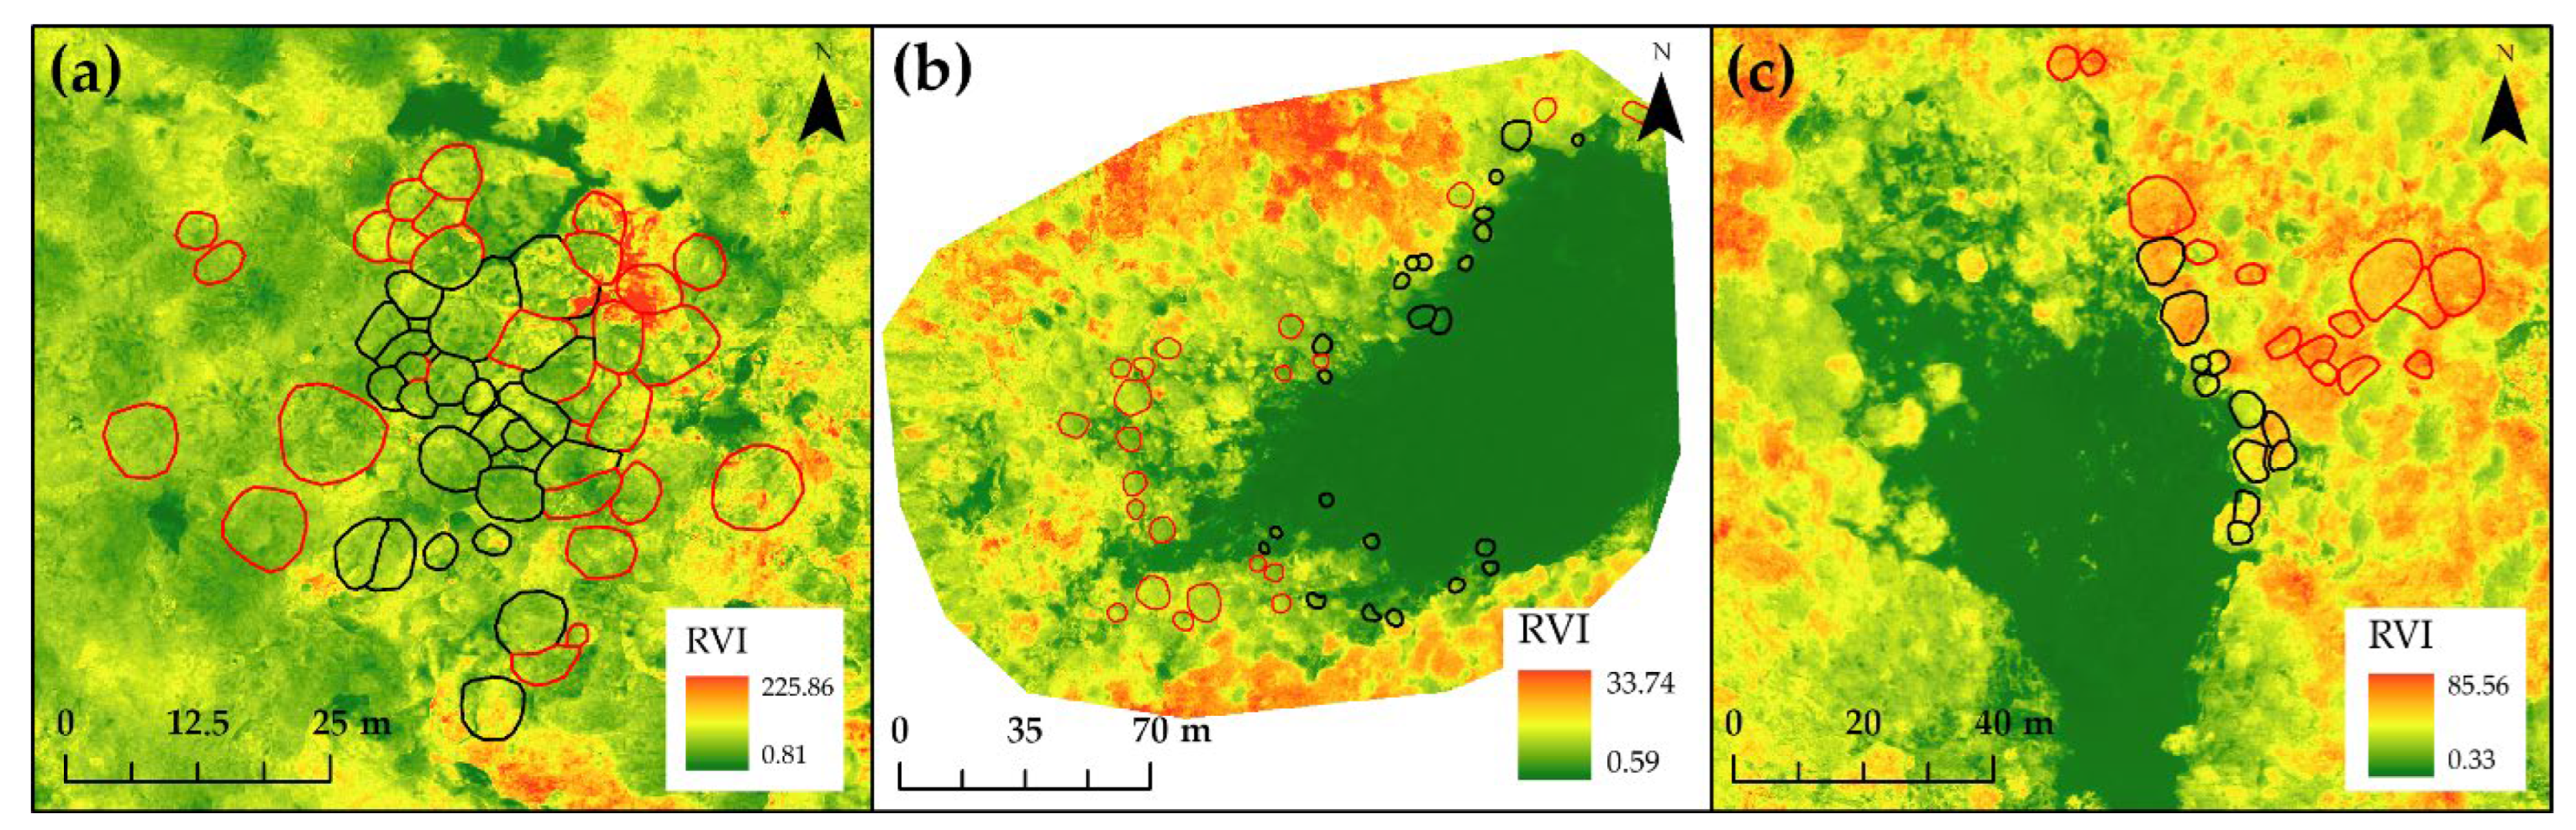
2.5. Identification of Tree Crowns from UAV Data and Statistical Analysis

The primary goal of this study was to identify injured trees due to rockfall impacts; therefore, we focused our analyses on two main groups of data—injured and uninjured trees. Individual tree crowns for injured and uninjured trees were identified based on their measured positions in the field with GNSS and by using RGB and multispectral orthomosaics. To achieve a precise identification of tree crowns, they were manually digitized using ArcGIS Pro 2.7.3 (Esri, Redland, CA, USA) [73]. Both mosaics were used in parallel as the basemaps to draw the precise extent of the tree crown. We did not use automatic extraction of the tree crown based on the pixel- or object-based methods since the extent of the crowns was mostly overestimated due to the high tree density, and the final results would not be representative. Consequently, we decided to manually digitize the tree crown. The calculated VI values were later extracted based on the tree crowns [44].
The calculation of VI values per tree crown was performed based on two approaches. As part of the first approach, we calculated VI values per tree crown based on decile values of all raster cell values of VIs that corresponded to the selected tree crowns. Since we had multiple surveys from the Cerkev site, we only used the first survey data (4 July 2018) in this part of the analysis. The second approach included only data for the Cerkev site where we included the data from all three surveys performed. For each separate year, we calculated VIs per tree crown as a mean value of all raster cell values in individual tree crowns [74,75,76]. Then we cumulated (sum) [77] all mean VIs per tree crown in different time series combinations (2018–2019; 2019–2020; 2018–2020; and 2018–2019–2020). The purpose of these results was to observe if the cumulative value of VIs can better explain the difference between injured and uninjured trees and if VI values (tree vitality) would change through time. In the case of both approaches, we used a regression model with categorical variables as an independent variable (injured or uninjured trees) that were employed to determine if it is possible to predict VI values for trees crowns (dependent variable) that have been injured due to rockfall activity by different tree species. The results are explained by the coefficient of determination R2 as a statistical measure that represents the portion of the variance of a dependent variable that could be explained by the categorical independent variable.
In the second part of the results, we focused on injury categories using the same type of regression models with the exception that the independent variables were injury groups, and the dependent variable was a VI that was proven to explain the most variance in the first part of the analyses. Firstly, we analyzed the categories of injuries that were even present at each rockfall site (according to the injuries described in Section 2.2), and based on that, we divided them into different injury groups, separately for each rockfall site since the categories of injuries vary. The aim was to split the injuries in the groups that would represent injuries that are generally less and more severe to affect a tree’s vitality. Lastly, we used a regression model to see the relationship between the so-called injury index, which represents the ratio between the area of the injury (m2) and the basal area of the tree (m2) and VI by injured broadleaved trees and coniferous trees. The size of the injury was calculated based on the measurements from the field and the shape (geometry) of the injury. All statistical analyses were performed in R [78].

3. Results

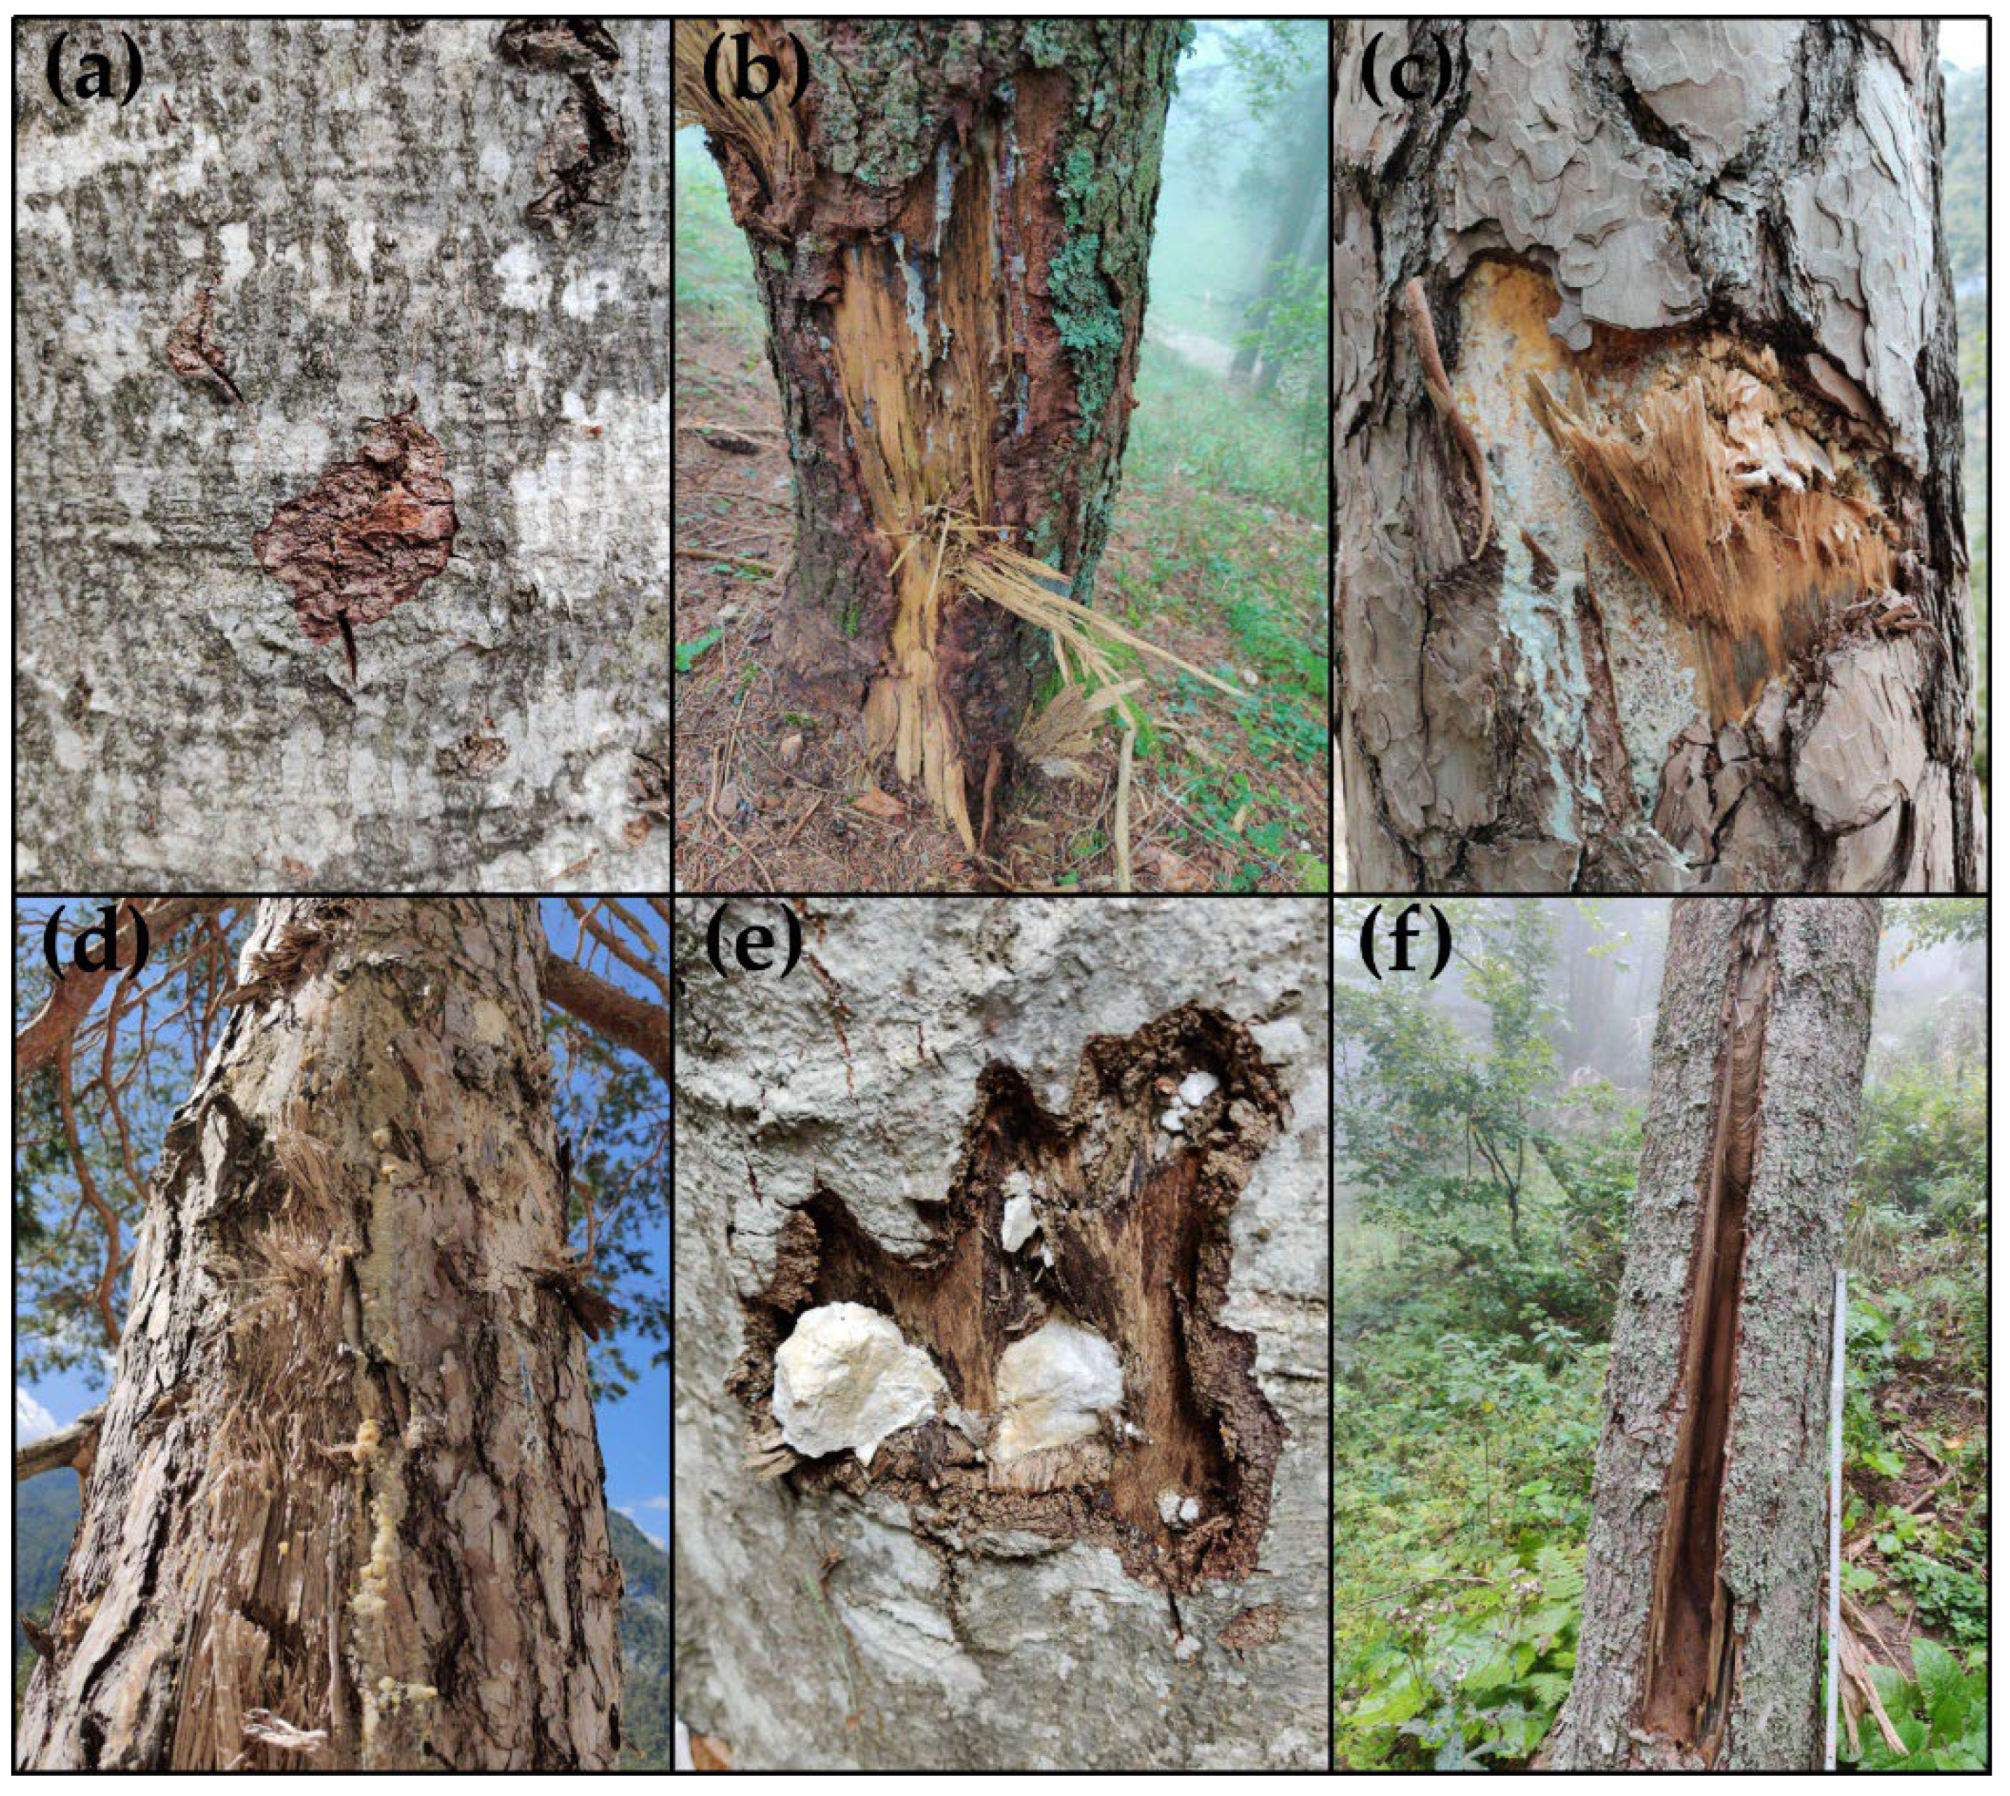
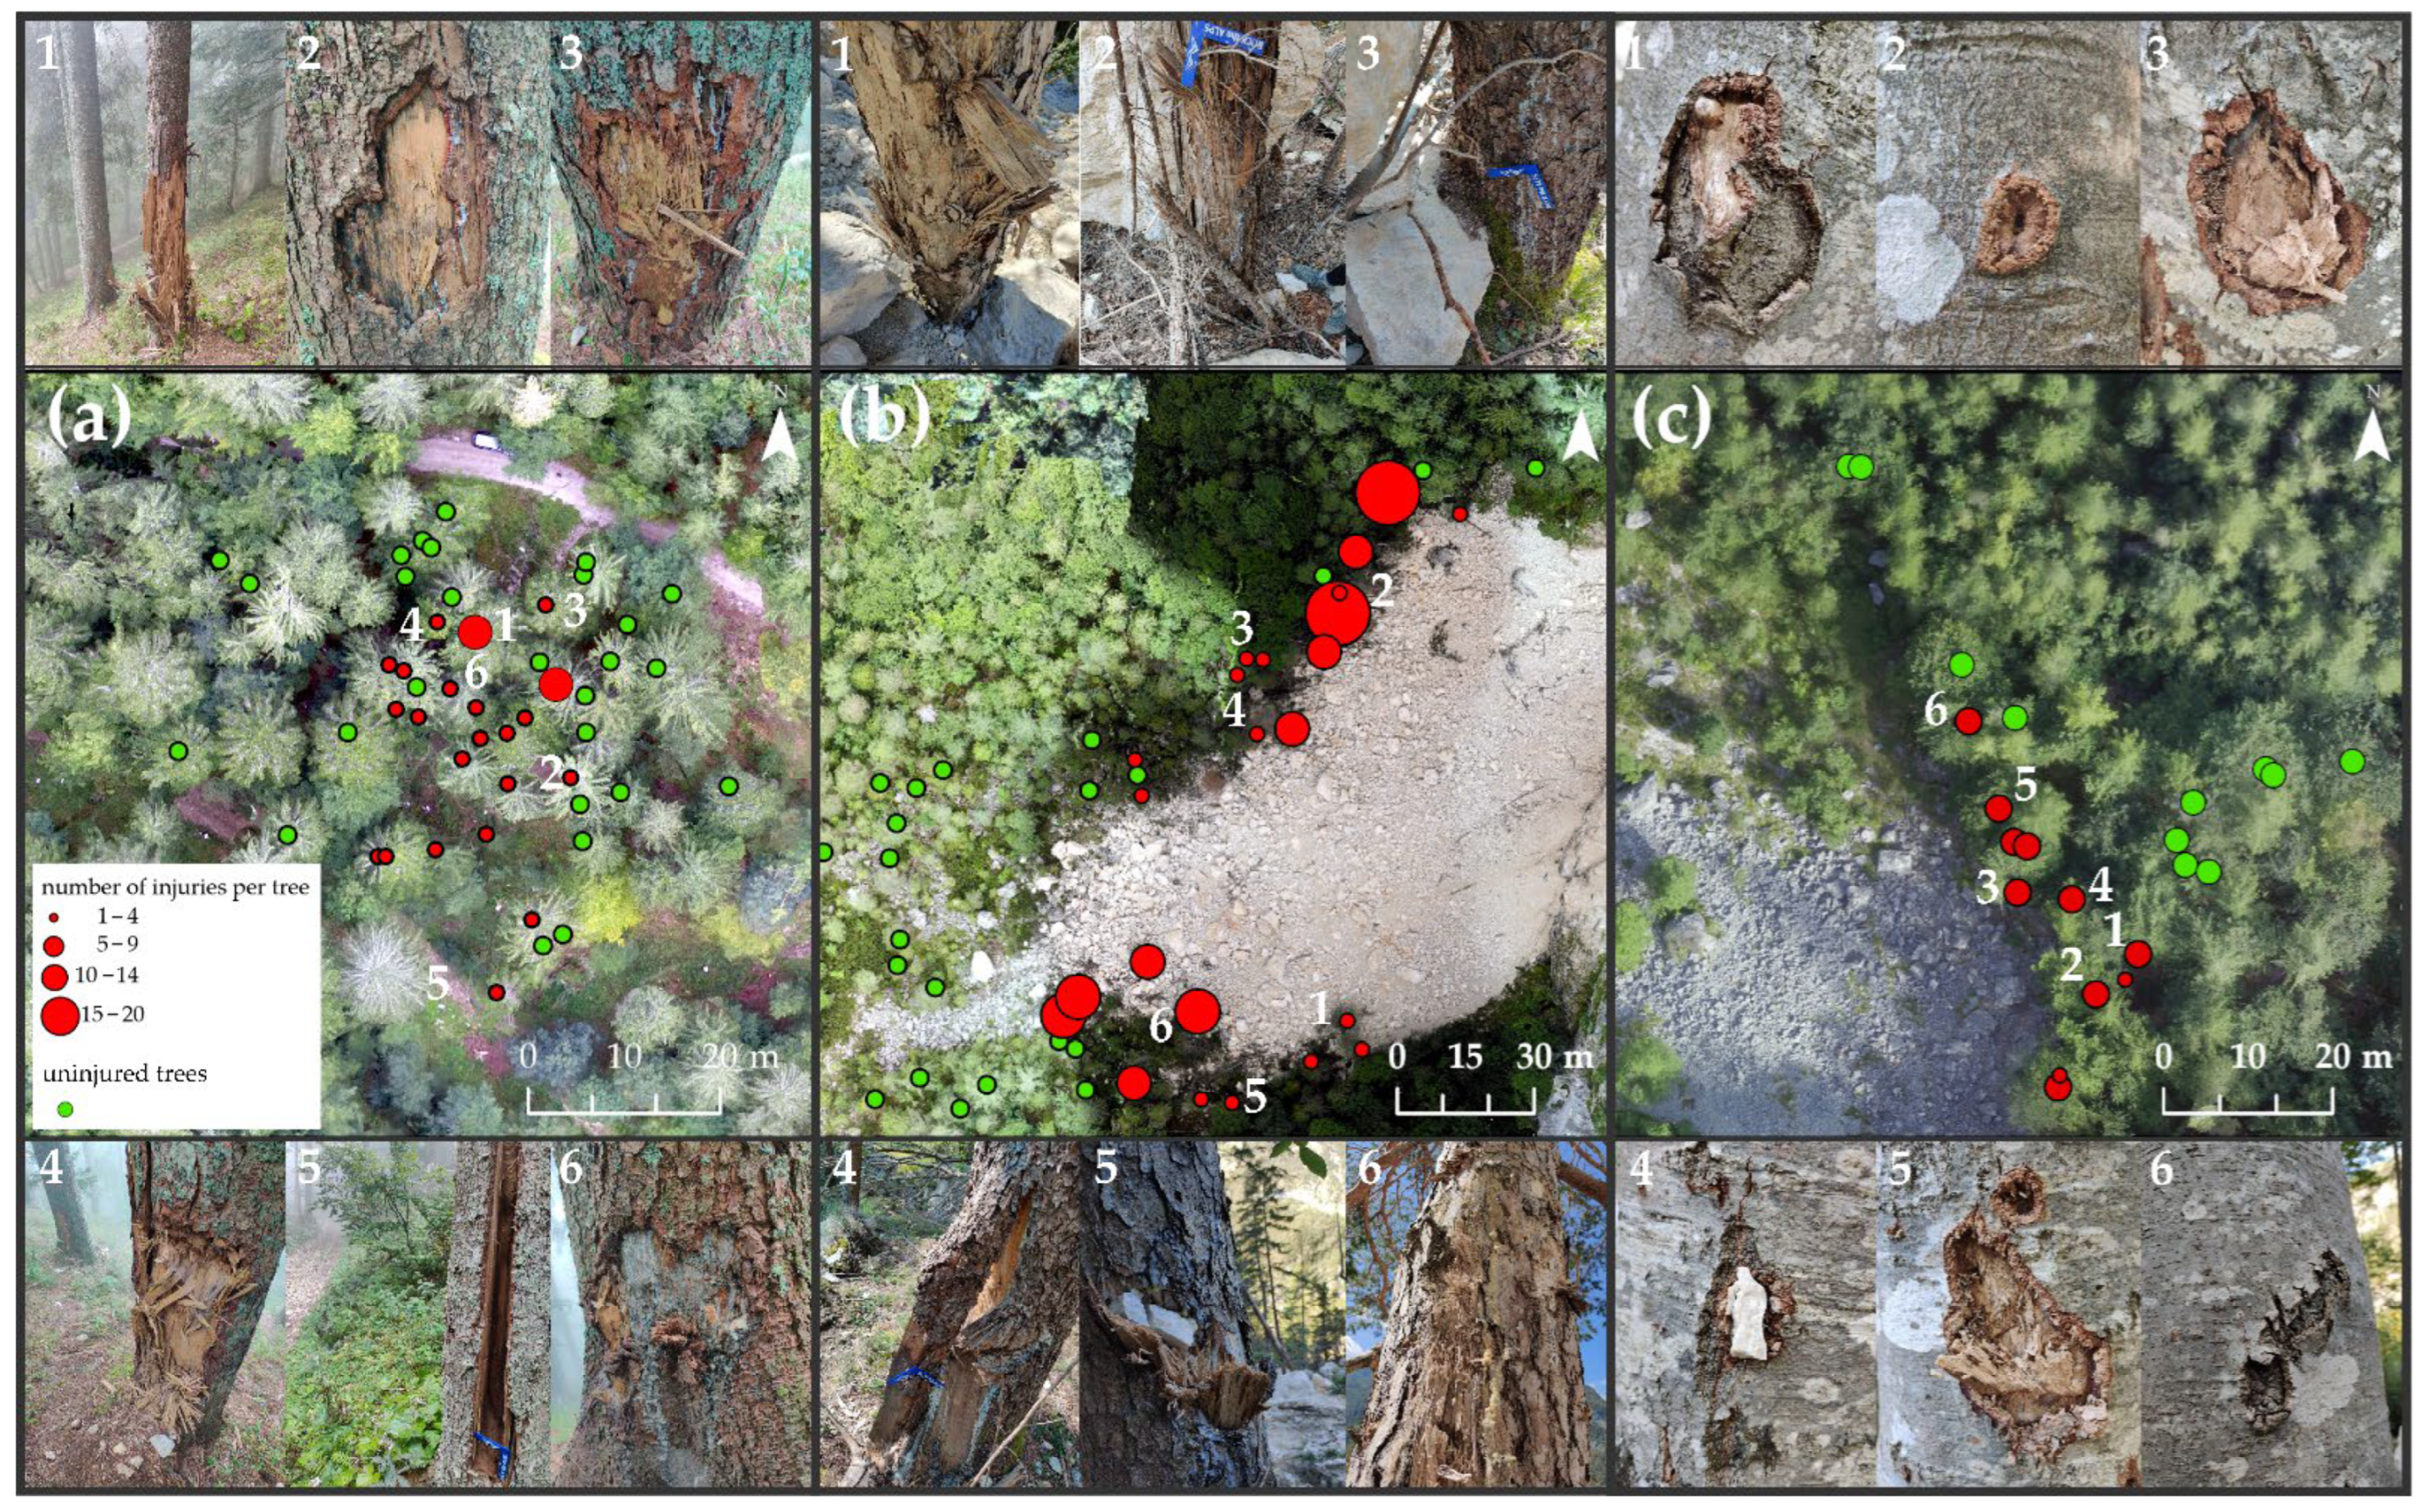
3.1. Short Overview of Tree Injuries

Study sites are characterized by different injuries due to rockfall activity (Table 3). The largest number of recorded injuries were at the Cerkev site (125), while Kekec and Jelovica had similar numbers (61 and 55) (Figure 6). The minimum number of injuries per trees was 1 at Cerkev and Jelovica, while at Kekec, at least four injuries were recorded at each tree. The average height of injuries was the highest at the Cerkev site (182 cm), which also had the highest maximum-recorded injury (750 cm), while at the other two sites, the average height of injuries did not exceed 1 m.
Different injury categories could be present at one tree. At the Jelovica and Kekec sites, the majority of the trees had up to three different injury categories per tree (with the Jelovica site having mostly two categories of injuries per tree). The most injury categories per tree were found at the Cerkev site (up to six), and the majority of trees had three or more injury categories per tree. The shape of the injuries was similar at all three sites—the prevailing shapes of injuries were rectangle and ellipse.

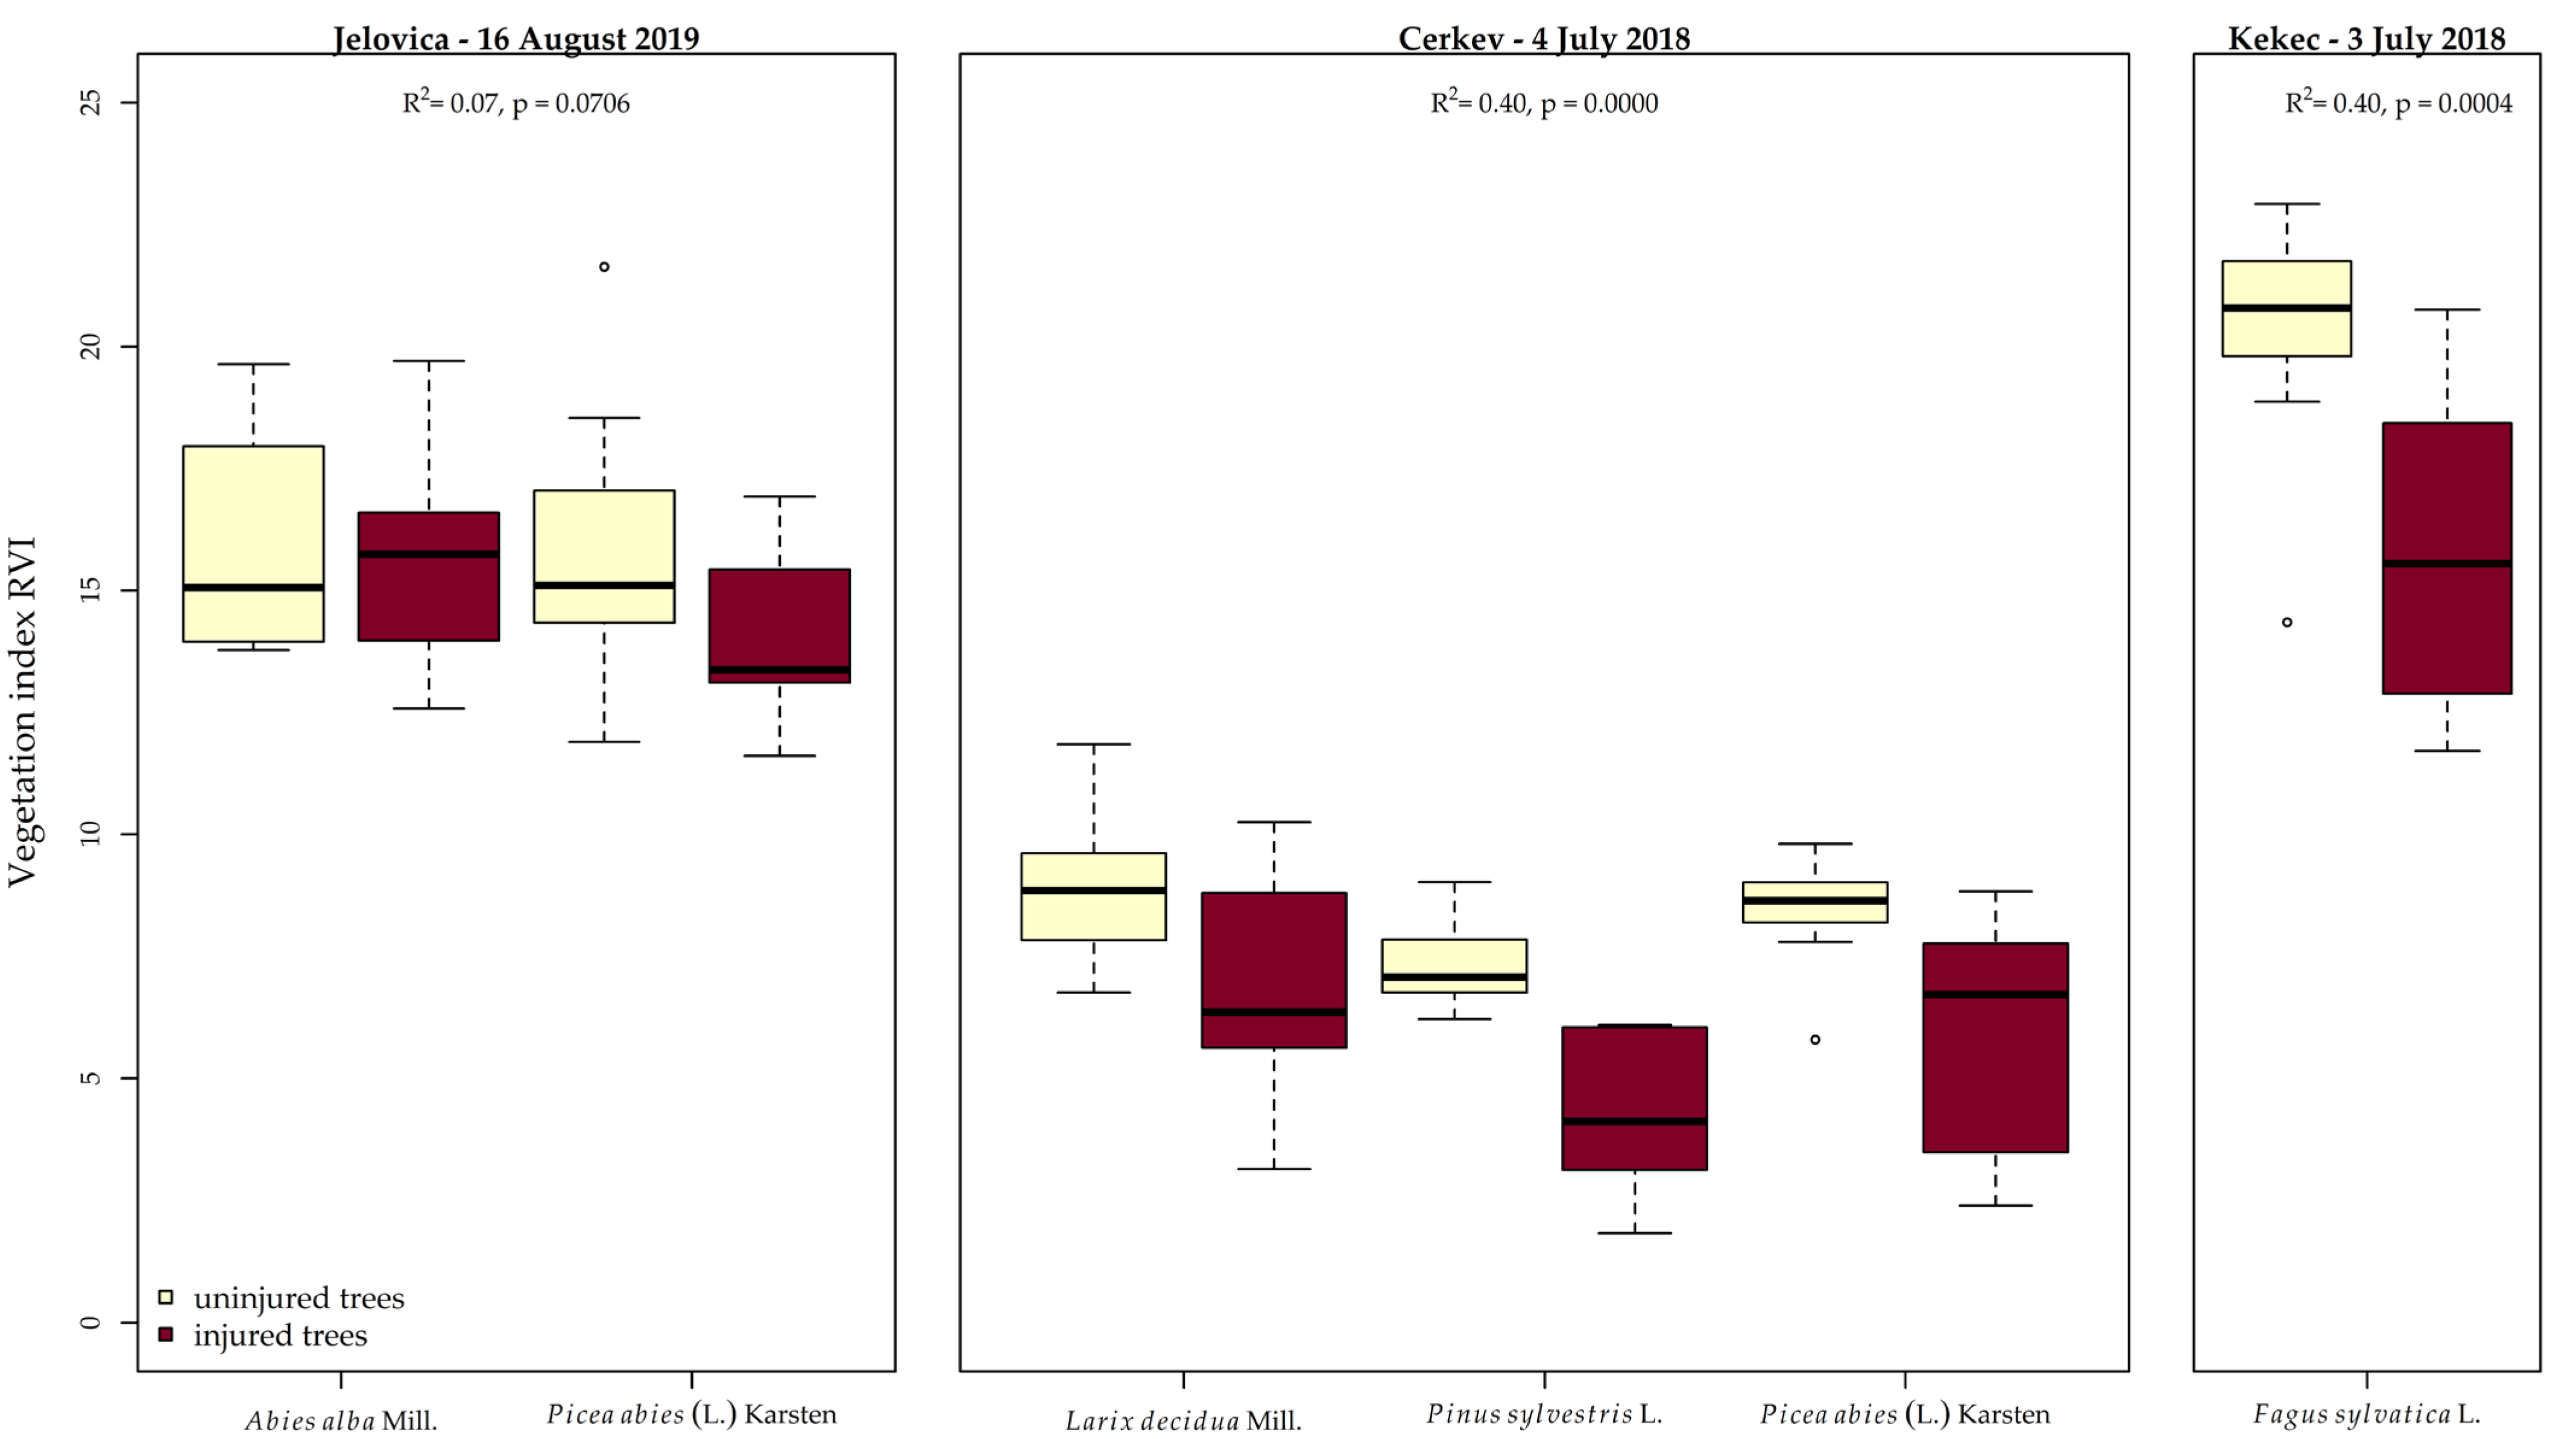
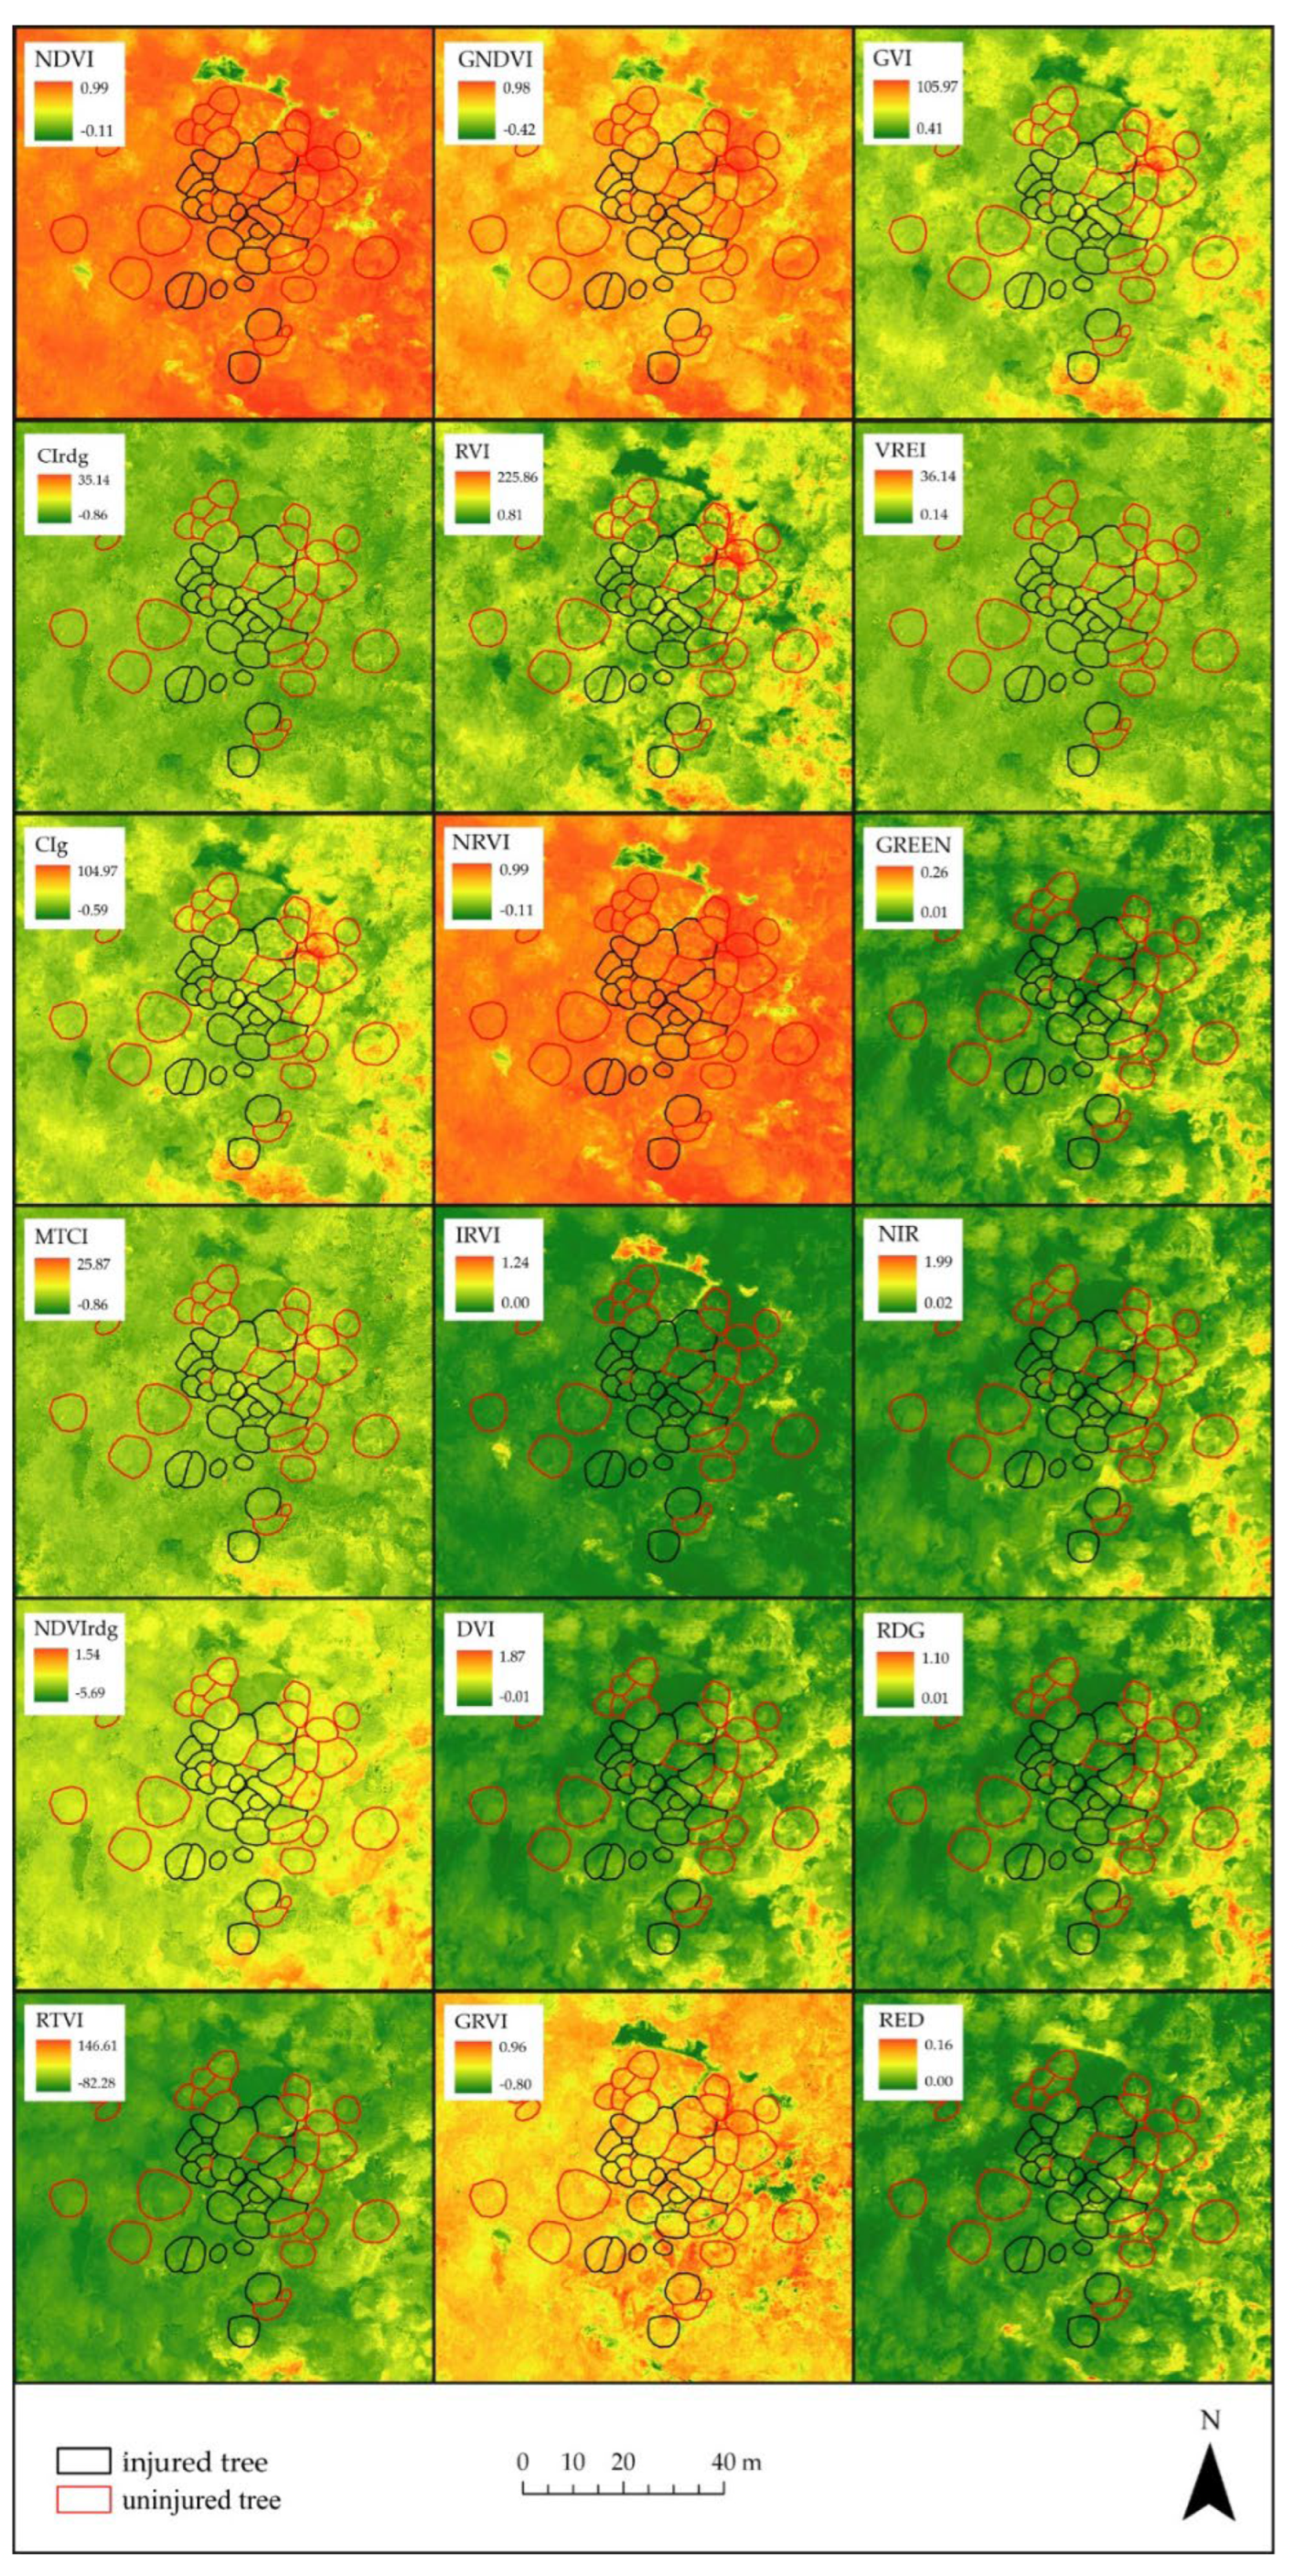
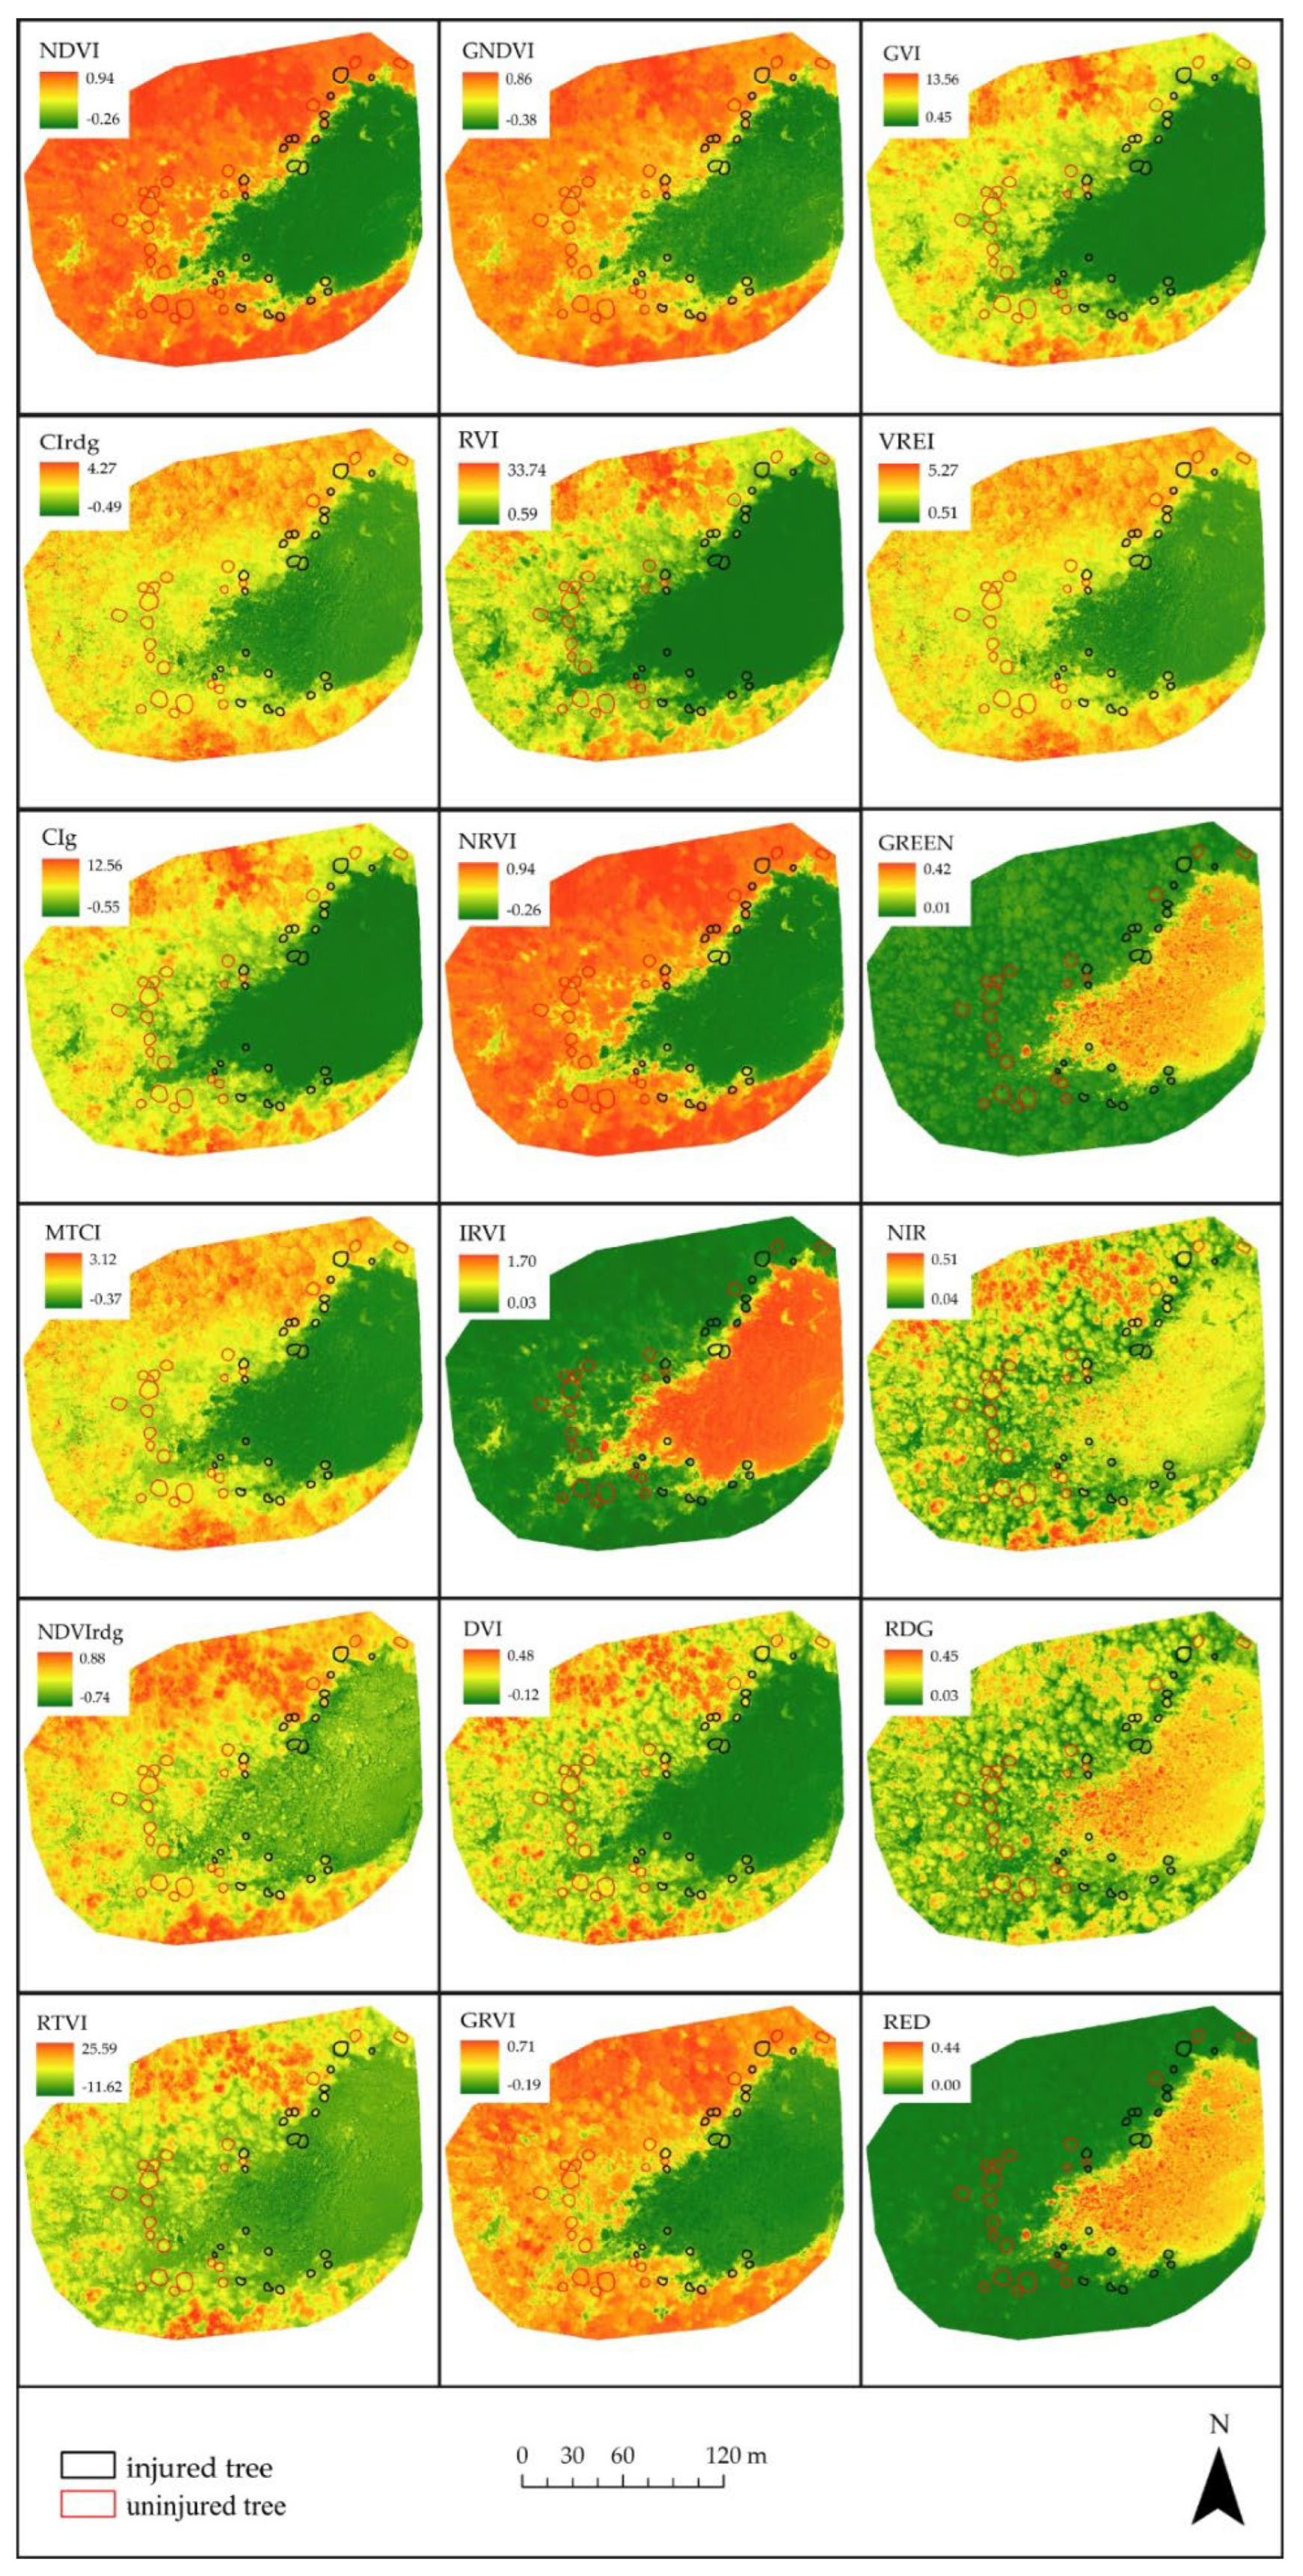
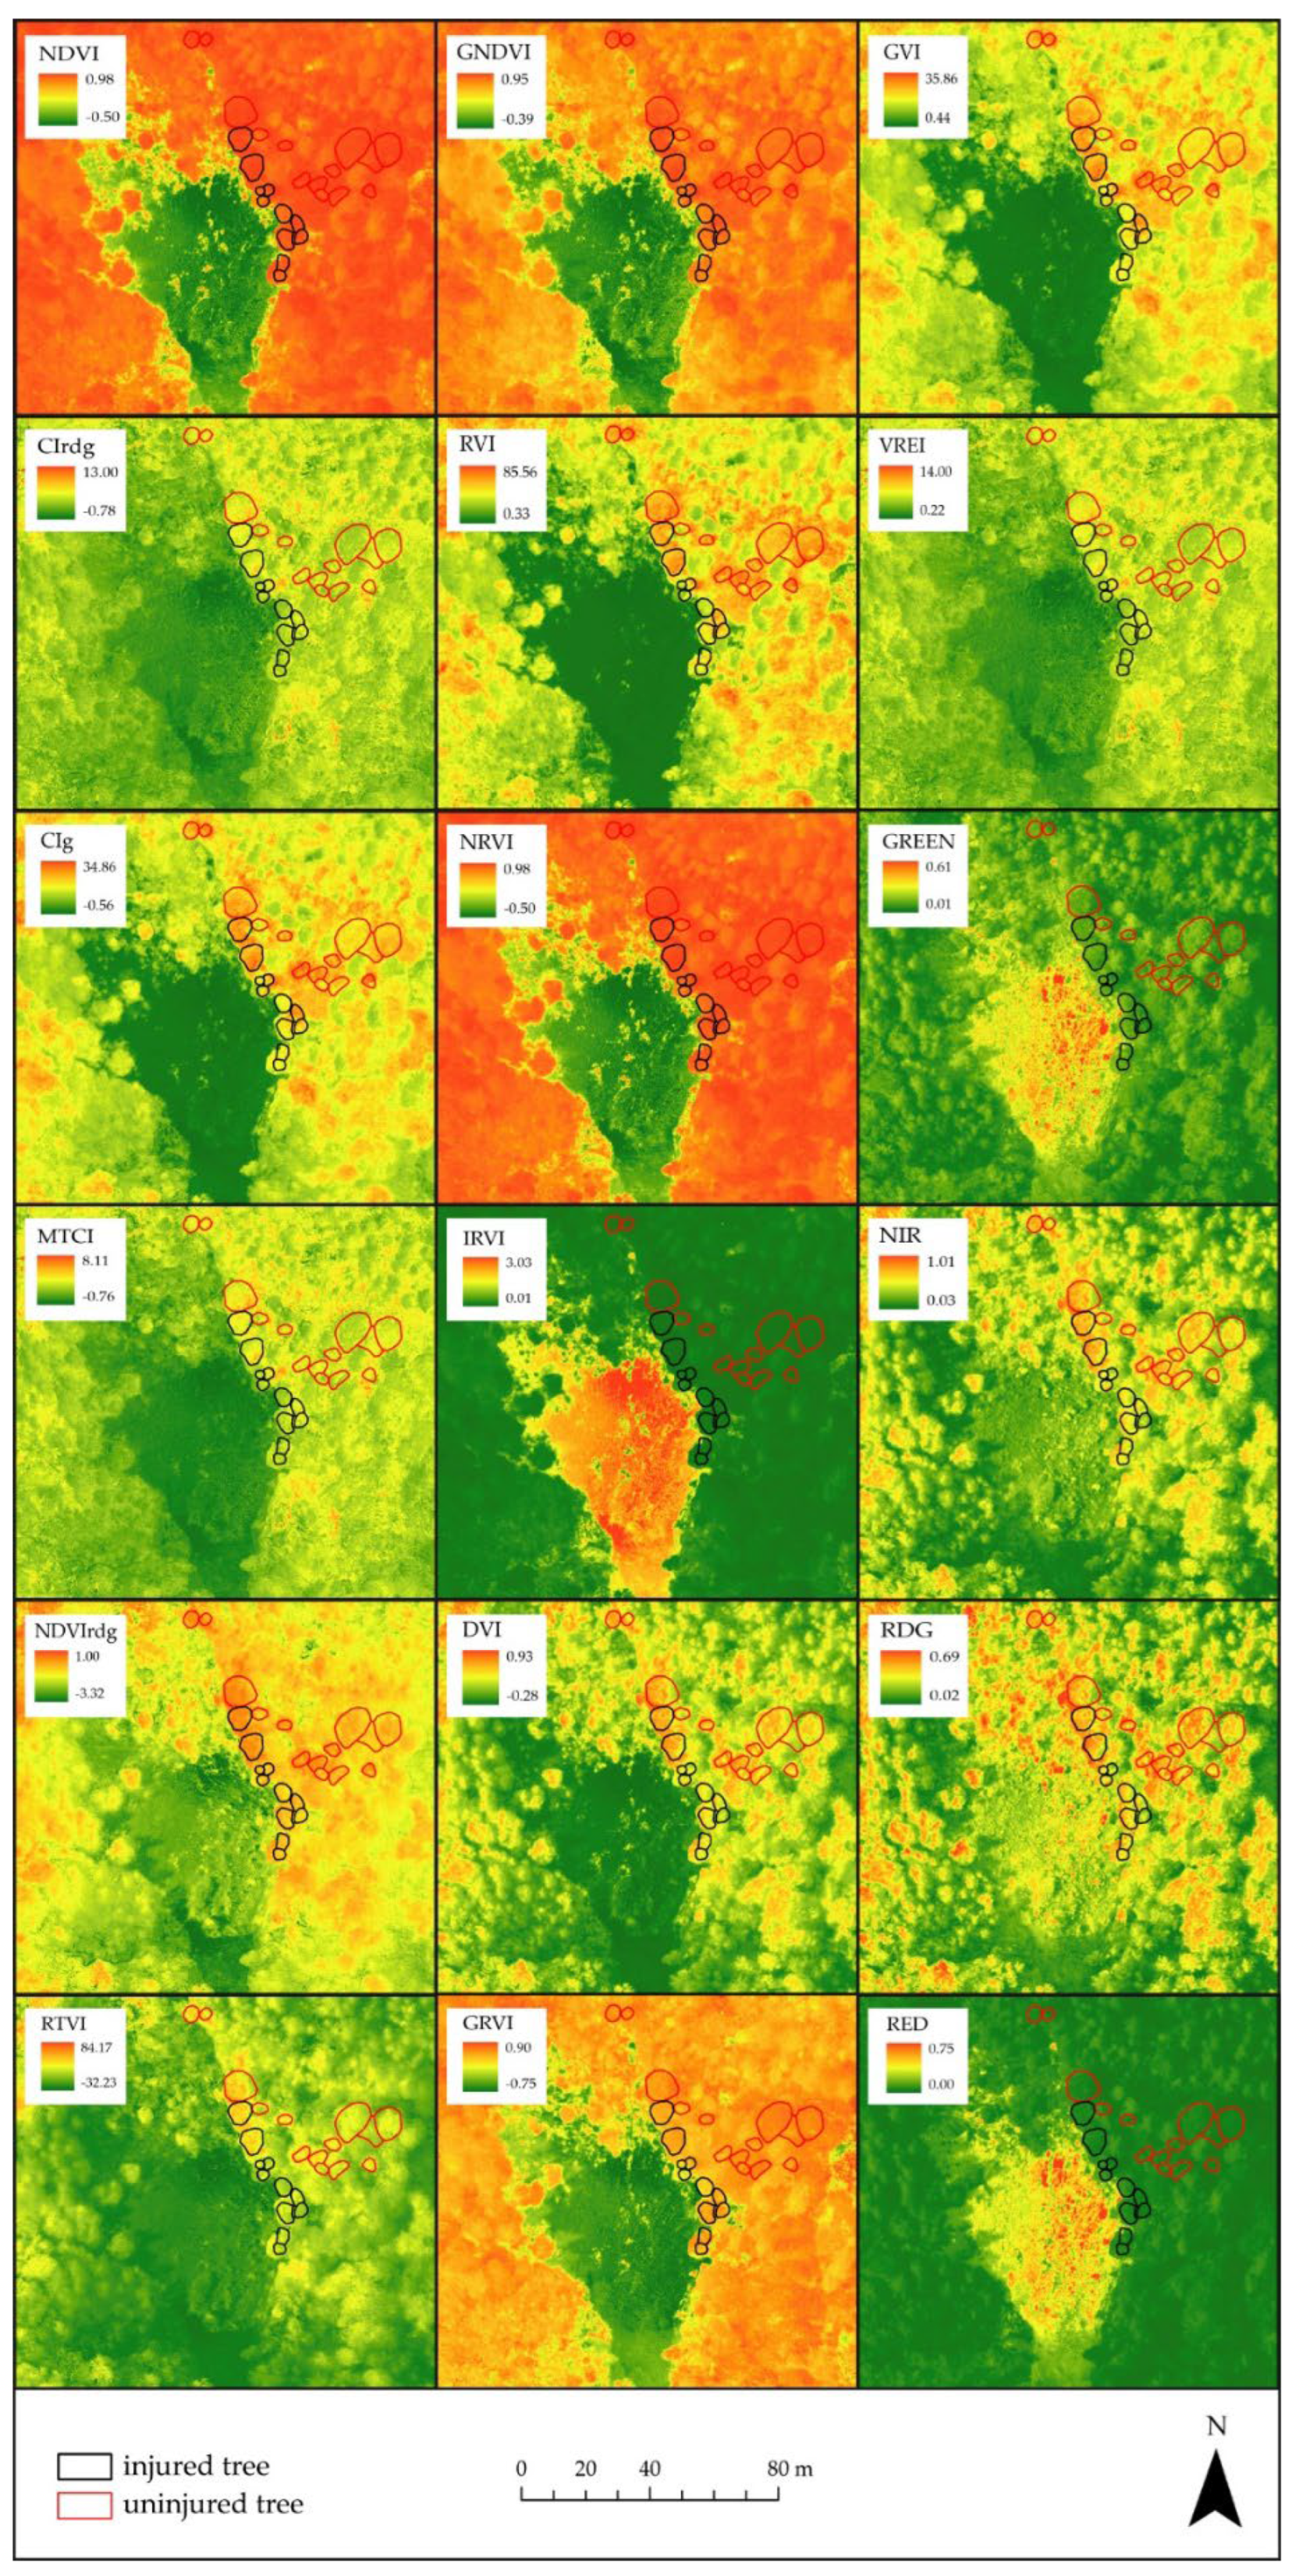
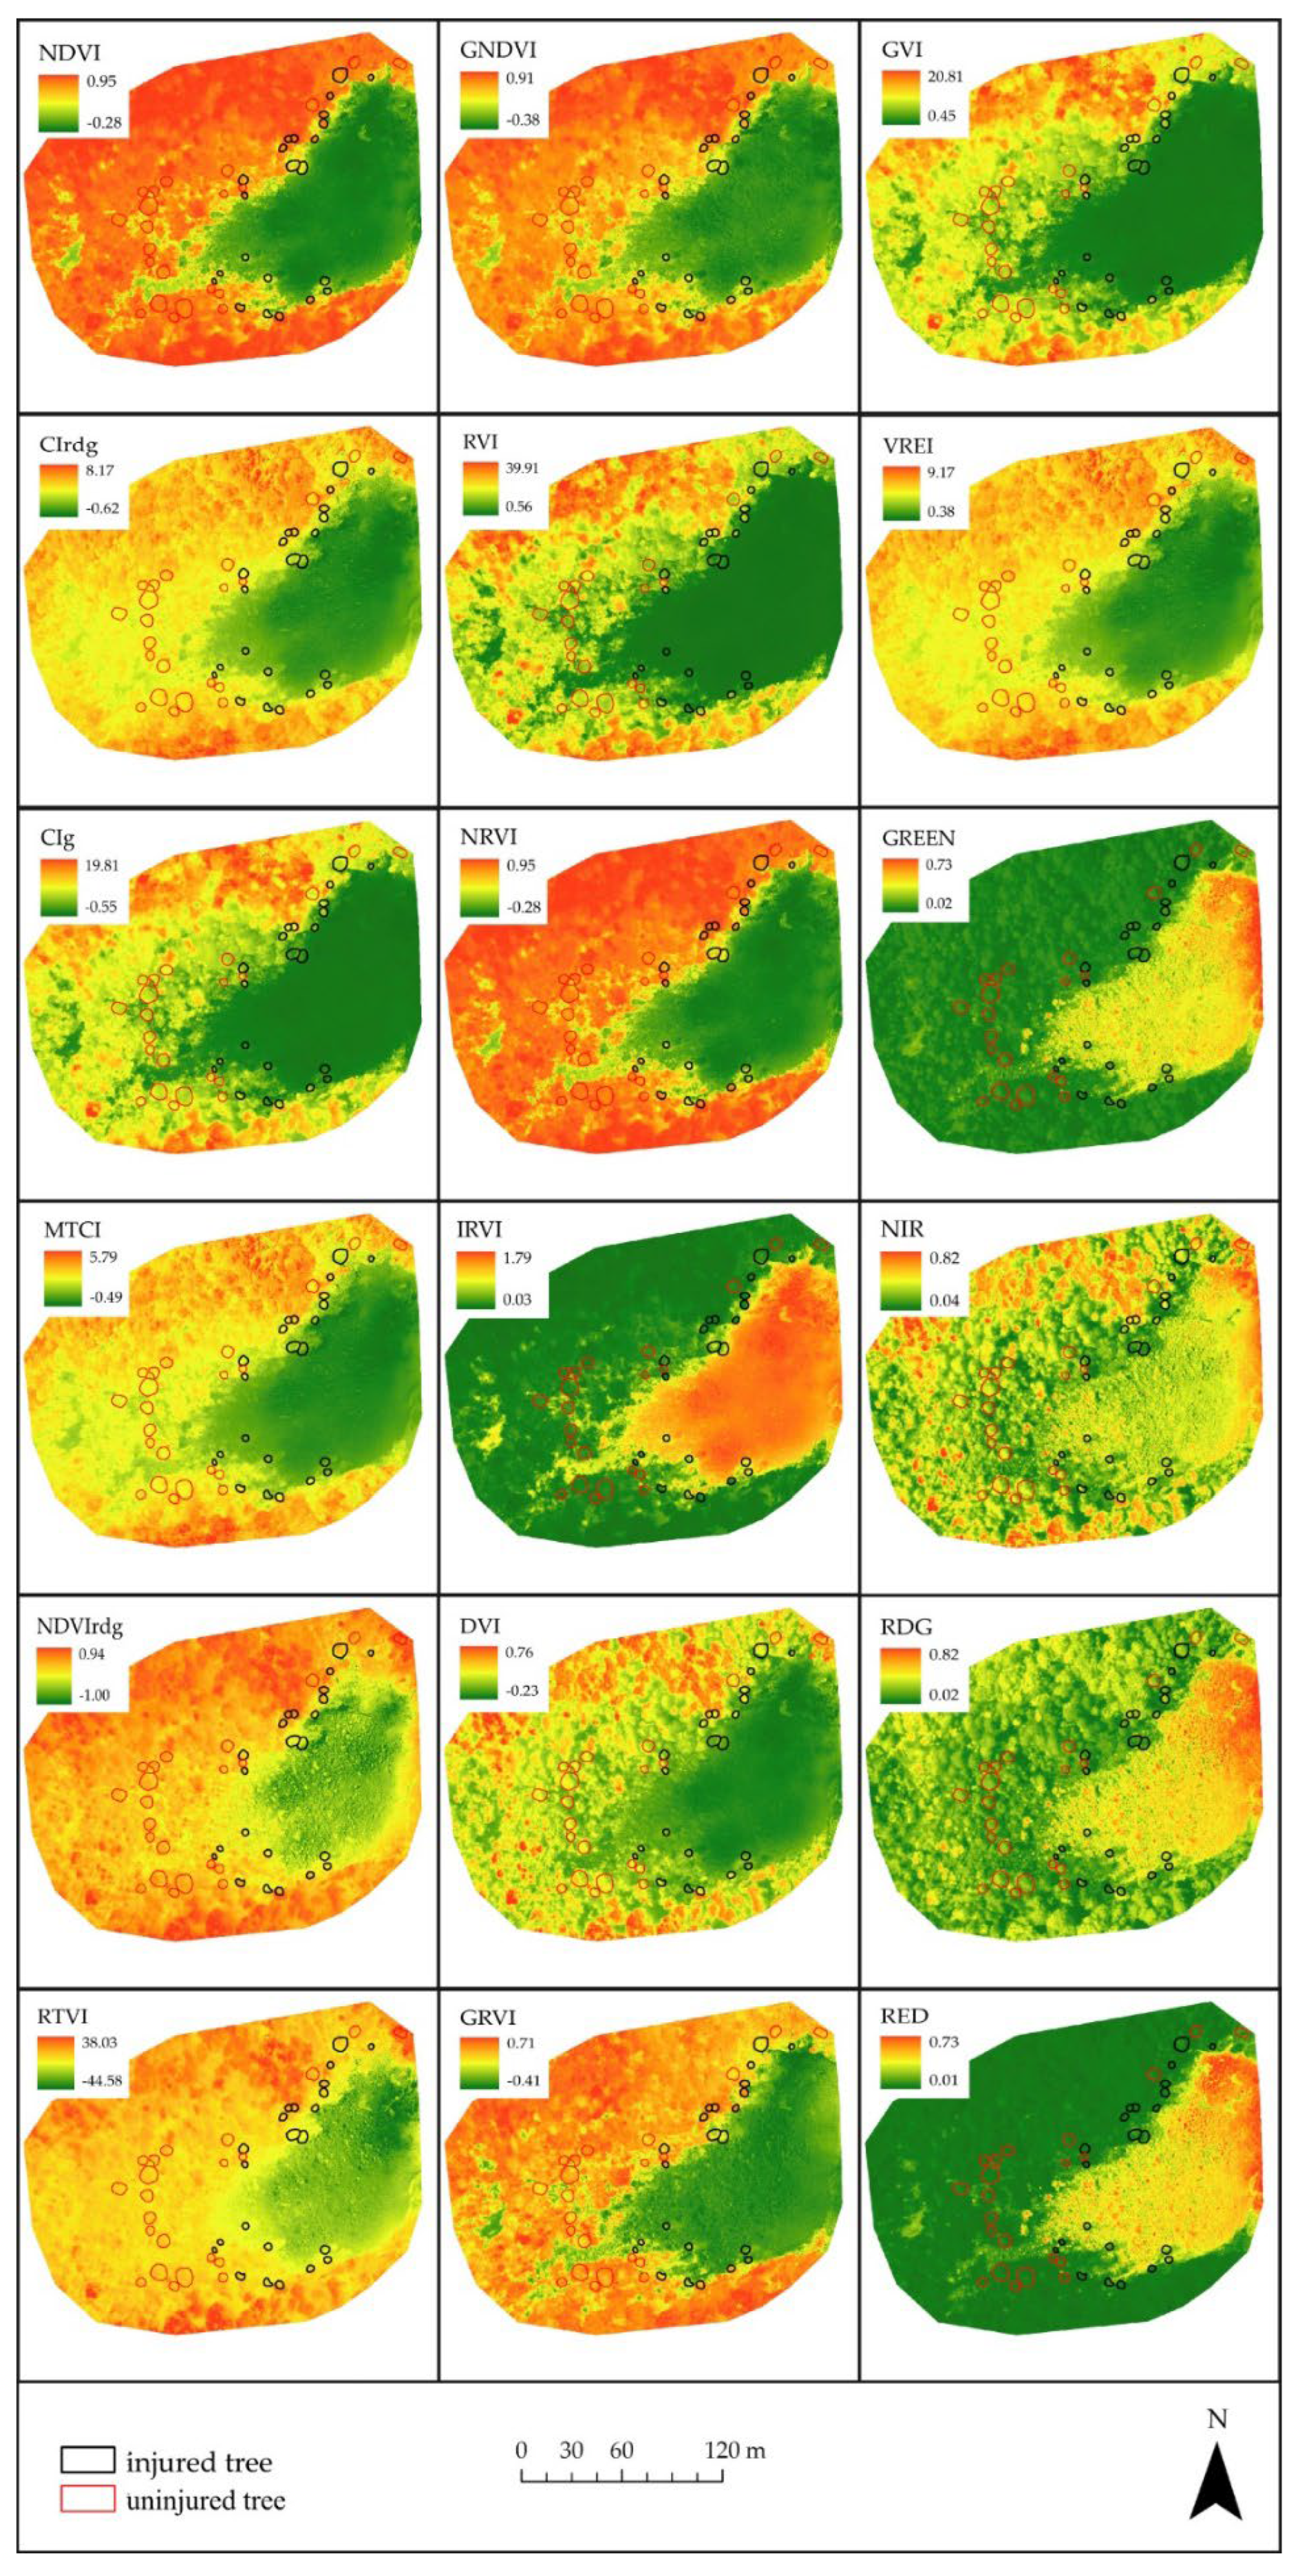
3.2. Comparison of VI Values between Injured and Uninjured Trees

All calculated VIs for all three sites are available in Appendix B, Appendix C, Appendix D and Appendix E. Figure 7 shows the results of the regression model for injured and uninjured trees for different VIs. The results are described with a distribution of results into deciles based on the mean values of VIs within the tree crown. In Figure 6, only those deciles are colored that represent a statistically significant result (p ≤ 0.05).
Observing the site with the most recent injuries—Jelovica—none of the VIs can justify the difference in VI values due to the injured or uninjured trees. The difference between the injured and uninjured trees is not statistically significant, and none of the VIs exceeds an R2 of 0.20 in any decile. On the other hand, there is a statistically significant differentiation among the groups of trees present at Cerkev and Kekec. The injuries at the Cerkev site were inflicted one year before the survey, and in the majority of VIs, there is a statistically significant difference between the injured and uninjured trees. The VIs that explain at least 30% of the variance between the injured and uninjured trees through all raster values per crown are CIg, GNDVI, GRVI, GVI, NDVI, NRVI, and RVI. The highest R2 is achieved when all raster values per crown are taken into account (d1.0). The statistically significant difference is present also at the Kekec site; however, the difference between the injured and uninjured trees is detected by fewer VIs than in the case of Cerkev. The indices that achieve R2 > 0.30 are IRVI, GRVI, NDVI, NRVI, and RVI.
The most successful VI at Cerkev and Kekec is RVI, which achieves in the case of both sites an R2 of 0.40 for a mean RVI value within tree crowns (Figure 8 and Figure 9). The mean RVI values achieve smaller values at the Cerkev site in comparison to the Kekec site, with injured trees having a lower VI value than uninjured trees. At Cerkev, the mean RVI of uninjured trees has a value of 8.24, while injured trees have a value of 5.66. The largest difference in the mean RVI value between the injured and uninjured tree species is achieved by Pinus sylvestris L. (by a value 3.05), and the smallest is with the Larix decidua Mill. (by a value of 1.96). In the case of Pinus sylvestris L., the populations of injured and uninjured trees have a completely separated range of values; they do not overlap and are statistically significantly different (p = 0.0008). Similar conclusions are valid for Picea abies (L.) Karsten (p = 0.0314), while for Larix decidua Mill., the range of values between the injured and uninjured groups of trees is overlapping; thus, a differentiation is not statistically significant (p = 0.1104).
The mean RVI value of injured trees at the Kekec site is 15.83, and it is lower than the uninjured trees by 4.66. The range of values for the injured trees is larger than in the case of the uninjured trees; their value ranges generally do not overlap (except for the outliers), and the difference between the groups is statistically significant (p = 0.0004). In the case of Jelovica, Figure 6 once more confirms that there are no statistically significant differences between the injured and uninjured trees.

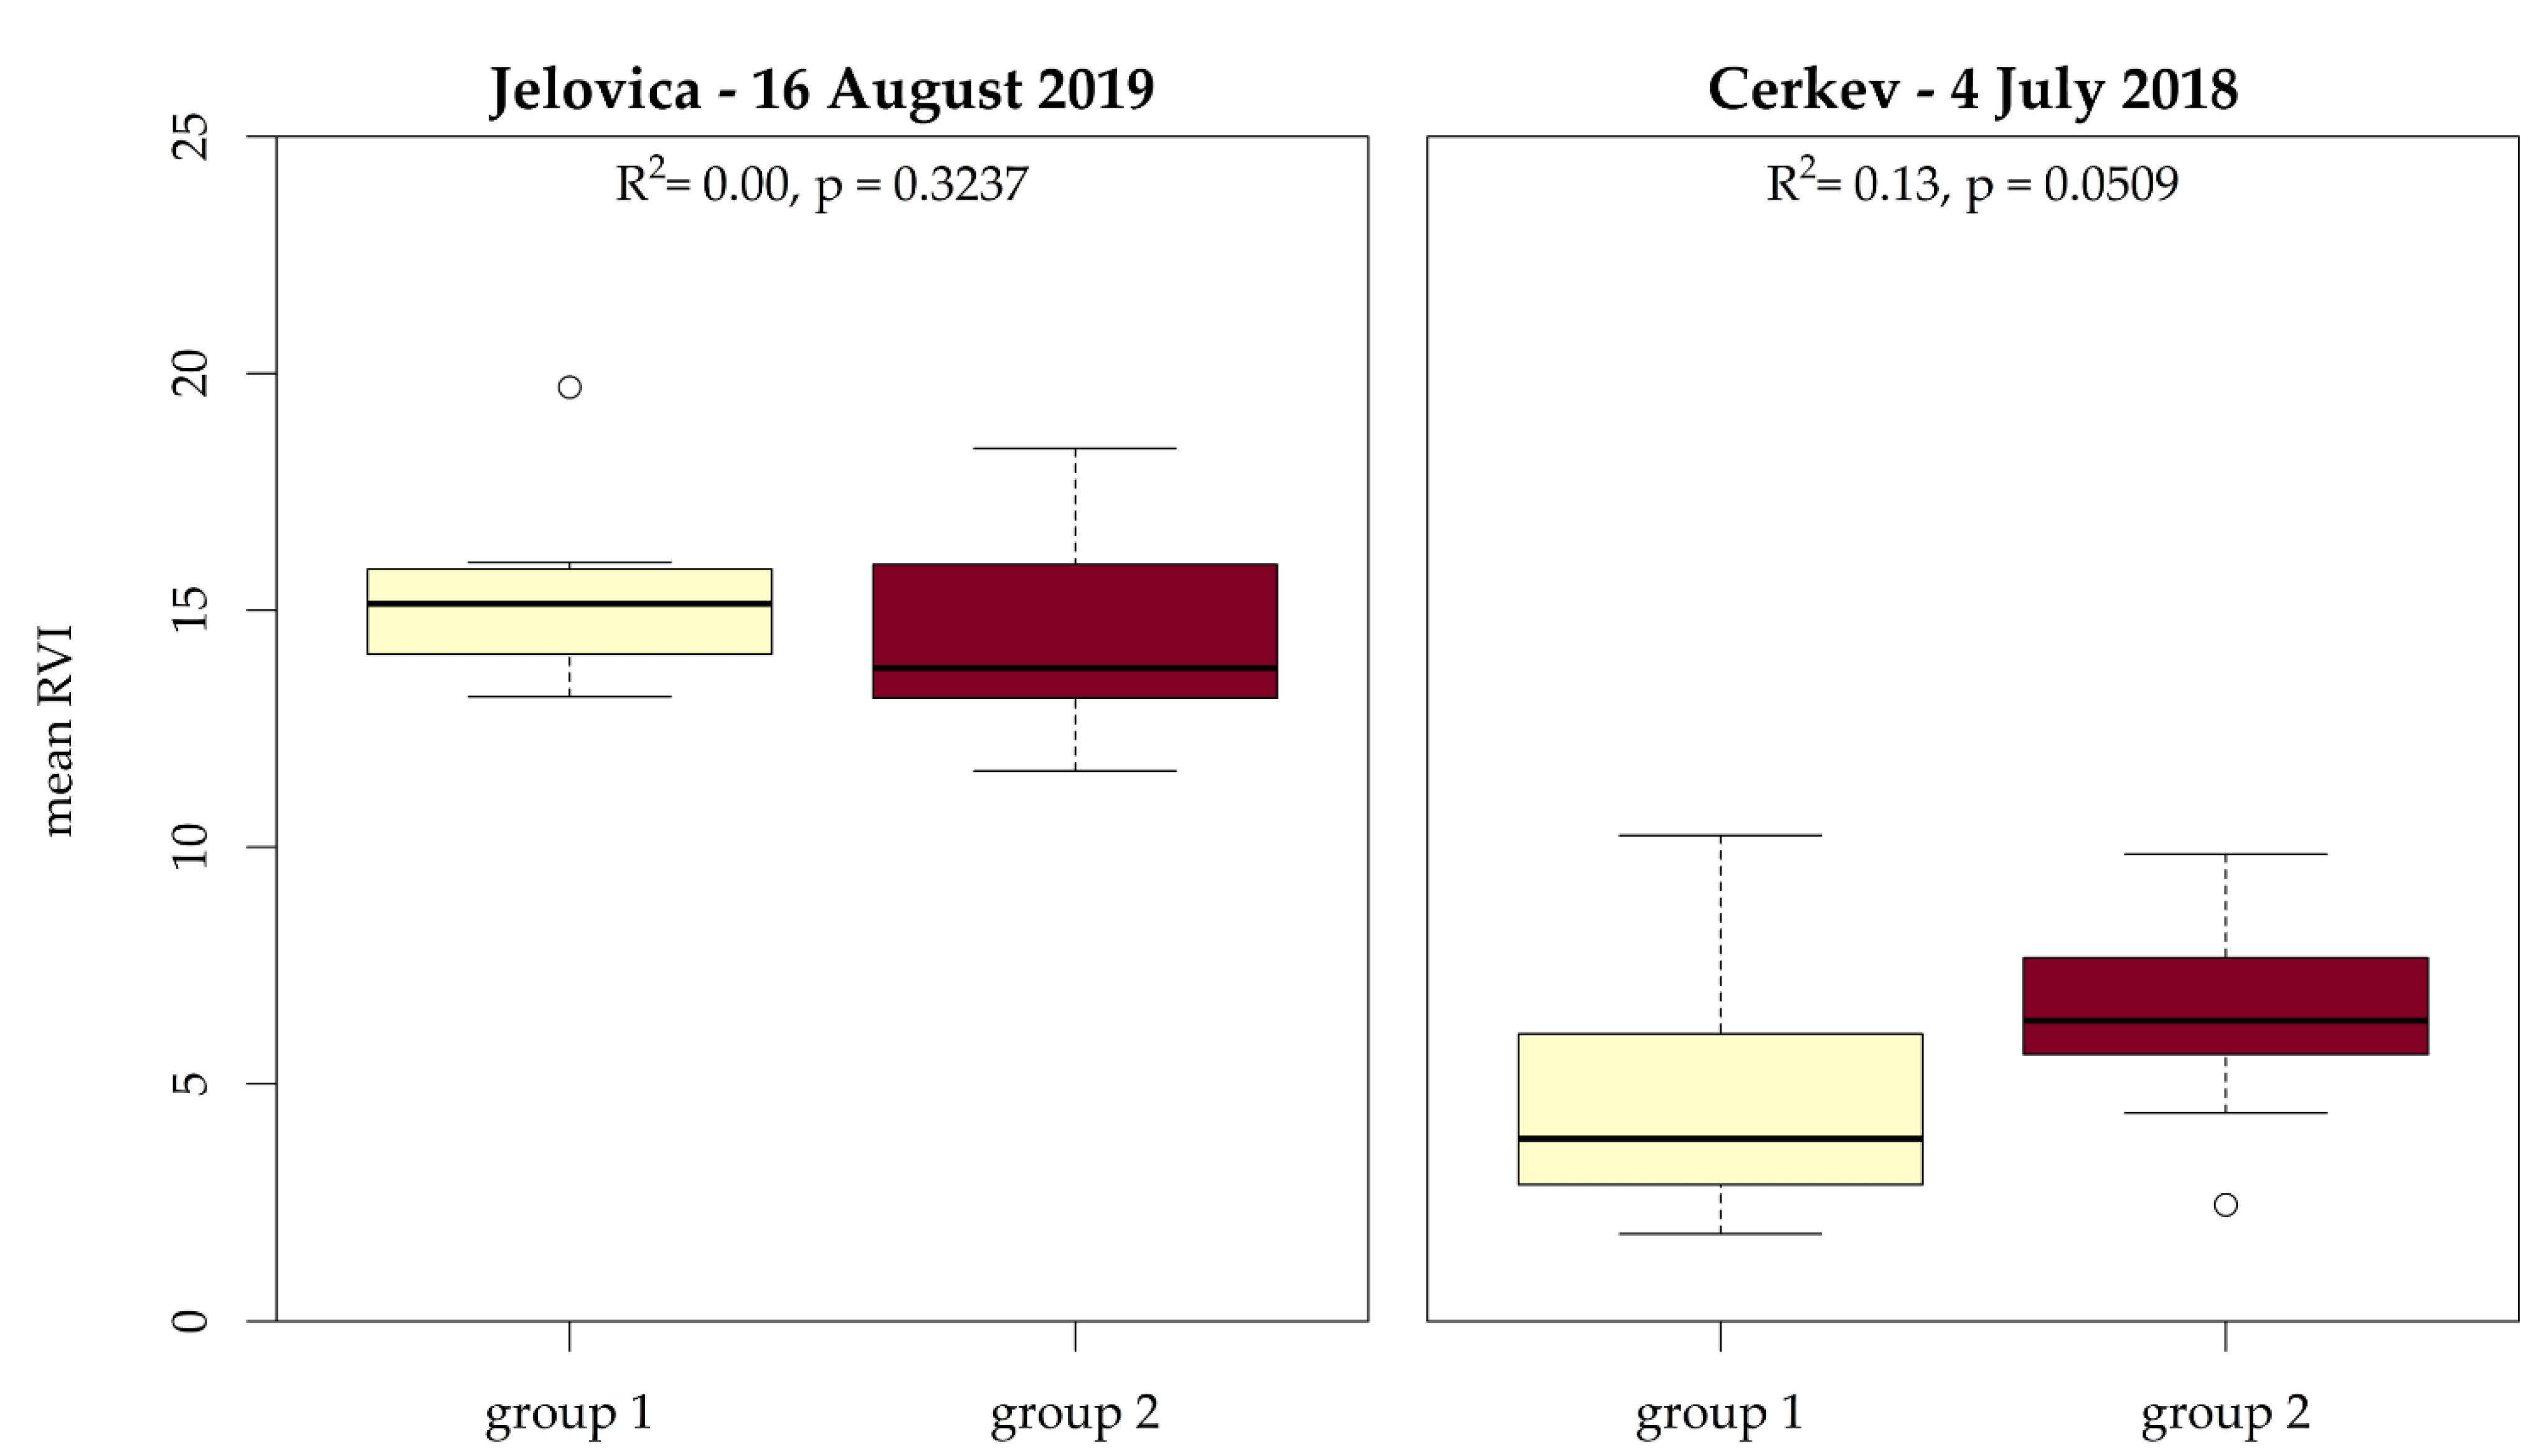
3.3. Comparison of VI Values between Injured and Uninjured Trees through Time

Injured and uninjured trees at the Cerkev site were surveyed in three consecutive years (2018–2020) (all maps are available in Appendix C, Appendix E and Appendix F) to observe if the difference in VIs between the two groups of trees would change. To observe the difference, mean VI values within tree crowns were cumulated (sum) between individual years. Based on Figure 10, we can conclude that the R2 values do not improve significantly when values of several years are included into the calculations. Moreover, the R2 decreases in only one year (2018) are taken into account, as shown in Figure 6. The values vary among the VIs, with RVI staying the most descriptive one. The largest R2 value (0.35) for RVI is achieved for first time period (2018–2019), two years after the trees were injured (2018–2019), while the R2 for the third year (2019–2020) drops down to 0.26.

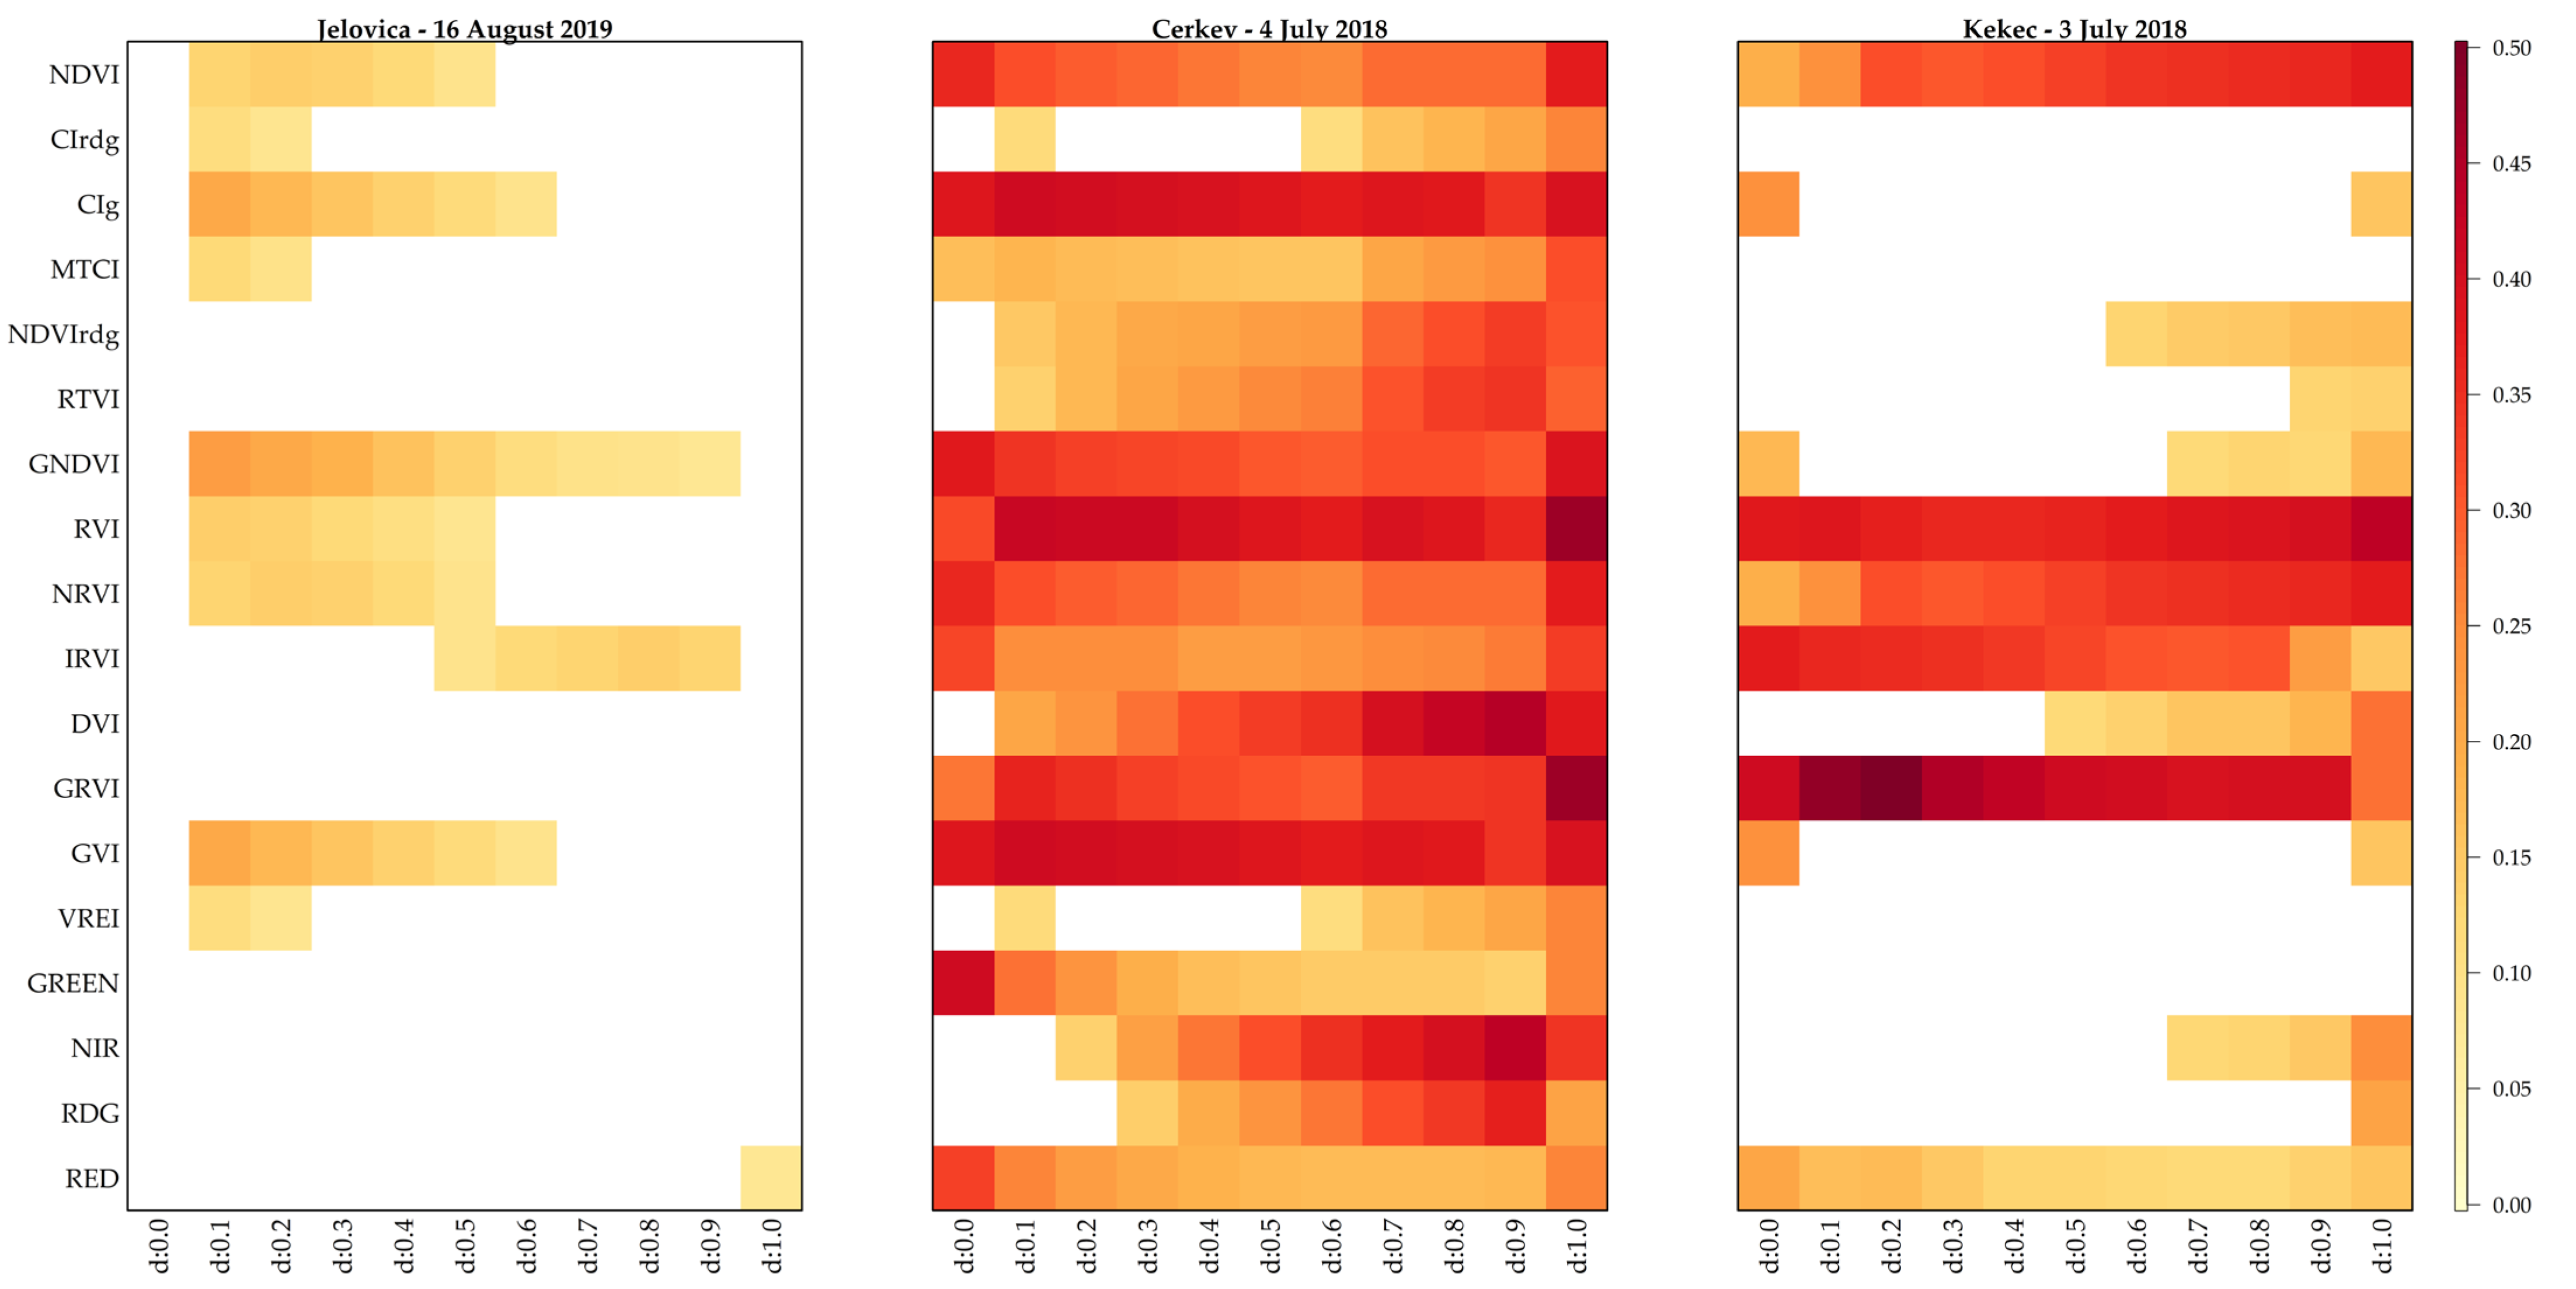
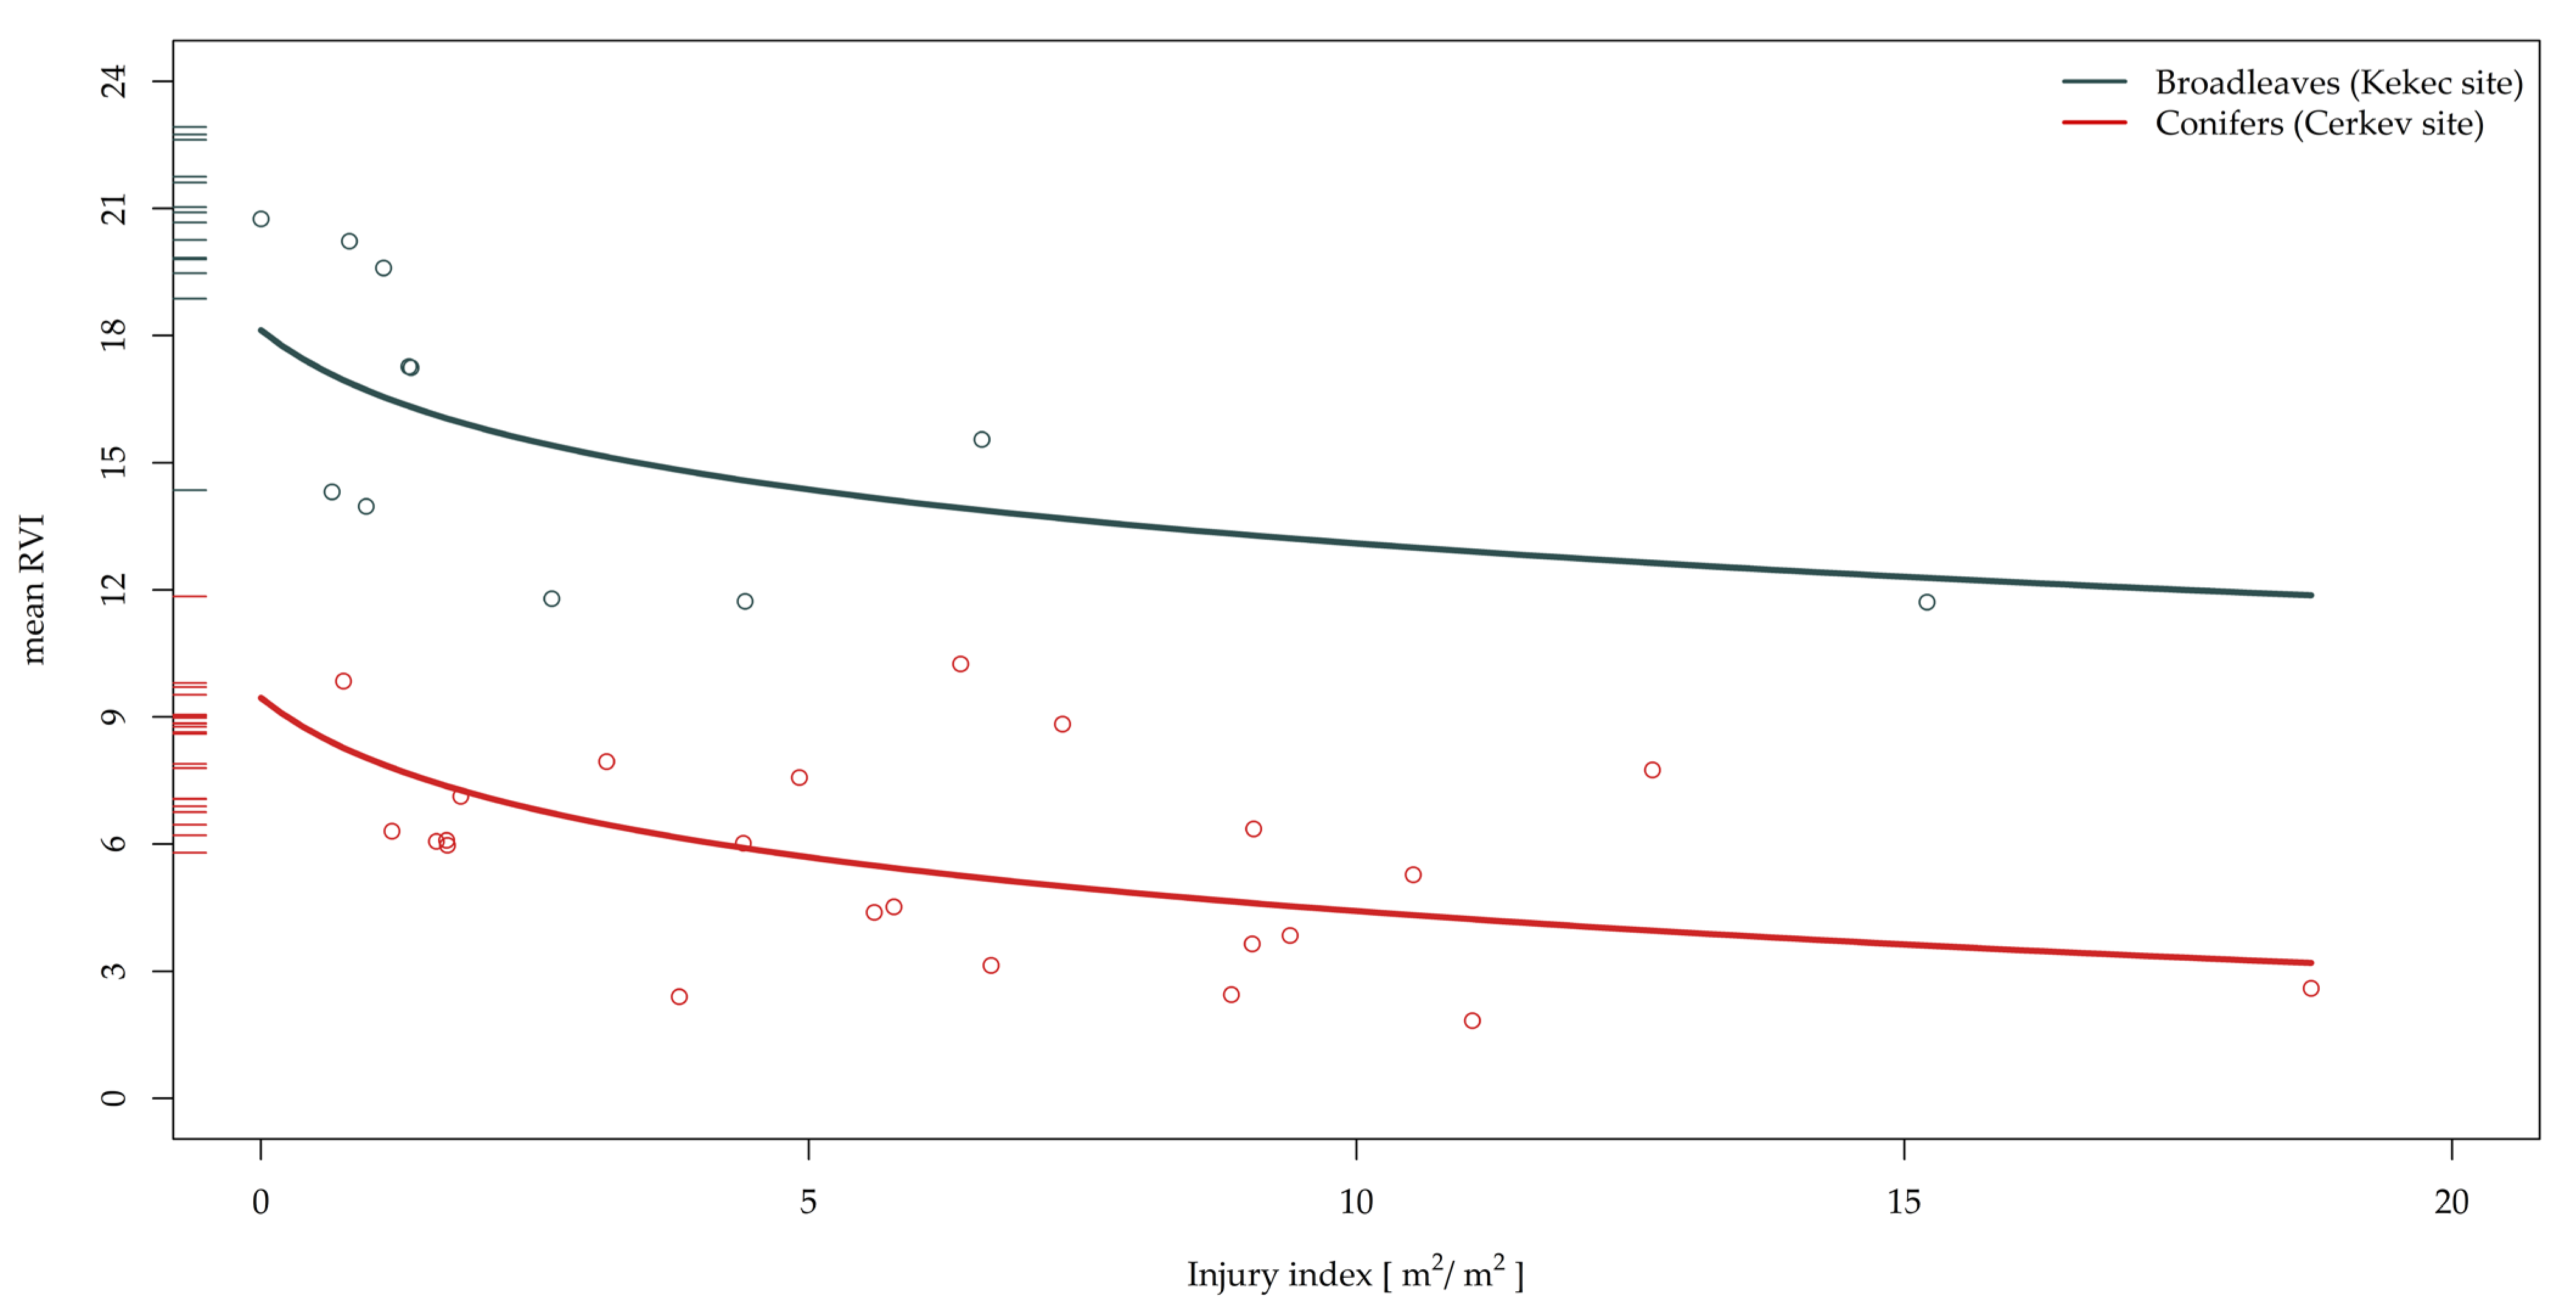
3.4. VI Relation to the Injury Categories

The most common category of injury (Table 4) at all rockfall sites was injury to the bark and injury to the bark and wood. At the Cerkev and Jelovica sites, where coniferous tree species are present, most of the injuries to the bark and wood are accompanied by resin flow and resin burls. The most versatile injuries are present at the Cerkev site (nine different ones), followed by the Jelovica site with five different categories of injuries, while Kekec only has three categories of injuries. Reviewing all the injury categories that were present at the individual sites, we formed a group of injuries based on their extent of injuries on individual trees in order to test if it is possible to distinguish among different groups of injuries.
Even though that VIs could not explain the variance between the injured and uninjured trees at the Jelovica site, we still wanted to explore if they could explain the variance among injury groups. Based on the injury categories present at Jelovica, two groups of injuries were formed. The first group included trees that had four categories of injuries: injury to the bark or bark and wood and/or resin flow (either fresh and transparent to white or either old and yellow to dark brown), while the second group additionally included the categories cracked steam, injured/exposed roots, and/or missing tree tops.
The Cerkev site had the most versatile injury categories; however, the most injury categories were present in all trees. Consequently, only two groups of injuries could be distinguished. The first group included trees that only had injuries to the bark and bark and wood, resin flow (either fresh and transparent to white or either old and yellow to dark brown), and/or inclusion of rocks in the injury. The second group in addition to injuries from first group also included the remaining categories of injuries (missing tree tops, missing branches, stem breakage, injured/exposed roots, tilted tree, and cracked steam). At the Kekec site, a formation of injury groups was not possible since all trees had the same categories of injuries present (Table 4); these injuries were either injuries to the bark, bark and wood, and/or inclusion of rocks in the injury.
The results of the injury groups for Cerkev and Jelovica are shown at Figure 11; for the mean RVI value, this was the VI that could explain the most variance (R2) due to the difference between injured and uninjured trees in the first section of the Results section. The results for the Jelovica site once more confirm that the variance of the RVI value could not be explained due to the difference between the injured and uninjured trees (R2 = 0.00). At the Cerkev site, a difference between the groups can be observed; however, it is not statistically significant (p = 0.51). In addition, the mean RVI value can only explain 13% of the variance of a dependent variable that could be explained by the categorical independent variable. Generally, the mean RVI values of group 2, which includes the injuries that affected all vital parts of the trees, are higher compared to the injuries only to the bark and wood (group 1). What clearly differentiates the two groups is the area of injuries on the tree trunk. Looking at the sum area of the injuries of both groups, the area is larger in group 1 (8.9 m2) than in group 2 (3.6 m2).
Focusing on the model that describes the relation between the size of the injury in relation to the basal area of the tree (hereafter named injury index) and mean RVI values, a trend is present showing that given a larger injury area the mean RVI values will be smaller. The results in Figure 12 are shown for the Cerkev and Kekec sites, where Cerkev represents coniferous tree species (Larix decidua Mill., Pinus sylvestris L., and Picea abies (L.) Karsten), and Kekec represents broadleaved species (Fagus sylvatica L.). In the case of both, it is statistically confirmed that with a larger injury index there will be a lower mean RVI value. Moreover, the mean RVI can, according to the injury index, explain 82% of the variance. The only difference between the broadleaves and conifers is that conifers achieve lower mean RVI values than broadleaves, which could be related to the age of the injuries on each site (Cerkev was surveyed one year after the injuries, while Kekec was surveyed 6 years later).

4. Discussion

The aim of this study was to investigate the capability of UAV-acquired multiband imagery to detect trees that have been injured due to rockfall activity, both using the data for the current state and monitoring through time. Additionally, we also studied if it is possible to differentiate among injury groups based on the extent of injuries on trees, dividing them into groups where more or less vital parts of the trees were affected. In order to test if it is possible to detect injured trees, we sampled all the injured trees at three different rockfall sites that were also characterized by different rockfall activity. The Jelovica site had the most recently induced injuries, namely only four months after the rockfall activity. The Cerkev site had injuries caused one year before the initial UAV survey, while at the Kekec site, the rockfall injuries were six years old at the time of the study.
According to the results obtained in this study, VIs can successfully be used for the identification of trees that have been injured due to rockfalls since we were able to confirm this hypothesis for two out of three sites (Cerkev and Kekec). The identification was possible via more VIs; on both sites, the following VIs were successful (R2 ≥ 0.30, p < 0.001): IRVI, GRVI, NDVI, NRVI, and RVI. The RVI was the most successful since its model could explain up to 40% of the variance between the injured and uninjured trees (p < 0.001). At the Cerkev site, even more VIs were able to identify injured trees; the additional ones, which could explain at least 30% of variance, were CIg, DVI, GNDVI, and GVI. The majority of these indices are based on near-infrared and red bands, due to the spectral behavior of the vegetation. Since near-infrared and red bands are used to characterize the vegetation function where leaf chlorophyll absorbs the red spectra and reflects infrared spectra, it is possible to sense the vegetation activity (its greenness) [79]. The reflectance in the red edge portion of the spectrum (690–740 nm) is one of the most informative descriptors of foliar chlorophyll concentration [33]. This portion of the spectrum covers the region where reflection increases sharply from the chlorophyll-absorbed red portion of the spectrum (near 680 nm) [80].
Individual band performance does not provide fruitful information about the injury status of the trees since the model can explain only a smaller portion of the variability. In the case of Kekec, the green band did not provide statistically significant results, while in the case of Cerkev, a less than 15% variability could be explained. However, when the green band is included into the VIs together with the red and nir bands (e.g., GNDVI, GVI, GRVI, and CIg), the model’s successfulness increases (R2 > 0.30, p < 0.001). Even though that red edge band is important in identifying injured trees due to its sensitivity to small variations in the chlorophyll content and as it is consistent across most species and health status classes [68,81], it does not provide statistically significant result (e.g., VREI, RTVI, MTCI, and CIrdg).
In our study, the injured trees were only detected on VIs when at least one year had passed after the rockfall-inflicted injuries. At Jelovica, the injuries were inflicted four months before the UAV survey, and this represents too short a time period for the trees to respond to disturbances, such as rockfalls. Even though the anatomical response in trees can occur immediately at the beginning of the new annual ring if the rockfall injuries occur in the dormant season [82,83], growth suppression might not. Mainieri et al. [84] reported that abrupt growth suppression was the least common response of rockfall growth injuries. Stoffel et al. [85] concluded that after rockfall injuries, 13% of the studied coniferous trees experienced strong growth after the injuries and that suppressed growth due to reduced vitality or photosynthesis was rare (only in 4% of cases). Since trees can react differently after wounding and considering that no branches or tree tops were affected at the Jelovica site, we presume that this is the reason why no differences between the injured and uninjured trees were present as yet. Moreover, the conditions for tree growth also did not change since none of the neighboring trees had been removed.
At the other two sites, where at least one year had passed between the first injuries and the UAV survey, differences among the groups of trees were possible to detect. Comparing the extent of injuries at the Kekec and Cerkev sites, they were less extensive at first site where no tree tops and branches were affected. In addition, the injuries were older, meaning that the differences among the groups of trees can be smaller as trees could have already recovered, especially after the lesser extent of the injuries. At the Cerkev site, the extent of the injuries per tree was the largest, also importantly affecting the tree crown (broken branches and tree tops) and in some cases, exposing the root system. Monitoring the injured trees through time at the Cerkev site did not show that the vitality of these trees would change a lot—not for better or worse. The difference between the injured and uninjured trees stayed more or less the same (the same statistical significance and variability), which could mean that the tree’s vitality was stagnating. In this time period, the injured trees had not yet started to recover to decrease the differences in mean VI values, which confirms that the healing process after rockfall injuries is a long-term process (even longer as the difference can be detected 6 years afterward).
Differentiation among the rockfall injury tree groups has proven not to be as effective since no statistically significant conclusions could be drawn. The issue with the injury groups in our case is that most of the injuries occurred on the majority of trees and are of a similar category; no different impacts can be observed. Perhaps on a larger forest-affected area or with larger tree samples there could be a difference where trees closer to rockfall injuries would probably be more severely injured and would have more and different categories of injuries due to the energy impact than trees further downslope. However, as also confirmed by our results, more than an injury category, the extent of the injury area on the tree stem will be more important in recognizing rockfall-injured trees. This result could reduce the amount of field work for the identification of the number or categories of injuries as they could be recognized via VIs. Combined with photogrammetric or lidar point cloud, where additional tree attributes could be extracted [86,87,88], e.g., DBH, tree height, and injury index, or the extent of injuries could be determined without extensive field work.
Individual tree species have different mechanical resistance against rockfall impacts and can react differently in the process of healing from rockfall-induced injuries. Generally, deciduous tree species are more resistant to the mechanical impacts than coniferous species [10,11,15]. While the majority of broadleaves can resprout from the root system or stem if the tree trunk is broken, conifers do not have this ability and will, in most cases, die [15]. In the case of lower-impact injuries with trees that have thicker bark, they can recover more quickly since the bark will protect the inner vital parts of the tree [16]. Stokes et al. [15] discovered that more than 66% of all uprooted or broken trees were coniferous species. Moreover, broadleaves, such as Fagus sylvatica L., are more resistant to the mechanical impacts and can recover quickly. Brauner et al. [89] concluded that the mortality rate increases by 66% with Picea abies (L.) Karsten after rockfall impacts, while with Larix decidua Mill., the mortality rate increases only by 23% since they have thicker bark. If the recovery of the bark is slow, the trees are more susceptible to be attacked by pathogens; consequently, the mechanical resistance of the tree can become reduced [16]. Some differences among tree species are present at the Cerkev site. Among the coniferous tree species at the Cerkev site, the Pinus sylvestris L. and Abies alba Mill. were the species that had the largest difference in VI values between the injured and uninjured groups, while Larix decidua Mill. was the least distinctive. In order to put the results regarding the tree species in a larger perspective, it would be crucial to perform similar analyses in other rockfall-prone and forested areas with similar tree species. In the case of rockfalls, it must be accounted for that this is a small-scale disturbance in a forest [9], meaning that it is spatially more limited than, for example, other abiotic or biotic disturbances, such as bark beetle attacks, wind throw, and ice-breaks, where more than several hundreds of hectares can be affected [90]. In extreme cases where rockfall events can also be of larger volumes (e.g., 1 million m3 of material) [3], the forest protection function is diminished as the forest, in this case, will be destroyed, and tree sample can be extremely low. Because of this characteristic, it was important that several and diverse study sites were included in the study since we had to include all trees injured as study objects.
One of the main advantages common to all forest health studies is that the UAVs in combination with microsensors can play an important role in monitoring forests due to the increased spatial resolution of data (at the tree level). This analysis was a preliminary study for determining rockfall-injured trees based on VIs. Even though many studies are involved in investing tree health via UAV multiband, the majority focuses only on biotic disturbances (e.g., bark beetle and different diseases). Therefore, it is challenging to compare the outcomes of our study to other studies. Due to the applicability of UAV multiband data and the necessity of protective forest monitoring, further analyses focusing on the abiotic and geomorphic processes and their impacts on the protective effect of forests (rockfalls, avalanches, and debris slides) would be important. Especially since satellite data do not provide a sufficient scale to monitor forests at the canopy level, and as the field surveys in these exposed areas are challenging, time-consuming, and dangerous. The natural dynamics in these forests are expected to change due to the increased frequency of abiotic natural disturbances and changes in the tree composition of forest stands in mountainous regions [90,91].
Our results confirm that it is possible to separate injured and uninjured trees due to rockfall; however, the highest R2 that was achieved is 0.4 (RVI), which is a low to medium correlation. Consequently, in order to validate the results of this study and to develop new methodology approaches, it is crucial that research in this field continues. Further research should focus on monitoring injured trees through time to identify the healing time necessary for trees to recover. The logical continuation would be to use VIs in order to identify injured trees using only multispectral imagery, by using logistic regression, neural networks, machine learning, etc. It would also be interesting to see which period or season would be the most conducive for identifying injured trees with new, fresh injuries, given that the spring season is when growth begins. In addition, a combination of aerial and terrestrial laser scanning could be combined with the multispectral images and used to extract the forest parameters in order to quantify the extent of injuries on tree trunks and crowns. To support the results of this study and its applicability, it is desirable if similar research could be performed in other alpine regions and with different tree species to highlight the possibility of monitoring rockfall protective forests.

5. Conclusions

The results of this study clearly show that the UAV-acquired multiband images can be used for detecting trees in forest stands that have been injured by an abiotic disturbance, such as a rockfall. UAVs represent a viable solution for monitoring steep and hardly accessible slopes where protection forests against rockfalls are mostly located. By comparing injured trees due to rockfall impacts to the uninjured trees at three different sites with both conifers and broadleaves, the analysis with regression models showed that different vegetation indices (VIs) can identify injured trees. More than 30% of the model’s variability could be explained by the differences between the groups of the trees with the following VIs: inverse ratio index (IRVI), green–red vegetation index (GRVI), normalized difference vegetation index (NDVI), normalized ratio index (NRVI), and ratio vegetation index (RVI). The RVI index was the most successful (explaining 40% of the variance at two sites). Analyses showed that trees that were injured in the same year as the UAV survey was performed could not be identified. The successful identification was at two sites where rockfall injuries were at least one year old, and they were still identifiable six years after the initial injuries. At one site where trees were surveyed three years in a row, differentiation between the injured and uninjured trees was possible in all cases, while the values of the VIs did not vary significantly, indicating that the vitality of these trees did not change significantly. The attempt to identify different injury groups among the injured trees was not successful since the injuries among trees are too similar and present in the majority of the injured trees. Based on the injury size, we were able to correlate the values of VIs with the injury size according to the basal area of the tree, where both in the case of coniferous and broadleaves the R2 achieved a value of 0.82. Further research should focus on monitoring injured trees through time to identify the healing time necessary for the trees to recover. It would also be interesting to see which period or season would be the most successful in identifying the injured trees with new, fresh injuries, given that the spring season is when growth begins. To support the results of this study and its applicability, it is desirable if similar studies would be performed in other alpine regions and with different tree species.

Author Contributions

Conceptualization, B.Ž. and M.K.; methodology, B.Ž. and M.K.; formal analysis, B.Ž.; investigation, B.Ž.; resources, M.K.; data curation, B.Ž. and M.K.; writing—original draft preparation, B.Ž.; writing—review and editing, M.K.; visualization, B.Ž. and M.K.; supervision, M.K. All authors have read and agreed to the published version of the manuscript.

Funding

This research has been funded by the Pahernik Foundation, and by the ARRS program P4-0059 “Forest, Forestry and Renewable Forest Resources”. It was also supported by the Interreg Alpine Space projects “ROCKtheALPS” (ASP 462) and GreenRisk4ALPs (ASP 635).

Data Availability Statement

The data presented in this study are available on request from the corresponding author.

Acknowledgments

The first author would like to additionally thank the Pahernik Foundation for cofinancing the tuition for the doctoral study of which this paper presents one of the major results. Special thanks also go to Triglav National Park for issuing a permit for research work within the park.

Conflicts of Interest

The authors declare no conflict of interest.

Appendix A

The list of vegetation indices (VIs) and their formulas.
Table A1. The full name of individual vegetation indexes (VIs), their formula for calculation, and the reference of the calculation.
Index NameFormulaReference
Inverse ratio Index (IRVI)IRVI = red/near infrared Richardson and Wiegand, 1977 [92]
Ratio Vegetation Index (RVI)RVI = near infrared/red Birth and Birth, 1968 [93]
Difference Vegetation Index (DVI)DVI = near infrared − red Richardson and Wiegand, 1977 [92]
Green Vegetation Index (GVI)RVI = near infrared/greenCruden et al., 2012 [94]
Green–Red Vegetation Index (GRVI)GRVI = (green − red)/(green + red)Sripada et al., 2005 [95]
Vogelmann Red Edge Index (VREI)VREI = near infrared/red edgeVogelmann et al., 1993 [96]
Core Red Edge Triangular Vegetation Index (RTVI)RTVI = 100 × (near infrared − red edge) − 10 × (near infrared − green)Chen et al., 2010 [97]
Medium Resolution Imaging Spectrometer (MERIS) Terrestrial Chlorophyll Index (MTCI)MTCI = (near infrared − red edge)/(red edge + red)Dash and Curran, 2004 [98]
Red Edge Chlorophyll Index (CIrdg)CIrdg = (near infrared/red edge) − 1Gitelson et al., 2003 [99]
Green Chlorophyll Index (CIg)CIg = (near infrared/green) − 1Gitelson et al., 2003 [99]
Normalized Difference Vegetation Index (NDVI)NDVI = (near infrared − red)/(near infrared + red)Rouse et al., 1974 [100]
Normalized Ratio Vegetation Index (NRVI)NRVI = (RVI − 1)/(RVI + 1)Baret and Guyot, 1991 [101]
Green Normalized Difference Index (GNDVI)GNDVI = (near infrared − green)/(near infrared + green)Gitelson et al., 1996 [102]
Red Edge Normalized Difference Vegetation Index (NDVIrdg)NDVIrdg = (near infrared − red edge)/(near infrared + red edge)Gitelson and Merzlyak, 1994 [103]

Appendix B

Figure A1. The maps of all vegetation indices (VIs) and individual spectral bands for the Jelovica site (16 August 2019).
Forests 13 01039 g0a1

Appendix C

Figure A2. The maps of all vegetation indices (VIs) and individual spectral bands for the Cerkev site (4 July 2018).
Forests 13 01039 g0a2

Appendix D

Figure A3. The maps of all vegetation indices (VIs) and individual spectral bands for the Kekec site (3 July 2018).
Forests 13 01039 g0a3

Appendix E

Figure A4. The maps of all vegetation indices (VIs) and individual spectral bands for the Cerkev site (15 August 2019).
Forests 13 01039 g0a4

Appendix F

Figure A5. The maps of all vegetation indices (VIs) and individual spectral bands for the Cerkev site (14 August 2020).
Forests 13 01039 g0a5

References

  1. Corominas, J.; Mavrouli, O.; Ruiz-Carulla, R. Rockfall Occurrence and Fragmentation. In Advancing Culture of Living with Landslides; Springer International Publishing: Cham, Switzerland, 2017; pp. 75–97. [Google Scholar]
  2. Luckman, B.H. Processes, Transport, Deposition, and Landforms: Rockfall. In Treatise on Geomorphology; Shroder, J.F., Ed.; Academic Press: Cambridge, MA, USA, 2013; pp. 174–182. [Google Scholar]
  3. Geertsema, M.; Highland, L.M. Landslides: Human Health Effects. In Encyclopedia of Environmental Health; Nriagu, J.O., Ed.; Elsevier: Amsterdam, The Netherlands, 2011; pp. 380–395. [Google Scholar]
  4. Robbins, B.A.; Stephens, I.J.; Marcuson, W.F. Geotechnical Engineering. In Encyclopedia of Geology, 2nd ed.; Alderton, D., Elias, S.A., Eds.; Academic Press: Cambridge, MA, USA, 2021; pp. 377–392. [Google Scholar]
  5. Moos, C.; Bebi, P.; Schwarz, M.; Stoffel, M.; Sudmeier-Rieux, K.; Dorren, L. Ecosystem-based disaster risk reduction in mountains. Earth-Sci. Rev. 2018, 177, 497–513. [Google Scholar] [CrossRef]
  6. Brang, P.; Schönenberger, W.; Frehner, M.; Schwitter, R.; Thormann, J.J.; Wasser, B. Management of protection forests in the European Alps: An overview. For. Snow Landsc. Res. 2006, 80, 23–44. [Google Scholar]
  7. Berger, F.; Dorren, L.; Kleemayr, K.; Maier, B.; Spela Planinsek, S.; Bigot, C.; Bourrier, F.; Jancke, O.; David Toe, D.; Cerbu, G. Eco-Engineering and Protection Forests Against Rockfalls and Snow Avalanches. In Management Strategies to Adapt Alpine Space Forests to Climate Change Risks; Cerbu, G.A., Hanewinkel, M., Gerosa, G., Jandl, R., Eds.; IntechOpen: London, UK, 2013. [Google Scholar] [CrossRef] [Green Version]
  8. Dupire, S.; Bourrier, F.; Monnet, J.M.; Bigot, S.; Borgniet, L.; Berger, F.; Curt, T. The protective effect of forests against rockfalls across the French Alps: Influence of forest diversity. For. Ecol. Manag. 2016, 382, 269–279. [Google Scholar] [CrossRef] [Green Version]
  9. Oven, D.; Žabota, B.; Kobal, M. The influence of abiotic and biotic disturbances on the protective effect of alpine forests against avalanches and rockfalls. Acta Silvae Ligni 2020, 121, 1–18. [Google Scholar] [CrossRef]
  10. Dorren, L.K.A.; Berger, F.; Le Hir, C.; Mermin, E.; Tardif, P. Mechanisms, effects and management implications of rockfall in forests. For. Ecol. Manag. 2005, 215, 183–195. [Google Scholar] [CrossRef]
  11. Dorren, L.K.A.; Berger, F. Stem breakage of trees and energy dissipation during rockfall impacts. Tree Physiol. 2006, 26, 63–71. [Google Scholar] [CrossRef]
  12. Dorren, L.; Berger, F.; Jonsson, M.; Krautblatter, M.; Mölk, M.; Stoffel, M.; Wehrli, A. State of the art in rockfall—Forest interactions. Schweiz. Z. Forstwes. 2007, 158, 128–141. [Google Scholar] [CrossRef] [Green Version]
  13. Stokes, A.; Salin, F.; Dzifa Kokutse, A.; Berthier, S.; Jeannin, H.; Mochan, S.; Dorren, L.; Kokutse, N.; Abd.Ghani, M.; Fourcaud, T. Mechanical resistance of different tree species to rockfall in the French Alps. Plant Soil 2005, 278, 107–117. [Google Scholar] [CrossRef]
  14. Stoffel, M.; Schneuwly, D.; Bollschweiler, M.; Lièvre, I.; Delaloye, R.; Myint, M.; Monbaron, M. Analyzing rockfall activity (1600–2002) in a protection forest—A case study using dendrogeomorphology. Geomorphology 2005, 68, 224–241. [Google Scholar] [CrossRef]
  15. Stokes, A. Selecting tree species for use in rockfall-protection forests. For. Snow Landsc. Res. 2006, 80, 77–86. [Google Scholar]
  16. Stoffel, M.; Lièvre, I.; Monbaron, M.; Perret, S. Seasonal timing of rockfall activity on a forested slope at Täschgufer (Valais, Swiss Alps)—A dendrochronological approach. Z. Geomorphol. 2005, 49, 89106. [Google Scholar]
  17. Bauerhansl, C.; Berger, F.; Dorren, L.; Duc, P.; Ginzler, C.; Kleemayr, K.; Koch, V.; Koukal, T.; Mattiuzzini, M.; Perzl, F.; et al. Development of Harmonized Indicators and Estimation Procedures for Forests with Protective Functions against Natural Hazards in the Alpine Space; Office for Official Publications of the European Communities: Luxembourg, 2010; p. 168. Available online: https://op.europa.eu/en/publication-detail/-/publication/bc13d2e8-5fd3-4978-9cbd-220de5deb93f (accessed on 30 June 2022).
  18. Lingua, E.; Bettella, F.; Pividori, M.; Marzano, R.; Garbarino, M.; Piras, M.; Kobal, M.; Berger, F. The protective role of forest to reduce rockfall risks and impacts in the Alps under a climate change perspective. In Climate Change. Hazards and Adaptation Options. Climate Change Management; Leal Filho, W., Nagy, G., Borga, M., Chávez Muñoz, P., Magnuszewski, A., Eds.; Springer: Cham, Switzerland, 2020; pp. 333–347. [Google Scholar]
  19. Salamí, E.; Barrado, C.; Pastor, E. UAV flight experiments applied to the remote sensing of vegetated areas. Remote Sens. 2014, 6, 11051–11081. [Google Scholar] [CrossRef] [Green Version]
  20. Di Gennaro, S.F.; Nati, C.; Dainelli, R.; Pastonchi, L.; Berton, A.; Toscano, P.; Matese, A. An automatic UAV based segmentation approach for pruning biomass estimation in irregularly spaced chestnut orchards. Forests 2020, 11, 308. [Google Scholar] [CrossRef] [Green Version]
  21. Imangholiloo, M.; Saarinen, N.; Markelin, L.; Rosnell, T.; Näsi, R.; Hakala, T.; Honkavaara, E.; Holopainen, M.; Hyyppä, J.; Vastaranta, M. Characterizing seedling stands using leaf-off and leaf-on photogrammetric point clouds and hyperspectral imagery acquired from unmanned aerial vehicle. Forests 2019, 10, 415. [Google Scholar] [CrossRef] [Green Version]
  22. Dainelli, R.; Toscano, P.; Di Gennaro, S.F.; Matese, A. Recent advances in unmanned aerial vehicles forest remote sensing—A systematic review. Part I: A General Framework. Forests 2021, 12, 327. [Google Scholar] [CrossRef]
  23. Dainelli, R.; Toscano, P.; Di Gennaro, S.F.; Matese, A. Recent advances in unmanned aerial vehicles forest remote sensing—A systematic review. Part II: Research applications. Forests 2021, 12, 397. [Google Scholar] [CrossRef]
  24. Eysn, L.; Hollaus, M.; Lindberg, E.; Berger, F.; Monnet, J.M.; Dalponte, M.; Kobal, M.; Pellegrini, M.; Lingua, E.; Mongus, D.; et al. A benchmark of lidar-based single tree detection methods using heterogeneous forest data from the Alpine Space. Forests 2015, 6, 1721–1747. [Google Scholar] [CrossRef] [Green Version]
  25. Dupire, S.; Toe, D.; Barré, J.B.; Bourrier, F.; Berger, F. Harmonized mapping of forests with a protection function against rockfalls over European Alpine countries. Appl. Geogr. 2020, 120, 102221. [Google Scholar] [CrossRef]
  26. Scheidl, C.; Heiser, M.; Vospernik, S.; Lauss, E.; Perzl, F.; Kofler, A.; Kleemayr, K.; Bettella, F.; Lingua, E.; Garbarino, M.; et al. Assessing the protective role of alpine forests against rockfall at regional scale. Eur. J. For. Res. 2020, 139, 969–980. [Google Scholar] [CrossRef]
  27. D’Amboise, C.J.L.; Teich, M.; Hormes, A.; Steger, S.; Berger, F. Modeling protective forests for gravitational natural hazards and how it relates to risk-based decision support tools. In Protective Forests as Ecosystem-Based Solution for Disaster Risk Reduction (ECO-DRR); Teich, M., Accastello, C., Perzl, F., Kleemayr, K., Eds.; IntechOpen: London, UK, 2021. [Google Scholar] [CrossRef]
  28. Lausch, A.; Erasmi, S.; King, D.J.; Magdon, P.; Heurich, M. Understanding forest health with remote sensing-Part I—A review of spectral traits, processes and remote-sensing characteristics. Remote Sens. 2016, 8, 1029. [Google Scholar] [CrossRef] [Green Version]
  29. Lausch, A.; Erasmi, S.; King, D.J.; Magdon, P.; Heurich, M. Understanding Forest Health with Remote Sensing-Part II—A Review of Approaches and Data Models. Remote Sens. 2017, 9, 129. [Google Scholar] [CrossRef] [Green Version]
  30. Berra, E.F.; Gaulton, R.; Barr, S. Assessing spring phenology of a temperate woodland: A multiscale comparison of ground, unmanned aerial vehicle and Landsat satellite observations. Remote Sens. Environ. 2019, 223, 229–242. [Google Scholar] [CrossRef]
  31. Fraser, B.T.; Congalton, R.G. Monitoring Fine-Scale Forest Health Using Unmanned Aerial Systems (UAS) Multispectral Models. Remote Sens. 2021, 13, 4873. [Google Scholar] [CrossRef]
  32. Tuominen, J.; Tarmo, L.; Viljo, K.; Reija, H. Remote sensing of forest health. In Geoscience and Remote Sensing; Ho, P.P., Ed.; IntechOpen: London, UK, 2009; pp. 29–52. [Google Scholar]
  33. Dash, J.P.; Watt, M.S.; Pearse, G.D.; Heaphy, M.; Dungey, H.S. Assessing very high resolution UAV imagery for monitoring forest health during a simulated disease outbreak. ISPRS J. Photogramm. Remote Sens. 2017, 131, 1–14. [Google Scholar] [CrossRef]
  34. Šiljeg, A.; Panđa, L.; Domazetović, F.; Marić, I.; Gašparović, M.; Borisov, M.; Milošević, R. Comparative Assessment of Pixel and Object-Based Approaches for Mapping of Olive Tree Crowns Based on UAV Multispectral Imagery. Remote Sens. 2022, 14, 757. [Google Scholar] [CrossRef]
  35. Hay, G.J.; Castilla, G. Geographic object-based image analysis (GEOBIA): A new name for a new discipline. In Object-Based Image Analysis; Springer: Berlin/Heidelberg, Germany, 2008; pp. 75–89. [Google Scholar]
  36. Weih, R.C.; Riggan, N.D. Object-based classification vs. pixel-based classification: Comparative importance of multi-resolution imagery. Int. Arch. Photogramm. Remote Sens. Spat. Inf. Sci. 2010, 38, C7. [Google Scholar]
  37. Karlson, M.; Reese, H.; Ostwald, M. Tree crown mapping in managed woodlands (Parklands) of semi-arid West Africa using WorldView-2 imagery and geographic object based image analysis. Sensors 2014, 14, 22643–22669. [Google Scholar] [CrossRef]
  38. Immitzer, M.; Atzberger, C.; Koukal, T. Tree species classification with Random forest using very high spatial resolution 8-band worldView-2 satellite data. Remote Sens. 2012, 4, 2661–2693. [Google Scholar] [CrossRef] [Green Version]
  39. Chemura, A.; van Duren, I.; van Leeuwen, L.M. Determination of the age of oil palm from crown projection area detected from WorldView-2 multispectral remote sensing data: The case of Ejisu-Juaben district, Ghana. ISPRS J. Photogramm. Remote Sens. 2015, 100, 118–127. [Google Scholar] [CrossRef]
  40. Schäfer, E.; Heiskanen, J.; Heikinheimo, V.; Pellikka, P. Mapping tree species diversity of a tropical montane forest by unsupervised clustering of airborne imaging spectroscopy data. Ecol. Indic. 2016, 64, 49–58. [Google Scholar] [CrossRef]
  41. Müllerová, J.; Pergl, J.; Pyšek, P. Remote sensing as a tool for monitoring plant invasions: Testing the effects of data resolution and image classification approach on the detection of a model plant species Heracleum mantegazzianum (giant hogweed). Int. J. Appl. Earth Obs. Geoinf. 2013, 25, 55–65. [Google Scholar] [CrossRef]
  42. Lehmann, J.R.K.; Nieberding, F.; Prinz, T.; Knoth, C. Analysis of unmanned aerial system-based CIR images in forestry—A new perspective to monitor pest infestation levels. Forests 2015, 6, 594–612. [Google Scholar] [CrossRef] [Green Version]
  43. Näsi, R.; Honkavaara, E.; Lyytikäinen-Saarenmaa, P.; Blomqvist, M.; Litkey, P.; Hakala, T.; Viljanen, N.; Kantola, T.; Tanhuanpää, T.; Holopainen, M. Using UAV-based photogrammetry and hyperspectral imaging for mapping bark beetle damage at tree-level. Remote Sens. 2015, 7, 15467–15493. [Google Scholar] [CrossRef] [Green Version]
  44. Näsi, R.; Honkavaara, E.; Blomqvist, M.; Lyytikäinen-Saarenmaa, P.; Hakala, T.; Viljanen, N.; Kantola, T.; Holopainen, M. Remote sensing of bark beetle damage in urban forests at individual tree level using a novel hyperspectral camera from UAV and aircraft. Urban For. Urban Green. 2018, 30, 72–83. [Google Scholar] [CrossRef]
  45. Minařík, R.; Langhammer, J. Use of a multispectral UAV photogrammetry for detection and tracking of forest disturbance dynamics. Int. Arch. Photogramm. Remote Sens. Spat. Inf. Sci.—ISPRS Arch. 2016, 41, 711–718. [Google Scholar] [CrossRef] [Green Version]
  46. Brokvina, O.; Ciencala, E.; Surovy, P.; Janata, P. Unmanned aerial vehicles (UAV) for assessment of qualitative classification of Norway spruce in temperate forest stands. Geo-Spat. Inf. Sci. 2018, 21, 12–20. [Google Scholar]
  47. Abdollahnejad, A.; Panagiotidis, D.; Surový, P.; Modlinger, R. Investigating the Correlation between Multisource Remote Sensing Data for Predicting Potential Spread of Ips typographus L. Spots in Healthy Trees. Remote Sens. 2021, 13, 4953. [Google Scholar] [CrossRef]
  48. Guerra-Hernández, J.; Díaz-Varela, R.A.; Ávarez-González, J.G.; Rodríguez-González, P.M. Assessing a novel modelling approach with high resolution UAV imagery for monitoring health status in priority riparian forests. For. Ecosyst. 2021, 8, 1–21. [Google Scholar] [CrossRef]
  49. Yun, T.; Jiang, K.; Hou, H.; An, F.; Chen, B.; Jiang, A.; Li, W.; Xue, L. Rubber tree crown segmentation and property retrieval using ground-based mobile LiDAR after natural disturbances. Remote Sens. 2019, 11, 903. [Google Scholar] [CrossRef] [Green Version]
  50. Jurkovšek, B. Tolmač Listov Beljak in Ponteba. Osnovna Geološka Karta SFRJ 1:100,000; Zvezni Geološki Zavod Beograd: Belgrade, Serbia, 1987; 55p. [Google Scholar]
  51. Jurkovšek, B. Osnovna Geološka Karta SFRJ 1:100,000, List Beljka in Ponteba; Zvezni Geološki Zavod Beograd: Belgrade, Serbia, 1985. [Google Scholar]
  52. Placer, L. Osnovne tektonske razčlenitve Slovenije. Geologija 2008, 51, 205–217. [Google Scholar] [CrossRef]
  53. Zupan Hajna, N.; Petrič, M.; Zdešar, A. Trenta—Triglavski narodni park. In Proceedings of the 3. Slovenski Geološki Kongres, Bovec, Slovenia, 16–18 September 2010; pp. 69–80. [Google Scholar]
  54. Zorn, M.; Komac, B. Recent mass movements in Slovenia. In Slovenia: A Geographical Overview; Orožen Adamič, M., Ed.; Association of the Geographical Societies of Slovenia: Ljubljana, Slovenia, 2004; pp. 73–80. [Google Scholar]
  55. Mikoš, M.; Fazarinc, R.; Ribičič, M. Sediment production and delivery from recent large landslides and earthquake-induced rockfalls in the Upper Soča River Valley, Slovenia. Eng. Geol. 2006, 86, 198–210. [Google Scholar] [CrossRef]
  56. Mikoš, M.; Jemec Auflič, M.; Ribičič, M.; Čarman, M.; Komac, M. Earthquake-induced Landslides in Slovenia: Historical Evidenceand Present Analyses. In Proceedings of the International Symposium on Earthquake-Induced Landslides, Kiryu, Japan, 7–9 November 2012; pp. 225–233. [Google Scholar]
  57. Čarni, A.; Marinček, L.; Seliškar, A.; Zupančič, M. Vegetacijska Karta Gozdnih Združb Slovenije [Cartographic Material]: Merilo 1:400,000; ZRC SAZU, Biološki Inštitut Jovana Hadžija: Ljubljana, Slovenia, 2002. [Google Scholar]
  58. Žabota, B.; Mikoš, M.; Kobal, M. Rockfall modelling in forested areas: The role of digital terrain model grid cell size. Appl. Sci. 2021, 11, 1461. [Google Scholar] [CrossRef]
  59. ROCKtheALPS, Interreg Alpine Space. Available online: https://www.alpine-space.org/projects/rockthealps/en/home (accessed on 22 May 2022).
  60. Brenčič, M. Hydrogeological conditions of the Kroparica recharge area, Jelovica, Slovenia. Geologija 2003, 46/2, 281–306. [Google Scholar] [CrossRef]
  61. Grad, K.; Ferjančič, L. Osnovna Geološka Karta SFRJ 1:100,000, List Kranj; Zvezni Geološki Zavod Beograd: Belgrade, Serbia, 1976. [Google Scholar]
  62. Perret, S.; Baumgartner, M.; Kienholz, H. Inventory and analysis of tree injuries in a rockfall-damaged forest stand. Eur. J. For. Res. 2006, 125, 101–110. [Google Scholar] [CrossRef] [Green Version]
  63. Trappmann, D.; Stoffel, M. Counting scars on tree stems to assess rockfall hazards: A low effort approach, but how reliable? Geomorphology 2013, 180–181, 180–186. [Google Scholar] [CrossRef]
  64. Trappmann, D.; Stoffel, M.; Corona, C. Achieving a more realistic assessment of rockfall hazards by coupling three-dimensional process models and field-based tree-ring data. Earth Surf. Process. Landf. 2014, 39, 1866–1875. [Google Scholar] [CrossRef]
  65. Žabota, B.; Trappmann, D.; Levanič, T.; Kobal, M. Reconstruction of rockfall activity through dendrogeomorphology and a scar-counting approach: A study in a beech forest stand in the Trenta valley (Slovenian Alps). Acta Silvae Ligni 2020, 121, 19–32. [Google Scholar] [CrossRef]
  66. ArcGIS Survey123. Esri. Available online: https://www.esri.com/en-us/arcgis/products/arcgis-survey123/overview (accessed on 19 April 2022).
  67. Parrot Drone SAS. Available online: https://www.parrot.com/en (accessed on 22 November 2021).
  68. Cubero-Castan, M.; Schneider-Zapp, K.; Bellomo, M.; Shi, D.; Rehak, M.; Strecha, C. Assessment of the Radiometric Accuracy in A Target Less Work Flow Using Pix4D Software. In Proceedings of the 2018 9th Workshop on Hyperspectral Image and Signal Processing: Evolution in Remote Sensing, Amsterdam, The Netherlands, 23–26 September 2018; pp. 1–4. [Google Scholar]
  69. Assmann, J.J.; Kerby, J.T.; Cunliffe, A.M.; Myers-Smith, I.H. Vegetation monitoring using multispectral sensors—Best practices and lessons learned from high latitudes. J. Unmanned Veh. Syst. 2019, 7, 54–75. [Google Scholar] [CrossRef] [Green Version]
  70. Pix4Dmapper—Pix4D. Available online: https://www.pix4d.com/product/pix4dmapper-photogrammetry-software (accessed on 23 November 2021).
  71. De Castro, A.I.; Shi, Y.; Mari Maja, J.; Peña, J.M. UAVs for Vegetation Monitoring: Overview and Recent Scientific Contributions. Remote Sens. 2021, 13, 2139. [Google Scholar] [CrossRef]
  72. Lima-Cueto, F.J.; Blanco-Sepúlveda, R.; Gómez-Moreno, M.L.; Galacho-Jiménez, F.B. Using Vegetation Indices and a UAV Imaging Platform to Quantify the Density of Vegetation Ground Cover in Olive Groves (Olea Europaea L.) in Southern Spain. Remote Sens. 2019, 11, 2564. [Google Scholar] [CrossRef] [Green Version]
  73. ArcGIS Pro 2.7.3, Esri. Available online: https://www.esri.com/en-us/arcgis/products/arcgis-pro/resources (accessed on 19 April 2021).
  74. Xiao, Q.; McPherson, E.G. Tree health mapping with multispectral remote sensing data at UC Davis, California. Urban Ecosyst. 2005, 8, 349–361. [Google Scholar] [CrossRef]
  75. Suab, S.A.; Syukur, M.S.; Avtar, R.; Korom, A. Unmanned aerial vehicle (UAV) deriver normalized difference vegetation index (NDVI) and crown projection area (CPA) to detect health condition of young oil palm trees for precision agriculture. Int. Arch. Photogramm. Remote Sens. Spat. Inf. Sci.—ISPRS Arch. 2019, 42, 611–614. [Google Scholar] [CrossRef] [Green Version]
  76. Stateras, D.; Kalivas, D. Assessment of olive tree canopy characteristics and yield forecast model using high resolution UAV imagery. Agriculture 2020, 10, 385. [Google Scholar] [CrossRef]
  77. Mirasi, A.; Mahmoudi, A.; Navid, H.; Valizadeh Kamran, K.; Asoodar, M.A. Evaluation of sum-NDVI values to estimate wheat grain yields using multi-temporal Landsat OLI data. Geocarto Int. 2021, 36, 1309–1324. [Google Scholar] [CrossRef]
  78. RStudio Team. RStudio: Integrated Development for R; RStudio Inc.: Boston, MA, USA, 2016. [Google Scholar]
  79. Iizuka, K.; Kato, T.; Silsigia, S.; Soufiningrum, A.Y.; Kozan, O. Estimating and examining the sensitivity of different vegetation indices to fractions of vegetation cover at different scaling Grids for Early Stage Acacia Plantation Forests Using a Fixed-Wing UAS. Remote Sens. 2019, 11, 1816. [Google Scholar] [CrossRef] [Green Version]
  80. Curran, P.J.; Dungan, J.; Gholz, H. Exploring the relationship between reflectance red edge and chlorophyll content in slash pine. Tree Physiol. 1990, 7, 33–48. [Google Scholar] [CrossRef]
  81. Abdollahnejad, A.; Panagiotidis, D. Tree species classification and health status assessment for a mixed broadleaf-conifer forest with uas multispectral imaging. Remote Sens. 2020, 12, 3722. [Google Scholar] [CrossRef]
  82. Stoffel, M.; Hitz, O.M. Rockfall and snow avalanche impacts leave different anatomical signatures in tree rings of juvenile Larix decidua. Tree Physiol. 2008, 28, 1713–1720. [Google Scholar] [CrossRef] [Green Version]
  83. Schneuwly, D.M.; Stoffel, M.; Dorren, L.K.A.; Berger, F. Three-dimensional analysis of the anatomical growth response of European conifers to mechanical disturbance. Tree Physiol. 2009, 29, 1247–1257. [Google Scholar] [CrossRef] [Green Version]
  84. Mainieri, R.; Lopez-Saez, J.; Corona, C.; Stoffel, M.; Bourrier, F.; Eckert, N. Assessment of the recurrence intervals of rockfall through dendrogeormophology and counting scar approach: A comparative study in a mixed forest stand from the Vercors massif (French Alps). Geomorphology 2019, 340, 160–171. [Google Scholar] [CrossRef]
  85. Stoffel, M.; Ballesteros Cánovas, J.A.; Luckman, B.H.; Casteller, A.; Villalba, R. Tree-ring correlations suggest links between moderate earthquakes and distant rockfalls in the Patagonian Cordillera. Sci. Rep. 2019, 9, 12112. [Google Scholar] [CrossRef] [PubMed]
  86. Krause, S.; Sanders, T.G.M.; Mund, J.-P.; Greve, K. UAV-Based Photogrammetric Tree Height Measurement for Intensive Forest Monitoring. Remote Sens. 2019, 11, 758. [Google Scholar] [CrossRef] [Green Version]
  87. Corte, A.P.D.; Rex, F.E.; de Almeida, D.R.A.; Sanquetta, C.R.; Silva, C.A.; Moura, M.M.; Wilkinson, B.; Zambrano, A.M.A.; da Cunha Neto, E.M.; Veras, H.F.P.; et al. Measuring individual tree diameter and height using gatoreye high-density UAV-lidar in an integrated crop-livestock-forest system. Remote Sens. 2020, 12, 863. [Google Scholar] [CrossRef] [Green Version]
  88. Neuville, R.; Bates, J.S.; Jonard, F. Estimating Forest Structure from UAV-Mounted LiDAR Point Cloud Machine Learning. Remote Sens. 2021, 13, 352. [Google Scholar] [CrossRef]
  89. Brauner, M.; Weinmeister, W.; Agner, P.; Vospernik, S.; Hoesle, B. Forest management decision support for evaluating forest protection effects against rockfall. For. Ecol. Manag. 2005, 207, 75–85. [Google Scholar] [CrossRef]
  90. Bebi, P.; Seidl, R.; Motta, R.; Fuhr, M.; Firm, D.; Krumm, F.; Conedera, M.; Ginzler, C.; Wohlgemuth, T.; Kulakowski, D. Changes of forest cover and disturbance regimes in the mountain forests of the Alps. For. Ecol. Manag. 2017, 388, 43–56. [Google Scholar] [CrossRef] [Green Version]
  91. Sebald, J.; Senf, C.; Heiser, M.; Scheidl, C.; Pflugmacher, D.; Seidl, R. The effects of forest cover and disturbance on torrential hazards: Large-scale evidence from the Eastern Alps. Environ. Res. Lett. 2019, 14, 114032. [Google Scholar] [CrossRef] [Green Version]
  92. Richardson, A.J.; Wiegand, C.L. Distinguishing vegetation from soil background information. Photogramm. Eng. Remote Sens. 1977, 43, 1541–1552. [Google Scholar]
  93. Birth, G.S.; Birth, G.R. Measuring the color of growing turf with a reflectance spectrophotometer. Am. Soc. Agron. 1968, 60, 640–643. [Google Scholar] [CrossRef]
  94. Cruden, B.A.; Prabhu, D.; Martinez, R. Absolute radiation measurement in Venus and Mars entry conditions. J. Spacecr. Rocket. 2012, 49, 1069–1079. [Google Scholar] [CrossRef]
  95. Sripada, R.P.; Heiniger, R.W.; White, J.G.; Weisz, R. Aerial color infrared photography for determining late-season nitrogen requirements in corn. J. Agron. 2005, 97, 1443–1451. [Google Scholar] [CrossRef]
  96. Vogelmann, B.N.; Rock, D.M. Moss Red edge spectral measurements from sugar maple leaves. Int. J. Remote Sens. 1993, 14, 1563–1575. [Google Scholar] [CrossRef]
  97. Chen, P.; Haboudane, D.; Tremblay, N.; Wang, J.; Vigneault, P.; Li, B. New spectral indicator assessing the efficiency of crop nitrogen treatment in corn and wheat. Remote Sens. Environ. 2010, 114, 1987–1997. [Google Scholar] [CrossRef]
  98. Dash, J.; Curran, P.J. The MERIS terrestrial chlorophyll index. Int. J. Remote Sens. 2004, 25, 5403–5413. [Google Scholar] [CrossRef]
  99. Gitelson, A.A.; Gritz, Y.; Merzlyak, M.N. Relationships between Leaf Chlorophyll Content and Spectral Reflectance and Algorithms for Non-Destructive Chlorophyll Assessment in Higher Plant Leaves. J. Plant Physiol. 2003, 160, 271–282. [Google Scholar] [CrossRef]
  100. Rouse, J.W.; Haas, R.H.; Schell, J.A.; Deering, D.W. Monitoring vegetation systems in the Great Plains with ERTS. In Third Earth Resources Technology Satellite—1 Symposium. Volume I: Technical Presentations, NASA SP-351; Freden, S.C., Mercanti, E.P., Becker, M., Eds.; NASA: Washington, DC, USA, 1974; pp. 309–317. [Google Scholar]
  101. Baret, F.; Guyot, G. Potentials and limits of vegetation indices for LAI and APAR assessment. Remote Sens. Environ. 1991, 35, 161–173. [Google Scholar] [CrossRef]
  102. Gitelson, A.A.; Kaufman, Y.J.; Merzlyak, M.N. Use of a green channel in remote sensing of global vegetation from EOS-MODIS. Remote Sens. Environ. 1996, 58, 289–298. [Google Scholar] [CrossRef]
  103. Gitelson, A.; Merzlyak, M.N. Spectral Reflectance Changes Associated with Autumn Senescence of Aesculus hippocastanum L. and Acer platanoides L. Leaves. Spectral Features and Relation to Chlorophyll Estimation. J. Plant Physiol. 1994, 143, 286–292. [Google Scholar] [CrossRef]
Figure 1. The locations of study sites.
Forests 13 01039 g001
Figure 2. Three-dimensional visualization of the study sites including pictures from the field: (a,d) Kekec, (b,e) Cerkev, and (c,f) Jelovica.
Forests 13 01039 g002
Figure 3. The examples of most common injuries: (a) injury to the bark, (b) injury to the bark and wood, (c) resin flow (fresh and transparent to white), (d) resin burls (old and yellow to dark brown), (e) inclusion of the rocks in the injury, and (f) cracked steam.
Forests 13 01039 g003
Figure 4. (a) An example of the GCP target and (b) Parrot Sequoia camera mounted on DJI Phantom 3.
Forests 13 01039 g004
Figure 5. Flight paths of the UAV surveys and locations of ground control points (GCPs) for (a) Jelovica, (b) Cerkev (the same for all surveys), and (c) Kekec.
Forests 13 01039 g005
Figure 6. Locations of uninjured and injured trees with examples of injuries for each site (a) Jelovica, (b) Cerkev, and (c) Kekec.
Forests 13 01039 g006
Figure 7. Calculated decile values (x-axis: d) and coefficient of determination (R2) between uninjured and injured trees for each vegetation index (VI) for Jelovica site (rockfall impacts in year 0), Cerkev site (rockfall impacts in year 1), and Kekec site (rockfall impacts in year 6). The results are shown only in cases where there is statistical significance of the results.
Forests 13 01039 g007
Figure 8. Map of vegetation index RVI for (a) Jelovica—16 August 2019, (b) Cerkev—4 July 2018, and (c) Kekec—3 July 2018 Red tree crowns are uninjured trees, black tree crowns are injured trees.
Forests 13 01039 g008
Figure 9. Vegetation index RVI calculated for each tree species and tree group separately (injured/uninjured).
Forests 13 01039 g009
Figure 10. The sum of mean index values at the Cerkev site of the tree crowns and the significance of the difference between the injured and uninjured trees, described by R2. The sum of the mean is performed over three time periods—among years 2018, 2019, and 2020.
Forests 13 01039 g010
Figure 11. Difference between two groups of injuries at: Jelovica (group 1—injuries to the bark or bark and wood and resin flow; group 2—additional injuries: cracked steam, injured/exposed roots, and missing tree tops) and at Cerkev (group 1—injuries to the bark and bark and wood, resin flow, and inclusion of rocks into the injury; group 2—additional injuries: missing tree tops and branches, steam breakage, injured/exposed roots, tilted tree, and cracked stem).
Forests 13 01039 g011
Figure 12. The relation between the injury index (DBH in m2/basal area in m2 of individual tree) and mean RVI values. Data are shown for the Cerkev site (4 July 2018) for conifers and for the Kekec site (3 July 2018) for broadleaves.
Forests 13 01039 g012
Table 1. Overview of rockfall activity and dendrometric parameters at each site.
Jelovica SiteCerkev SiteKekec Site
Year of rockfall event201920182011
Tree speciesPicea abies (L.) Karsten, Abies alba Mill.Larix decidua Mill.,
Pinus sylvestris L.,
Picea abies (L.) Karsten
Fagus sylvatica L.
Number of injured trees in analysis222311
Number of uninjured trees in analysis272214
Average DBH of injured trees (cm)47.1732.8835.86
Average DBH of uninjured trees (cm)43.2138.6436.44
Min DBH of injured trees (cm)17.0724.3018.34
Min DBH of uninjured trees (cm)13.1326.8721.23
Max DBH of injured trees (cm)68.5543.5152.84
Max DBH of uninjured trees (cm)70.2757.2259.62
Table 2. The list of all tree injury categories and parameters of each injury—shape of the injury and injury stage.
Tree Injury Category
injury to the barkmissing branches
injury to the bark and woodstem breakage
resin flow (fresh and transparent to white)injured/exposed roots
resin burls (old and yellow to dark brown)tilted tree
inclusion of rocks in the injurypresent fungi at the injury
missing tree topscracked stem
Shape of Injury
CircleRectangle
EllipseTriangle
Square
Table 3. An overview of characteristics of rockfall injuries at all three-study sites.
Overview of Rockfall InjuriesJelovica SiteCerkev SiteKekec Site
Number of injured trees222311
Total number of injuries recorded 5512561
Min number of injuries per tree114
Max number of injuries per tree7187
Min height of the injury20 cm0 cm0 cm
Max height of injury189 cm750 cm300 cm
Average height of injury99 cm182 cm64 cm
Number of Different Injury CategoriesJelovica SiteCerkev SiteKekec Site
1 injury 021
2 injuries1308
3 injuries652
4 injuries370
5 injuries060
6 injuries030
Injury ShapesJelovica SiteCerkev SiteKekec Site
circle142711
ellipse213624
square2110
rectangle184926
triangle020
Table 4. An overview of characteristics of rockfall injuries at all three study sites.
% of Recorded Injury Categories
Overview of Rockfall InjuriesJelovica Site
(Number of Trees = 22;
Number of Total
Injuries 55)
Cerkev Site
(Number of Trees = 23;
Number of Total
Injuries 125)
Kekec Site
(Number of Trees = 11;
Number of Total
Injuries 61)
injury to the bark4074
injury to the bark and wood382623
resin flow (fresh and transparent to white)38180
resin burls (old and yellow to dark brown)7200
inclusion of rocks in the injury033
missing tree tops2100
missing branches0190
stem breakage000
injured/exposed roots220
tilted tree010
present fungi at the injury000
cracked stem910
Publisher’s Note: MDPI stays neutral with regard to jurisdictional claims in published maps and institutional affiliations.

