
Green Infrastructure Network Identification at a Regional Scale: The Case of Nanjing Metropolitan Area, China


Abstract
:1. Introduction
2. Materials and Methods
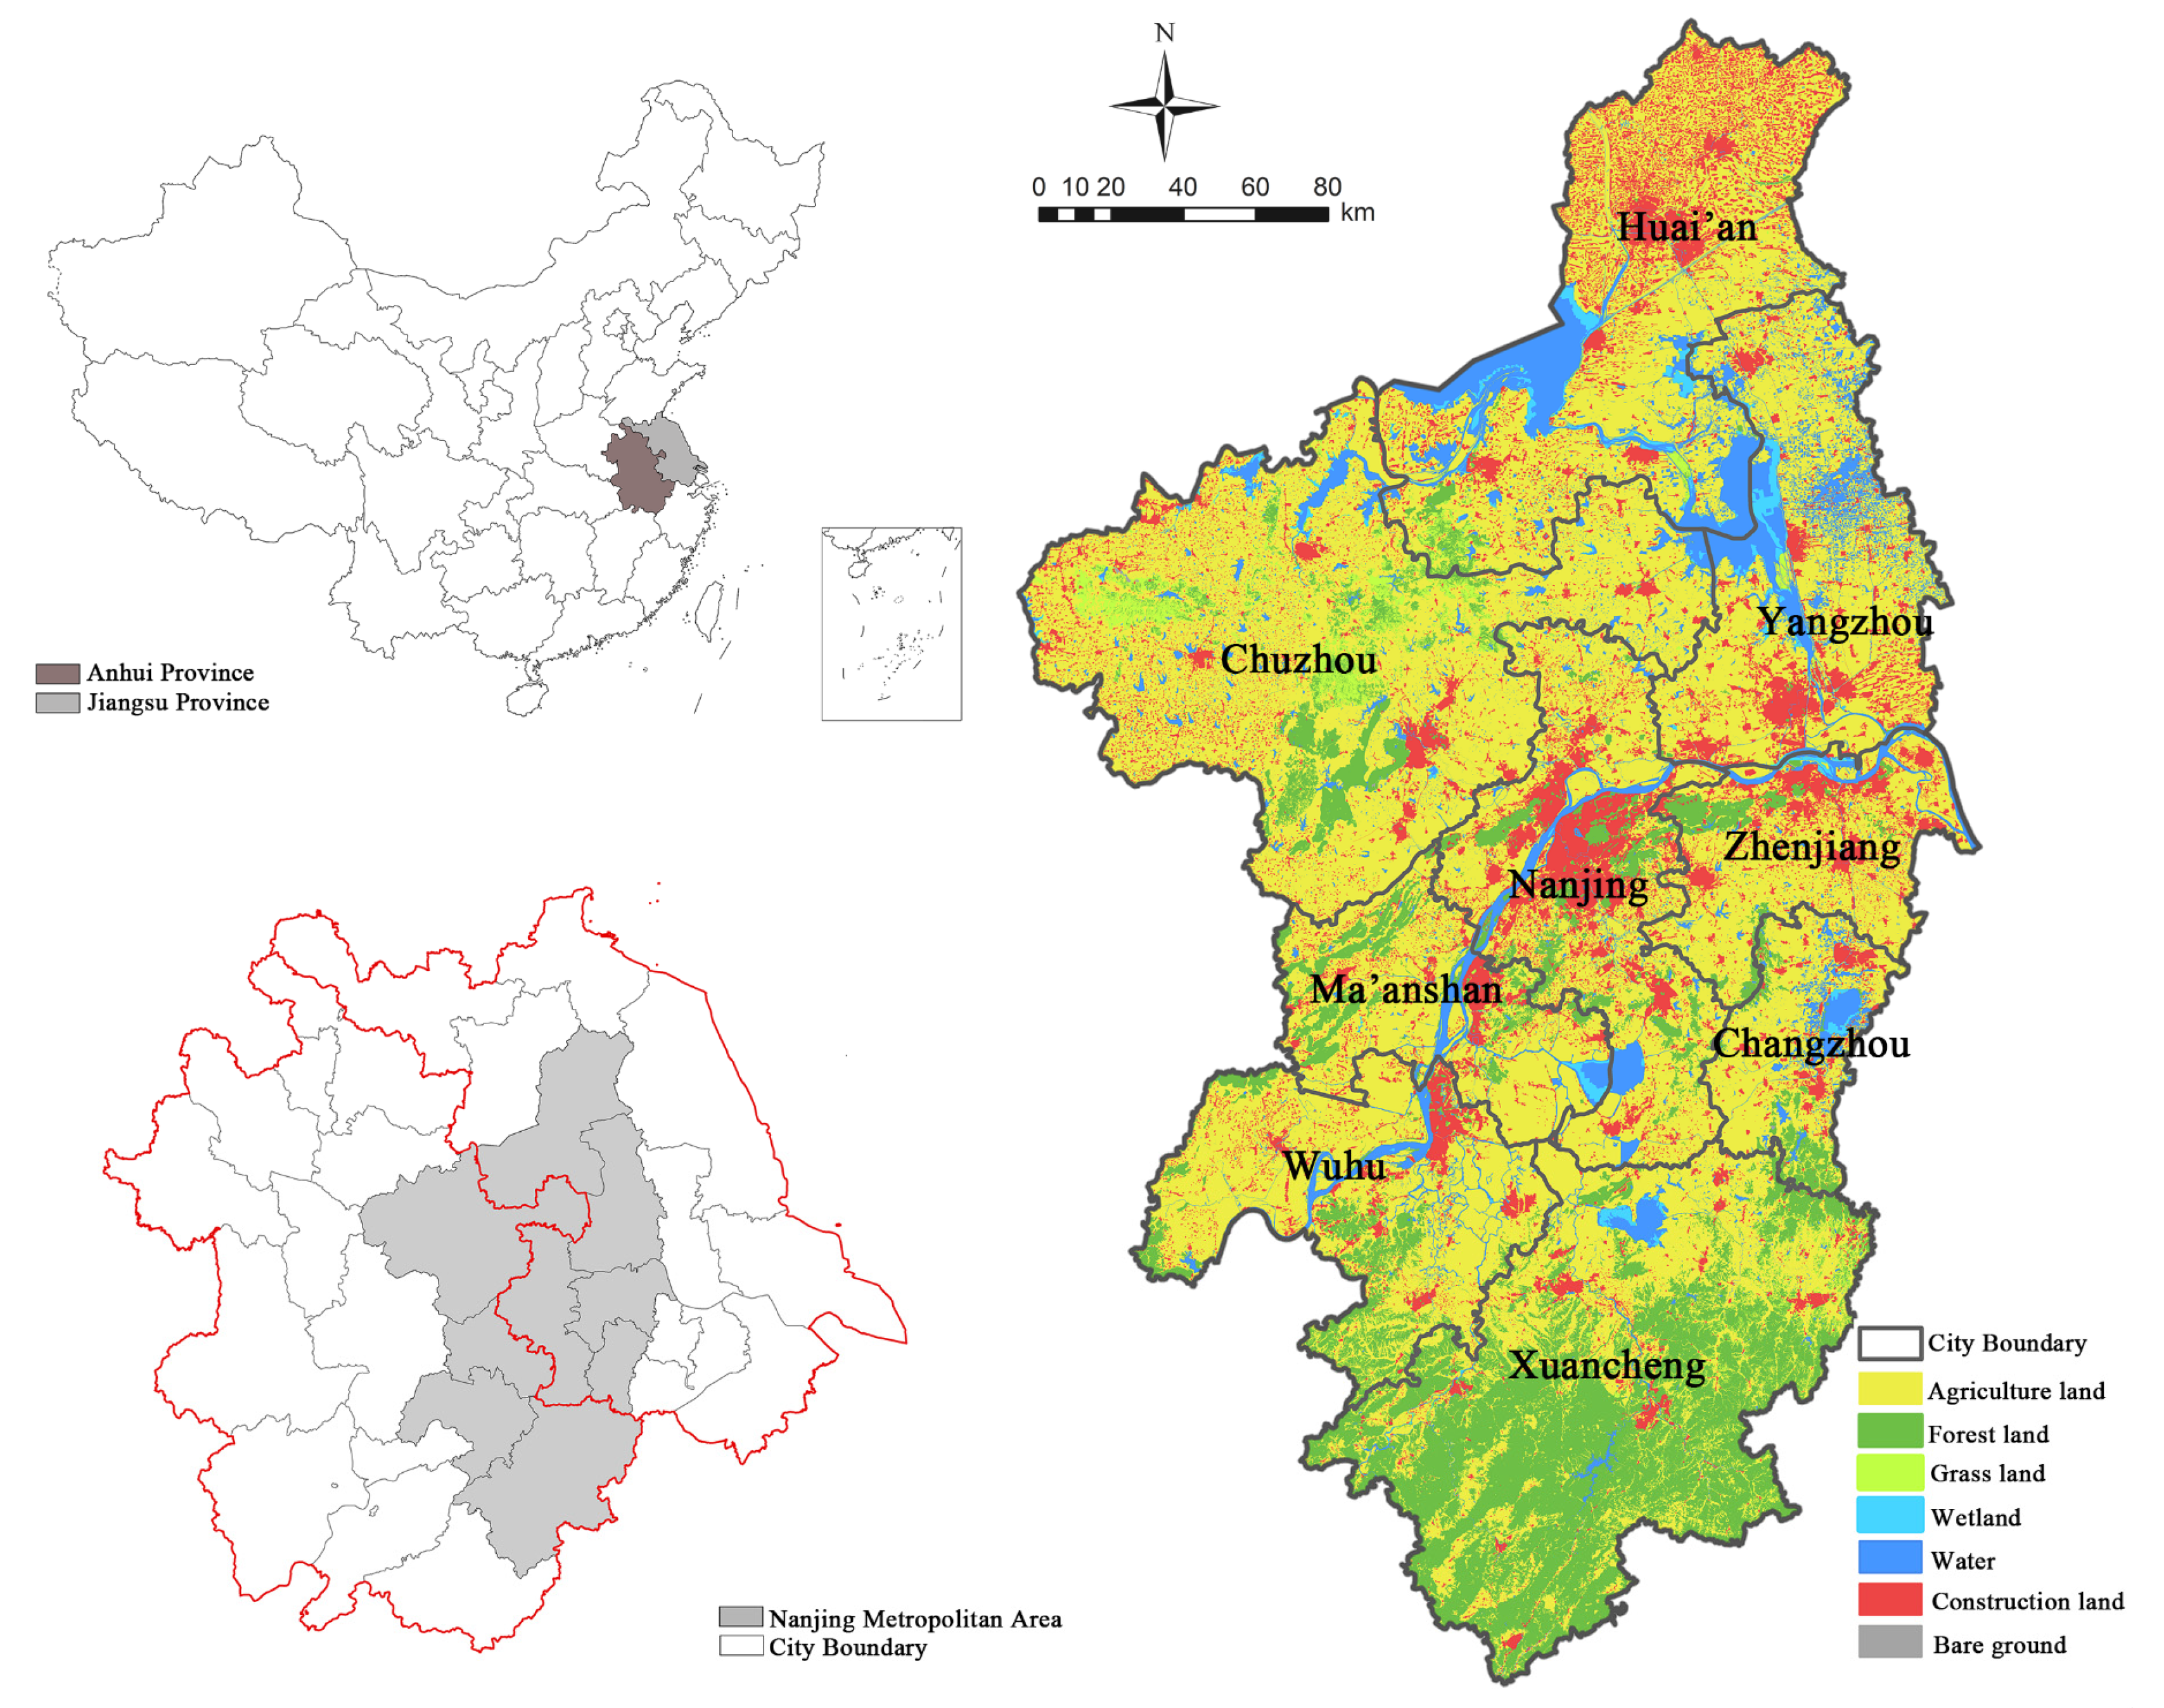
2.1. Study Area
2.2. Data
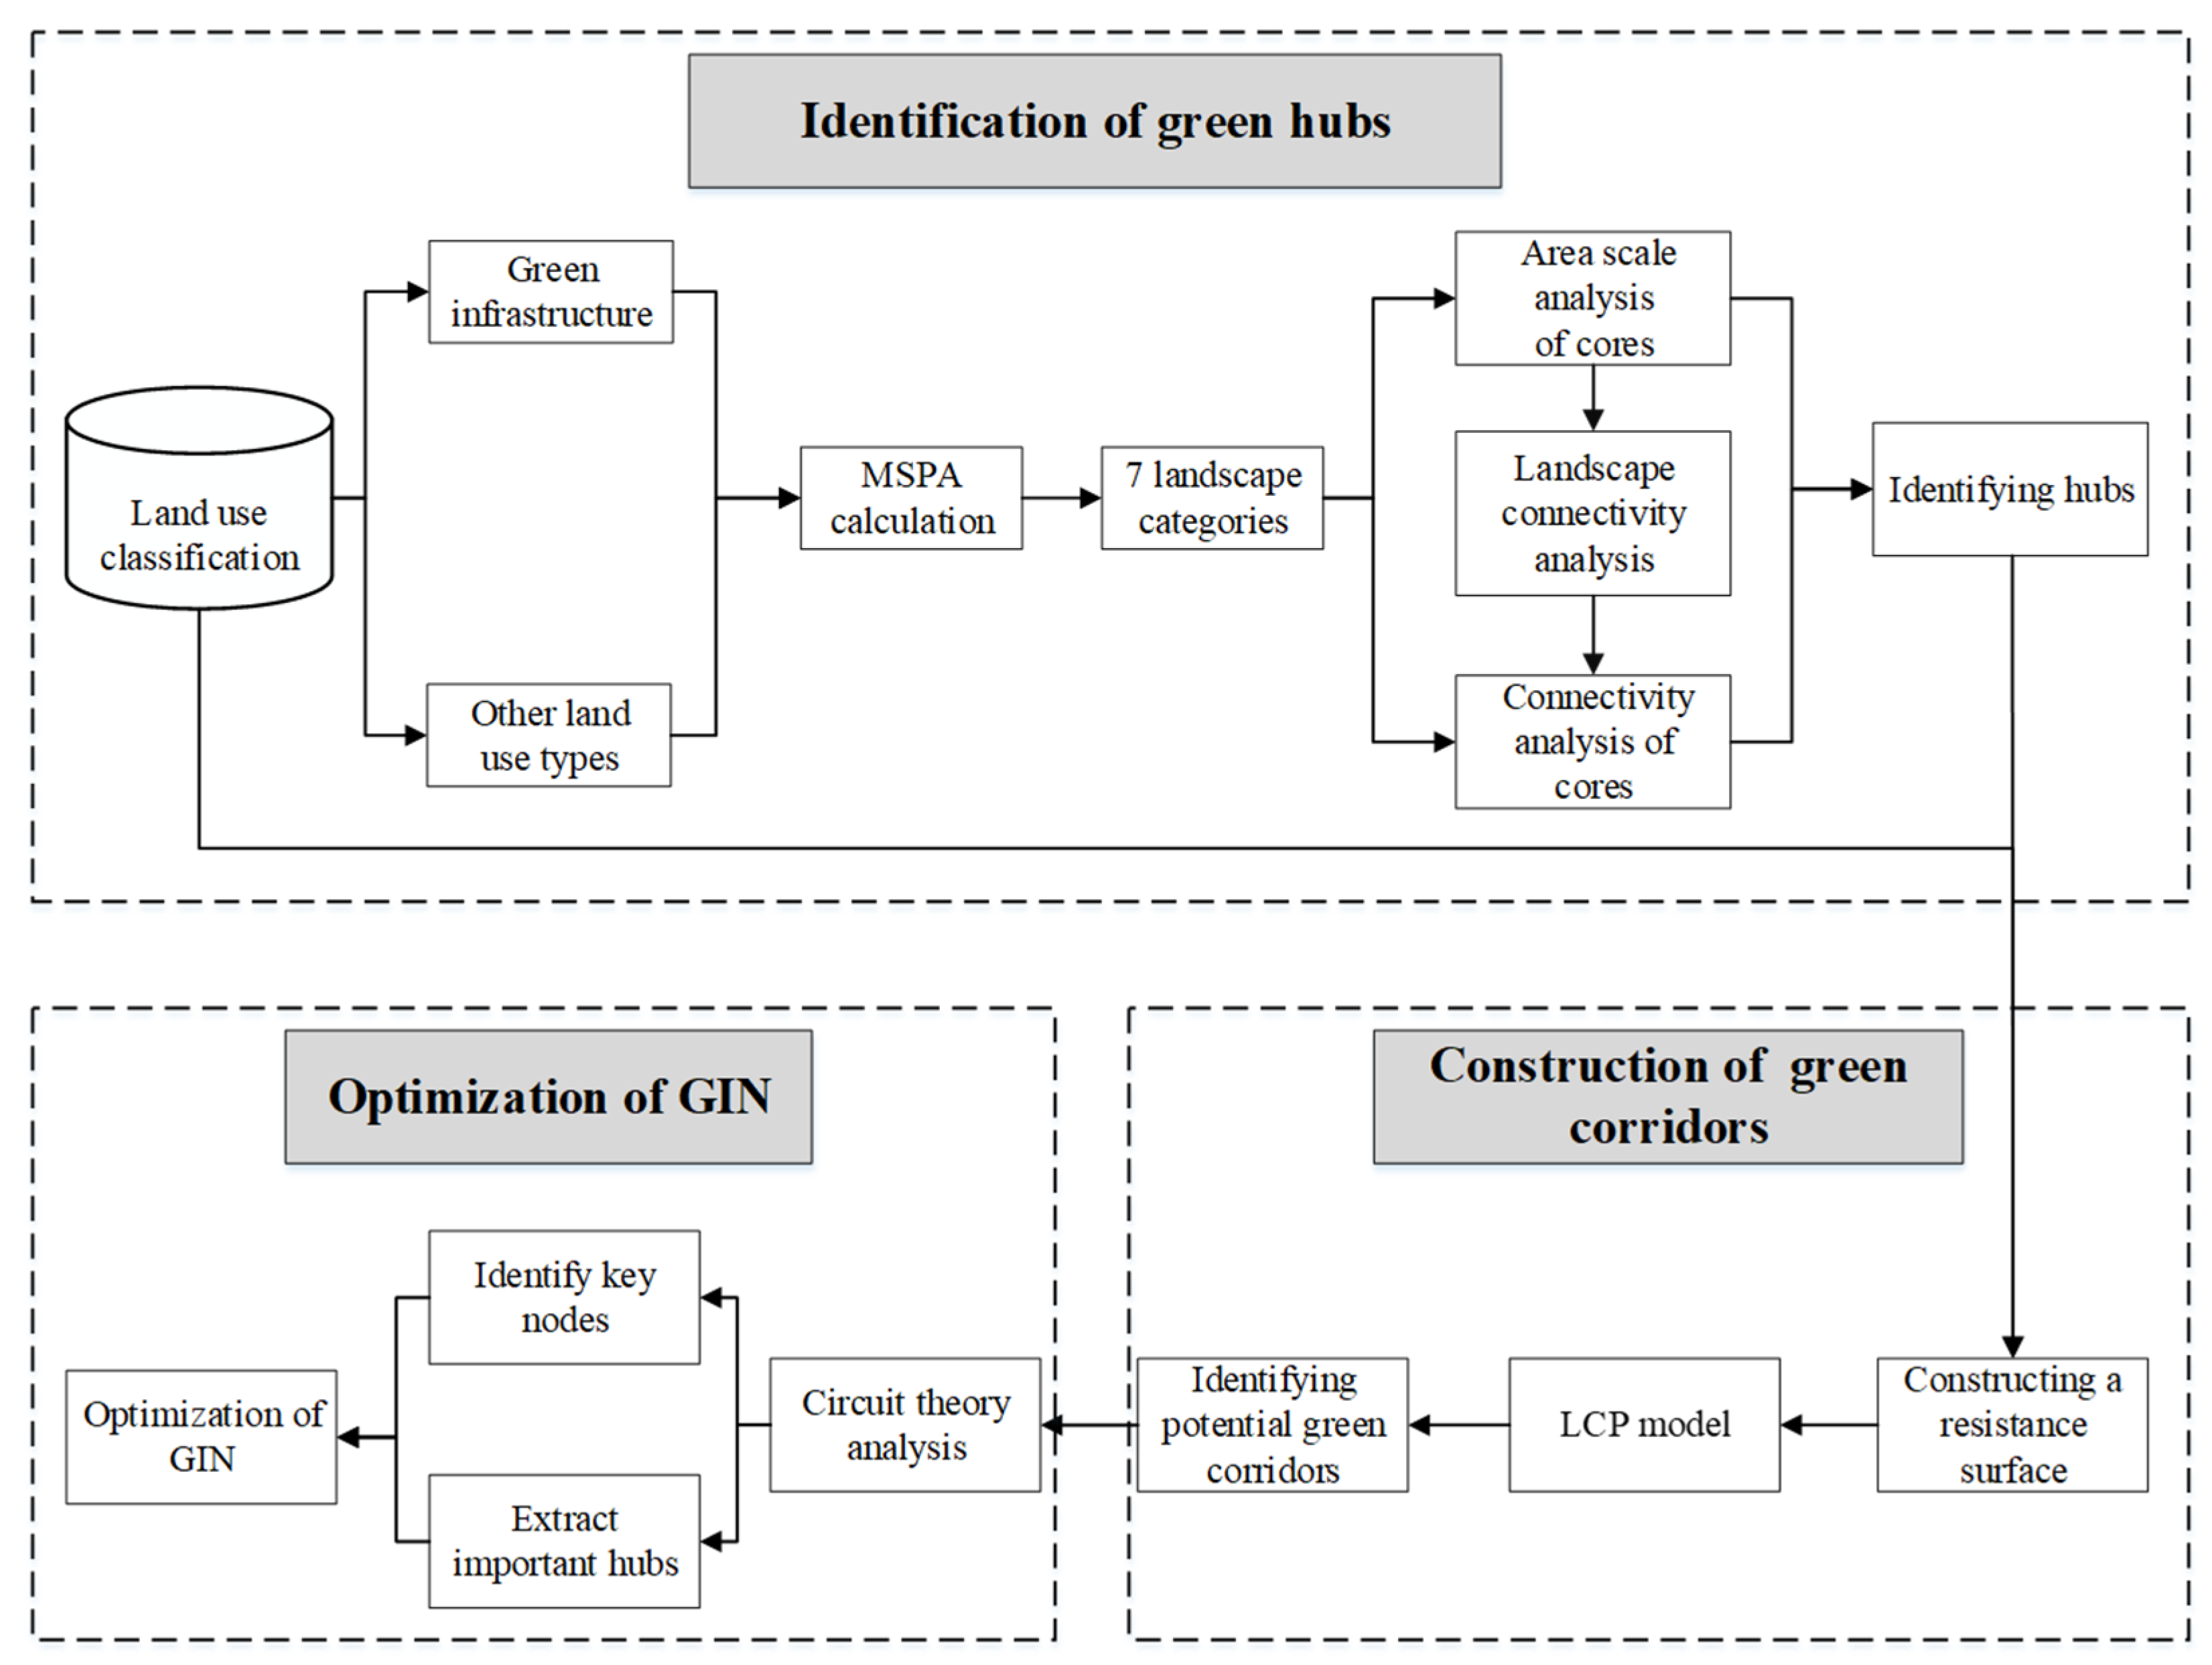
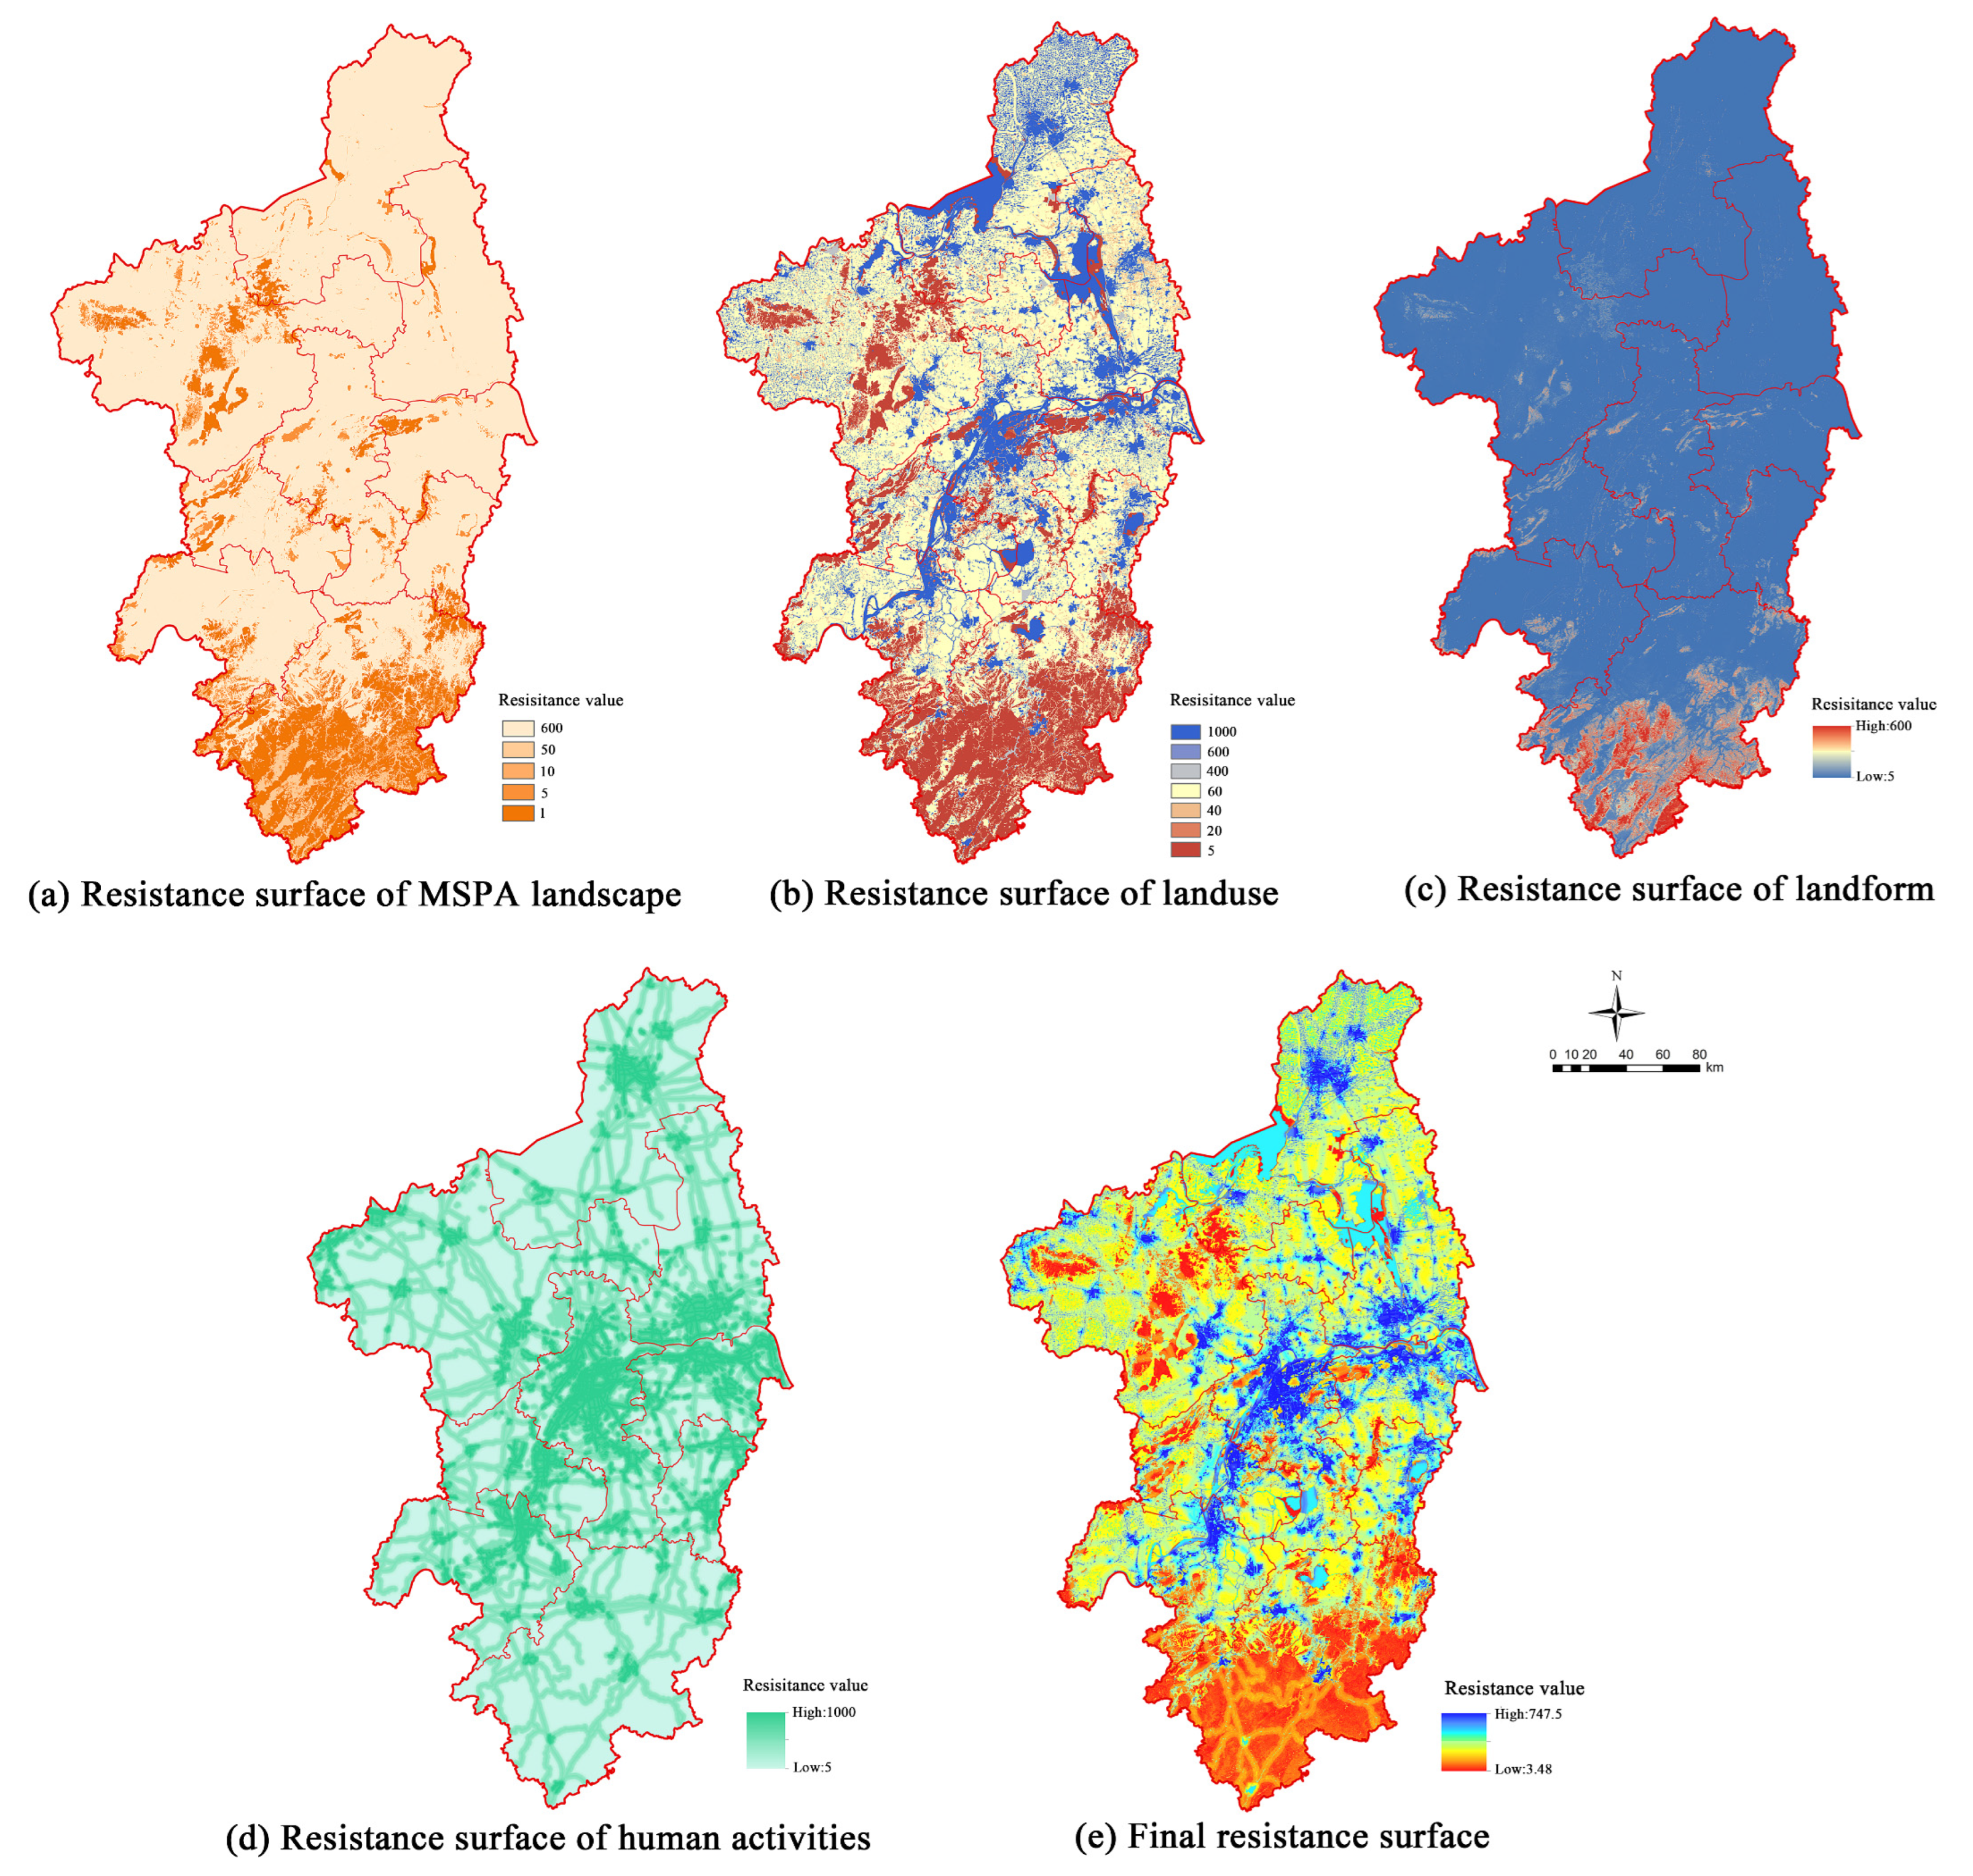
2.3. Methods
2.3.1. Identification of Landscape Elements Based on MSPA
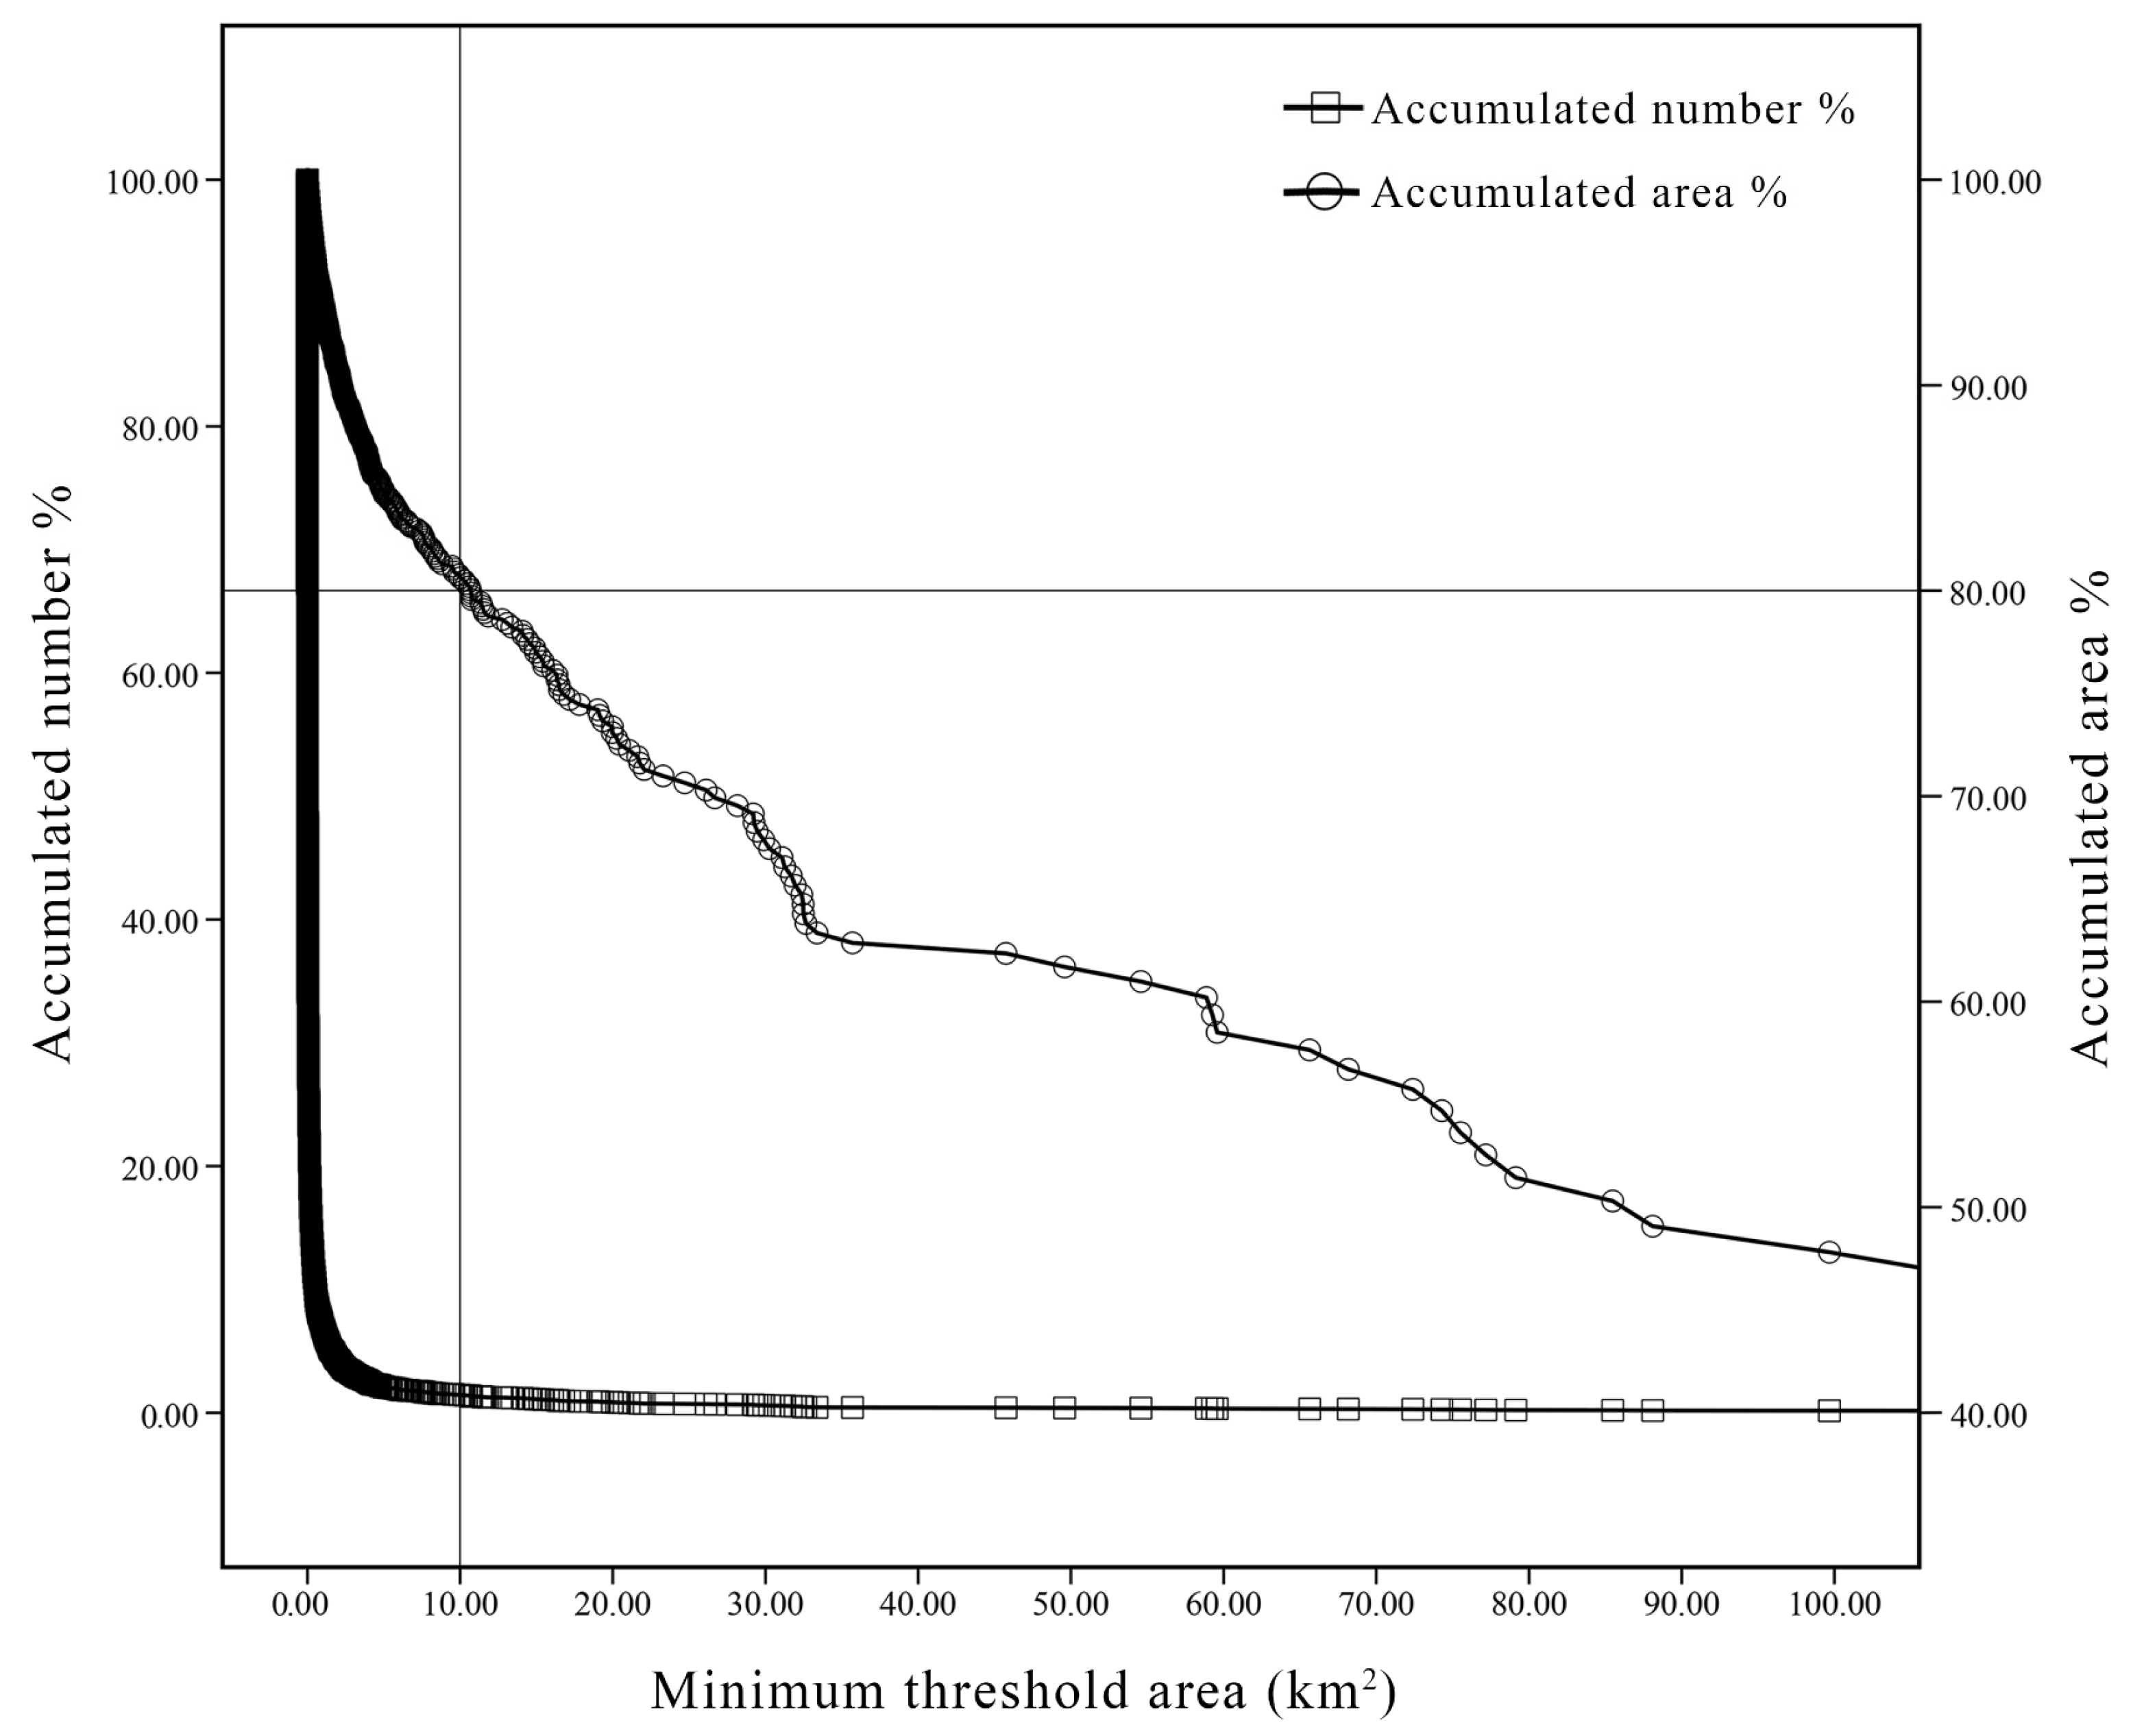
2.3.2. Hubs Extraction Based on Scale and Connectivity
2.3.3. Corridors Construction Based on LCP
2.3.4. GI Optimization Based on CT
- 1.
- Centrality identification
- 2.
- Key ecological nodes identification
3. Results
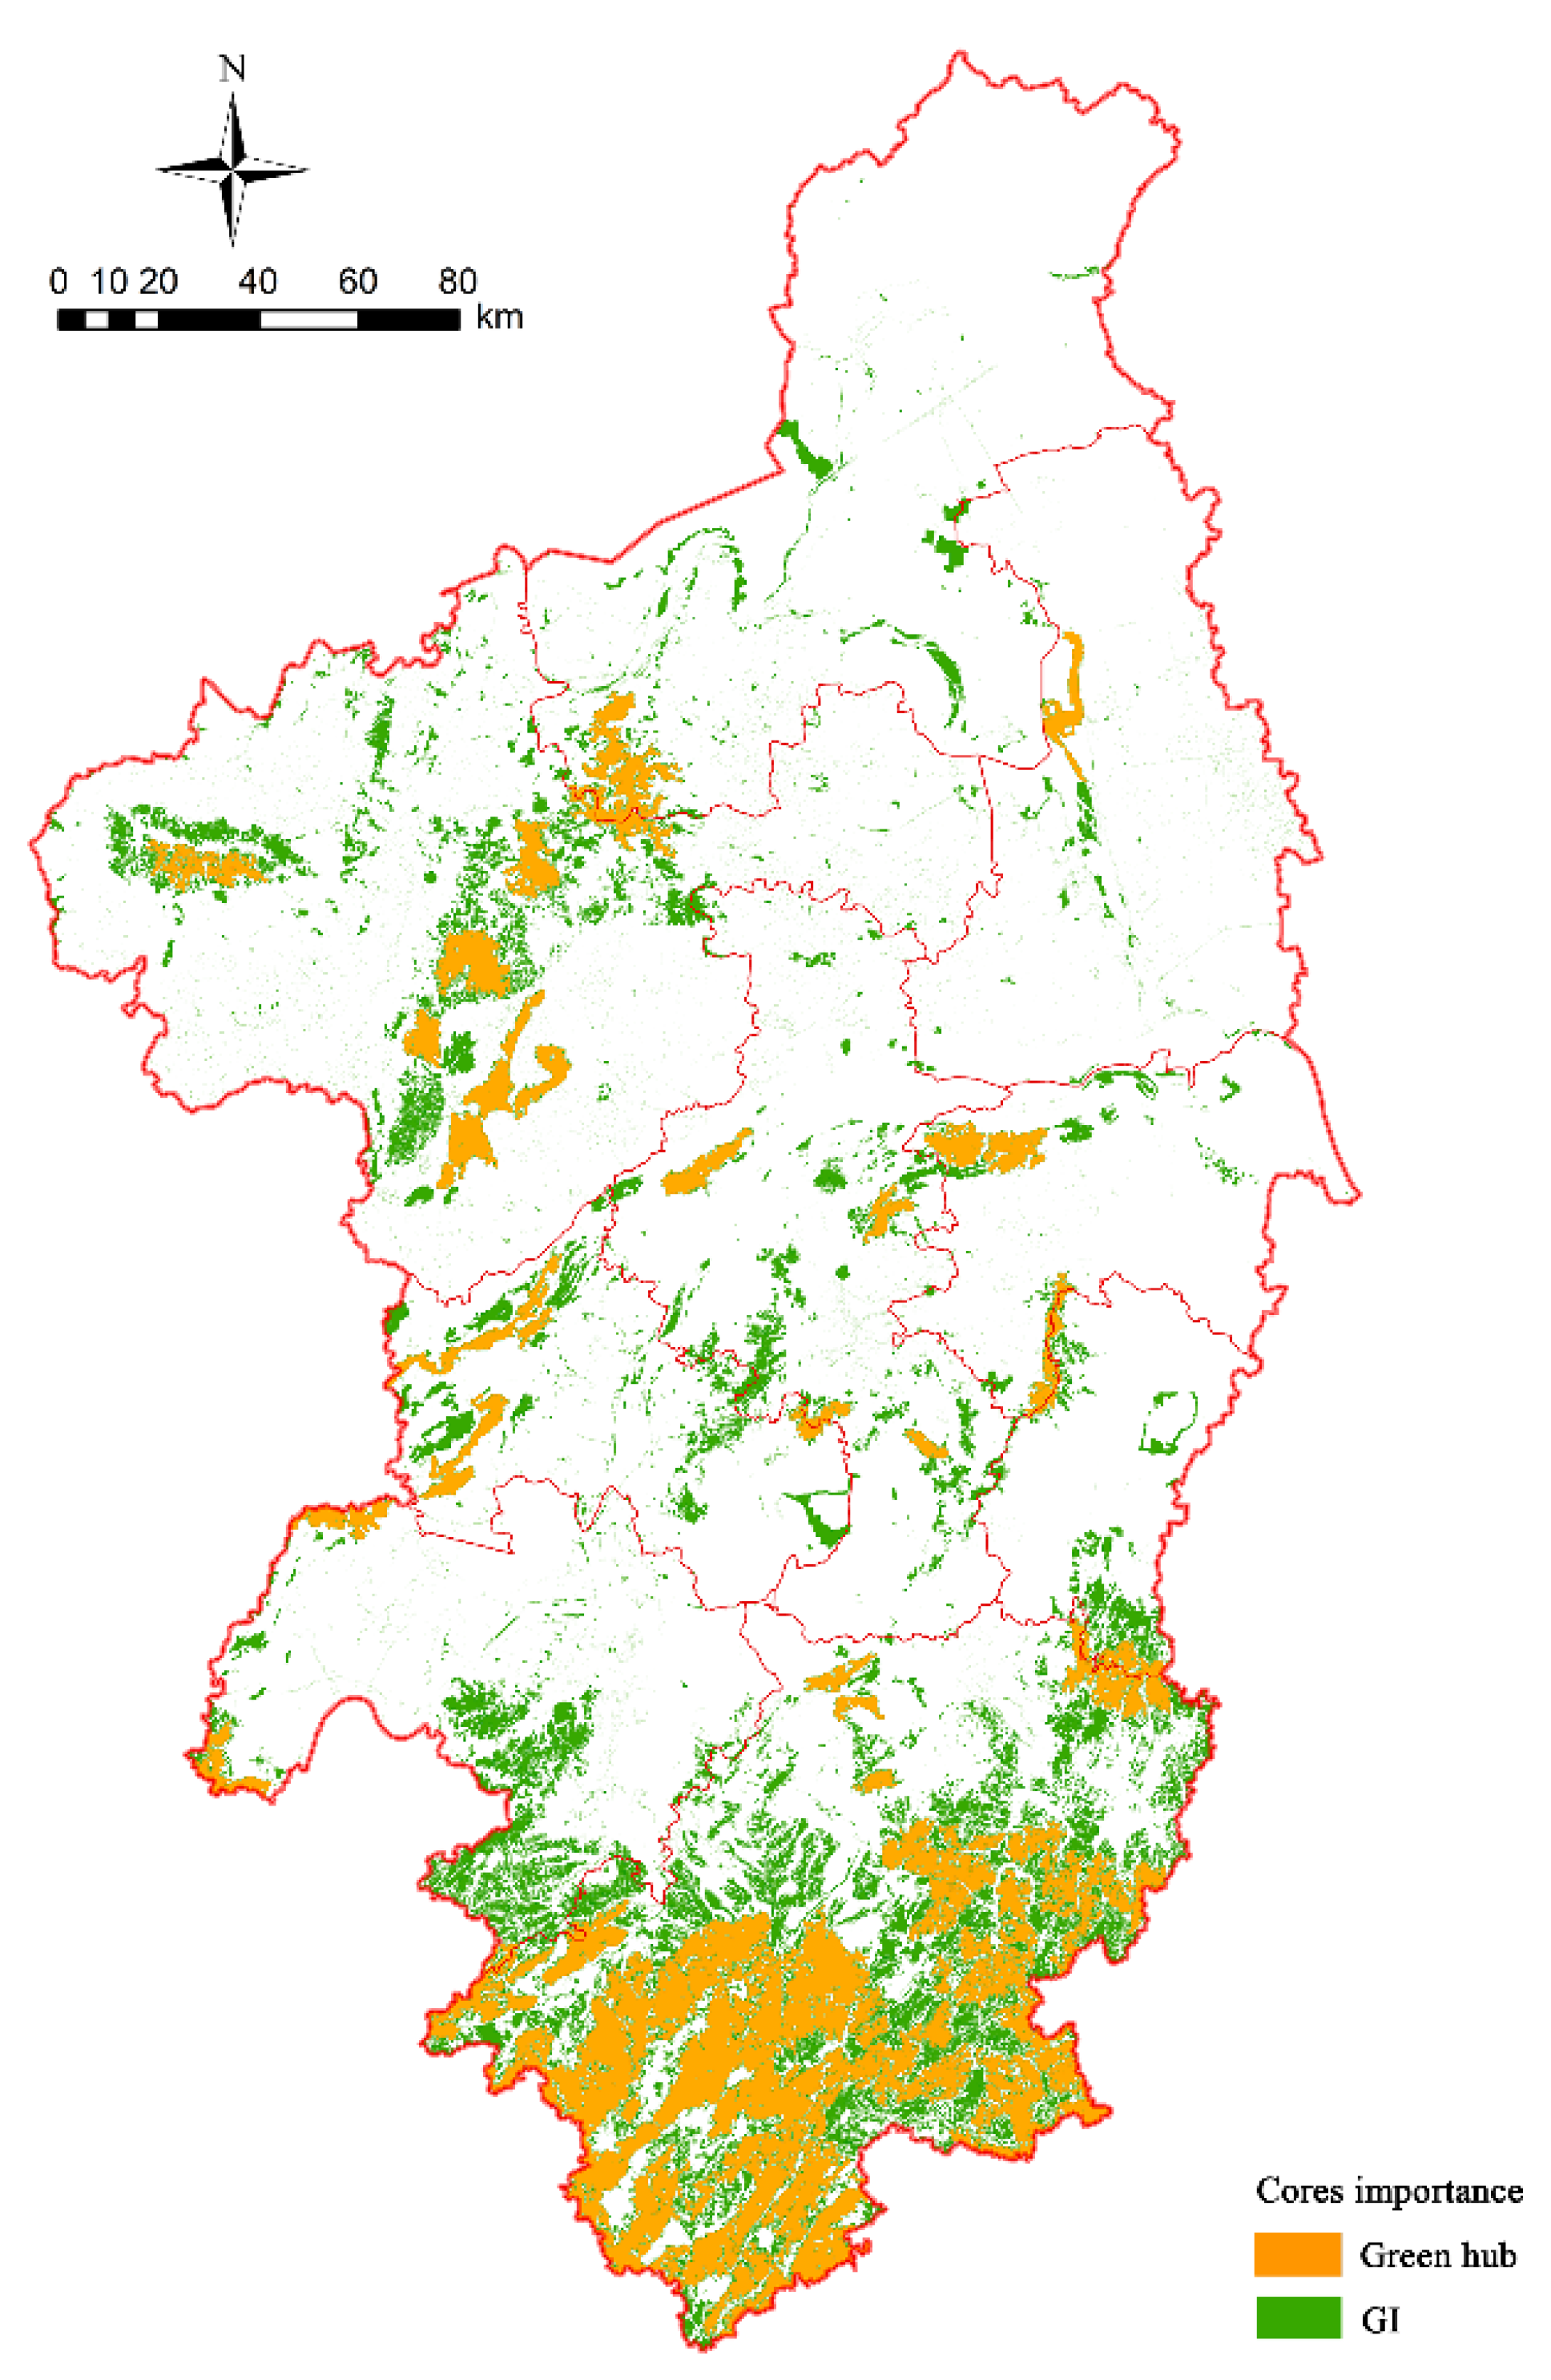
3.1. Identification Analysis of Hubs
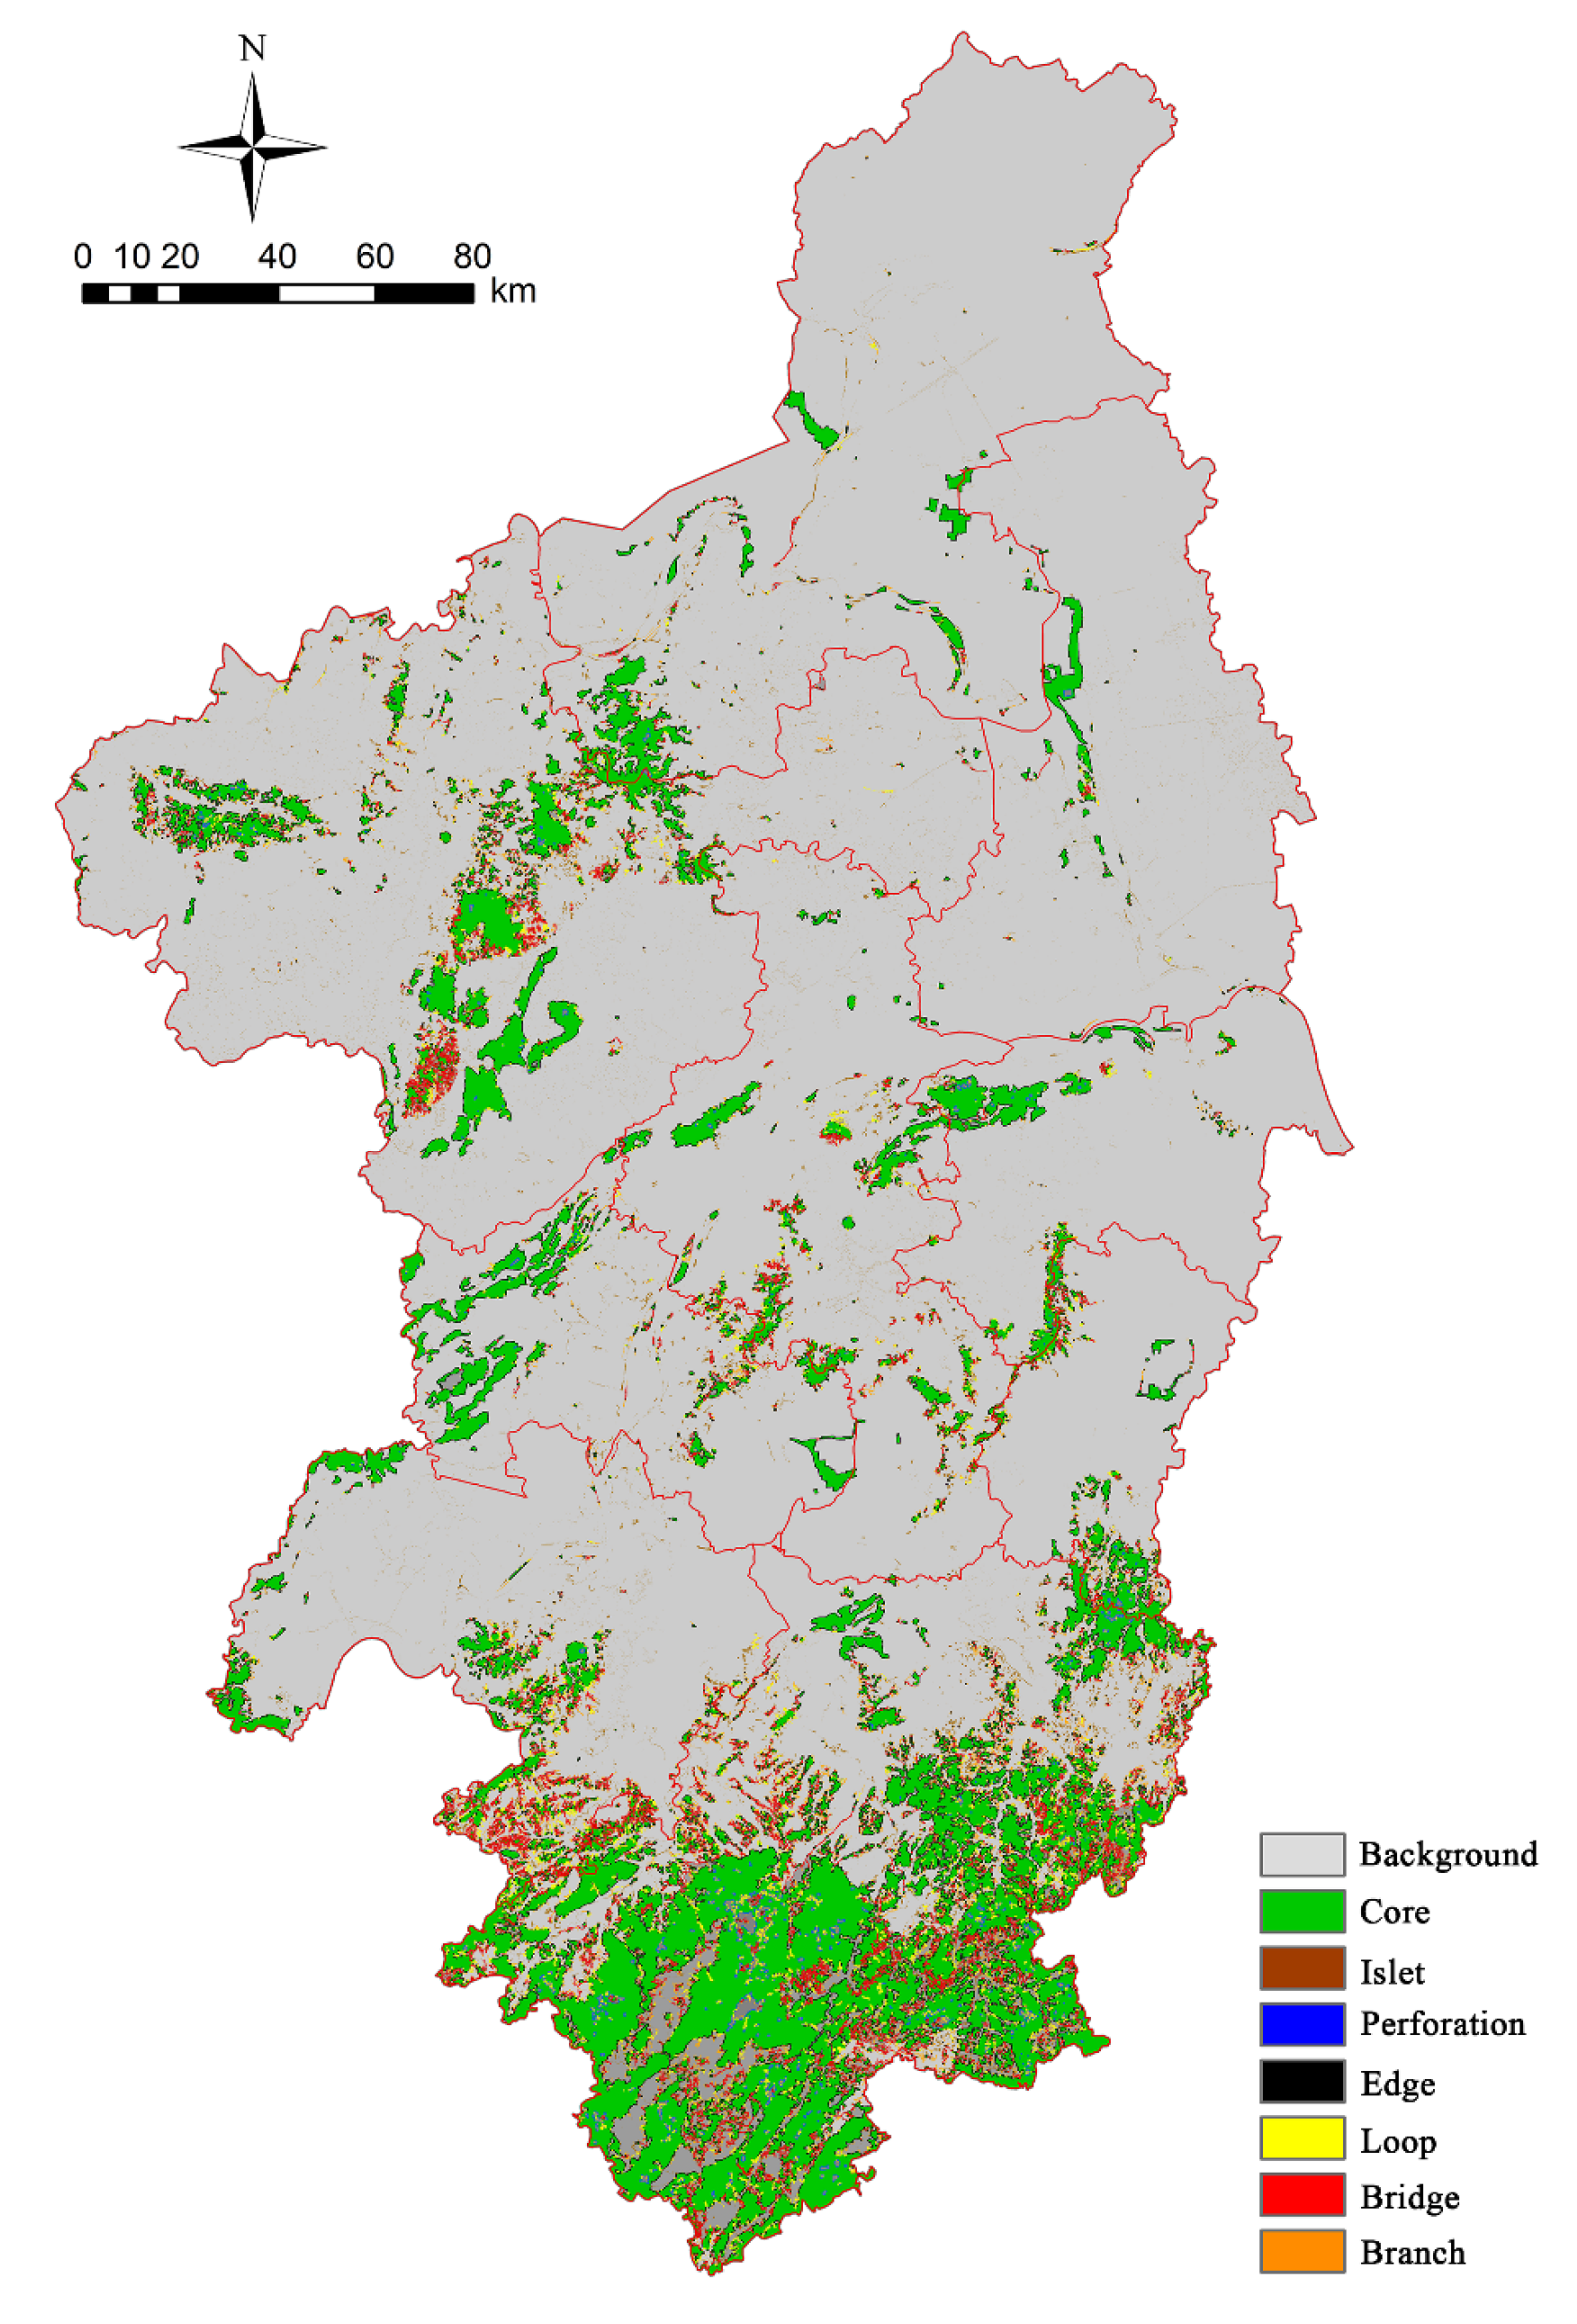
3.1.1. Landscape Pattern of the GI
3.1.2. Identification of Hubs
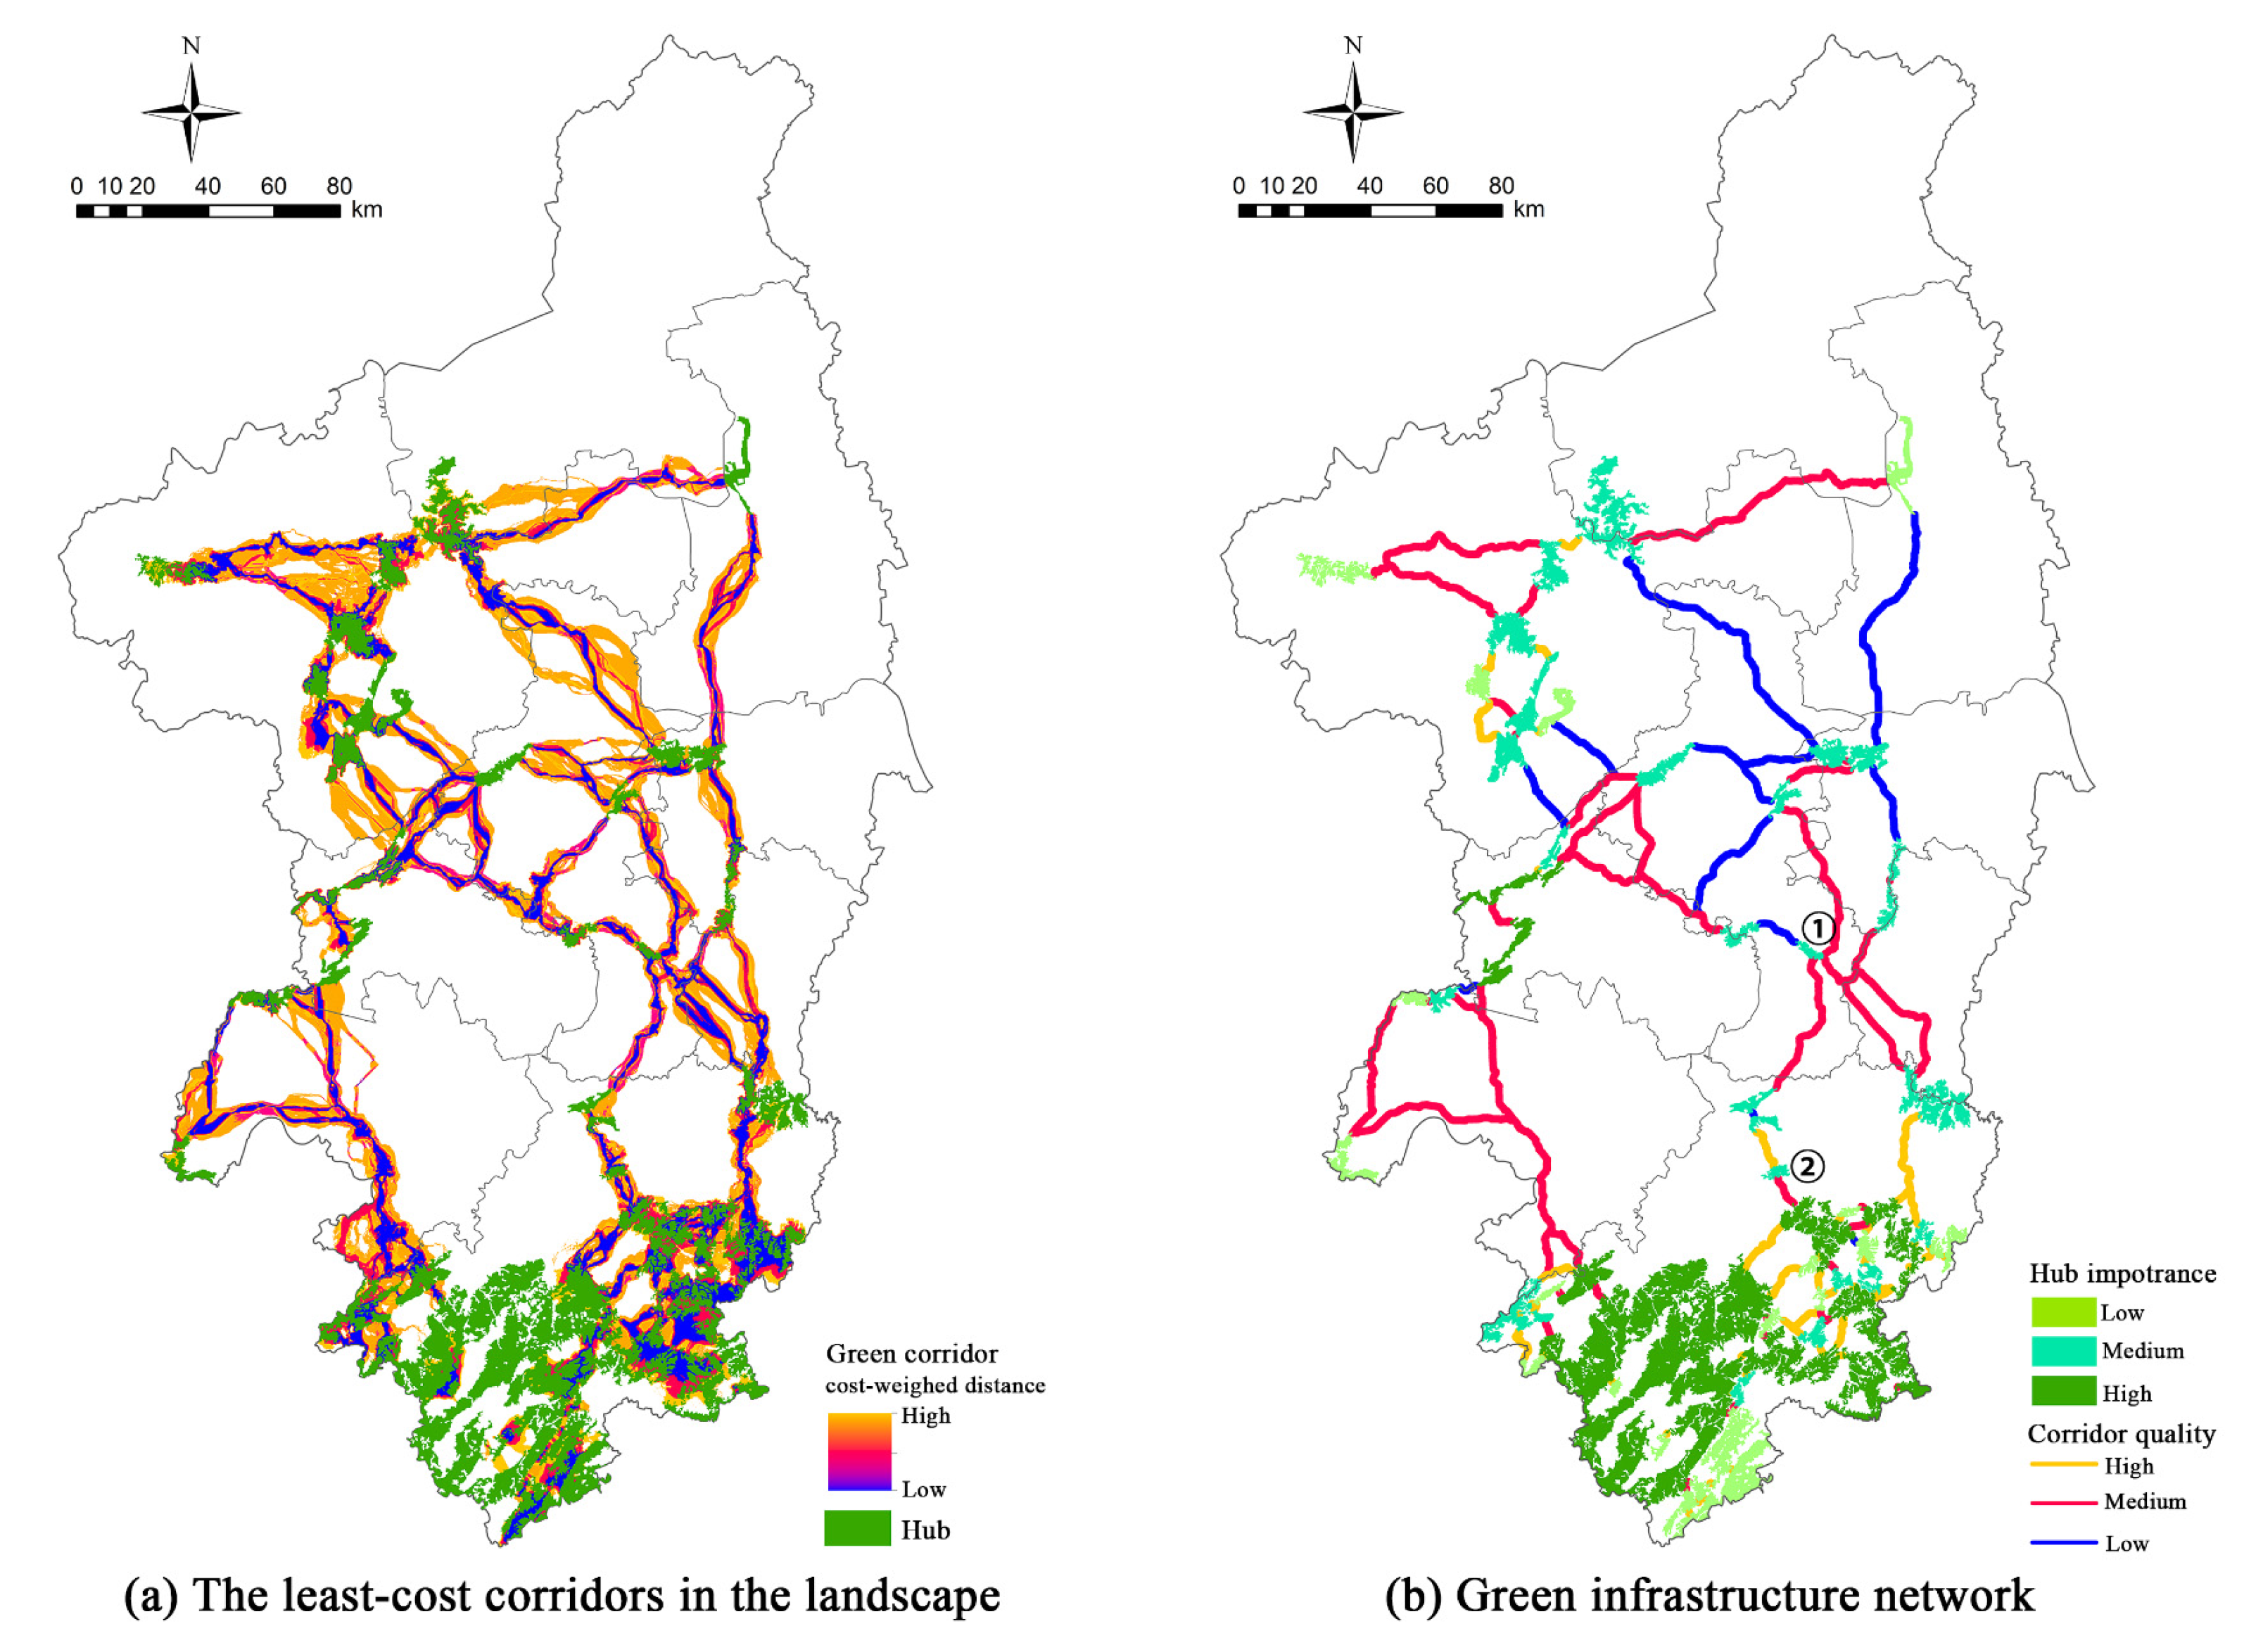
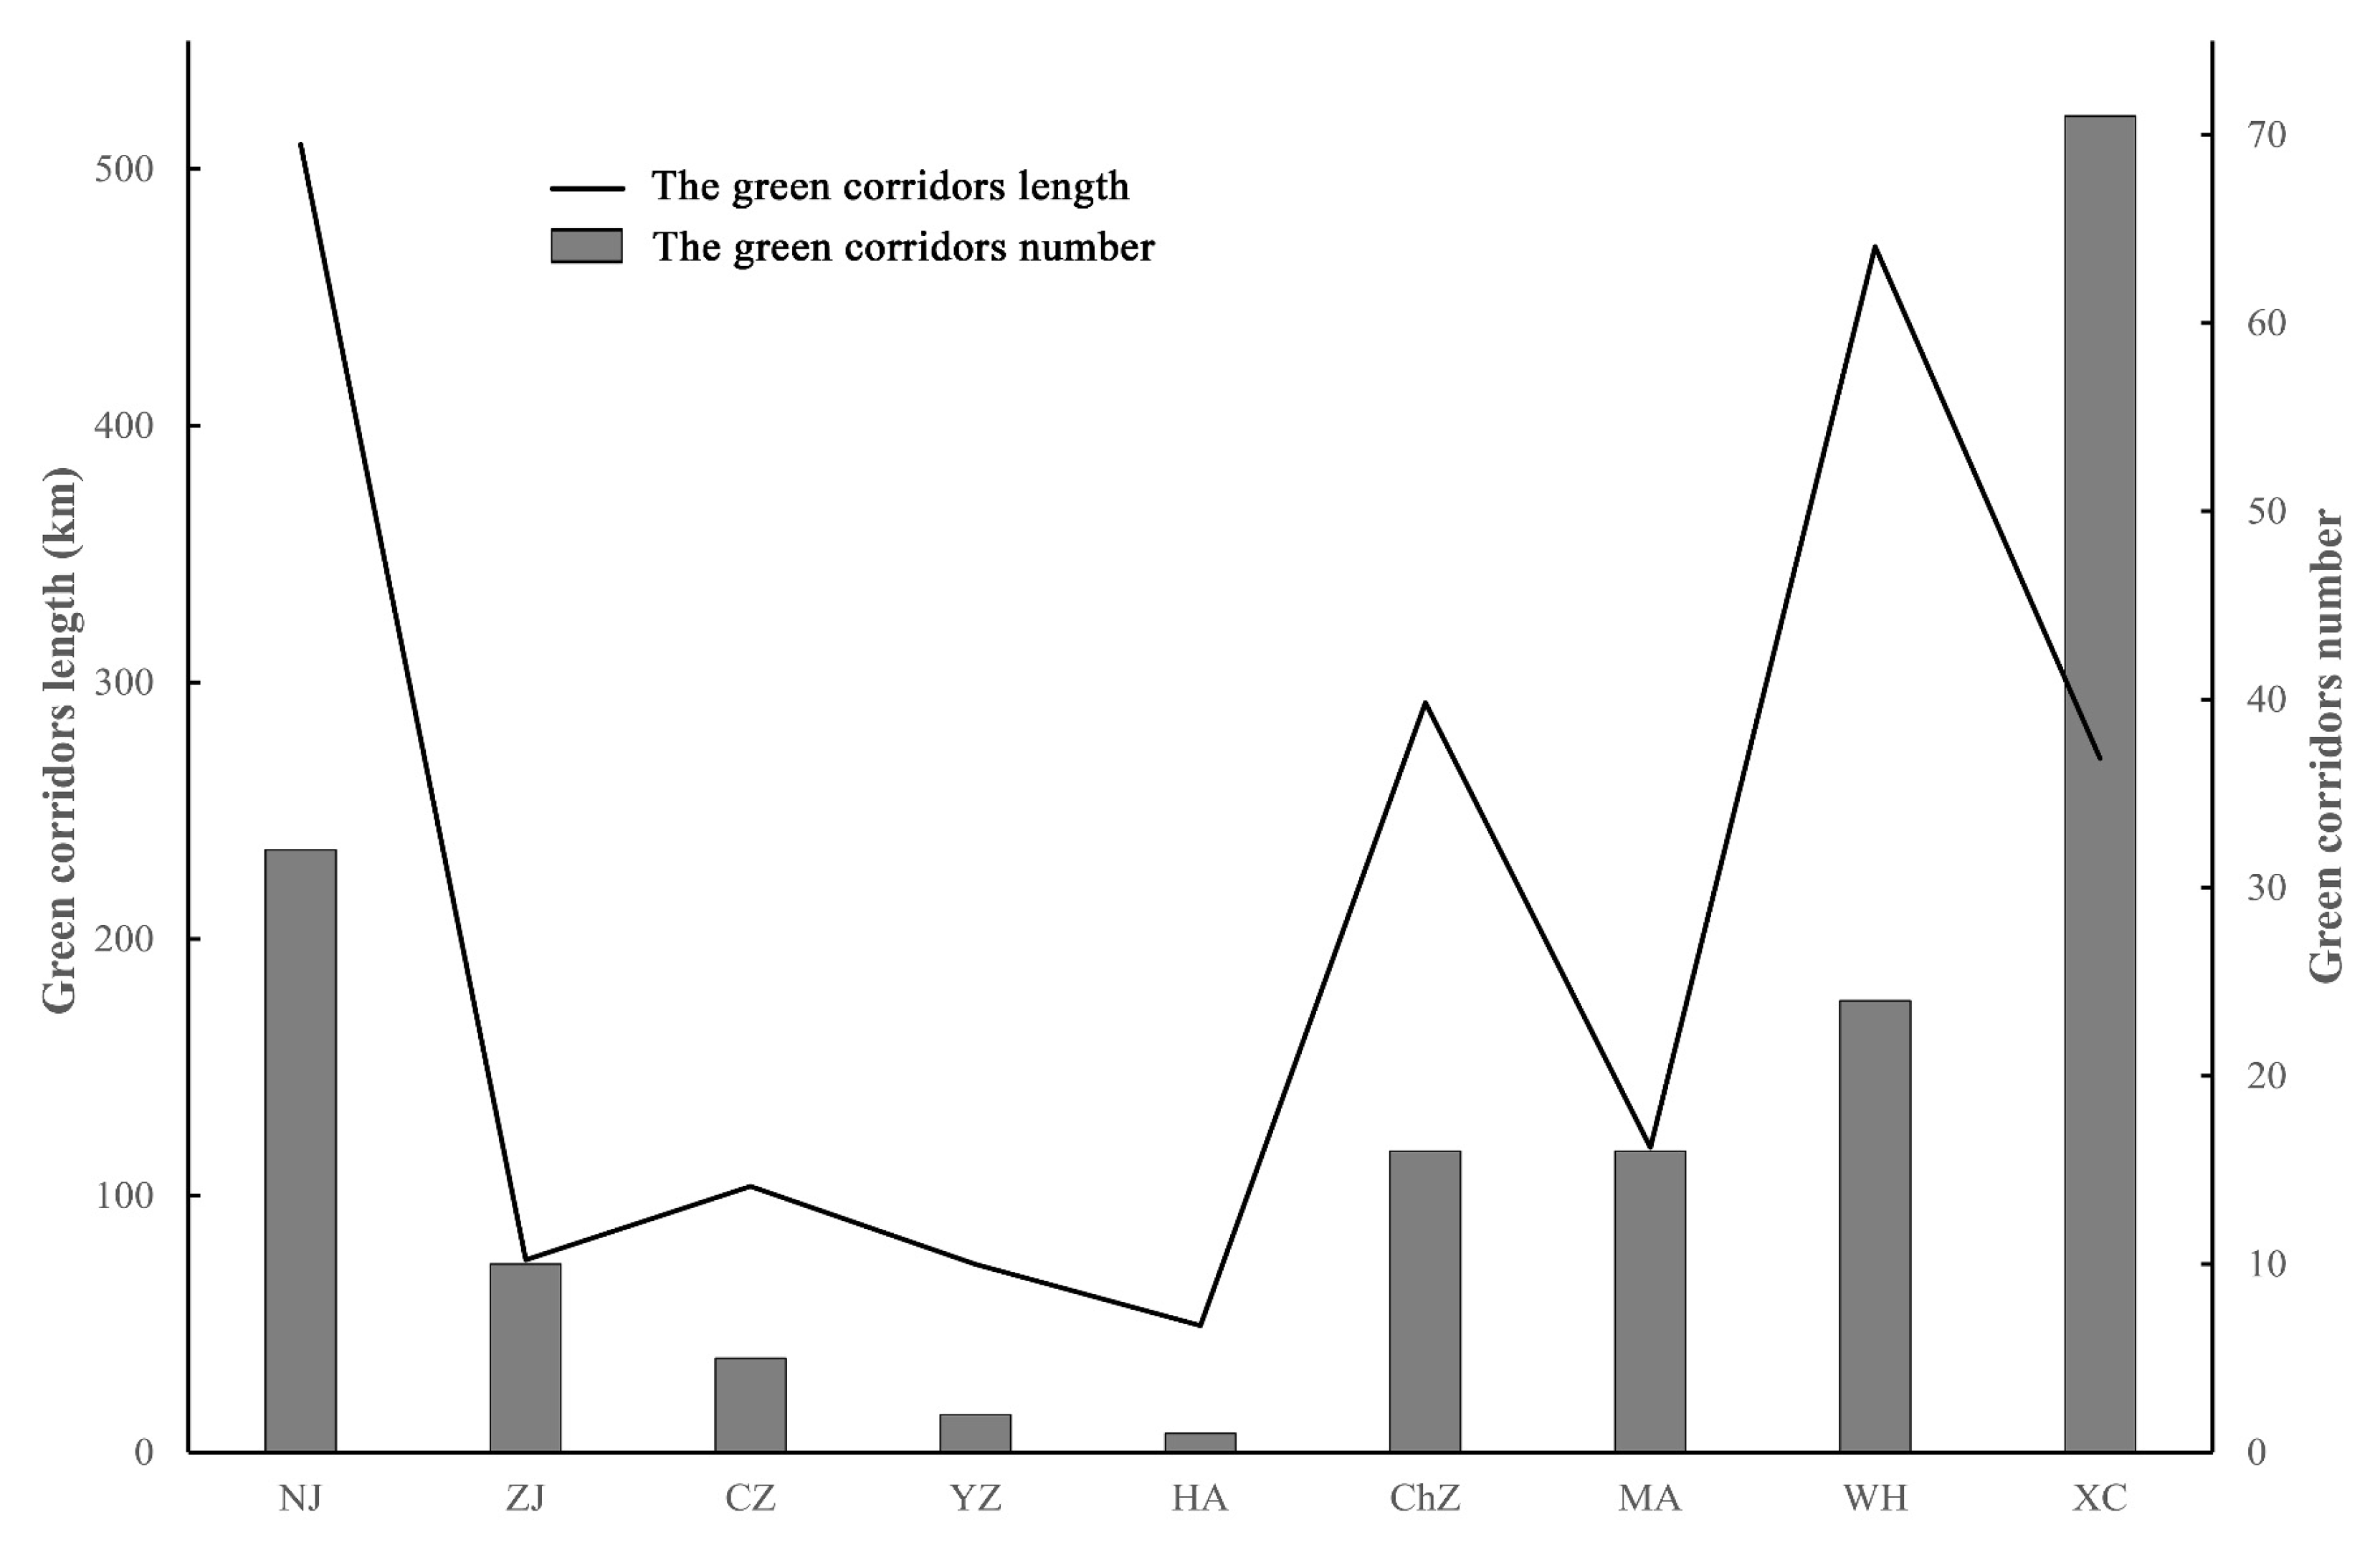
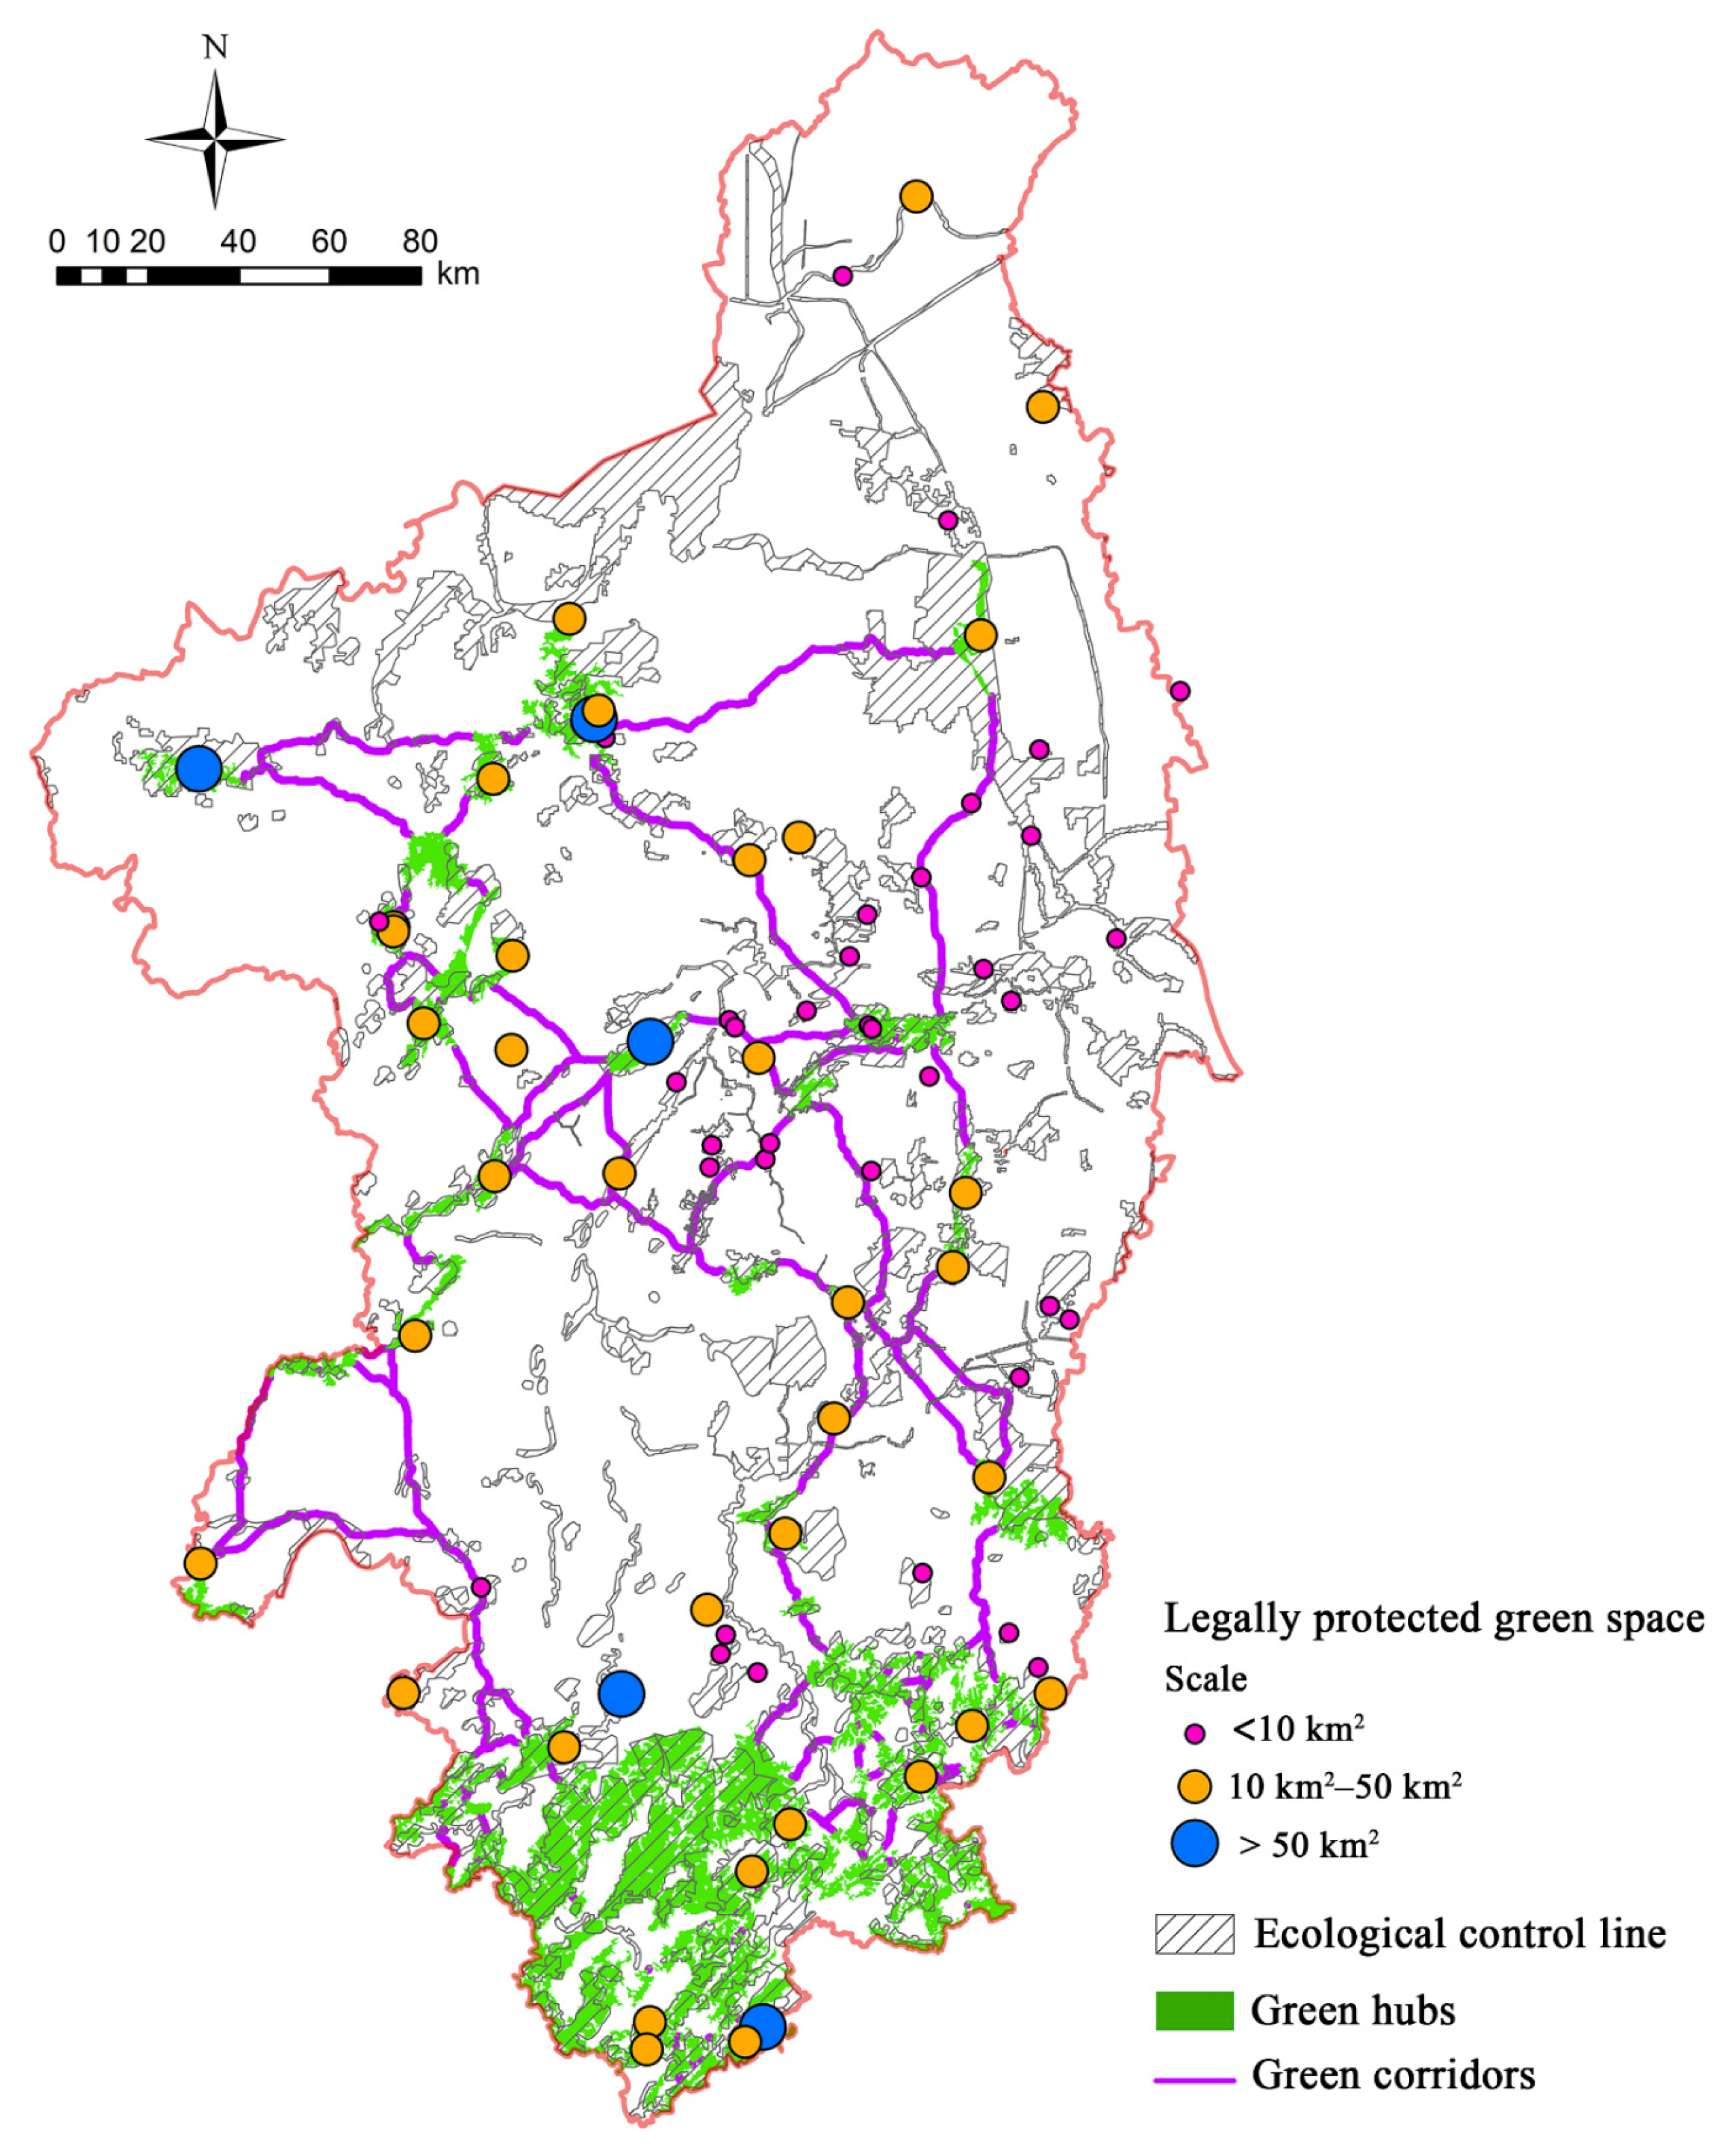
3.2. Construction of the GIN
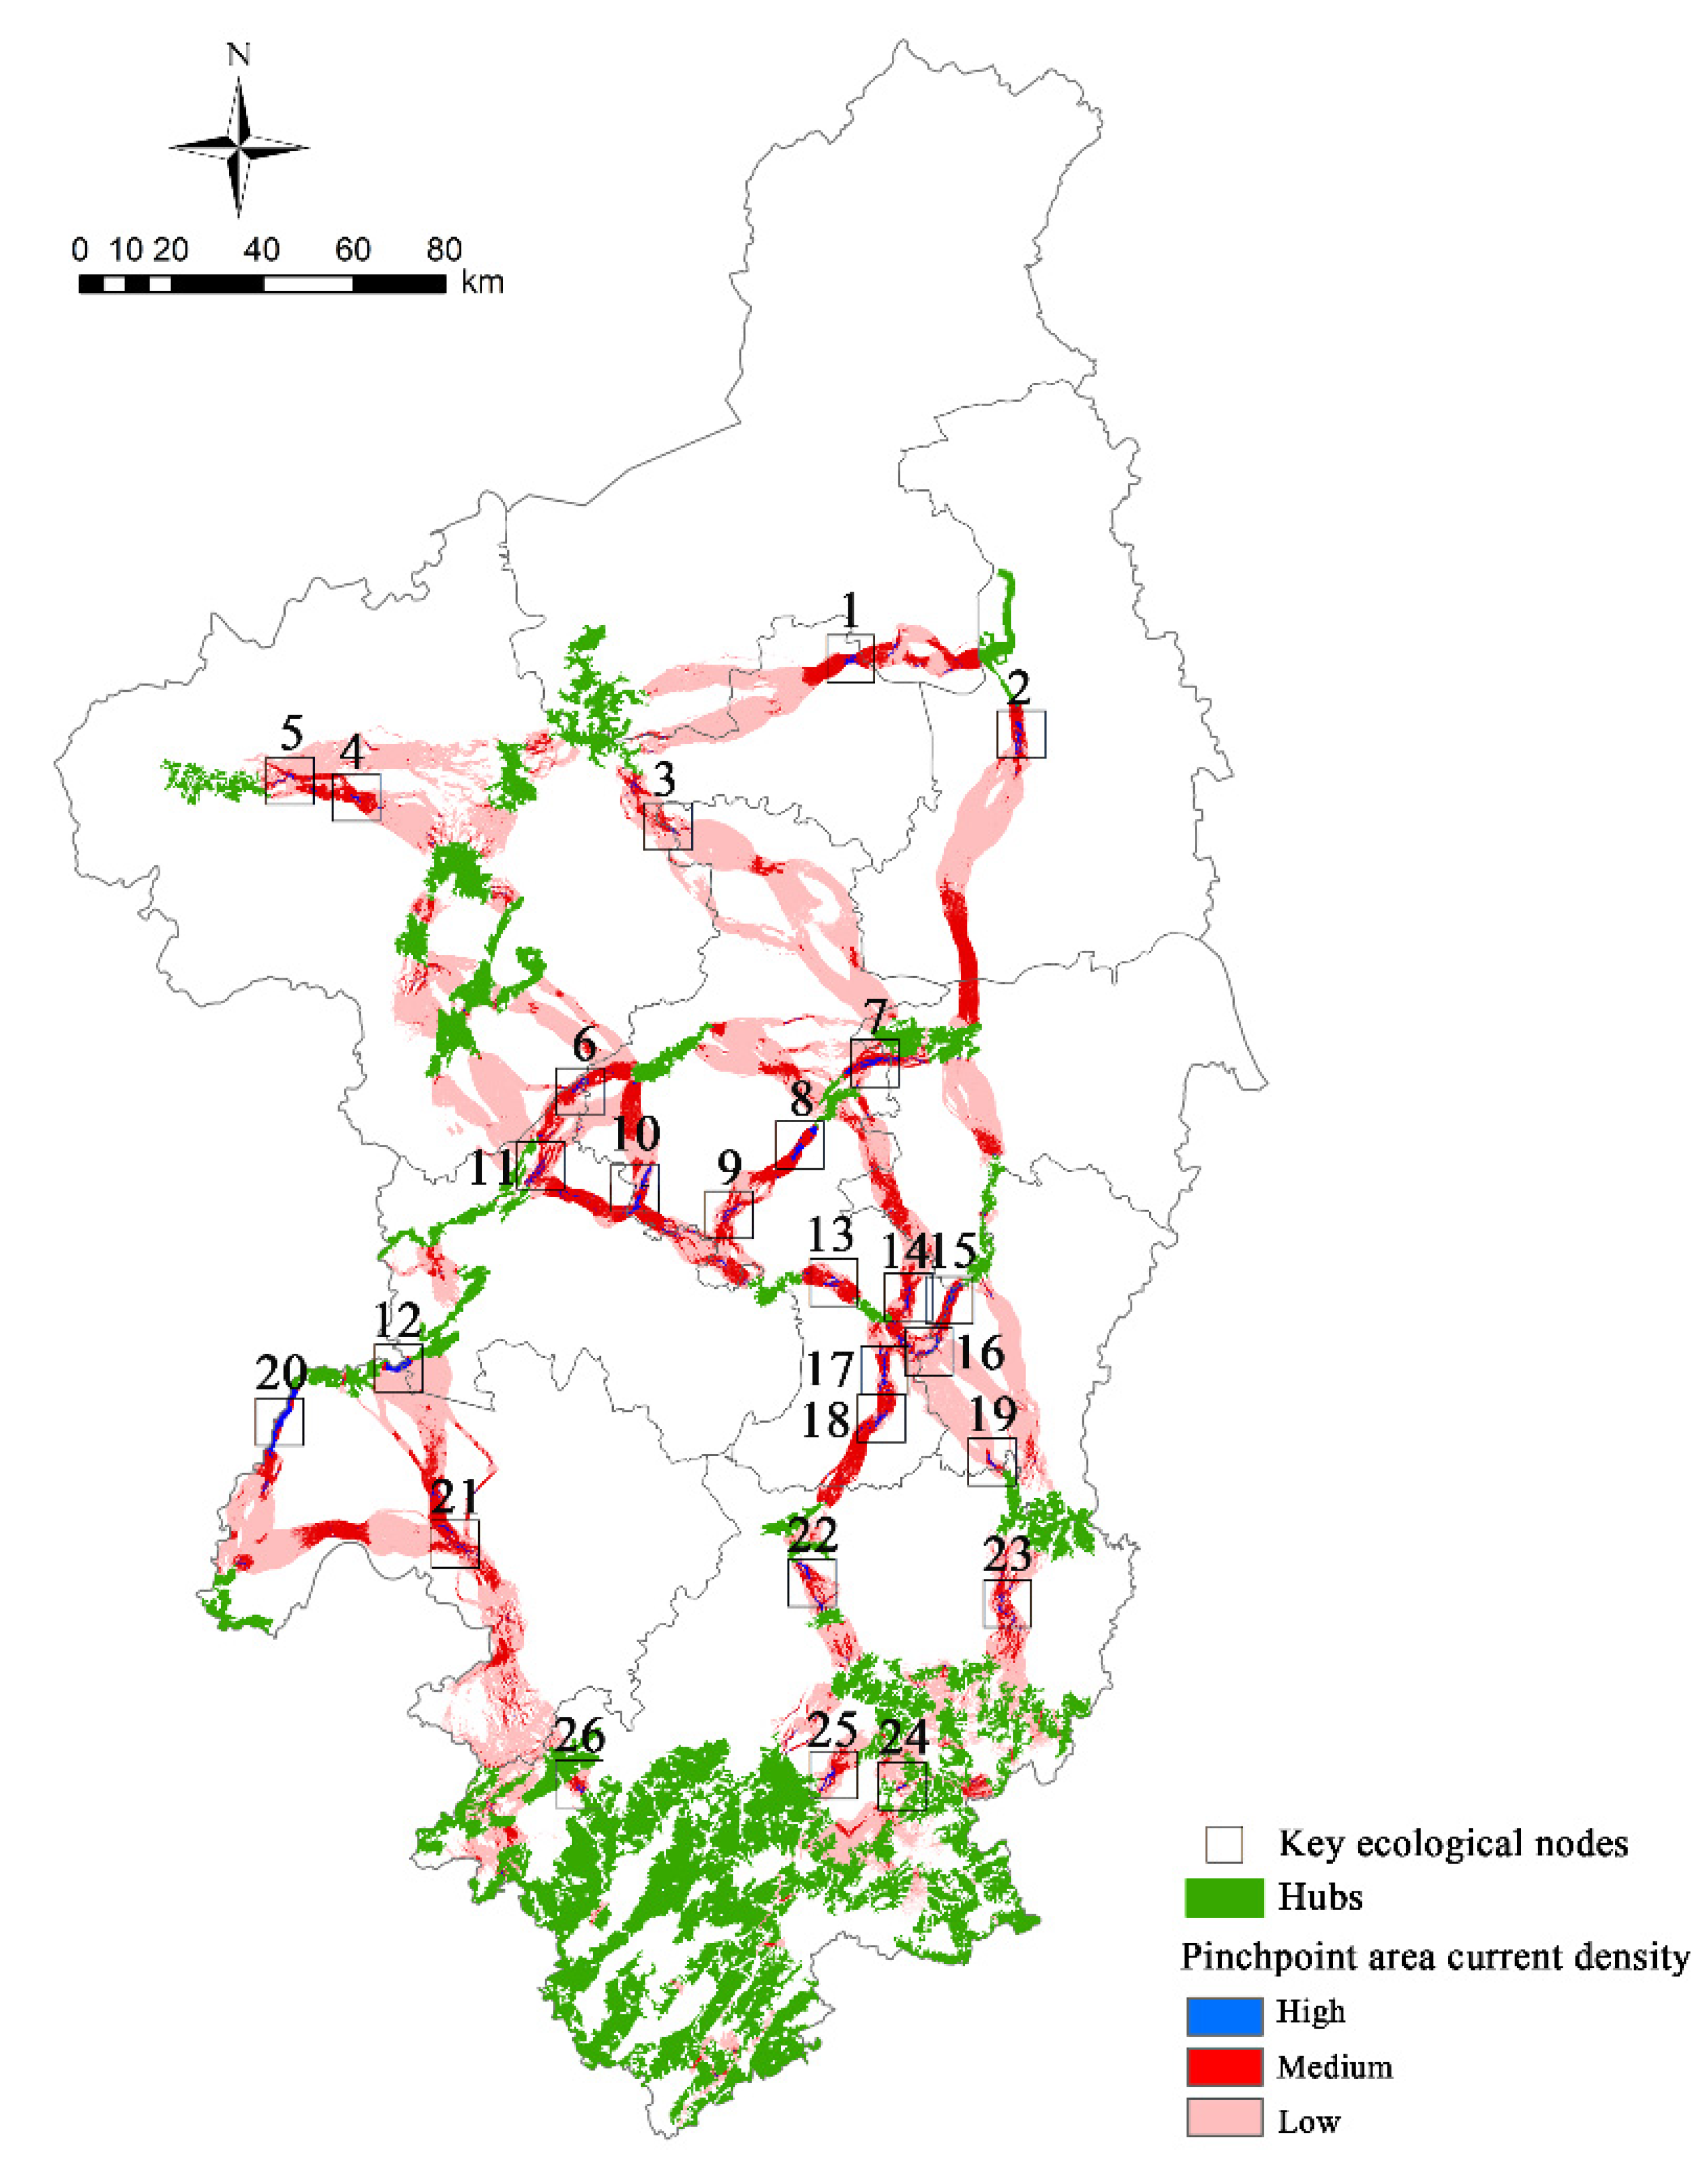
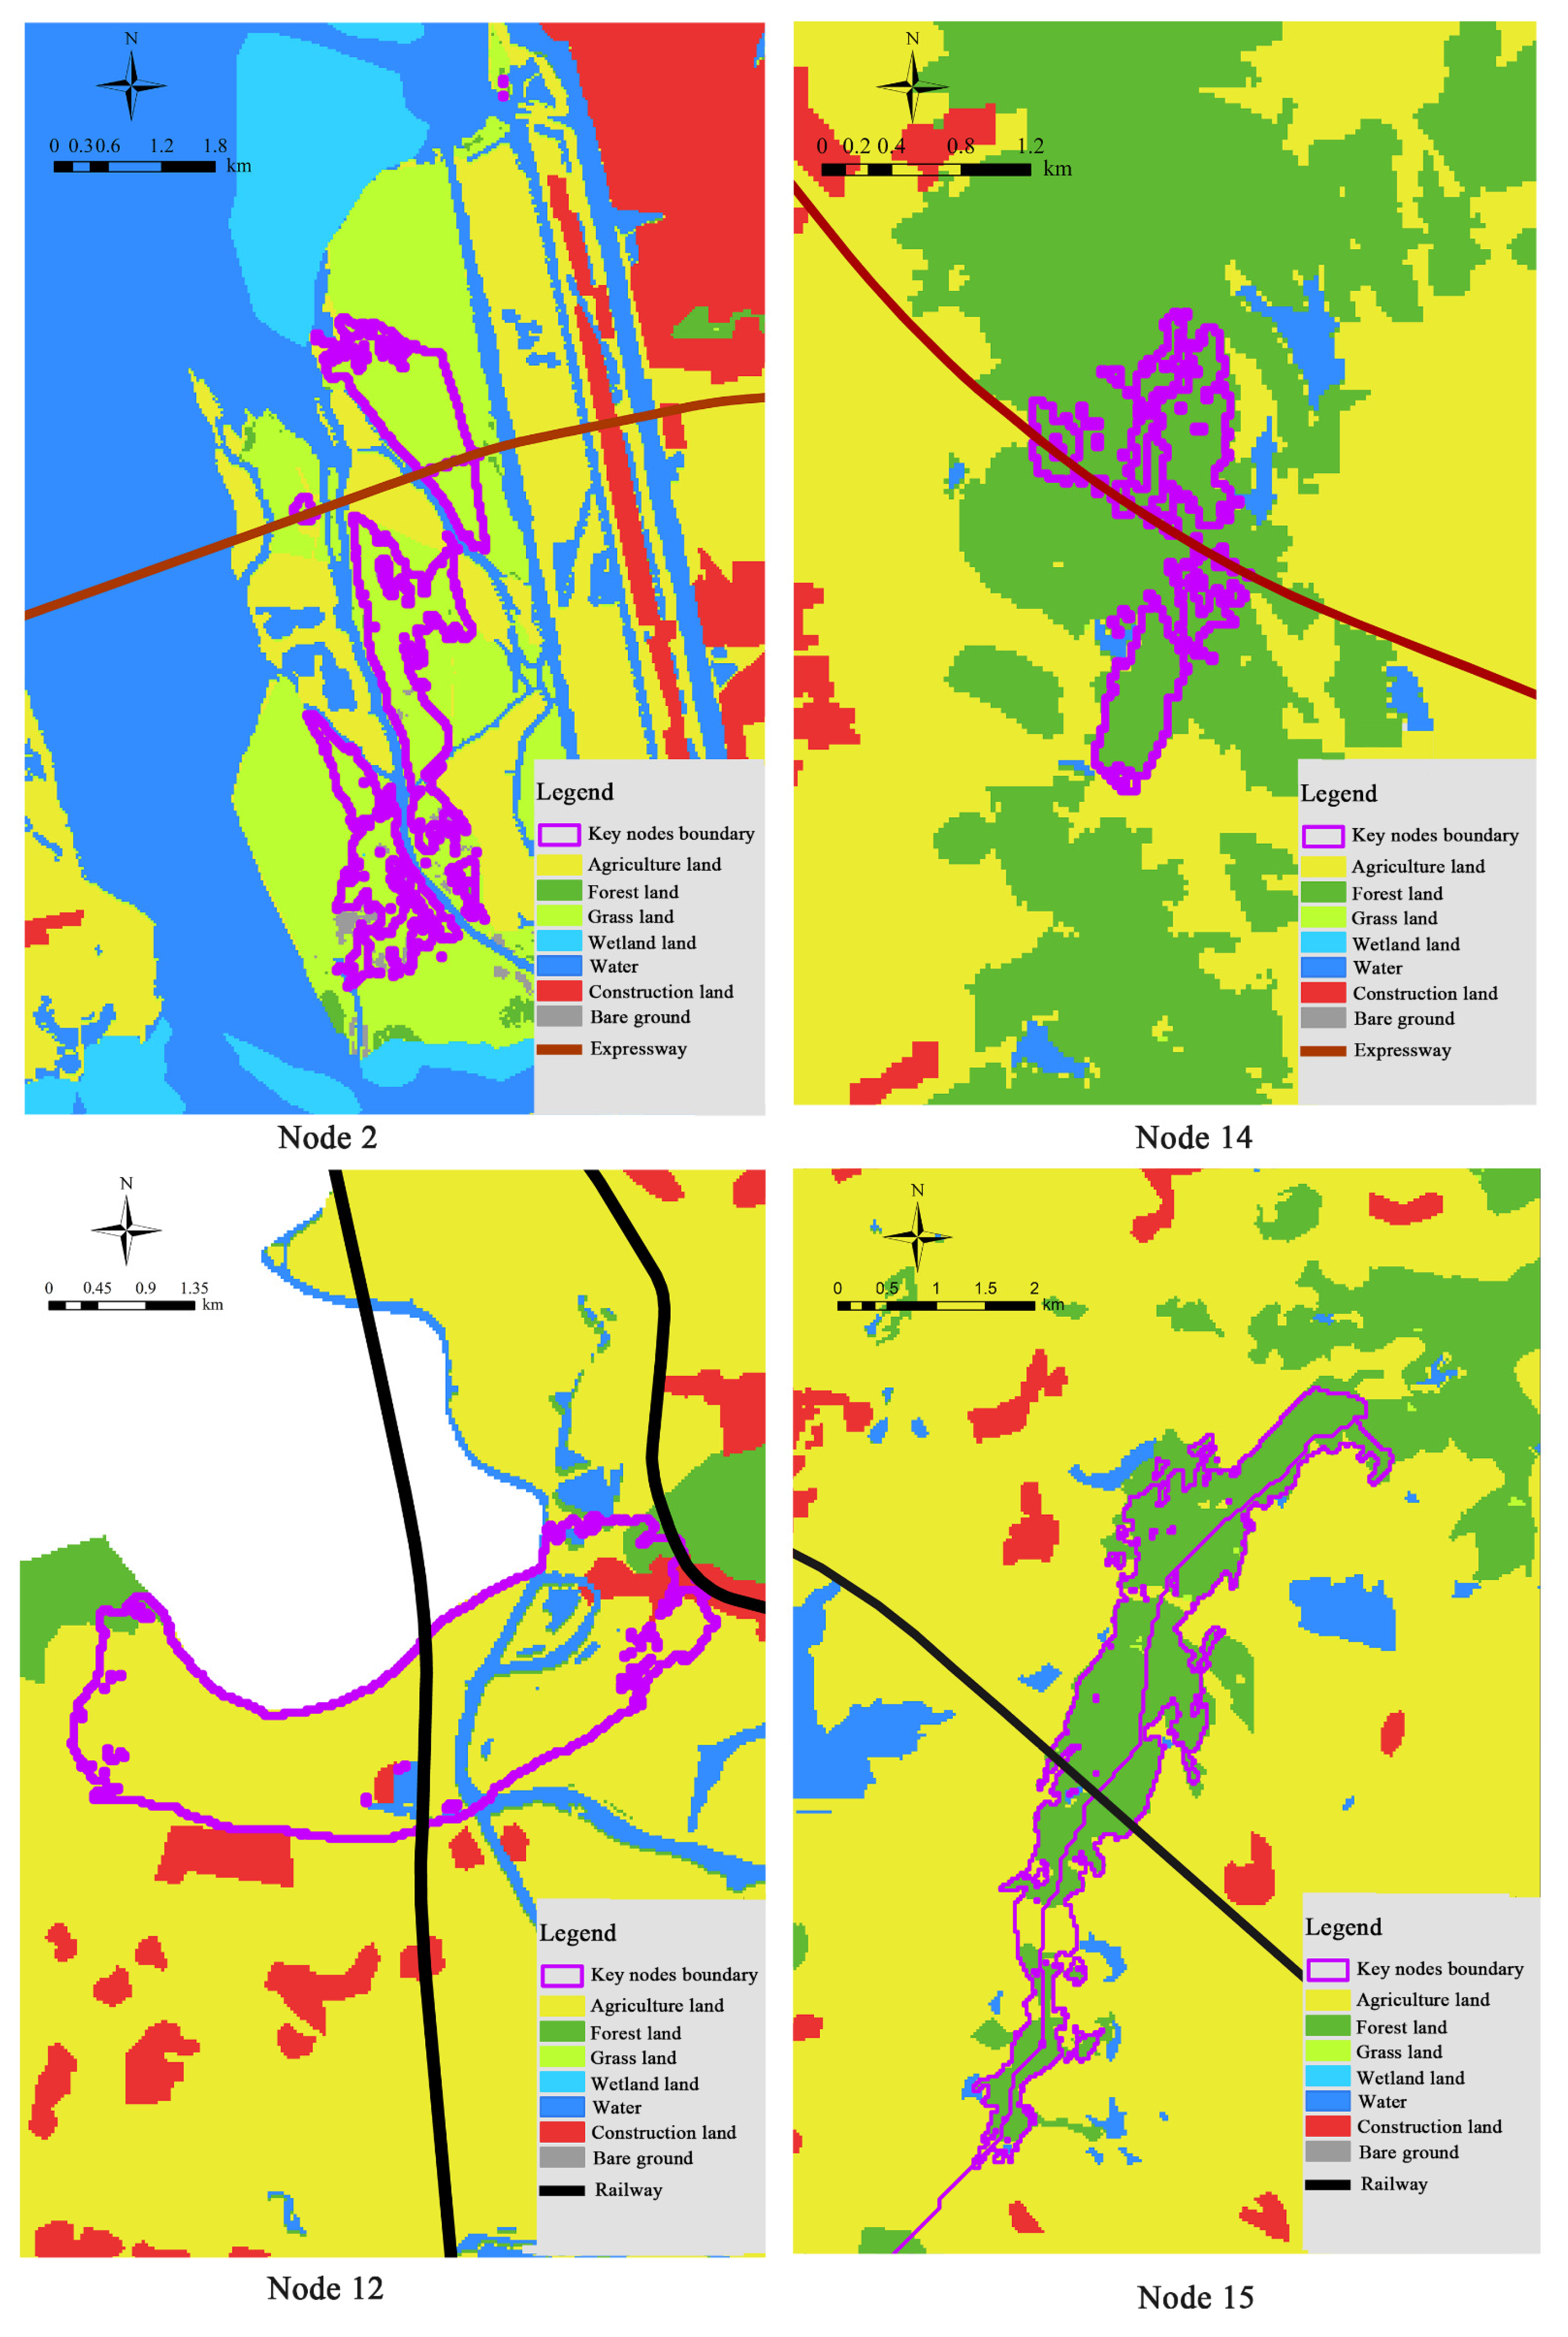
3.3. Identification of Key Ecological Nodes
4. Discussion
4.1. Effectiveness of the Identification of the GIN
4.2. Theoretical and Practical Implications of the Study
4.2.1. Methodological Advantages
4.2.2. Policy Implications
4.3. Threshold Uncertainties and Study Limitations
5. Conclusions
Author Contributions
Funding
Institutional Review Board Statement
Informed Consent Statement
Data Availability Statement
Conflicts of Interest
Appendix A

References
- Benedict, M.A.; McMahon, E.T. Green infrastructure: Smart conservation for the 21st century. Renew. Resour. J. 2002, 20, 12–17. [Google Scholar]
- Kong, F.; Yin, H.; Nakagoshi, N.; Zong, Y. Urban green space network development for biodiversity conservation: Identification based on graph theory and gravity modeling. Landsc. Urban Plan. 2010, 95, 16–27. [Google Scholar] [CrossRef]
- Aminzadeh, B.; Khansefid, M. A case study of urban ecological networks and a sustainable city: Tehran’s metropolitan area. Urban Ecosyst. 2010, 13, 23–36. [Google Scholar] [CrossRef]
- Jenerette, G.D.; Potere, D. Global analysis and simulation of land-use change associated with urbanization. Landsc. Ecosyst. 2010, 25, 657. [Google Scholar] [CrossRef]
- Gao, Y.; Wu, Z.; Lou, Q.; Huang, H.; Cheng, J.; Chen, Z. Landscape ecological security assessment based on projection pursuit in Pearl River Delta. Environ. Monit. Assess. 2012, 184, 2307–2319. [Google Scholar] [CrossRef]
- Nikolakaki, P. A GIS site-selection process for habitat creation: Estimating connectivity of habitat patches. Landsc. Urban Plan. 2004, 68, 77–94. [Google Scholar] [CrossRef]
- Wang, S.; Wu, M.; Hu, M.; Fan, C.; Wang, T.; Xia, B. Promoting landscape connectivity of highly urbanized area: An ecological network approach. Ecol. Indic. 2021, 125, 107487. [Google Scholar] [CrossRef]
- Cui, L.; Wang, J.; Sun, L.; Lv, C. Construction and optimization of green space ecological networks in urban fringe areas: A case study with the urban fringe area of Tongzhou district in Beijing. J. Clean. Prod. 2020, 276, 124266. [Google Scholar] [CrossRef]
- Ma, Q.; Li, Y.; Xu, L. Identification of green infrastructure networks based on ecosystem services in a rapidly urbanizing area. J. Clean. Prod. 2021, 300, 126945. [Google Scholar] [CrossRef]
- Peng, J.; Yang, Y.; Liu, Y.; Du, Y.; Meersmans, J.; Qiu, S. Linking ecosystem services and circuit theory to identify ecological security patterns. Sci. Total Environ. 2018, 644, 781–790. [Google Scholar] [CrossRef] [Green Version]
- Liquete, C.; Kleeschulte, S.; Dige, G.; Maes, J.; Grizzetti, B.; Olah, B.; Zulian, G. Mapping green infrastructure based on ecosystem services and ecological networks: A Pan-European case study. Environ. Sci. Policy 2015, 54, 268–280. [Google Scholar] [CrossRef]
- Cunha, N.; Magalhães, M. Methodology for mapping the national ecological network to mainland Portugal: A planning tool towards a green infrastructure. Ecol. Indic. 2019, 104, 802–818. [Google Scholar] [CrossRef]
- Zhang, R.; Zhang, L.; Zhong, Q.; Zhang, Q.; Ji, Y.-W.; Song, P.; Wang, Q. An optimized evaluation method of an urban ecological network: The case of the Minhang District of Shanghai. Urban For. Urban Green. 2021, 62, 127158. [Google Scholar] [CrossRef]
- Ersoy, E.; Jorgensen, A.; Warren, P.H. Identifying multispecies connectivity corridors and the spatial pattern of the landscape. Urban For. Urban Green. 2019, 40, 308–322. [Google Scholar] [CrossRef]
- Dong, J.; Peng, J.; Liu, Y.; Qiu, S.; Han, Y. Integrating spatial continuous wavelet transform and kernel density estimation to identify ecological corridors in megacities. Landsc. Urban Plan. 2020, 199, 103815. [Google Scholar] [CrossRef]
- Peng, J.; Zhao, S.; Dong, J.; Liu, Y.; Meersmans, J.; Li, H.; Wu, J. Applying ant colony algorithm to identify ecological security patterns in megacities. Environ. Model. Softw. 2019, 117, 214–222. [Google Scholar] [CrossRef] [Green Version]
- Modica, G.; Praticò, S.; Laudari, L.; Ledda, A.; Di Fazio, S.; De Montis, A. Implementation of multispecies ecological networks at the regional scale: Analysis and multi-temporal assessment. J. Environ. Manag. 2021, 289, 112494. [Google Scholar] [CrossRef]
- Li, J.; Weckworth, B.V.; McCarthy, T.M.; Liang, X.; Liu, Y.; Xing, R.; Li, D.; Zhang, Y.; Xue, Y.; Jackson, R. Defining priorities for global snow leopard conservation landscapes. Biol. Conserv. 2020, 241, 108387. [Google Scholar] [CrossRef]
- Cushman, S.A.; Landguth, E.L.; Flather, C.H. Evaluating population connectivity for species of conservation concern in the American Great Plains. Biodivers. Conserv. 2013, 22, 2583–2605. [Google Scholar] [CrossRef] [Green Version]
- Dong, J.; Peng, J.; Xu, Z.; Liu, Y.; Wang, X.; Li, B. Integrating regional and interregional approaches to identify ecological security patterns. Landsc. Ecol. 2021, 36, 2151–2164. [Google Scholar] [CrossRef]
- Cao, Y.; Yang, R.; Carver, S. Linking wilderness mapping and connectivity modelling: A methodological framework for wildland network planning. Biol. Conserv. 2020, 251, 108679. [Google Scholar] [CrossRef]
- Zhang, L.; Peng, J.; Liu, Y.; Wu, J. Coupling ecosystem services supply and human ecological demand to identify landscape ecological security pattern: A case study in Beijing–Tianjin–Hebei region, China. Urban Ecosyst. 2017, 20, 701–714. [Google Scholar] [CrossRef]
- Soille, P.; Vogt, P. Morphological segmentation of binary patterns. Pattern Recognit. Lett. 2009, 30, 456–459. [Google Scholar] [CrossRef]
- Vogt, P.; Riitters, K.H.; Iwanowski, M.; Estreguil, C.; Kozak, J.; Soille, P. Mapping landscape corridors. Ecol. Indic. 2007, 7, 481–488. [Google Scholar] [CrossRef]
- Wickham, J.D.; Riitters, K.H.; Wade, T.G.; Vogt, P. A national assessment of green infrastructure and change for the conterminous United States using morphological image processing. Landsc. Urban Plan. 2010, 94, 186–195. [Google Scholar] [CrossRef]
- Mcrae, B.H.; Dickson, B.G.; Keitt, T.H.; Shah, V.B. Using circuit theory to model connectivity in ecology, evolution, and conservation. Ecology 2008, 89, 2712–2724. [Google Scholar] [CrossRef]
- Koen, E.L.; Bowman, J.; Sadowski, C.; Walpole, A.A. Landscape connectivity for wildlife: Development and validation of multispecies linkage maps. Methods Ecol. Evol. 2014, 5, 626–633. [Google Scholar] [CrossRef]
- Lechner, A.M.; Doerr, V.; Harris, R.M.; Doerr, E.; Lefroy, E.C. A framework for incorporating fine-scale dispersal behaviour into biodiversity conservation planning. Landsc. Urban Plan. 2015, 141, 11–23. [Google Scholar] [CrossRef]
- Li, J.; Xu, J.; Chu, J. The construction of a regional ecological security pattern based on circuit theory. Sustainability 2019, 11, 6343. [Google Scholar] [CrossRef] [Green Version]
- An, Y.; Liu, S.; Sun, Y.; Shi, F.; Beazley, R. Construction and optimization of an ecological network based on morphological spatial pattern analysis and circuit theory. Landsc. Ecol. 2021, 36, 2059–2076. [Google Scholar] [CrossRef]
- National Development and Reform Commission. Nanjing Metropolitan Area Development Plan; National Development and Reform Commission: Beijing, China, 2021.
- Xie, G.; Zhang, C.; Zhang, L.; Chen, W.; Li, S. Improvement of the evaluation method for ecosystem service value based on per unit area. J. Nat. Resour. 2015, 30, 1243. [Google Scholar]
- Vogt, P.; Ferrari, J.R.; Lookingbill, T.R.; Gardner, R.H.; Riitters, K.H.; Ostapowicz, K. Mapping functional connectivity. Ecol. Indic. 2009, 9, 64–71. [Google Scholar] [CrossRef]
- Taylor, P.D.; Fahrig, L.; Henein, K.; Merriam, G. Connectivity is a vital element of landscape structure. Oikos 1993, 68, 571–573. [Google Scholar] [CrossRef] [Green Version]
- Pascual-Hortal, L.; Saura, S. Comparison and development of new graph-based landscape connectivity indices: Towards the priorization of habitat patches and corridors for conservation. Landsc. Ecol. 2006, 21, 959–967. [Google Scholar] [CrossRef]
- Carroll, C.; McRAE, B.H.; Brookes, A. Use of linkage mapping and centrality analysis across habitat gradients to conserve connectivity of gray wolf populations in western North America. Conserv. Biol. 2012, 26, 78–87. [Google Scholar] [CrossRef] [PubMed]
- McRae, B.H.; Hall, S.A.; Beier, P.; Theobald, D.M. Where to restore ecological connectivity? Detecting barriers and quantifying restoration benefits. PLoS ONE 2012, 7, e52604. [Google Scholar] [CrossRef] [PubMed]
- Hong, W.; Guo, R.; Su, M.; Tang, H.; Chen, L.; Hu, W. Sensitivity evaluation and land-use control of urban ecological corridors: A case study of Shenzhen, China. Land Use Policy 2017, 62, 316–325. [Google Scholar] [CrossRef]
- Fabos, J.G. Greenway planning in the United States: Its origins and recent case studies. Landsc. Urban Plan. 2004, 68, 321–342. [Google Scholar] [CrossRef]
- Shi, X.; Qin, M. Research on the optimization of regional green infrastructure network. Sustainability 2018, 10, 4649. [Google Scholar] [CrossRef] [Green Version]
- National Development and Reform Commission. The Guidance for Fostering the Development of Modern Metropolitan Areas; National Development and Reform Commission: Beijing, China, 2019.
- Pittiglio, C.; Skidmore, A.K.; van Gils, H.A.; McCall, M.K.; Prins, H.H. Smallholder farms as stepping stone corridors for crop-raiding elephant in northern Tanzania: Integration of Bayesian expert system and network simulator. Ambio 2014, 43, 149–161. [Google Scholar] [CrossRef] [Green Version]
- Saura, S.; Vogt, P.; Velázquez, J.; Hernando, A.; Tejera, R. Key structural forest connectors can be identified by combining landscape spatial pattern and network analyses. For. Ecol. Manag. 2011, 262, 150–160. [Google Scholar] [CrossRef]
- Pascual-Hortal, L.; Saura, S. Impact of spatial scale on the identification of critical habitat patches for the maintenance of landscape connectivity. Lands. Urban Plan. 2007, 83, 176–186. [Google Scholar] [CrossRef]
- Wang, Y.; Lin, Q. The transformation of planning ideas and the exploration of planning methods of urban green space ecological network based on MSPA. Chin. Landsc. Archit. 2017, 33, 68–73. [Google Scholar]
- Sutherland, G.D.; Harestad, A.S.; Price, K.; Lertzman, K.P. Scaling of natal dispersal distances in terrestrial birds and mammals. Conserv. Ecol. 2000, 4, 16. [Google Scholar] [CrossRef]
- Saura, S.; Torne, J. Conefor Sensinode 2.2: A software package for quantifying the importance of habitat patches for landscape connectivity. Environ. Modell. Softw. 2009, 24, 135–139. [Google Scholar] [CrossRef]
- Song, L.L.; Qin, M. Identification of ecological corridors and its importance by integrating circuit theory. J. Appl. Ecol. 2016, 27, 3344–3352. [Google Scholar] [CrossRef]


| Resistance | Weight Coefficient | Resistance Factor | Resistance Value | Resistance | Weight Coefficient | Resistance Factor | Resistance Value | ||
|---|---|---|---|---|---|---|---|---|---|
| MSPA landscape type | 0.38 | Core | Hubs | 1 | Topography | 0.15 | Elevation (m) | <50 | 5 |
| Other cores | 5 | 50–175 | 20 | ||||||
| Bridge | 10 | 175–350 | 60 | ||||||
| Other six MSPA types | 50 | 350–650 | 200 | ||||||
| Background | 600 | >650 | 600 | ||||||
| Land-use type | 0.25 | GI | 5 | Slope (°) | <5 | 5 | |||
| Water (km2) | River width >100 m, and lakes area >50 | 1000 | 5–15 | 20 | |||||
| 15–25 | 200 | ||||||||
| >25 | 600 | ||||||||
| Human activities | 0.22 | Distance from built-up area (km) | >2.5 | 5 | |||||
| River width 50–100 m, lakes area <50 and >10 | 400 | 1.5–2.5 | 100 | ||||||
| 1.0–1.5 | 500 | ||||||||
| 0.5–1.0 | 800 | ||||||||
| <0.5 | 1000 | ||||||||
| Lakes area <10 | 40 | Distance from traffic artery (km) | >3.0 | 5 | |||||
| 2.0–3.0 | 100 | ||||||||
| Agriculture land | 60 | 1.5–2.0 | 500 | ||||||
| Construction land | 1000 | 0.5–1.5 | 800 | ||||||
| Other types of land | 600 | <0.5 | 1000 | ||||||
| Landscape Type of the GI | Area (km2) | Proportion of the Area of the GI (%) | Proportion of the Area of the Study Region (%) |
|---|---|---|---|
| Core | 7151.76 | 57.51 | 10.93 |
| Bridge | 1152.23 | 9.27 | 1.76 |
| Islet | 448.09 | 3.60 | 0.68 |
| Perforation | 148.96 | 1.20 | 0.23 |
| Edge | 2185.07 | 17.57 | 3.34 |
| Loop | 638.66 | 5.14 | 0.98 |
| Branch | 710.97 | 5.71 | 1.09 |
Publisher’s Note: MDPI stays neutral with regard to jurisdictional claims in published maps and institutional affiliations. |
© 2022 by the authors. Licensee MDPI, Basel, Switzerland. This article is an open access article distributed under the terms and conditions of the Creative Commons Attribution (CC BY) license (https://creativecommons.org/licenses/by/4.0/).
Share and Cite
Liu, W.; Xu, H.; Zhang, X.; Jiang, W. Green Infrastructure Network Identification at a Regional Scale: The Case of Nanjing Metropolitan Area, China. Forests 2022, 13, 735. https://doi.org/10.3390/f13050735
Liu W, Xu H, Zhang X, Jiang W. Green Infrastructure Network Identification at a Regional Scale: The Case of Nanjing Metropolitan Area, China. Forests. 2022; 13(5):735. https://doi.org/10.3390/f13050735
Chicago/Turabian StyleLiu, Wei, Hao Xu, Xiaotong Zhang, and Wenqi Jiang. 2022. "Green Infrastructure Network Identification at a Regional Scale: The Case of Nanjing Metropolitan Area, China" Forests 13, no. 5: 735. https://doi.org/10.3390/f13050735