Article

Non-Additive Effects of Mixing Eucalyptus and Castanopsis hystrix Trees on Carbon Stocks under an Eco-Silviculture Regime in Southern China

1
Guangxi Key Laboratory of Forest Ecology and Conservation, Forestry College, Guangxi University, Nanning 530004, China
2
Institute of Eco-Environmental Research, Guangxi Academy of Sciences, Nanning 530007, China
3
Guangxi Youyiguan Forest Ecosystem National Research Station, Pingxiang 532600, China
*
Authors to whom correspondence should be addressed.
These two authors contribute equally to this work.
Forests 2022, 13(5), 733; https://doi.org/10.3390/f13050733
Submission received: 30 March 2022 / Revised: 2 May 2022 / Accepted: 6 May 2022 / Published: 8 May 2022
(This article belongs to the Section Forest Ecology and Management)

Abstract

:
Eucalyptus plantations harbor great potential for supporting ecosystem services, but this prospect is weakened under long-term traditional silviculture regimes. To reform these traditional silviculture regimes, we carried out a long-term Eucalyptus eco-silviculture experiment. However, the derived benefits and mechanisms that arise in mixed species stands under the eco-silviculture regime are not fully understood. Here, we evaluated tree carbon storage (TCS), understory vegetation carbon storage (UCS), floor litter carbon storage (FLCS), soil organic carbon storage (SOCS), and ecosystem carbon storage (ECS) in seven-year-old mono-specific plantations of a Eucalyptus hybrid (E. urophylla × E. grandis) and Castanopsis hystrix, as well as mixed plantations of these two trees under an eco-silviculture regime in southern China. The results showed that the tree height, diameter at breast height (DBH), volume, and biomass of eucalypt trees and C. hystrix in the mixed plantation were significantly higher than that of the trees in the corresponding single-species plantations. The mixed-species plantation had the largest TCS (84.33 Mg ha−1), FLCS (4.34 Mg ha−1), and ECS (313.31 Mg ha−1), as well as a higher SOCS (233.98 Mg ha−1), but the lowest UCS (0.96 Mg ha−1), among the three plantation types. The mixture effects analysis revealed significant synergistic effects (non-additive effect, NAE > 0) on TCS, SOCS, and ECS, and significant antagonistic effects (NAE < 0) on UCS. These synergistic effects were mainly due to the complementary ecological niches of the two species in the mixed-species plantation, which could potentially enable them to maximize the use of local resources, and to increase stand productivity and litter production. These results imply that beyond the gains in timber production obtained by having both Eucalyptus and C. hystrix trees growing in the same plantation stand, such mixed-species plantations enhance carbon sequestration to a greater extent than mono-specific plantations of either Eucalyptus or C. hystrix trees. In conclusion, we suggest planting mixed plantations of species with complementary ecological niches under an eco-silviculture regime, to effectively resolve the contradiction between timber production and ecosystem services, and, thereby, also promote the sustainable development of Eucalyptus plantations.

1. Introduction

There are 294 million hectares of planted forests worldwide, accounting for 7% of the global forest area [1]. China has more than 80.03 million hectares of tree plantations, of which at least 44% consist of non-native tree species such as Eucalyptus spp., Acacia spp., and so forth [1,2,3]. Today, there are more than 5.46 million hectares of Eucalyptus plantations in China, of which 2.56 million hectares are located in Guangxi Province alone [4]. The use of eucalypt trees under intensive management is particularly important for rapid fiber production in the southern regions of China, where growth rates of other planted tree species are relatively low, and natural forests are under strict government protection. Eucalyptus has become the fastest developing and best localized type of mono-specific plantation of exotic species in Guangxi, due to its adaptability to a variety of environments, rapid growth, and high yield [3,4]. Although they constitute only 1.16% of China’s total forest area [1], Eucalyptus plantations are estimated to supply about 41% of the country’s demand for roundwood [3]. In Guangxi, Eucalyptus plantations have great potential to support ecosystem services with respect to (1) accelerating restoration of degraded forest ecosystems [5], (2) reducing the harvesting pressure on natural forests [6], (3) providing sustainable sources of wood supplies [7], (4) promoting carbon storage with more than 40 million tons of carbon sequestrated every year [3], and (5) supporting the wood processing industry of RMB 500 billion [3].
Yet, the impact of Eucalyptus plantations upon the ecological environment remains a controversial topic in China and abroad [4,7,8,9]. The core and key outstanding issue being debated is how Eucalyptus plantations are managed. Their current management follows a traditional silviculture regime, one that relies on high-intensive disturbances (e.g., controlled burning, mechanical site preparation, fertilization, and herbicide applications at a high frequency and high dosage), high economic input (an investment of RMB 30,000 per hectare for a five-to-seven-year stand rotation), and successive short rotations with high generation [3,4]. These intensive forest management activities severely disrupt forest ecosystem functioning, and, in turn, have exacerbated a suite of ecological problems, namely the considerable degradation of soil quality [10], reduced species diversity of plant communities [11,12], and greater risk of exotic plant invasions in the understory [4,13,14], in addition to sharp declines in wood productivity and carbon storage over time [15]. Collectively, this leads to weakened ecosystem functions and services of Eucalyptus plantations, and a strong imbalance between their timber production and other ecological services, thus affecting their sustainable management. Hence, it is imperative the traditional silviculture regime of Eucalyptus plantations in China be reformed [3].
Recently, we put forward a definition for an eco-silviculture regime, and carried out a long-term Eucalyptus (E. urophylla × E. grandis) eco-silviculture experiment [3]. The core of this regime is to establish mixed-species plantations of Eucalyptus and precious native tree species, which considers in tandem the application of ecological forestland clearing, site preparation, stand tending, fertilization, and pest and disease control measures. It recognizes trade-offs and generates synergies between timber production and other ecosystem services, so as to maintain the biodiversity, productivity, carbon sequestration, and soil quality across the ecosystem, landscape, and watershed scales.
Mixed plantations of Eucalyptus and Castanopsis hystrix are now common across southern China. These two species occupy different niches and exhibit resource partitioning (i.e., complementary ecological niches), resulting in the maximal use of resources [16,17,18]: Eucalyptus is a fast-growing exotic species to China with shade-intolerance and a deeper root system, whereas C. hystrix is a relative slow-growing native species with moderate shade-tolerance and a shallow root system. In addition, Eucalyptus has low leaf productivity and produces less litter with poor quality and a slow decomposition rate [19]. Nevertheless, the higher-quality C. hystrix litter can stimulate the decomposition of more recalcitrant litter of eucalypt trees in the mixed plantations [20,21]. Due to this complementarity, mixed plantations could be more productive and support more ecosystem carbon storage than would mono-specific planted forests [22]. Many studies have reported that plantation stands of mixed species may have more advantages than mono-specific plantations, such as higher diversity, productivity, and greater carbon storage [23,24,25], as well as a stronger resistance to biotic and abiotic stresses [26,27]. However, the actual benefits derived from mixed stands will depend on their tree species’ composition, given that such benefits are found inconsistent across studies of tree-mixture effects [25,28,29]. In addition, the derived benefits and mechanisms that arise in mixed species stands under an eco-silviculture regime are not yet fully understood.
Productivity of tree plantations is a function of the supply, capture, and efficiency of their use of resources [30]. Species interactions in mixed-species stands can influence each of these variables [31]. The importance of resource-use efficiency in determining forest productivity has been clearly demonstrated in monocultures; however, substantial knowledge gaps remain for mixtures [32]. Given this context, we hypothesized the following: (i) Due to mixed species complementarity, to improve the resource use efficiency and stand productivity, we expected the carbon sequestration in trees and the forest floor litter to be higher in mixed-species plantations than mono-specific plantations. (ii) Considering the low resource quality and quantity of Eucalyptus litter and fast tree growth rates in Eucalyptus plantations, a large amount of soil organic carbon (SOC) is converted into plant biomass carbon, so we expected that SOC stock would be lower in Eucalyptus stands than those in pure C. hystrix plantations or the mixed-plantation type. (iii) Due to the potentially positive effect of mixtures on increasing total forest canopy cover, and knowing that C. hystrix forms a broader canopy than do hybrid Eucalyptus trees, we expected to find lower carbon storage in the understory vegetation in pure C. hystrix and mixed Eucalyptus/C. hystrix plantations, under the low-intensity disturbance of the eco-silviculture regime.

2. Materials and Methods

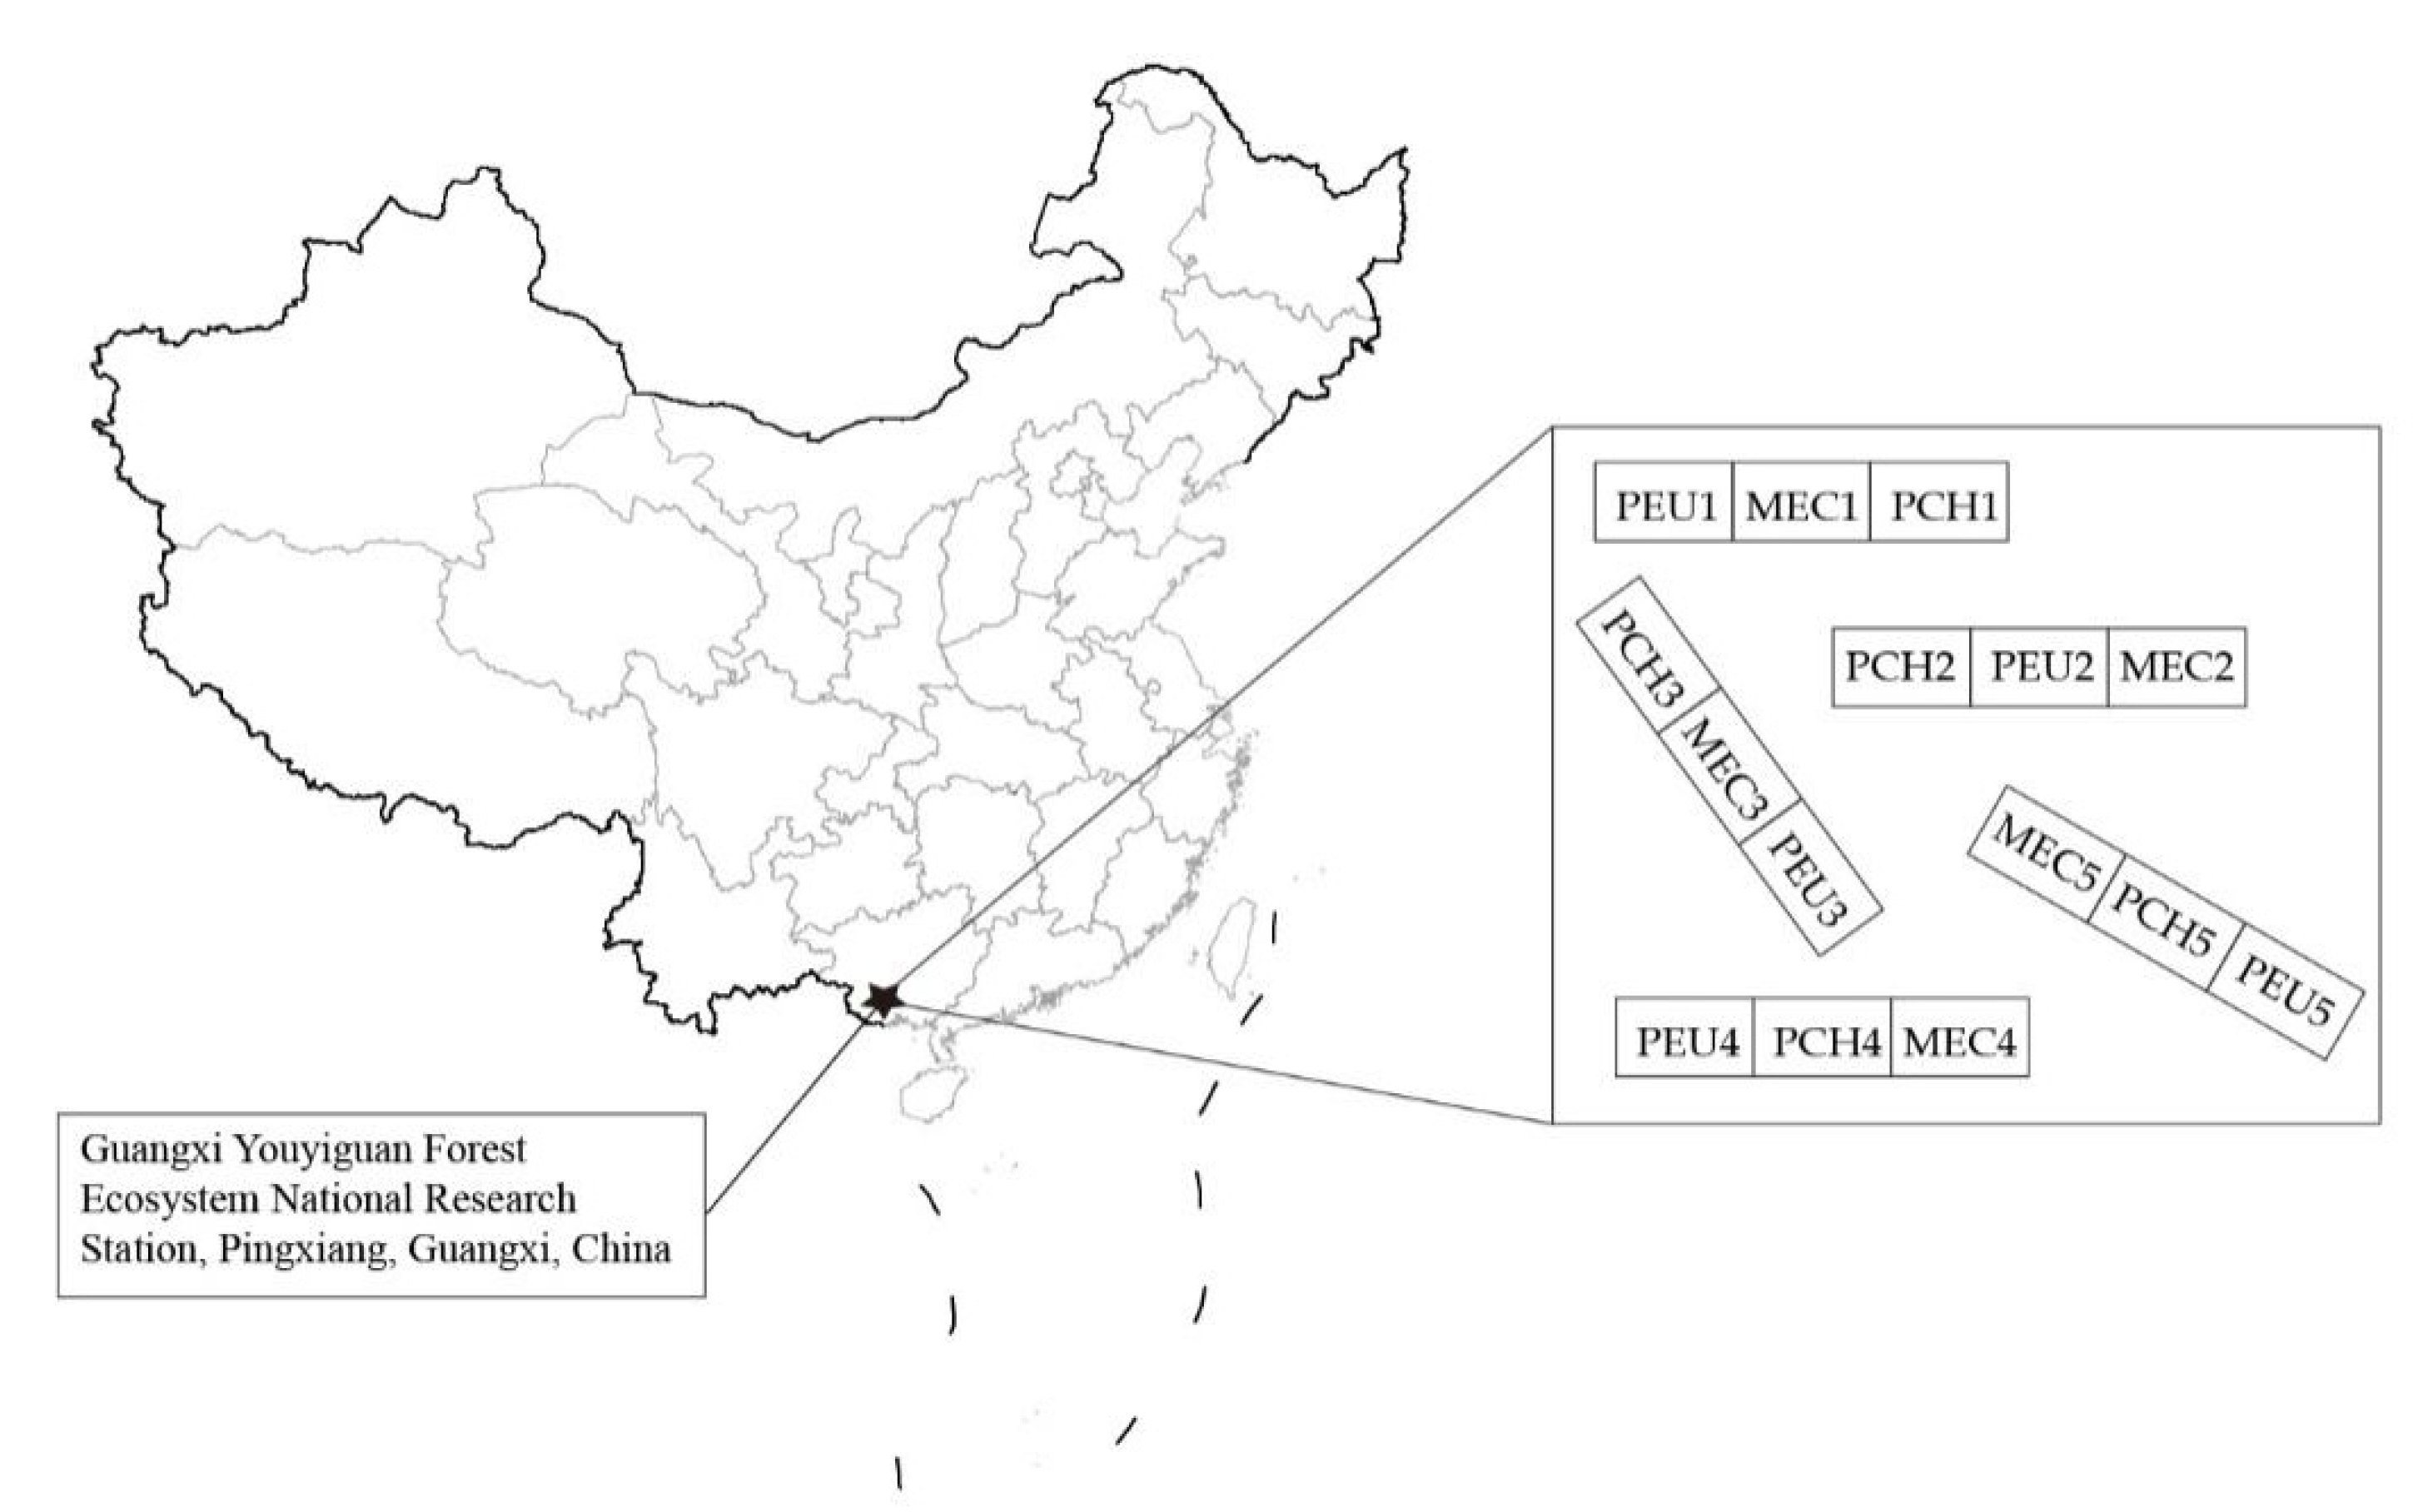
2.1. Study Area and Experimental Design

This research was conducted at the Qing Mountain Station (21°57′47″–22°19′27″ N, 106°39′50″–106°59′30″ E) of Guangxi Youyiguan Forest Ecosystem National Research Station at the Experimental Center of Tropical Forestry, Chinese Academy of Forestry, in Pingxiang City of the Guangxi Zhuang Autonomous Region in southern China. This region is characterized by a subtropical monsoon climate, with a mean annual precipitation of 1300 mm and a mean annual temperature of 22.3 °C [33]. The study area’s elevation spans 240 to 280 m, and its loamy soil is formed from granitic parent material, classified as a Ferrosol based on the Chinese system of soil classification, which is equivalent to an Oxisol based on the USDA Soil Taxonomy (USDA, 1996).
Our experiment started in February 2012 and used a randomized block design with three plantation types, each replicated five times, which were installed soon after the clear-cutting of a Pinus massoniana mono-specific plantation in November 2011. The area of each block was 6 ha, with 2 ha for each plantation, and the distance between any two blocks was at least 500 m (Figure 1, see Table 1 for the abbreviations of the plantation types). The plantation types included pure Eucalyptus (E. urophylla × E. grandis) plantations (PEU), pure C. hystrix plantations (PCH), and mixed Eucalyptus and C. hystrix plantations (MEC). The initial planting density was of 1667 tree ha−1 in each plantation, with 2 m × 3 m spacing between trees; their proportion in the mixed Eucalyptus/C. hystrix stands was 2:1. All these plantations followed the management practices of an eco-silviculture regime, consisting of low-intensity disturbances (i.e., manual clearing, site preparation, and weeding [no heavy machinery], base fertilizer of 250 g/tree, top-dressing of 714 kg/ha in spring 2013, with no herbicide applications), and low economic input (an investment of RMB 15,000 per hectare for a 7-year stand rotation, which is only half of the traditional silviculture regime). The stands of all the plantations had similar soil types, topography, and management histories. According to our examination prior to planting, there were no significant differences in the topographic features, soil properties, and microbial community phospholipid fatty acids (PLFAs) among the plantation sites (Table 2).

2.2. Overstory Survey and Timber Production Estimates

In June 2019, a 400 m2 (20 m × 20 m) sampling plot was randomly established in each of the three treatments (PEU, PCH, and MEC) within each block. In each plot, for each tree, we measured its height (m) with a digital clinometer (Vertex IV, Haglöf Inc., Langsele, Sweden) and its diameter at breast height (DBH; stem diameter at 1.3 m above ground level) with a diameter tape. The stand density in 2019 averaged 1595 trees ha−1 in PEU, 1660 trees ha−1 in PCH, and 1625 trees ha−1 in MEC (overall, 1095 trees were Eucalyptus, and 530 were C. hystrix), and it was similar among the three treatments (p > 0.05). Environmental factors were also recorded (elevation, slope, aspect, slope position, etc.).
Timber production was estimated using stand volume (SV), the latter estimated by the summing the individual tree volume (ITV) of each plot. ITV was estimated using the Equation (1) published by Meng [34] and Liu [35]:
ITV = fe × (H + 3) × π × (1/4) × DBH2
where fe is the experimental form factor, H is the tree height (m), and DBH is the diameter at breast height (cm). The fe was fixed here at a value of 0.4, following other studies using the same Eucalyptus hybrid and C. hystrix [35].

2.3. Overstory and Understory Biomass Measurements

Trees in each plantation were divided into 12 to 19 groups based on DBH; groups corresponded to 1.0 cm intervals, from the smallest to the largest DBH. One to three sample trees were selected from each group, to represent the stand-specific DBH range in each stand, and, then, destructively sampled for biomass measurements. In total, 50 trees in PEU, 17 in PCH, and 55 of Eucalyptus and 12 of C. hystrix in MEC, were, thus, selected and harvested. The aboveground portions of these sampled trees were subdivided into stems, bark, branches, and leaves. The belowground portion of each tree was totally dug out and subdivided into stump, thick roots (diameter > 2.0 cm), medium-thick roots (diameter of 0.5–2.0 cm), and fine roots (diameter < 0.5 cm). The total fresh weight of each part of the trees was estimated in the field, subsampled separately with 500 g. The subsamples were transported to the lab and immediately dried at 85 °C, until a constant weight was reached to determine moisture content. To ensure that the woody components could be dried completely, the woody samples (stems, bark, branches, stump, and thick roots) were split into 0.5 mm thick and 5 cm long. The total dry weight of each aboveground and belowground component was calculated for each sample tree.
Based on the biomass of sample trees, we found that an allometric relationship between the biomass of a given tree component (W), DBH, and tree height (H) was best predicted by the equation W = a(DBH2H)b, for which the coefficient of determination (R2) ranged from 0.7142 to 0.9843. Table 3 shows that under the F-test for these non-linear regression models, all the fitted equations were highly significant (p < 0.01). The biomass of each tree component was then calculated, according to the allometric equations listed in Table 3.
Four quadrants of understory vegetation (each 5 m × 5 m) and litter (each 1 m × 1 m) were established randomly within each plot. For all live plants, their species identity, abundance (counts), height, and coverage were recorded. Coverage was the ratio of the area of vertical projection of the aboveground part of a species to the area of the quadrant. A destructive harvesting method was used to measure the biomass in the aboveground and belowground portions of the shrub and herbaceous layers from the 5 m × 5 m quadrants. The fresh weights of the aboveground and belowground components of the shrubs and herbaceous plants were directly obtained. At the same time, the litter samples were collected from the 1 m × 1 m quadrants and weighed. Immediately, the litter, aboveground, and belowground components of the shrubs and herbaceous plants were evenly mixed, respectively, and subsampled separately with 500 g. The subsamples were transported to the lab and immediately dried at 85 °C until a constant weight, to determine the density of dry biomass per hectare (Mg ha−1).

2.4. Measuring the Carbon Content of Plant and Soil Components

The oven-dried samples of the aboveground and belowground components of trees (Eucalyptus and C. hystrix), understory (shrubs, herbaceous plants), and litter were passed through a 1-mm sieve in the laboratory, and the organic carbon content was determined using the K2Cr2O7–H2SO4 calefaction procedure [36].
In each plot, mineral soil samples were extracted from five depths (0~20 cm, 20~40 cm, 40~60 cm, 60~80 cm, and 80~100 cm) using a stainless-steel corer (8.7-cm diameter). In each plot, nine soil cores were collected at each depth and bulked into one composite sample. Soil samples were taken to the laboratory, air-dried at room temperature (25 °C), passed through a 1-mm mesh sieve to remove coarse living roots and gravel, and, then, ground prior to their chemical analysis. Meanwhile, three additional soil cores for each soil depth were sampled from each plot to quantify the soil bulk density. Soil organic carbon (SOC) concentration was determined by the K2Cr2O7–H2SO4 calefaction procedure.

2.5. Carbon Storage Measurements

The amount of carbon stored in Eucalyptus and C. hystrix trees (TCS), the understory vegetation (UCS), and floor litter (FLCS) was calculated separately, as carbon content multiplied by biomass [24]. Soil organic carbon stocks (SOCS) for each soil depth were calculated as carbon content multiplied by soil mass (soil depth × bulk density values). Total SOCS values were determined by adding the SOCS values of each depth together. Finally, total ecosystem carbon storage (ECS) was calculated by summing the TCS, UCS, FLCS, and total SOCS.

2.6. Statistical Analysis

One-way analysis of variances (ANOVAs) with least square difference (LSD) were conducted to examine the differences in growth (including tree height, DBH, volume), biomass (e.g., trees, understory, and litter), and carbon storage (e.g., TCS, UCS, FLCS, SOCS, and ECS) among the three different plantations. Before ANOVAs, the raw data for all these variables were tested for normality with the Shapiro–Wilk test and for homogeneity of variances with Bartlett’s test. Data were transformed (natural log or square root) when required, to meet assumptions of normality and homogeneity of variance. Two-sample t-tests were conducted to examine the differences in tree height, DBH, volume, biomass, and carbon content of eucalypt and C. hystrix trees growing in mono-specific and mixed-plantation types. All statistical analyses were carried out in SPSS 20.0 software (SPSS, Inc., Chicago, IL), with significance set at p < 0.05. Values are presented throughout as the mean ± standard error (SE) (n = 5).
To further evaluate mixed-species plantation effects on carbon storage, we calculated the relative effects (RE) of mixing species in the stands, by comparing the observed values (OV) with the predicted values (PV) of carbon storage. RE was estimated following Wardle [37] in equation (2):
RE = [(OV − PV)/PV] × 100
where OV is the observed values in the mixed-species plantation, and PV is the average values in the corresponding monocultures. When RE differs from zero, it would indicate non-additive effects (NAE) of mixing species on carbon storage. Negative and positive deviations from zero are inferred as antagonistic and synergistic effects, respectively. One-sample Student’s t-tests with 95% confidence intervals were used to test whether RE differed significantly from zero [31].

3. Results

3.1. Tree Growth

Both species extremely grew significantly greater in mixture than as a monoculture (Table 4). Compared with its mono-specific plantation, the tree height, DBH, volume, and biomass of Eucalyptus in the mixed plantation increased by 7.53%, 7.05%, 19.72%, and 20.20%, respectively, while that of C. hystrix in the mixed plantation increased 17.72%, 24.33%, 61.29%, and 86.05%, respectively. These results supported our first hypothesis, that mixing Eucalyptus and C. hystrix could increase the growth of Eucalyptus and C. hystrix trees in their mixed plantation.

3.2. Carbon Content of Tree, Understory, Litter, and Soil

The carbon content of different tree components did not significantly differ among plantation types or between tree species, according to the ANOVAs and two-sample t-tests (Table 5).
Average carbon content values of the understory vegetation aboveground and belowground in PEU (42.29% and 37.62%, respectively) were significantly lower than those in PCH (46.54% and 44.15%, respectively) and MEC (46.83% and 43.04%, respectively) plantations (p < 0.05). The mean carbon content of the litter layer was significantly lower in PEU (37.63%) and PCH (40.29%) than in MEC (47.16%) (p < 0.05) (Table 6).
Carbon content of the soil horizons decreased with greater depth (Table 6). Topsoil (0–20 cm depth) had a carbon content that was more than 4.3 times that of the substrate (80–100 cm depth). The mean carbon content of the entire 100-cm soil profile (all five layers) and of each soil horizon of the PCH and MEC plantations were significantly greater than that of the soil layers in PEU (p < 0.05) (Table 6). However, the carbon content of various soil horizons did not significantly differ between PCH and MEC stands (p > 0.05), except for the topsoil (0–20 cm) (p > 0.05) (Table 6).

3.3. Carbon Storage

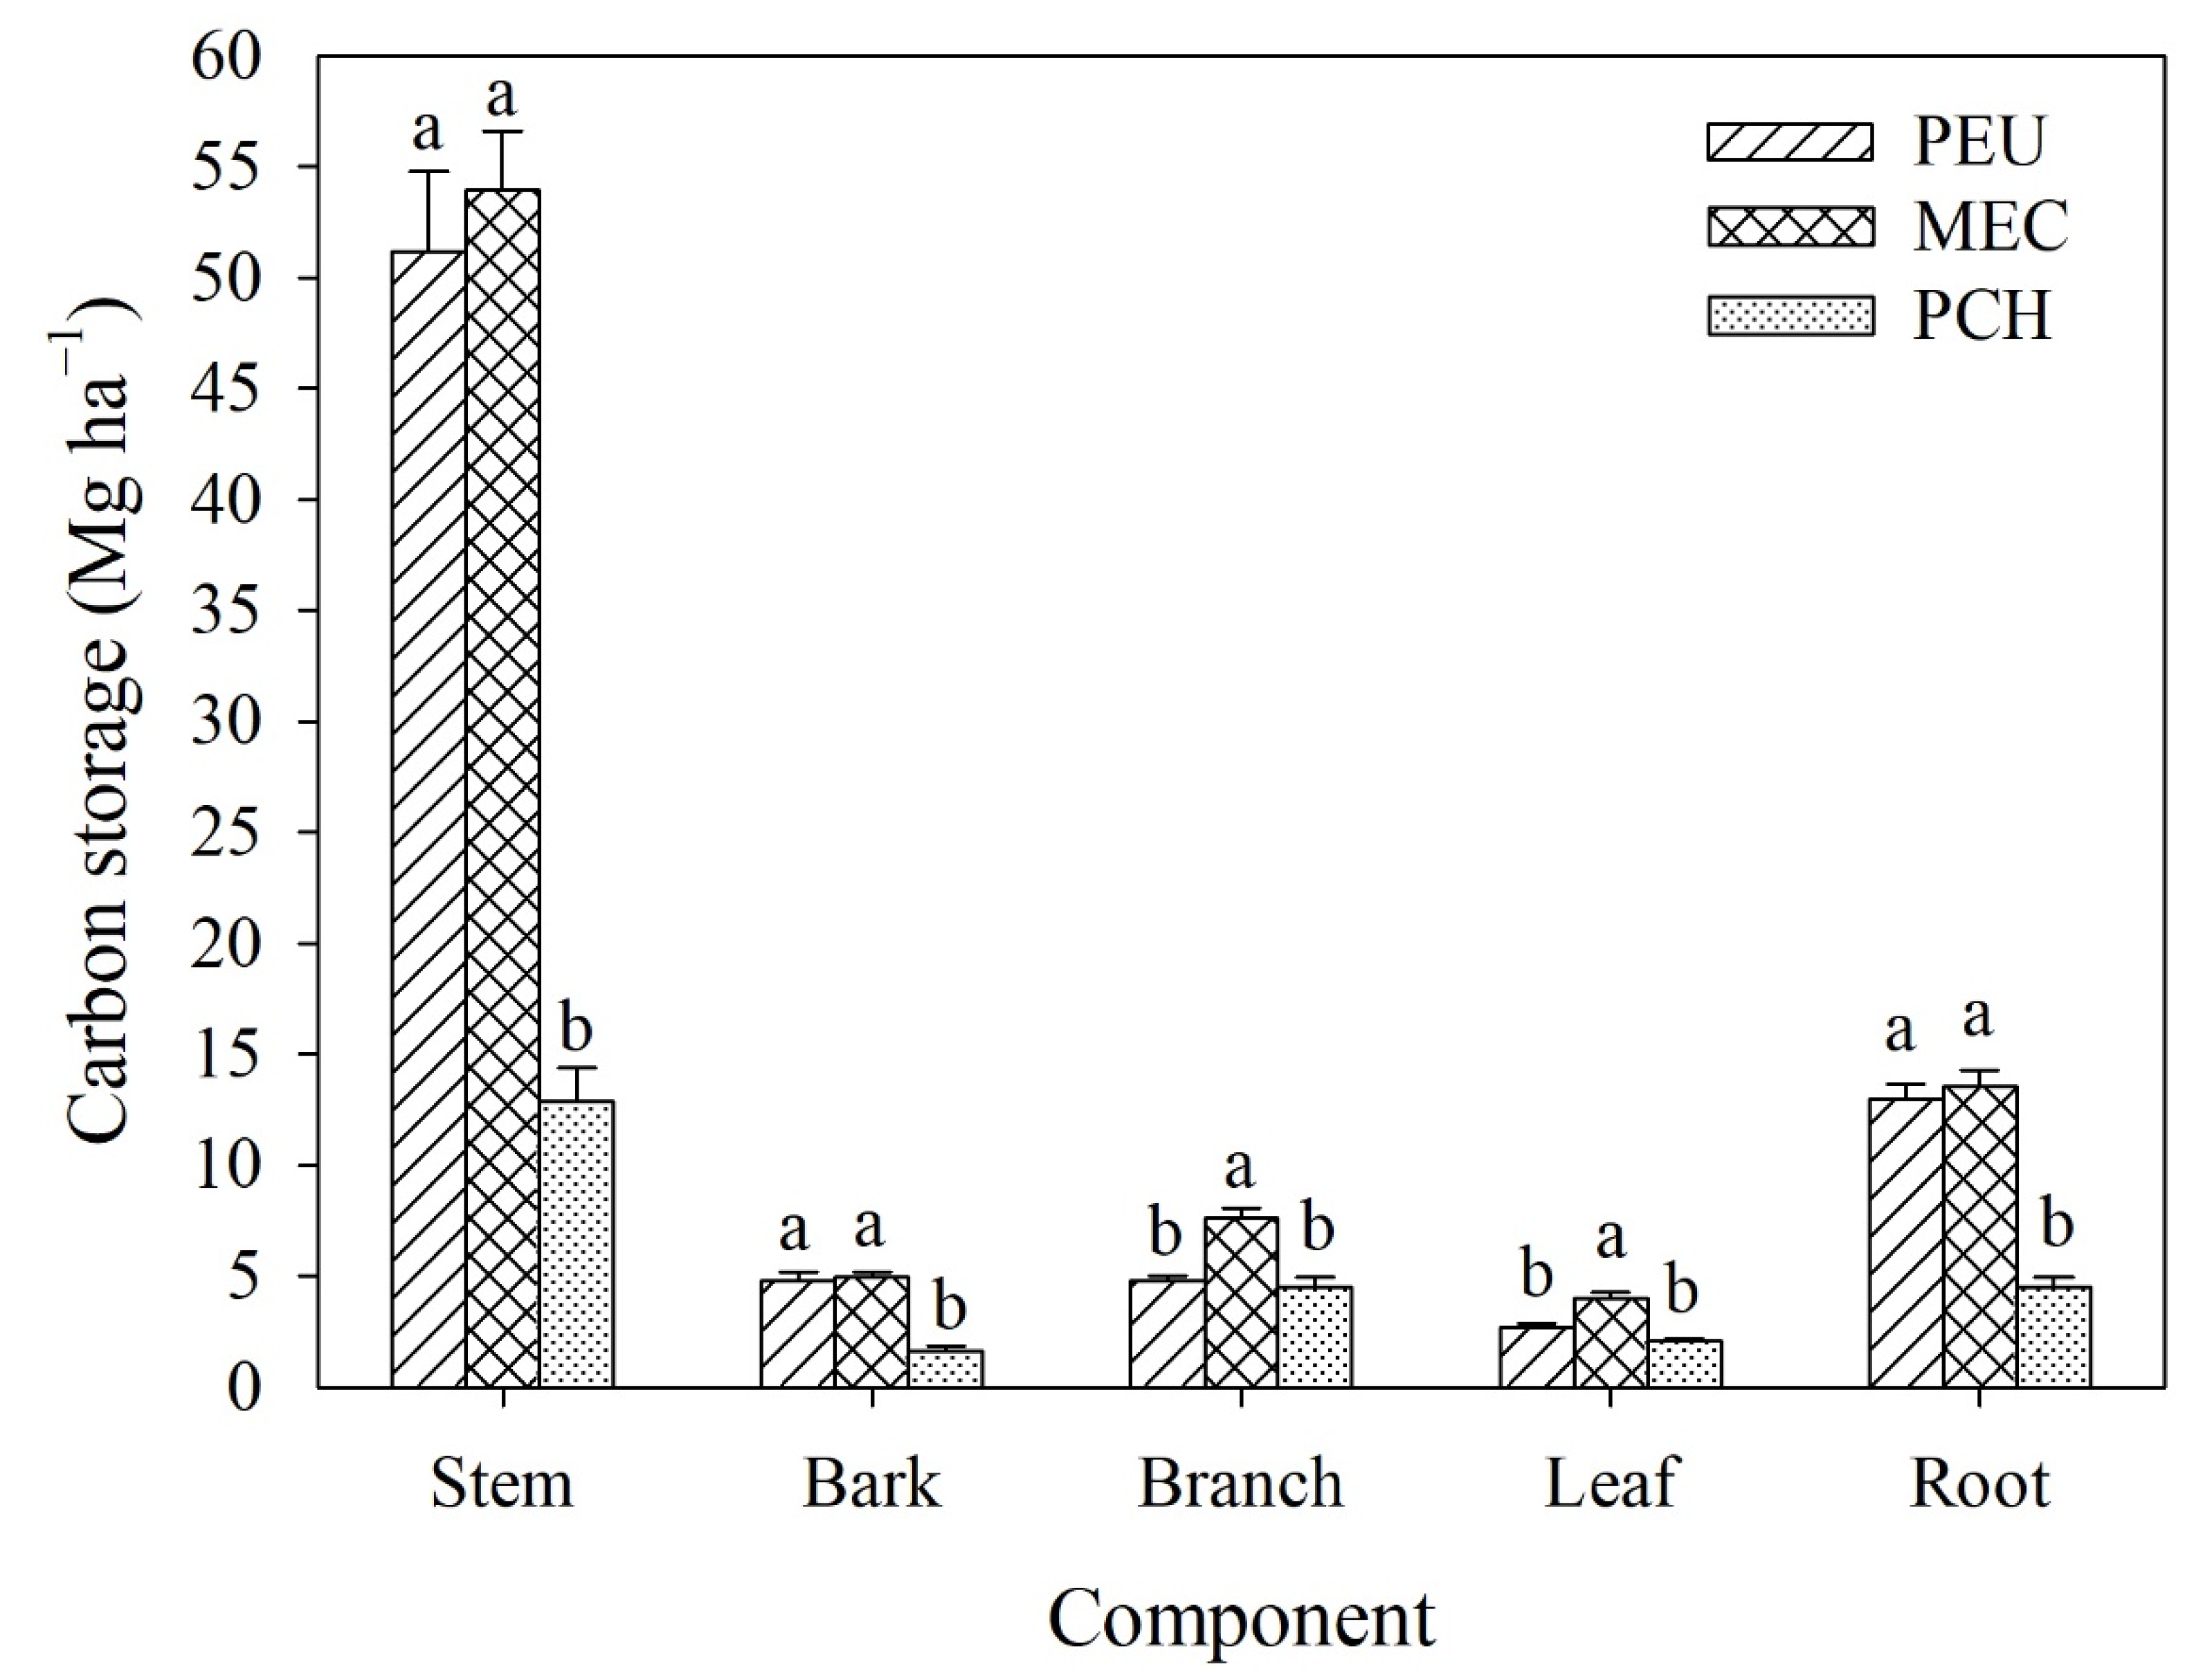
3.3.1. Tree Carbon Storage

When we examined the various tree components (stems, bark, and roots), their carbon storage was significantly lower in PCH than either PEU or MEC (p < 0.05), but similar between the latter plantations (p > 0.05) (Figure 2). For branches and leaves, their carbon storage was significantly higher in MEC than either PEU or PCH (p < 0.05), but similar between the latter plantations (p > 0.05) (Figure 2). In total, tree carbon storage (TCS) was greater in mixed-species (84.33 Mg ha1) than mono-specific plantation stands (PEU: 76.57 Mg ha1, PCH: 25.59 Mg ha1), being significantly higher than PCH but similar with PEU (Figure 3). These results supported our first hypothesis, that the mixed species plantation would have more TCS than either mono-specific plantation.

3.3.2. Understory and Floor Litter Carbon Storage

The UCS was greater in PEU (2.55 Mg ha−1) and PCH (1.65 Mg ha−1) than in MEC (0.96 Mg ha−1) (Figure 3). However, these differences were only significant for PEU vis-à-vis PCH and MEC (p < 0.05), while the latter two plantations had non-significant differences in UCS (p > 0.05). These results supported our third hypothesis, that the mixed-species plantation would have less UCS than either mono-specific plantation. Figure 3 also shows that the FLCS was greater in MEC (4.34 Mg ha−1) and PCH (4.03 Mg ha−1) than in the PEU plantation (2.99 Mg ha−1), but the difference was only significant for MEC compared with the PEU plantation (p < 0.05).

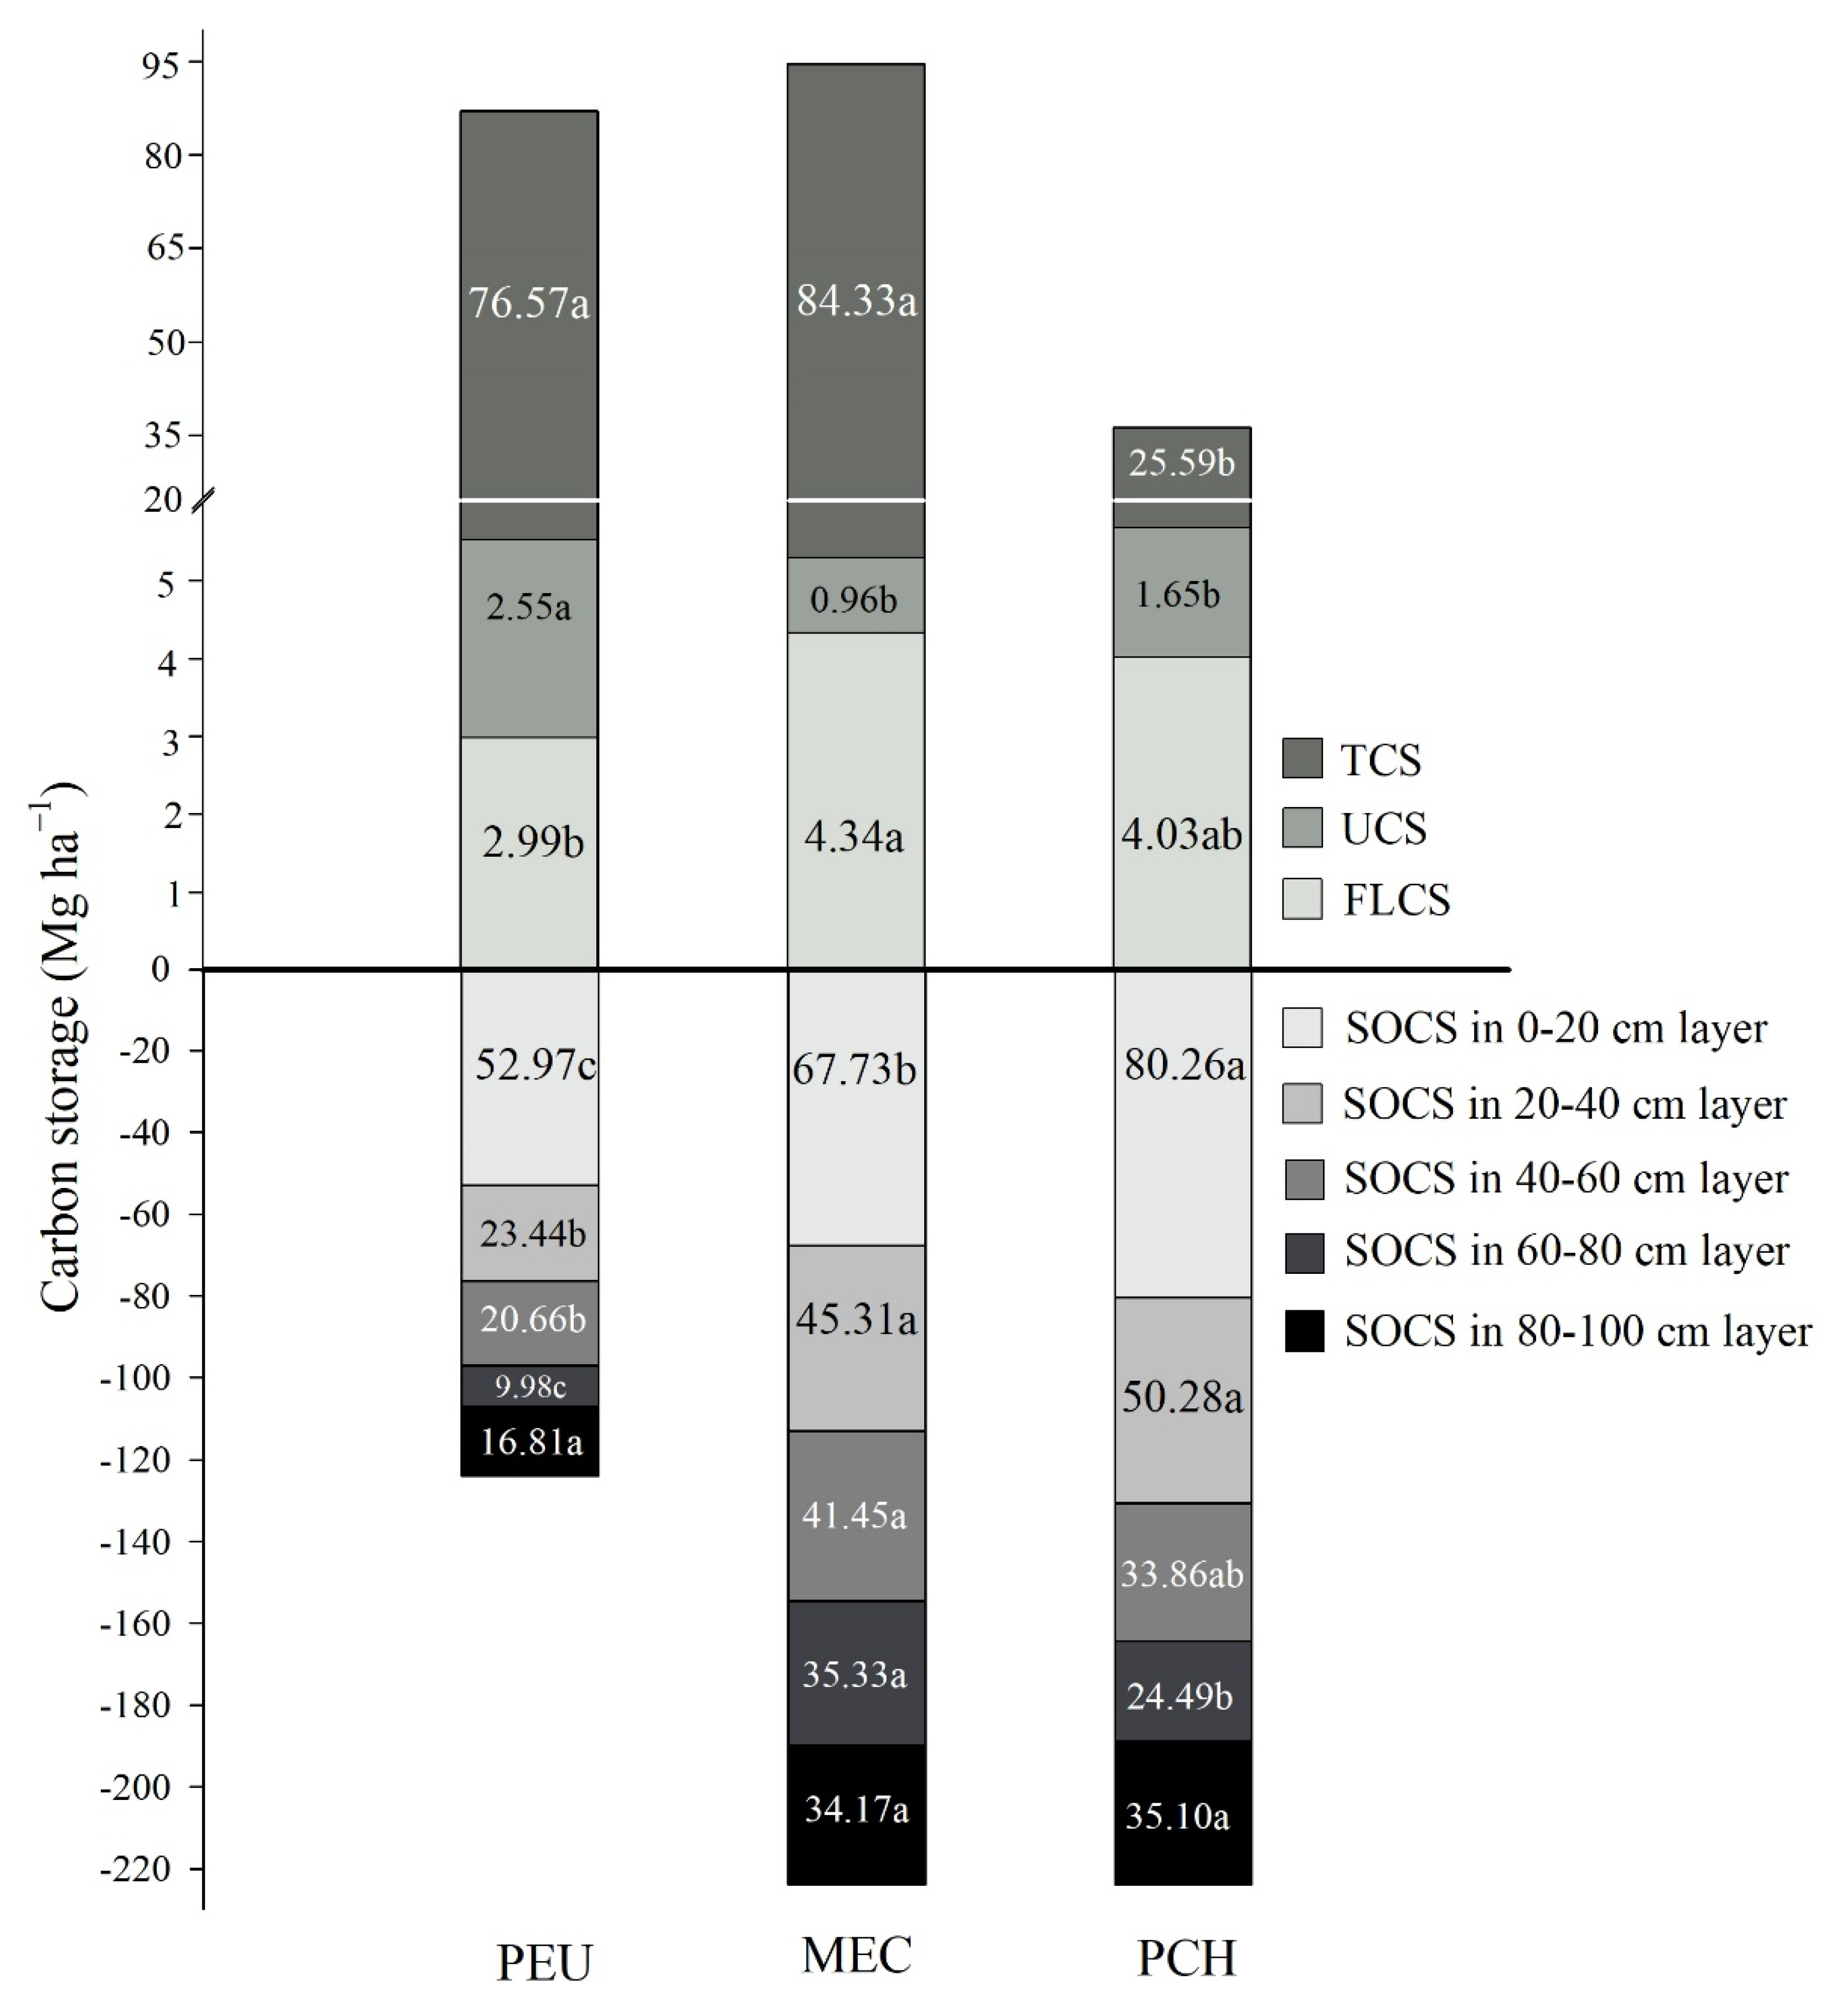
3.3.3. Soil Carbon Storage

The SOCS was greater in the PCH and MEC plantations at a total of 224.00 and 223.98 Mg ha−1, respectively; while it was substantially lower in PEU at 123.85 Mg ha−1. PEU stored significantly less SOCS than did either PCH or MEC (p < 0.05). These results supported our second hypothesis, that the PEU plantation would incur reduced carbon storage in its soil horizons than PCH and MEC. In the stands of the three plantations, the carbon storage in their soil layers decreased as depth increased, a result consistent with the distribution of the soil’s carbon content. Topsoil stored the most carbon. Across the three plantations, 30.24%–42.77% of the total carbon storage in the soil occurred at a depth of 0–20 cm (Figure 3).

3.3.4. Whole Ecosystem Carbon Storage

The ECS of the plantation ecosystem (i.e., TCS + UCS + FLCS + SOCS) was significantly greater in MEC (313.61 Mg ha−1) than PEU (205.96 Mg ha−1) and PCH (255.27 Mg ha−1) plantations (p < 0.05) (Figure 3).
As Figure 3 shows, the rank order of ECS is soil > trees > litter > understory. The TCS in the three plantation types accounted for total carbon storage levels of 37.18%, 10.02%, and 26.89%, respectively, in PEU, PCH, and MEC. The FLCS accounted for 1.45%, 1.58%, and 1.39%, while SOCS accounted for 60.13%, 87.75%, and 71.42%, respectively; the corresponding values for UCS were low, being 1.24%, 0.65%, and 0.31%.

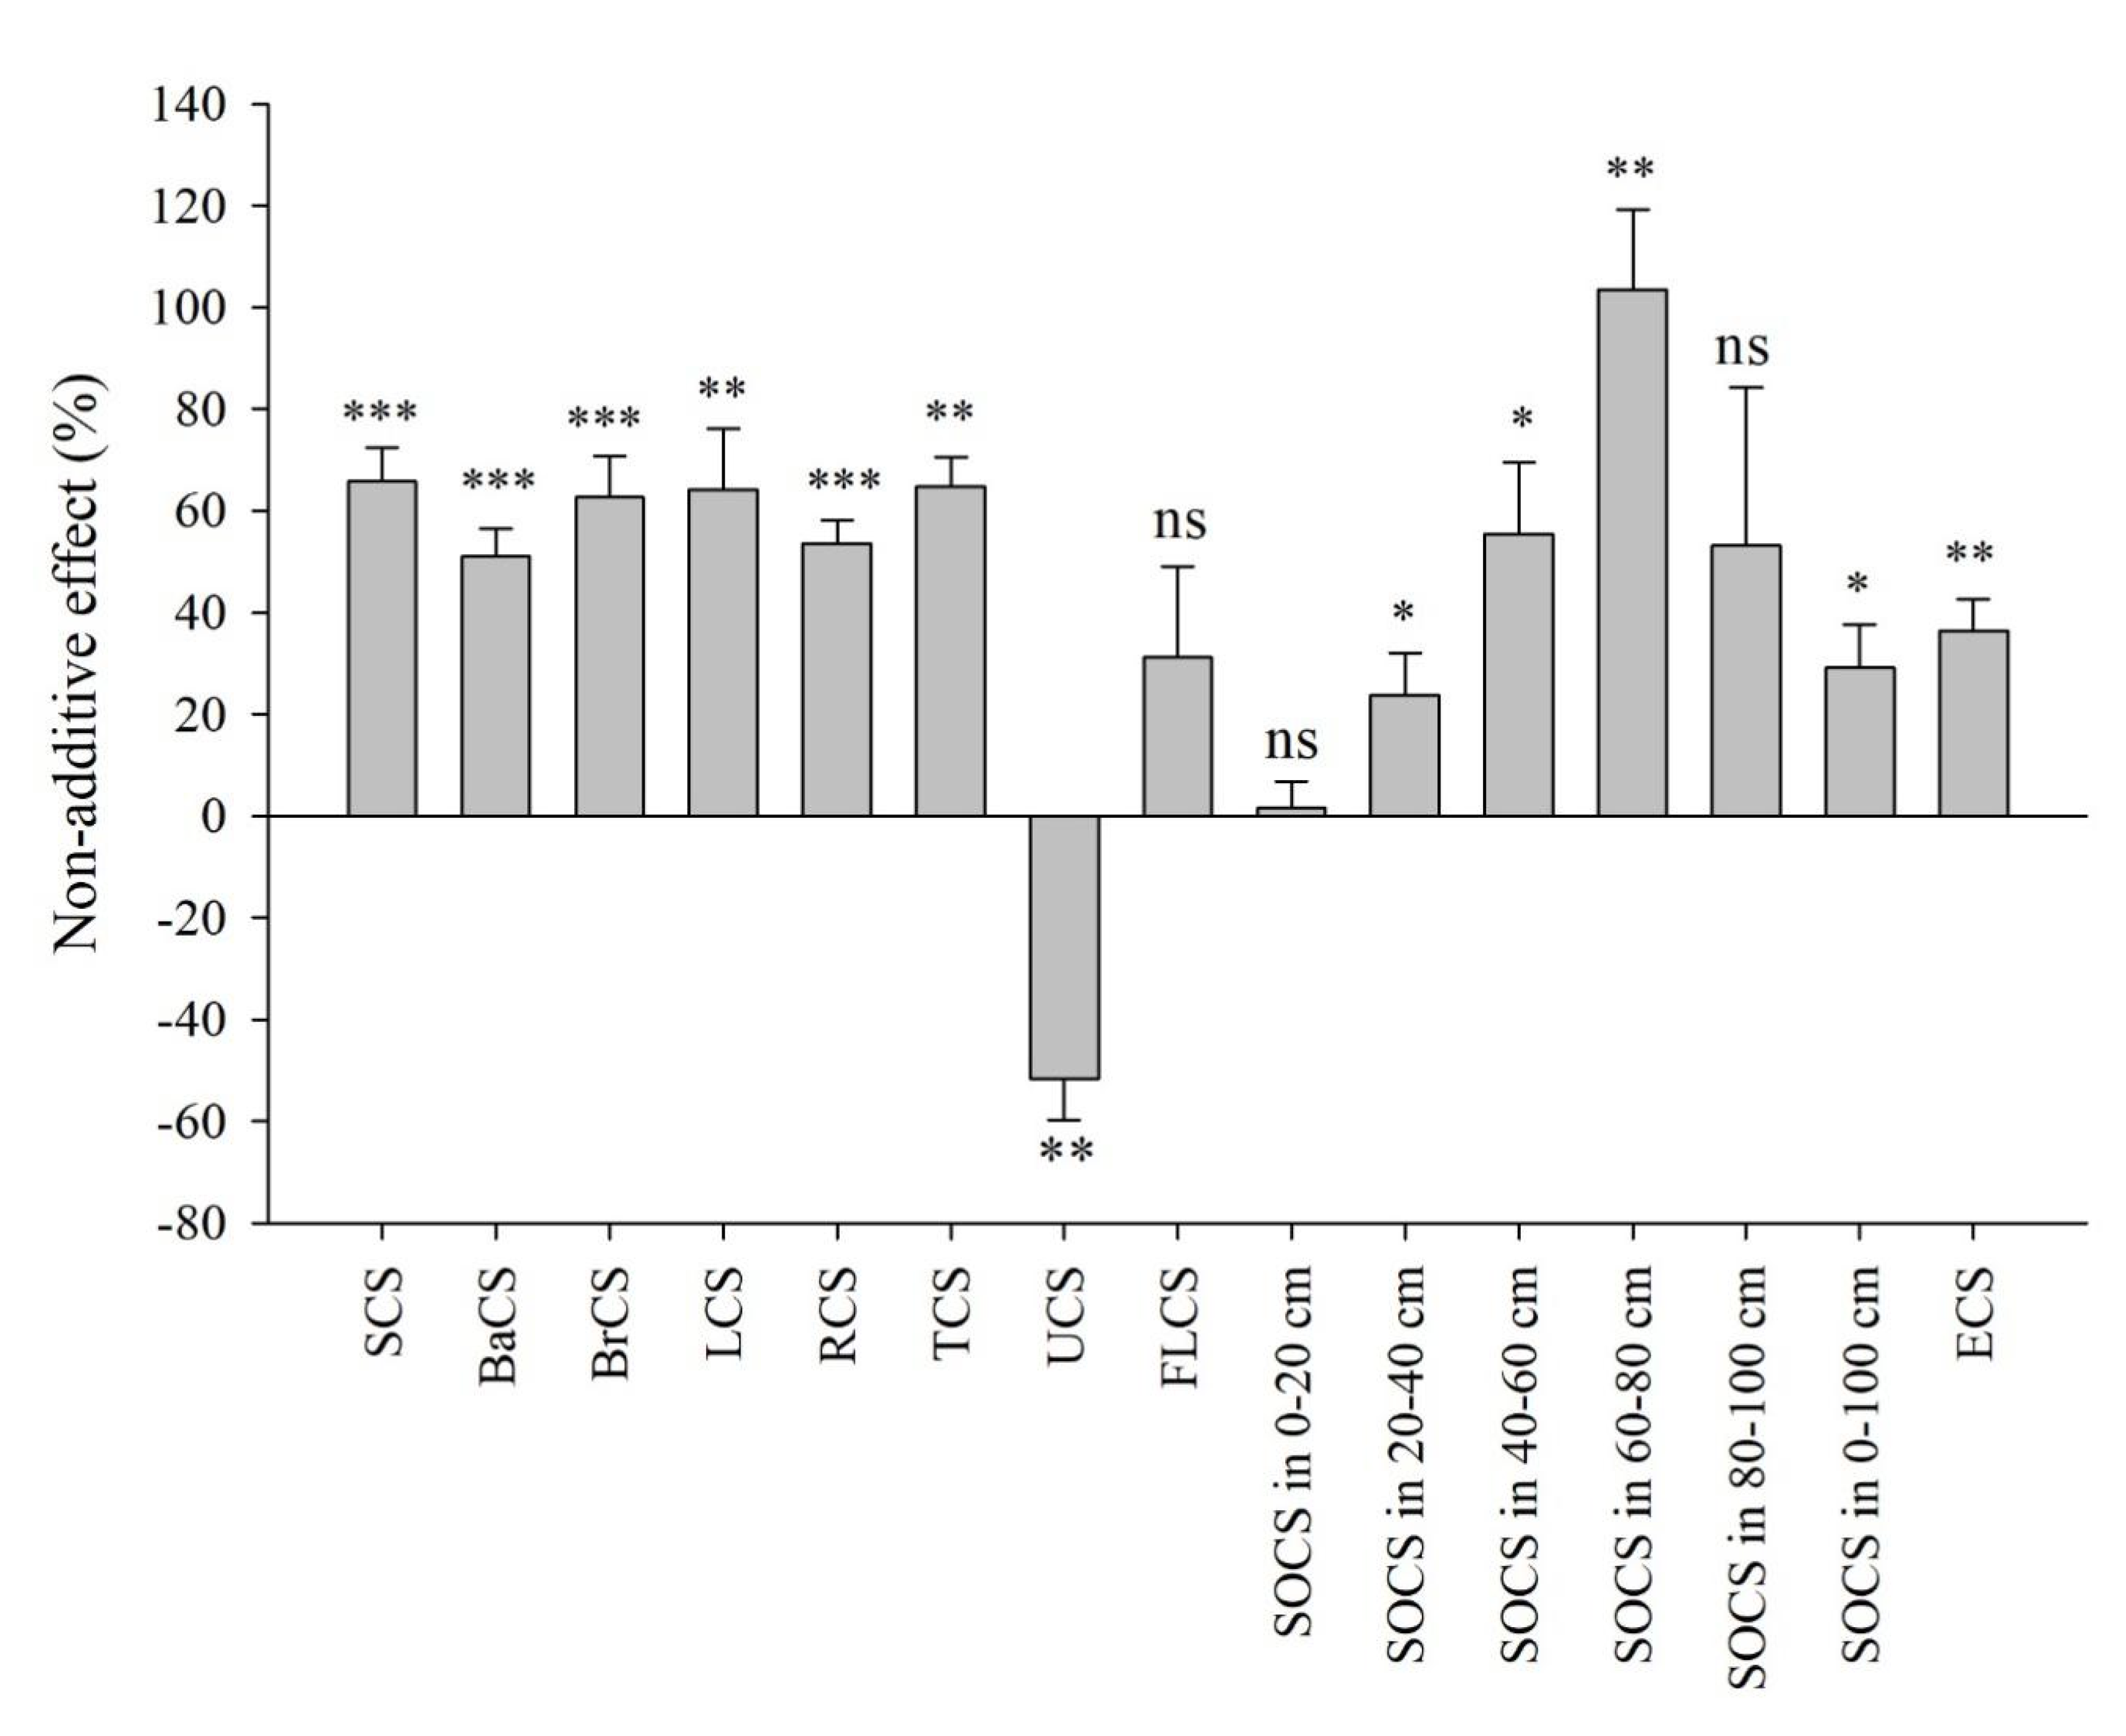
3.4. Admixing Effects on Whole Ecosystem Carbon Storage

In the admixing effects analysis, we found significant synergistic effects (NAE > 0) on all tree components’ carbon storage and TCS, with values for NAE that ranged from +51% to +66% (Figure 4). Whereas, significantly antagonistic effects (NAE < 0) were detected upon UCS. There were significant synergistic effects on SOCS and ECS, with an increase of +29% and +36%, respectively. When decomposed into various soil compartments, significant positive values for NAE of species mixing were observed for the 20–40 cm (+24%), 40–60 cm (+55%), and 60–80 cm (+104%) layers.

4. Discussion

4.1. Effects of Mixing Species on Tree Growth and Productivity

Our results suggest that the productivity of mixed-species stands was the greatest (12,047 kg ha−1 year−1 of carbon) when compared to mono-specific plantations (Eucalyptus and C. hystrix, 10,938 and 3656 kg ha−1 year−1 of carbon, respectively), but this difference was significant only in comparison with the C. hystrix plantation. Our study also found that Eucalyptus and C. hystrix trees attained greater tree heights, diameters, volumes, and biomass in the stands sampled in the mixed-species plantation. These results are similar to previous investigations in the same study region [22,24,38].
Forest canopy structure is considered a major factor in the observed decrease in biomass and carbon stock potential of plantations [39]. Some earlier studies have reported a close association between forest canopy structure and plantation stands’ growth and productivity levels [40]. A higher canopy density may intensify competition for light, which can then inhibit further plant growth [41,42]. Meanwhile, a lower canopy density is beneficial to understory vegetation, but intensifies competition for water and nutrients among understory plants [39,43]. In our study, the forest canopy was more open in the pure Eucalyptus plantation after seven growing seasons, with its understory vegetation growing rapidly, further intensifying competition for water and nutrients between eucalypt trees and understory plants under an eco-silviculture regime, which may result in its decreasing productivity. In contrast, the forest canopy was more closed in the pure C. hystrix plantation after seven growing seasons, further intensifying competition for water, nutrients, and light among the different individual trees. Competition for light induced more carbon to be allocated to tree height growth rather than diameter growth [44]. Therefore, this could have contributed to the decreased productivity of C. hystrix monocultures. Our study also found that the forest canopy structure was improved significantly in the mixed-species plantation after just seven growing seasons, with a distinctive dual forest canopy strata developed. Eucalyptus trees formed the upper canopy stratum, while C. hystrix trees composed the lower canopy stratum. In addition, Eucalyptus trees were more deeply rooted, while C. hystrix trees were superficially rooted. Accordingly, mixing the trees of Eucalyptus and C. hystrix can improve the resource use efficiency of these two species, and, thereby, increase the growth and productivity of the mixed plantation.

4.2. Effect of Plantation Types on Whole Ecosystem Carbon Stocks

Ecosystem carbon stocks (ECS) can be influenced by many factors, such as climate, soil, plantation types, and management practices [45,46]. In this study, however, plantation type was considered as a major factor capable of influencing ECS under similar climate and soil conditions as well as identical management practices. Our results suggest that the mixed plantation of Eucalyptus (E. urophylla × E. grandis hybrid) and C. hystrix significantly increased the ECS under the applied eco-silviculture regime, when compared with the mono-specific Eucalyptus and C. hystrix plantations. This finding is consistent with the theory that mixed stands are more productive than monocultures [47], but the differing components of the ECS (i.e., TCS, UCS, FLCS, SOCS) were distinctly different. The mixed Eucalyptus and C. hystrix plantation harbored the largest TCS, FLCS, and ECS, higher SOCS, and the smallest UCS. The mono-specific Eucalyptus plantation held the highest UCS and a high TCS, but had the lowest FLCS, SOCS, and ECS. However, the mono-specific C. hystrix plantation had the highest SOCS, in addition to a high UCS, FLCS, and ECS, yet also had the lowest TCS.
Our results clearly demonstrate that the mixed Eucalyptus and C. hystrix plantation can significantly impact whole ecosystem carbon stocks. Firstly, mixing the two tree species significantly increased the growth and productivity of the plantation, which may result in a larger TCS. Secondly, increased stand productivity, especially in terms of more branches and leaves, can also increase litter production [28,48], leading to a greater accumulation of organic matter on the forest floor [49,50], which may augment the FLCS. Thirdly, the increase in decomposition rates of mixed litters of different species could also increase the SOCS [31,51]. Finally, concurrent increases in the TCS, FLCS, and SOCS would translate into a greater ECS. Mixing tree species could enhance forest canopy coverage, limiting light transmission, which would reduce the carbon stock held in understory vegetation. We can attribute these positive effects to the favorable stand structure and microclimatic conditions provided by mixing Eucalyptus and C. hystrix trees in the mixtures. These include more available canopy space, a multi-tiered canopy structure with less intensive competition for light and nutrients [52], improved litter quantity and quality [3], enhanced soil microbial community diversity and enzyme activity [53], and accelerated biogeochemical cycling of nutrients [54].
In the case of the mono-specific Eucalyptus plantation, firstly, Eucalyptus is a fast-growing species with high nutrient-consumption rates. Secondly, because the eco-silviculture regime reduces the clearance of understory vegetation, competition between eucalypt trees and understory vegetation for water and fertilizer is increased. Thirdly, eucalypt leaves have low productivity, produce less litter, are of poor quality, and provide fewer nutrient returns [19]. In addition, among the three plantations, mono-specific Eucalyptus plantation had the highest soil bulk density (1.59 ± 0.02 g/cm3), which may inhibit plant root growth and nutrient uptake by altering the micro-conditions of soil [55,56], thereby decreasing plant growth and the TCS. Moreover, since Eucalyptus stands grow rapidly, a large amount of SOC is converted to plant biomass carbon [14,15]. Diminished litter mass, a faster decomposition rate, and poor soil micro-environment in the mono-specific Eucalyptus stands could lead to reduced accumulation of organic matter in soil, which may result in the significantly decreased SOCS [14,15], and, further, declines in its ECS.
However, C. hystrix, a slow-growing shallow-rooted species, does not maximize its use of local resources, resulting in lower productivity and TCS, as well as a higher litter production and decomposition rate [57]. This could explain why the pure C. hystrix plantation had the greatest soil organic carbon content among the three plantations (1.72% ± 0. 20%), which may result in lower TCS and higher SOCS [22], and, thus, lower ECS.

4.3. Tree Species Mixture Effects on Whole Ecosystem Carbon Stocks

Although non-additive effects have been widely used in decomposition studies of mixed-species’ litter [37,58,59,60,61], they are rarely conducted to analyze plantation productivity and ecosystem carbon stocks [31]. Non-additive effects from litter mixing studies suggest that both synergistic and antagonistic interactions can occur [61]; however, synergistic effects tend to occur mainly in mixed-species plantations [31]. For example, Chomel [31] found significant synergistic effects on aboveground and soil carbon stocks in a mixed plantation of hybrid poplar and white spruce, which could be attributed to the higher biomass of poplar and the greater litter accumulation on the soil surface, in mixtures compared with monoculture. In our study, by comparing the predicted carbon stock from mono-specific stands and observed carbon stock in mixed-species stands, we showed that mixing Eucalyptus and C. hystrix trees affected whole ecosystem carbon stocks via synergistic and antagonistic interactions. Furthermore, the synergistic effects were mainly achieved through carbon sequestration in trees (including whole-tree components) as well as in the 20–40 cm, 40–60 cm, and 80–100 cm layers of soil. By contrast, the antagonistic effects were realized mainly via carbon storage loss in understory vegetation. Our results agree with those obtained by Chomel [31], and they suggested that both synergistic and antagonistic interactions occurred when mixing tree species. These findings suggested that non-additive effects of mixed species may be common in forest ecosystems, chiefly manifesting as synergistic effects.
Many previous studies also reported that stands of mixed species could support increased carbon stocks [22,38]. These studies relied on simple comparisons between mixed stands and pure stands of their productivity and carbon stocks, for which positive effects of mixing species were detected [22,38,62,63]. In our study, the growth of both eucalypt and C. hystrix trees was significantly improved in the mixed plantation compared to the pure plantations, resulting in a sufficient increase in productivity and ecosystem carbon storage. Therefore, C. hystrix did not affect Eucalyptus growth and its carbon storage values; rather, adding C. hystrix to Eucalyptus benefitted overall Eucalyptus wood production.

5. Conclusions

Our results confirmed that both Eucalyptus (E. urophylla × E. grandis hybrid) and C. hystrix trees’ growth are significantly enhanced in mixed-species plantations compared to mono-specific plantations, under an experimental eco-silviculture regime. The mixed Eucalyptus and C. hystrix plantation supported the largest TCS, FLCS, and ECS, higher SOCS, and the smallest UCS in the three plantations. Significant synergistic effects on TCS, SOCS, and ECS, as well as significant antagonistic effects on UCS, were detected for the mixed plantation. These synergistic effects should be related to the complementary ecological niches of the two species (i.e., Eucalyptus and C. hystrix) in their mixed-species plantation, which could enable them to maximize resource utilization. This could increase stand productivity, and such increases in stand productivity can also increase litter production, thereby leading to the greater accumulation of organic matter on the forest floor, with a positive effect by mixed species’ litter on decomposition rates. This may result in augmented SOCS, and, consequently, an increased ECS.
Besides the increase in the yield of Eucalyptus and precious timber, our results also indicated that mixing Eucalyptus and C. hystrix enhanced ecosystem carbon storage. This should be a key strategy to offset CO2 emissions and improve plantations’ general management in southern China. Therefore, we suggest establishing mixed plantations of tree species with complementary ecological niches under an eco-silviculture regime, to promote the sustainable development of Eucalyptus plantations. However, these synergistic effects were found in just seven years, following reforestation under an eco-silviculture regime. Therefore, in order to determine the long-term trend of these positive effects, further monitoring and study of the experimental plantations is necessary.

Author Contributions

Conceptualization, Y.W.; methodology, L.W. and X.Z.; software, X.Z.; validation, L.W., X.Z. and D.S.; investigation, Y.W., L.W., X.Z. and D.S.; writing–original draft preparation, L.W. and X.Z.; writing–review and editing, L.W. and X.Z.; supervision, Y.W.; project administration, X.Z.; funding acquisition, Y.W. and X.Z. All authors have read and agreed to the published version of the manuscript.

Funding

This research was funded by National Natural Science Foundation of China (31860171 and 32160358), Department of Science and Technology of Guangxi Zhuang Autonomous Region (2018AB40007), and China Postdoctoral Science Foundation (2019M663409).

Data Availability Statement

Data are available from corresponding author upon reasonable request.

Acknowledgments

We thank the staff from the Experimental Center of Tropical Forestry, Chinese Academy of Forestry for their support with the field survey. The two anonymous reviewers are acknowledged for their valuable comments and suggestions, which contributed to the improvement of the manuscript. We also thank LetPub (www.letpub.com accessed on 25 February 2022) for linguistic assistance and pre-submission expert review.

Conflicts of Interest

The authors declare no conflict of interest.

References

  1. FAO. Global Forest Resources Assessment; Main Report; FAO: Rome, Italy, 2020. [Google Scholar]
  2. Huang, X.M.; Liu, S.R.; Wang, H.; Hu, Z.D.; Li, Z.G.; You, Y.M. Changes of soil microbial biomass carbon and community composition through mixing nitrogen-fixing species with Eucalyptus Urophylla in subtropical China. Soil Biol. Biochem. 2014, 73, 42–48. [Google Scholar] [CrossRef]
  3. Wen, Y.G.; Zhou, X.G.; Zhu, H.G. Theory, Technology and Practices in Eucalyptus Plantations under Eco-Silviculture Regime; Science Press: Beijing, China, 2020; pp. 1–254. (In Chinese) [Google Scholar]
  4. Zhou, X.G.; Zhu, H.G.; Wen, Y.G.; Goodale, U.M.; Zhu, Y.L.; Yu, S.F.; Li, C.T.; Li, X.Q. Intensive management and declines in soil nutrients lead to serious exotic plant invasion in Eucalyptus plantations under successive short–rotation regimes. Land Degrad. Dev. 2020, 31, 297–310. [Google Scholar] [CrossRef]
  5. Wu, J.P.; Fan, H.B.; Liu, W.F.; Huang, G.M.; Tang, J.F.; Zeng, R.J.; Huang, J.; Liu, Z.F. Should exotic Eucalyptus be planted in Subtropical China: Insights from understory plant diversity in two contrasting Eucalyptus chronosequences. Environ. Manag. 2015, 56, 1244–1251. [Google Scholar] [CrossRef] [PubMed]
  6. FAO. Global Forest Resources Assessment; Main Report; FAO: Rome, Italy, 2010. [Google Scholar]
  7. Williams, R.A. Mitigating biodiversity concerns in Eucalyptus plantations located in South China. J. Biosci. Med. 2015, 3, 1–8. [Google Scholar] [CrossRef] [Green Version]
  8. Turnbull, J.W. Eucalypt plantations. New For. 1999, 17, 37–52. [Google Scholar] [CrossRef]
  9. Zaiton, S.; Sheriza, M.R.; Ainishifaa, R.; Alfred, K.; Norfaryant, K. Eucalyptus in Malaysia: Review on environmental impacts. J. Landsc. Ecol. 2020, 13, 79–94. [Google Scholar] [CrossRef]
  10. Zhang, K.; Zheng, H.; Chen, F.L.; Ouyang, Z.Y.; Wang, Y.; Wu, Y.F.; Lan, L.; Fu, M.; Xiang, X.W. Changes in soil quality after converting Pinus to Eucalyptus plantations in southern China. Solid Earth 2015, 6, 115–123. [Google Scholar] [CrossRef] [Green Version]
  11. Wen, Y.G.; Ye, D.; Chen, F.; Liu, S.R.; Liang, H.W. The changes of understory plant diversity in continuous cropping system of Eucalyptus plantations, South China. J. For. Res. 2010, 15, 252–258. [Google Scholar] [CrossRef]
  12. Zhou, X.G.; Ye, D.; Zhu, H.G.; Li, X.Q.; Su, Y.; Lan, J.; Wen, Y.G. Effects of second rotation seedlings and coppice on understorey vegetation and timber production of Eucalyptus plantations. J. Trop. For. Sci. 2017, 29, 54–68. [Google Scholar]
  13. Jin, D.; Huang, Y.; Zhou, X.L.; Chen, B.; Ma, J.; Yan, Y.H. High risk of plant invasion in the understory of eucalypt plantations in South China. Sci. Rep. 2015, 5, 18492. [Google Scholar] [CrossRef] [Green Version]
  14. Zhou, X.G.; Zhu, H.G.; Wen, Y.G.; Goodale, U.M.; Li, X.Q.; You, Y.M.; Ye, D.; Liang, H.W. Effects of understory management on trade-offs and synergies between biomass carbon stock, plant diversity and timber production in eucalyptus plantations. For. Ecol. Manag. 2018, 410, 164–173. [Google Scholar] [CrossRef]
  15. Li, X.Q.; Ye, D.; Liang, H.W.; Zhu, H.G.; Qin, L.; Zhu, Y.L.; Wen, Y.G. Effects of successive rotation regimes on carbon stocks in Eucalyptus plantations in subtropical China measured over a full rotation. PLoS ONE 2015, 10, e0132858. [Google Scholar] [CrossRef] [PubMed] [Green Version]
  16. Kelty, M.J. Comparative productivity of monocultures and mixed-species stands. In The Ecology and Silviculture of Mixed-Species Forests; Kelty, M.J., Ed.; Kluwer Academic: Dordrecht, The Netherlands, 1992; pp. 25–141. [Google Scholar]
  17. Man, R.Z.; Lieffers, V.J. Are mixtures of aspen and white spruce more productive than single species stands? For. Chron. 1999, 75, 505–513. [Google Scholar] [CrossRef]
  18. Kelty, M.J. The role of species mixtures in plantation forestry. For. Ecol. Manag. 2006, 233, 195–204. [Google Scholar] [CrossRef]
  19. Guo, L.B.; Sims, R.E.H. Eucalypt litter decomposition and nutrient release under a short rotation forest regime and effluent irrigation treatments in New Zealand. I. External effects. Soil Biol. Biochem. 2001, 33, 1381–1388. [Google Scholar] [CrossRef]
  20. McTiernan, K.B.; Ineson, P.; Coward, P.A. Respiration and nutrient release from tree leaf litter mixtures. Oikos 1997, 78, 527–538. [Google Scholar] [CrossRef]
  21. Wang, H.; Liu, S.R.; Wang, J.X.; You, Y.M.; Yang, J.Y.; Shi, Z.M.; Huang, X.M.; Zheng, L.; Li, Z.Y.; Ming, A.G.; et al. Mixed-species plantation with Pinus massoniana and Castanopsis hystrix accelerates C loss in recalcitrant coniferous litter but slows C loss in labile broadleaf litter in southern China. Forest Ecol. Manag. 2018, 422, 207–213. [Google Scholar] [CrossRef]
  22. Wen, Y.G.; Zhang, Z.F.; Zhou, X.G.; Zhu, H.G.; Wang, L.; Cai, D.X.; Jia, H.Y.; Ming, A.G.; Lu, L.H. Effects of mixing precious indigenous tree species and Eucalyptus on ecosystem biomass and carbon stocks. Guangxi Sci. 2020, 27, 111–119. (In Chinese) [Google Scholar]
  23. Forrester, D.I.; Bauhus, J.; Cowie, A.L. Carbon allocation in a mixed-species plantation of Eucalyptus globulus and Acacia mearnsii. For. Ecol. Manag. 2006, 233, 275–284. [Google Scholar] [CrossRef]
  24. He, Y.J.; Qin, L.; Li, Z.Y.; Liang, X.Y.; Shao, M.X.; Tan, L. Carbon storage capacity of monoculture and mixed-species plantations in subtropical China. For. Ecol. Manag. 2013, 295, 193–198. [Google Scholar] [CrossRef]
  25. Amazonasa, N.T.; Forrester, D.I.; Silva, C.C.; Almeida, D.R.A.; Rodrigues, R.R.; Brancalion, P.H.S. High diversity mixed plantations of Eucalyptus and native trees: An interface between production and restoration for the tropics. For. Ecol. Manag. 2018, 417, 247–256. [Google Scholar] [CrossRef]
  26. McCracken, A.R.; Dawson, W.M. Growing clonal mixtures of willow to reduce effect of Melampsora epitea var. epitea. Eur. J. For. Pathol. 1997, 27, 319–329. [Google Scholar] [CrossRef]
  27. Burdon, R.D. Genetic diversity and disease resistance: Some considerations for research, breeding, and deployment. Can. J. For. Res. 2001, 31, 596–606. [Google Scholar] [CrossRef]
  28. Rothe, A.; Binkley, D. Nutritional interactions in mixed species forests: A synthesis. Can. J. For. Res. 2001, 31, 1855–1870. [Google Scholar] [CrossRef]
  29. Piotto, D. A meta-analysis comparing tree growth in monocultures and mixed plantations. For. Ecol. Manag. 2008, 255, 781–786. [Google Scholar] [CrossRef]
  30. Binkley, D.; Stape, J.L.; Ryan, M.G. Thinking about efficiency of resource use in forests. For. Ecol. Manag. 2004, 193, 5–16. [Google Scholar] [CrossRef]
  31. Chomel, M.; DesRochers, A.; Baldy, V.; Larchevêque, M.; Gauquelin, T. Non-additive effects of mixing hybrid poplar and white spruce on aboveground and soil carbon storage in boreal plantations. For. Ecol. Manag. 2014, 328, 292–299. [Google Scholar] [CrossRef]
  32. Richards, A.E.; Forrester, D.I.; Bauhus, J.; Scherer-Lorenzen, M. The influence of mixed tree plantations on the nutrition of individual species: A review. Tree Physiol. 2010, 30, 1192–1208. [Google Scholar] [CrossRef] [Green Version]
  33. Wang, H.; Liu, S.R.; Schindlbacher, A.; Wang, J.X.; Yang, Y.J.; Song, Z.C.; You, Y.M.; Si, Z.M.; Chen, L.; Ming, A.G.; et al. Experimental warming reduced topsoil carbon content and increased soil bacterial diversity in a subtropical planted forest. Soil Biol. Biochem. 2019, 133, 155–164. [Google Scholar] [CrossRef]
  34. Meng, X.Y. Forest Mensuration; China Forestry Publishing House: Beijing, China, 1999. (In Chinese) [Google Scholar]
  35. Liu, F.; Jiang, Y.; Dai, L.; Huang, R.L.; Wei, L.X.; Wang, Y. Growth rhythm and fitting effect of six kinds of growth model of Castanopsis hystrix. Guangxi For. Sci. 2014, 43, 264–270. (In Chinese) [Google Scholar]
  36. Nelson, D.W.; Sommers, L.E. Total carbon, organic carbon and organic matter. In Methods of Soil Analysis: Part 2, Chemical and Microbiological Properties, 2nd ed.; Page, A.L., Miller, R.H., Keeney, D.R., Eds.; American Society of Agronomy: Madison, WI, USA, 1982; pp. 539–580. [Google Scholar]
  37. Wardle, D.A.; Bonner, K.I.; Nicholson, K.S. Biodiversity and plant litter: Experimental evidence which does not support the view that enhanced species richness improves ecosystem function. Oikos 1997, 79, 247–258. [Google Scholar] [CrossRef]
  38. Ming, A.G.; Liu, S.R.; Mo, H.H.; Cai, D.X.; Nong, Y.; Zeng, J.; Li, H.; Tao, Y. Comparison of carbon storage in pure and mixed stands of Castanopsis hystrix and Cunninghamia lanceolata in subtropical China. Acta Ecol. Sin. 2016, 36, 244–251. (In Chinese) [Google Scholar]
  39. Zhou, X.G.; Wen, Y.G.; Goodale, U.M.; Zuo, H.; Zhu, H.G.; Li, X.Q.; You, Y.M.; Yan, L.; Su, Y.; Huang, X.M. Optimal rotation length for carbon sequestration in Eucalyptus plantations in subtropical China. New For. 2017, 48, 609–627. [Google Scholar] [CrossRef]
  40. Kara, F.; Topaçoğlu, O. Influence of stand density and canopy structure on the germination and growth of Scots pine (Pinus sylvestris L.) seedlings. Environ. Monit. Assess. 2018, 190, 749. [Google Scholar] [CrossRef] [PubMed]
  41. Assenac, G. Interactions between forest stands and microclimate: Ecophysiological aspects and consequences for silviculture. Ann. Forest Sci. 2000, 57, 287–301. [Google Scholar] [CrossRef]
  42. Collet, C.; Lanter, O.; Pardos, M. Effects of canopy opening on height and diameter growth in naturally regenerated beech seedlings. Ann. For. Sci. 2001, 58, 127–134. [Google Scholar] [CrossRef] [Green Version]
  43. Pardos, M.; Montes, F.; Aranda, I.; Cañellas, I. Influence of environmental conditions on germinant survival and diversity of Scots pine (Pinus sylvestris L.) in central Spain. Eur. J. For. Res. 2007, 126, 37–47. [Google Scholar] [CrossRef]
  44. Grams, T.E.; Andersen, C. Competition for resources in trees: Physiological versus morphological plasticity. In Progress in Botany; Esser, K., Löttge, U., Beyschlag, W., Murata, J., Eds.; Springer: Berlin/Heidelberg, Germany, 2007; pp. 356–381. [Google Scholar]
  45. Bauhus, J.; Aubin, I.; Messier, C.; Connell, M. Composition, structure, light attenuation and nutrient content of the understorey vegetation in a Eucalyptus sieberi regrowth stand 6 years after thinning and fertilisation. For. Ecol. Manag. 2001, 144, 275–286. [Google Scholar] [CrossRef]
  46. Jandl, R.; Lindner, M.; Vesterdal, L.; Bauwens, B.; Baritz, R.; Hagedorn, F.; Johnson, D.W.; Minkkinen, K.; Byrne, K. How strongly can forest management influence soil carbon sequestration? Geoderma 2007, 137, 253–268. [Google Scholar] [CrossRef]
  47. Vandermeer, J. The Ecology of Intercropping; Cambridge University Press: Cambridge, UK, 1989. [Google Scholar]
  48. Liu, L.L.; King, J.S.; Giardina, C.P. Effects of elevated concentrations of atmospheric CO2 and tropospheric O3 on leaf litter production and chemistry in trembling aspen and paper birch communities. Tree Physiol. 2005, 25, 1511–1522. [Google Scholar] [CrossRef]
  49. Sayer, E.J.; Heard, M.S.; Grant, H.K.; Marthews, T.R.; Tanner, E.V.J. Soil carbon release enhanced by increased tropical forest litterfall. Nat. Clim. Change 2011, 1, 304–307. [Google Scholar] [CrossRef]
  50. Leff, J.W.; Wieder, W.R.; Taylor, P.G.; Townsend, A.R.; Nemergut, D.R.; Grandy, A.S.; Cleveland, C.C. Experimental litterfall manipulation drives large and rapid changes in soil carbon cycling in a wet tropical forest. Glob. Change Biol. 2012, 18, 2969–2979. [Google Scholar] [CrossRef] [PubMed]
  51. Xiang, Y.Z.; Li, Y.; Luo, X.Q.; Liu, Y.; Huang, P.; Bin, Y.B.; Zhang, L.Y.; Li, W.L.; Xue, J.M.; Gao, H.J.; et al. Mixed plantations enhance more soil organic carbon stocks than monocultures across China: Implication for optimizing afforestation/reforestation strategies. Sci. Total Environ. 2022, 821, 153449. [Google Scholar] [CrossRef] [PubMed]
  52. Benomar, L.; DesRochers, A.; Larocque, G.R. Comparing growth and fine root distribution in monocultures and mixed plantations of hybrid poplar and spruce. J. For. Res. 2013, 24, 247–254. [Google Scholar] [CrossRef]
  53. Wu, W.X.; Zhou, X.G.; Wen, Y.G.; Zhu, H.G.; You, Y.M.; Qin, Z.W.; Li, Y.C.; Huang, X.M.; Yan, L.; Li, X.Q. Coniferous-broadleaf mixture increases soil microbial biomass and functions accompanied by improved stand biomass and litter production in Subtropical China. Forests 2019, 10, 879. [Google Scholar] [CrossRef] [Green Version]
  54. Chen, H.Y.H.; Popadiouk, R.V. Dynamics of North American boreal mixedwoods. Environ. Rev. 2002, 10, 137–166. [Google Scholar] [CrossRef]
  55. Zhang, X.Q.; Kirschbaum, M.U.; Hou, Z.H.; Guo, Z.H. Carbon stock changes in successive rotations of Chinese fir (Cunninghamia lanceolata (lamb) hook) plantations. For. Ecol. Manag. 2004, 202, 131–147. [Google Scholar] [CrossRef]
  56. Jouquet, P.; Huchet, G.; Bottinelli, N.; Thu, T.D.; Duc, T.T. Does the influence of earthworms on water infiltration, nitrogen leaching and soil respiration depend on the initial soil bulk density? A mesocosm experiment with the endogeic species Metaphire posthuma. Biol. Fertil. Soils 2012, 48, 561–567. [Google Scholar] [CrossRef]
  57. Lu, L.H.; Jia, H.J.; He, R.M.; Li, J.L.; Qin, S.Y. A preliminary study on litter falls of six kinds of plantations in the tropical South Asia. For. Res. 2008, 21, 346–352. [Google Scholar]
  58. Bonanomi, G.; Incerti, G.; Antignani, V.; Capodilupo, M.; Mazzoleni, S. Decomposition and nutrient dynamics in mixed litter of Mediterranean species. Plant Soil. 2010, 331, 481–496. [Google Scholar] [CrossRef]
  59. Barantal, S.; Roy, J.; Fromin, N.; Schimann, H.; Hättenschwiler, S. Long-term presence of tree species but not chemical diversity affect litter mixture effects on decomposition in a neotropical rainforest. Oecologia 2011, 167, 241–252. [Google Scholar] [CrossRef] [PubMed]
  60. Guo, C.; Cornelissen, J.H.C.; Zhang, Q.Q.; Yan, E.R. Functional evenness of N-to-P ratios of evergreen-deciduous mixtures predicts positive non-additive effect on leaf litter decomposition. Plant Soil 2019, 436, 299–309. [Google Scholar] [CrossRef]
  61. Li, Q.; Zhao, G.Y.; Cao, G.M.; Zhang, X.X.; Liu, Z.W. Non-additive effects of leaf litter mixtures from Robinia pseudoacacia and ten tree species on soil properties. J. Sustain. For. 2020, 39, 1–14. [Google Scholar] [CrossRef]
  62. MacPherson, D.M.; Lieffers, V.J.; Blenis, P.V. Productivity of aspen stands with and without a spruce understory in Alberta’s boreal mixedwood forests. For. Chronicle. 2001, 77, 351–356. [Google Scholar] [CrossRef] [Green Version]
  63. Martin, J.L.; Gower, S.T.; Plaut, J.; Holmes, B. Carbon pools in a boreal mixedwood logging chronosequence. Glob. Change Biol. 2005, 11, 1883–1894. [Google Scholar] [CrossRef]
Figure 1. A schematic plot of study area and experimental design. PEU, PCH, and MEC indicate pure Eucalyptus plantation, pure C. hystrix plantation, and mixed Eucalyptus and C. hystrix plantation, respectively. Numbers following the abbreviations of the plantations indicate replications.
Forests 13 00733 g001
Figure 2. Carbon storage in stem, bark, branch, leaf, and root parts of the tree layer in the different plantations (mean ± SE, n = 5). Different letters indicate significant differences (one-way ANOVA, p < 0.05, least square difference analysis) among different plantations.
Forests 13 00733 g002
Figure 3. Amounts of carbon stored by trees, understory, litter (above the X-axis), and soil (below the X-axis) in the three plantation types. Numbers in the bars indicate the mean value (n = 5). Different letters indicate significant differences (ANOVA, p < 0.05, least square difference analysis) among different plantations. TCS, tree carbon storage; UCS, understory carbon storage; FLCS, floor litter carbon storage; SOCS, soil organic carbon storage.
Forests 13 00733 g003
Figure 4. Non-additive effects of the mixed plantation on carbon storage (mean ± SE, n = 5) in various vegetation compartments and soil horizons. NAE values that differed significantly from zero, according to one-sample Student’s t-tests, are indicated by * (p < 0.05), ** (p < 0.01), or *** (p < 0.001); ‘ns’, non-significant. SCS, stem carbon storage; BaCS, bark carbon storage; BrCS, branch carbon storage; LCS, leaf carbon storage; RCS, root carbon storage; TCS, tree carbon storage; UCS, understory carbon storage; FLCS, floor litter carbon storage; SOCS, soil organic carbon storage; ECS, ecosystem carbon storage.
Forests 13 00733 g004
Table 1. Abbreviations, full name and unit of plantation types, soil properties, soil microbial community, tree characteristics, and carbon storage.
ComponentAbbreviationFull NameUnit
Plantation typePEUpure Eucalyptus plantation
PCHpure C. hystrix plantation
MECmixed Eucalyptus and C. hystrix plantation
Soil propertySBDsoil bulk densityg cm−3
SWCsoil water content%
SOCsoil organic carbon g kg−1
TNsoil total nitrogeng kg−1
TPsoil total phosphorusg kg−1
ANsoil available nitrogenmg kg−1
APsoil available phosphorusmg kg−1
AKsoil available potassiummg kg−1
DOCsoil dissolved organic carbonmg kg−1
DONsoil dissolved organic nitrogenmg kg−1
Tree characteristicDBHdiameter at breast heightcm
Htree height m
Carbon storageSCSstem carbon storageMg ha−1
BaCSbark carbon storageMg ha1
BrCSbranch carbon storageMg ha1
LCSleaf carbon storageMg ha1
RCSroot carbon storageMg ha1
TCStree carbon storageMg ha1
UCSunderstory carbon storageMg ha1
FLCSfloor litter carbon storageMg ha1
SOCSsoil organic carbon storageMg ha1
ECSecosystem carbon storageMg ha1
Table 2. Background data of topographic features, soil properties, and microbial community phospholipid fatty acids (PLFAs), in the 0–10 cm depth layer in different plantations. Mean ± standard error (n = 5). F-values are results of one-way ANOVA. See Table 1 for the abbreviations of soil properties.
ContentFactorPEUPCHMECF(4,12)p
Topographic featuresLongitude22°10′4.62″ N22°9′59.7″ N22°9′46.8″ N
Latitude106°41′39.8″ E106°41′41.7″ E106°41′48.5″ E
Elevation (m)253242257
Slope aspectNorthwestNorthNorthwest
Slope gradient (°)192020
Soil propertiesSoil typeLatosolLatosolLatosol
pH4.50 ± 0.174.47 ± 0.114.51 ± 0.090.190.831
SBD (g cm−3)1.21 ± 0.021.19 ± 0.061.19 ± 0.010.930.422
SWC (%)32.16 ± 3.5232.93 ± 3.0732.83 ± 3.120.290.756
SOC (g kg−1)21.57 ± 1.4222.03 ± 2.5421.96 ± 1.781.990.179
TN (g kg−1)1.23 ± 0.151.24 ± 0.081.25 ± 0.050.760.490
TP (g kg−1)0.36 ± 0.080.34 ± 0.110.35 ± 0.073.330.071
AN (mg kg−1)15.27 ± 1.2314.90 ± 1.1414.64 ± 1.251.480.266
AP (mg kg−1)35.62 ± 3.5337.23 ± 3.3636.52 ± 3.880.470.636
AK (mg kg−1)64.18 ± 6.5563.78 ± 5.2164.93 ± 3.421.860.197
DOC (mg kg−1)348.56 ± 15.24340.21 ± 13.53342.35 ± 11.620.900.431
DON (mg kg−1)42.48 ± 3.0444.65 ± 3.1943.16 ± 2.111.770.212
Microbial community PLFAsTotal PLFAs (nmol g−1)50.42 ± 3.8651.65 ± 3.2150.89 ± 3.342.750.104
Bacteria PLFAs (nmol g−1)39.25 ± 2.7140.16 ± 2.6338.87 ± 2.852.660.110
Fungal PLFAs (nmol g−1)3.62 ± 0.254.05 ± 0.323.75 ± 0.334.230.041
Table 3. Allometric equations used to calculate the biomass of the different tree components.
PlantationSpeciesComponentAllometric EquationCorrelation Coefficient
(R)
F-Value
PEUEucalyptusStemW = 0.03040 × (DBH2H)0.93200.968709.10 **
BarkW = 0.00503 × (DBH2H)0.88870.961577.04 **
BranchesW = 0.00196 × (DBH2H)0.98360.826102.78 **
LeavesW = 0.000223 × (DBH2H)1.16270.76768.73 **
RootsW = 0.00445 × (DBH2H)1.00690.951452.86 **
PCHC. hystrixStemW = 0.04350 × (DBH2H)0.88860.9961767.57 **
BarkW = 0.01005 × (DBH2H)0.81020.986526.73 **
BranchesW = 0.02211 × (DBH2H)0.83330.958168.53 **
LeavesW = 0.14336 × (DBH2H)0.44790.89459.97 **
RootsW = 0.03544 × (DBH2H)0.77680.977316.78 **
MECEucalyptusStemW = 0.02529 × (DBH2H)0.95760.960624.13 **
BarkW = 0.00950 × (DBH2H)0.80790.953522.27 **
BranchesW = 0.00350 × (DBH2H)0.91670.871166.05 **
LeavesW = 0.00292 × (DBH2H)0.83820.65439.59 **
RootsW = 0.00877 × (DBH2H)0.92190.947456.27 **
C. hystrixStemW = 0.05568 × (DBH2H)0.86180.979233.62 **
BarkW = 0.00606 × (DBH2H)0.86070.978217.75 **
BranchesW = 0.12859 × (DBH2H)0.64340.86930.89 **
LeavesW = 0.01528 × (DBH2H)0.88170.87325.63 **
RootsW = 0.05587 × (DBH2H)0.72770.94684.99 **
For PEU, n = 50; for PCH, n = 17; for MEC: eucalypt, n = 55 and C. hystrix, n = 12. ** p < 0.01.
Table 4. Tree height, diameter at breast height (DBH), volume, and biomass of eucalypt trees and Castanopsis hystrix growing in mono-specific and mixed-plantation types.
FactorEucalyptusC. hystrix
PEUMECPCHMEC
Tree height (m)19.52 ± 0.1520.99 ± 0.20 **9.93 ± 0.1311.69 ± 0.23 **
DBH (cm)13.62 ± 0.1614.58 ± 0.17 **7.89 ± 0.159.81 ± 0.23 **
Volume (m3 tree−1)0.142 ± 0.0040.170 ± 0.005 **0.031 ± 0.0020.050 ± 0.003 **
Biomass (kg tree−1)104.62 ± 2.65125.75 ± 3.46 **31.75 ± 1.3359.07 ± 2.80 **
Values shown are the mean ± standard error (n = 5). The ** indicates a significant difference between the same species in the mono-specific and mixed plantation types (p < 0.01; two-sample t-test).
Table 5. Carbon content (%) in different components of Eucalyptus and Castanopsis hystrix trees in different plantation types.
ComponentEucalyptusC. hystrix
PEUMECPCHMEC
Stem47.06 ± 2.5851.12 ± 1.18 ns50.92 ± 0.7450.84 ± 1.22 ns
Bark38.39 ± 2.3444.07 ± 1.90 ns48.56 ± 0.6147.54 ± 0.70 ns
Branch44.15 ± 1.6248.46 ± 1.34 ns51.41 ± 0.2950.49 ± 1.76 ns
Leaf48.53 ± 2.2651.36 ± 2.53 ns49.96 ± 0.4246.03 ± 2.48 ns
Root44.12 ± 1.4348.11 ± 1.11 ns48.11 ± 0.7649.35 ± 2.20 ns
Values shown are the mean ± standard error (n = 5). The ‘ns’ indicates no significant difference detected between the same species in mono-specific and mixed plantation types (p > 0.05; two-sample t-test).
Table 6. Carbon content (%) in the understory vegetation, litter, and soil layers.
LayerComponentPEUPCHMECF(2,12)p
UnderstoryAboveground42.29 ± 0.30 b46.54 ± 0.30 a46.83 ± 0.37 a61.290.000
Belowground37.62 ± 0.45 b44.15 ± 0.91 a43.04 ± 0.39 a30.850.000
Litter 37.63 ± 1.93 b40.29 ± 2.32 b47.16 ± 1.07 a7.080.009
Soil0–20 cm2.00 ± 0.09 c3.40 ± 0.15 a2.70 ± 0.17 b25.950.000
20–40 cm0.75 ± 0.09 b1.89 ± 0.14 a1.58 ± 0.11 a26.950.000
40–60 cm0.66 ± 0.06 b1.21 ± 0.20 a1.39 ± 0.17 a6.020.015
60–80 cm0.30 ± 0.08 b0.90 ± 0.12 a1.17 ± 0.16 a13.330.001
80–100 cm0.47 ± 0.06 b1.19 ± 0.35 a1.10 ± 0.10 a3.420.067
Mean0.83 ± 0.01 b1.72 ± 0.20 a1.59 ± 0.13 a31.640.000
Values shown are the mean ± standard error (n = 5). Different letters indicate significant differences (one-way ANOVA, p < 0.05, least square difference analysis) among different plantations.
Publisher’s Note: MDPI stays neutral with regard to jurisdictional claims in published maps and institutional affiliations.

