Article

Effects of Forest Fragmentation on the Volume of Wood Resources in Managed, Pine-Dominated Forests in Poland

1
Department of Forest Resources Management, Forest Research Institute, Sękocin Stary, Ul. Braci Leśnej 3, 05-090 Raszyn, Poland
2
Department of Forest Resources Management, Faculty of Forestry, University of Agriculture in Krakow, Al. 29 Listopada 46, 31-425 Krakow, Poland
*
Author to whom correspondence should be addressed.
Forests 2022, 13(4), 590; https://doi.org/10.3390/f13040590
Submission received: 17 February 2022 / Revised: 4 April 2022 / Accepted: 5 April 2022 / Published: 8 April 2022

Abstract

:
Forest fragmentation is a widespread phenomenon that directly or indirectly affects the processes that take place both in forest ecosystems and in their immediate surroundings. So far, many studies confirm its negative effects, especially on biodiversity. On the other hand, there are few studies that address the effects of forest fragmentation on the amount of accumulated biomass or carbon, as well as on the characteristics of wood resources in managed forests. Therefore, issues related to timber production, which are important from the point of view of multifunctional forest management, are omitted. The aim of our research was to add to the knowledge in this area. In particular, we focused on assessing the impact of forest fragmentation on wood resources based on an analysis of edge effects in forest patches (units formed by combining forest fragments characterized by structural connectivity). Vector data describing the topography of forest fragments in Poland and the results of the National Forest Inventory (NFI) from 2015–2019 were used as material for solving this problem. The results of our research showed that the effects of fragmentation on managed pine stands depend on the age of the stand and the fertility of the habitat. In young stands growing on barren or strongly barren habitats, growing stock volume turned out to be significantly higher in the edge zone. In older stands, especially on moderately fertile habitats, significantly higher resources were found in the interior zone of forest patches. Habitat quality also had a significant effect on the amount of carbon accumulated. In strongly barren habitats, higher carbon mass was found in edge zones, while in moderately fertile habitats, stands had higher carbon volume in the interior zone. Our results illustrate that forest fragmentation is a very complex process that can increase or reduce wood resources, depending on the age of the stand and the quality of the habitat. From the standpoint of measurable benefits, it was concluded that protection from the negative effects of fragmentation should focus primarily on older stands and more fertile habitats.

1. Introduction

Forest fragmentation is a very complex phenomenon that leads to isolation and loss of natural habitats [1]. As a result, continuous forest areas are transformed into a larger number of smaller and isolated fragments that differ in composition or structure from the original community [2]. The causes of forest fragmentation can vary and are not only due to human activities [3], but also to natural processes [4]. In both cases, fragmentation is considered a serious threat to forest areas. It not only leads to the loss of forest habitats, but can also change the structure and functions of the remaining areas [5,6,7,8]. Although it is not easy to draw general conclusions about the effects of forest fragmentation, scientists and forest managers agree on the need to quantify it and to incorporate this information into forest management plans [9]. In this way, the right relationship between human activities, forest characteristics and ecological processes could be established in the long term. In this context, studies describing the extent to which fragmentation, treated as an anthropogenic disturbance, affects the diversity and dendrometric characteristics of woody species are important. There is also a lack of knowledge about the effects of forest fragmentation on ecological processes in dynamic forest mosaics, at larger spatial scales, and in more diverse landscapes. From this perspective, forest fragmentation, although often driven by local factors, causes most of the problems for forest management.
The objective of our research was to evaluate the effects of forest fragmentation on the temporal and spatial variability of wood resources in temperate managed forests. Previous works in this field, although extensive, consider this problem from a rather narrow perspective. Mostly, they were limited to assessing changes in forest fragmentation over time using different methods and technologies [10,11,12]. However, they rarely included results that relate the degree of forest fragmentation to the volume and structure of wood resources [13]. Therefore, the evaluation of scientific achievements in relation to the chosen research topic is very difficult. Among the published studies, there are many works that analyze the variability of wood resources in fragmented forest areas in an indirect way. These mainly include studies on evaluating the impact of the edge effect on the structure of wood resources in different types of stands [14,15,16]. In addition, much work has been done in recent years on the effects of fragmentation on carbon or living biomass stocks in tropical regions [8,17,18,19,20,21,22] as well as on relationships with greenhouse gas emissions [23].

1.1. The Size of the Forest Area and Fragmentation

Forest fragmentation is usually understood as the simultaneous loss of forest habitat and increase in forest edges, and the division of large continuous forest into smaller and isolated fragments [24]. Although many research papers cite examples in which forest area loss has led to an increase in fragmentation, this should not be associated exclusively with forest area loss [1]. Forest fragmentation can occur both when habitat is lost [25] and when forest cover remains the same or increases [26]. As an example, the most common afforestation on post-agricultural land in recent decades is given in [27]. These afforestations have contributed not only to an increase in forest cover, but also to the creation of many new forest fragments of different sizes and shapes, often isolated from each other in patchy agricultural landscapes [27]. Thus, forest fragmentation can be the result of both the division of large continuous forest areas and deforestation, as well as afforestation in the midst of non-forest areas [1]. Although increasing fragmentation is usually accompanied by a decrease in forest cover, the identification of its root cause is very important, especially when studying the diversity of forest communities, which may result not only from the loss of forest areas but also from their isolation [28].

1.2. Forest Connectivity and Forest Patches

Fragmentation is characterized not only by the loss of habitats, but also by a change in their configuration [29], which means a different number of fragments or relative isolation between them. The ecological consequences of fragmentation may therefore vary according to the patterns of spatial configuration of forest fragments, which determines the temporal and spatial continuity of ecological processes [30]. Therefore, understanding the relationship between landscape patterns and habitat connectivity or fragmentation is extremely important for forest managers to provide them with the fundamental knowledge to formulate land use and conservation decisions.
In regional studies, landscape structure and habitat connectivity are usually characterized by various indicators or software [10,31,32,33,34] that include specially designed applications with relatively simple aggregation mechanisms based on structural connectivity (size, shape, distance, isolation, etc.). Much less commonly, the attribute of functional connectivity is used for a comprehensive assessment of habitat connections. It requires an assessment of the specific connectivity between landscape features or habitat patches, as determined by land cover patterns, spatial distribution of infrastructure such as roads [35] and many other factors. Matrix characteristics are an important factor affecting forest species composition, especially in small forest patches [36]. Landscape analyses that consider the functional connectivity of forest patches are therefore a much more complex issue and are highly dependent on the matrix [35]. For this reason, methods based on structural connectivity can be used much more frequently both in studying the effects of fragmentation and in managing fragmented forest areas. This indicator is much simpler and requires a much smaller amount of data [37]. It only requires the establishment of certain distance thresholds that would determine the connectivity or isolation of fragments. Currently, the choice of these thresholds is often arbitrary, and the assessment of continuity depends largely on the aspect being studied [35].

1.3. Edge Effect

Although the effects of forest fragmentation take many forms, one of the fundamental mechanisms by which it can alter forest landscape functions is the edge effect [1,38,39,40]. Conditions near the forest edge, such as tree exposure to dry and windy air and higher light intensity, result in different species composition, tree mortality, and ecosystem processes near the forest edge than in the forest interior [14,15,30]. It also has a significant impact on the populations of flora [4,39,41,42,43] and fauna [44,45,46]. It is emphasized that the magnitude of the edge effect is closely related to the size of the forest patch [47]. This means that most edge habitats contain proportionally small forest fragments [48]. Statistical data show that in 2015, nearly 20% of the world’s forests were within 100 m of the forest edge [39]. At the same time, in countries with small forest cover, the impact of the edge effect on forests was much stronger. In the European Union, where almost 33% of the land area is forested, the proportion of forests in the edge zone (100 m wide) was almost 40% [37]. In England, where forest cover was about 10%, as much as 74% of the forested land was within 100 m of the edge [49]. However, the effects of the edge effect on the forest patch can vary greatly depending on the characteristics of the surrounding matrix [41]. It should also be considered that the edge zones of forests are constantly changing, not only under the influence of natural factors but also as a result of a different management mode [39].
Spatial attributes of forest patches, such as size, shape, and type of matrix, have a significant influence on the range of the edge effect. Based on a review of 146 articles, the median range of the edge effect was found to be 100 m for forest structure, 300 m for tree mortality, 60 m for forest microclimate, and 80 m for biodiversity, giving an overall average range of about 100 m [38]. Other studies have found that the magnitude of the edge effect averages less than 50 m for structure, about 100 m for tree mortality [50], up to 50 m for moisture [51], up to 60 m for microclimate, and at least 20 m for stand structure [41]. Some studies indicate that there is no dependence between the microclimatic conditions prevailing in the forest and the distance from its edge [52].
Despite numerous studies on the forest edge effect [22,39,40,41,42,43,44,52,53,54], relatively few of them have analyzed its impact on the volume of wood resources in managed temperate forests. Most studies focused primarily on assessing the impact of the edge effect on structural and species diversity, mainly due to a different microclimate, management method or tree community composition than inside the stand [39]. Few studies conducted in Europe are directly related to the size and structure of wood resources. Among others, it has been shown that steam density decreases and canopy height increases with distance from the edge to the interior [39]. It was also found that due to the higher steam density near the edge and the lack of significant differences between the average diameter at breast height of trees growing at different distances from the edge, the basal area decreases in the direction from the edge to the interior [39]. Other studies, however, conducted in a different climate zone, indicated that the basal area of canopy trees does not differ near the edge and in the interior [40]. The edge effect also had no significant effect on basal area in dry forests in central Brazil [55].

1.4. Wood Resources and Carbon Accumulation in Biomass

The synergy between forest patch size and the edge effect means that forest fragmentation affects not only the structure of forest stands, but also the resources accumulated within them. In particular, the greater availability of sunlight and more intense wind action favor the development of light-tolerant and fewer wind-sensitive species, which means that fragmentation contributes to the loss of aboveground biomass and the increase in carbon emissions in most cases [8,17,18,19,56,57]. It can also lead to an increase in soil organic carbon [20]. In tropical forests, aboveground carbon density in the first 100 m from the forest edge is about 22% lower than in the forest interior [22]. The lower carbon resources found near the forest edge are the result of deterioration in the structural parameters of forest stands, which include lower height and diameter or steam density [8] and leaf biomass [22]. As the stand ages, differences in carbon stocks between the edge and interior of the forest tend to be greater [22]. Some studies suggest that the amount of carbon (per 1 ha) accumulated in small patches is generally not significantly different from that in large, continuous forests [21].

1.5. Management of Forests in Poland

Most forests in Poland are managed forests where trees are cut. Logging has a significant impact on forest stand development, both at forest edges and in the interior. Some studies suggest that human activities such as logging and clearing are more common in small patches of forest areas with a higher proportion of edges [6]. These patches are characterized by a more frequent occurrence of pioneer species, which grow more intensively in fragmented and irregular forest areas, dynamically changing the structure of the forest and protecting it from the negative influence of the matrix [3].
In Poland, large continuous patches are owned by the state, while small areas are more often owned by private owners [58]. With a larger forest patch area, the proportion of pine in the species composition also increases [58]. Thus, the spatial structure of forests in Poland is closely related to the form of ownership of forest land and the species composition of forest stands. This means that the impact of forest fragmentation on the volume of wood resources mainly affects private owners, who often manage small and scattered forest patches. In state-owned forests, forest management usually occurs in large patches. Despite the significant proportion of private forests [59], the current system of their management is not conducive to counteracting the effects of their fragmentation. The dispersion of private forest fragments limits the possibility of forming land communities that could carry out unified forest management within larger spatial units.
It is also worth mentioning that in Poland, forest management practices depend mainly on the dominant tree species in the stand and the type of forest site. This means that stands with similar species composition and on similar habitats are managed according to uniform rules.

1.6. Aim of Study

The aim of the study was to determine the influence of forest patch areas on the size and structure of wood resources of managed forests in a temperate zone. In analyzing the problem, we assumed that the effects of fragmentation are considered part of a broader approach to assessing habitat availability based on the division of forest land into forest patches. Therefore, patches were considered basic units for formulating forest planning and management decisions at the regional scale. This includes structurally connected forest fragments that are treated as a unified space integrating habitats within a similar management framework.
Forest fragmentation is often associated with edge effects. Therefore, we hypothesize that in the case of forest patches consisting of structurally connected forest fragments, fragmentation effects are mainly determined by the edge effect. Assuming that the edge effect is a function of the relative area of the forest patch and its width is a constant value, we assumed that we could extrapolate our results. Thus, the hypothesis is that wood resources will change with forest patch size and the total number of edge habitats.

2. Materials and Methods

2.1. Object of Study and Material

Forests in Poland occupied 29.6% of the country’s area in 2020 [59]. Most of them were coniferous forests (68.2% of the total forest area), with pine Pinus sylvestris L. dominating in species composition (58% of the total forest area). In the mid-1980s, it was estimated that there were about 26,000 forest patches in the state forests of Poland alone, which covered about 7 million ha [60]. In 2006, about 50% of the forest area was considered fragmented by agricultural land or other artificial land [37]. In 2020, there were 338,682 forest patches in Poland, of which only 37,443 (about 11%) had an area greater than 5 ha. However, the percentage of large forest patches (≥500 ha) was very high and amounted to about 85% of the total forest area in Poland [61].
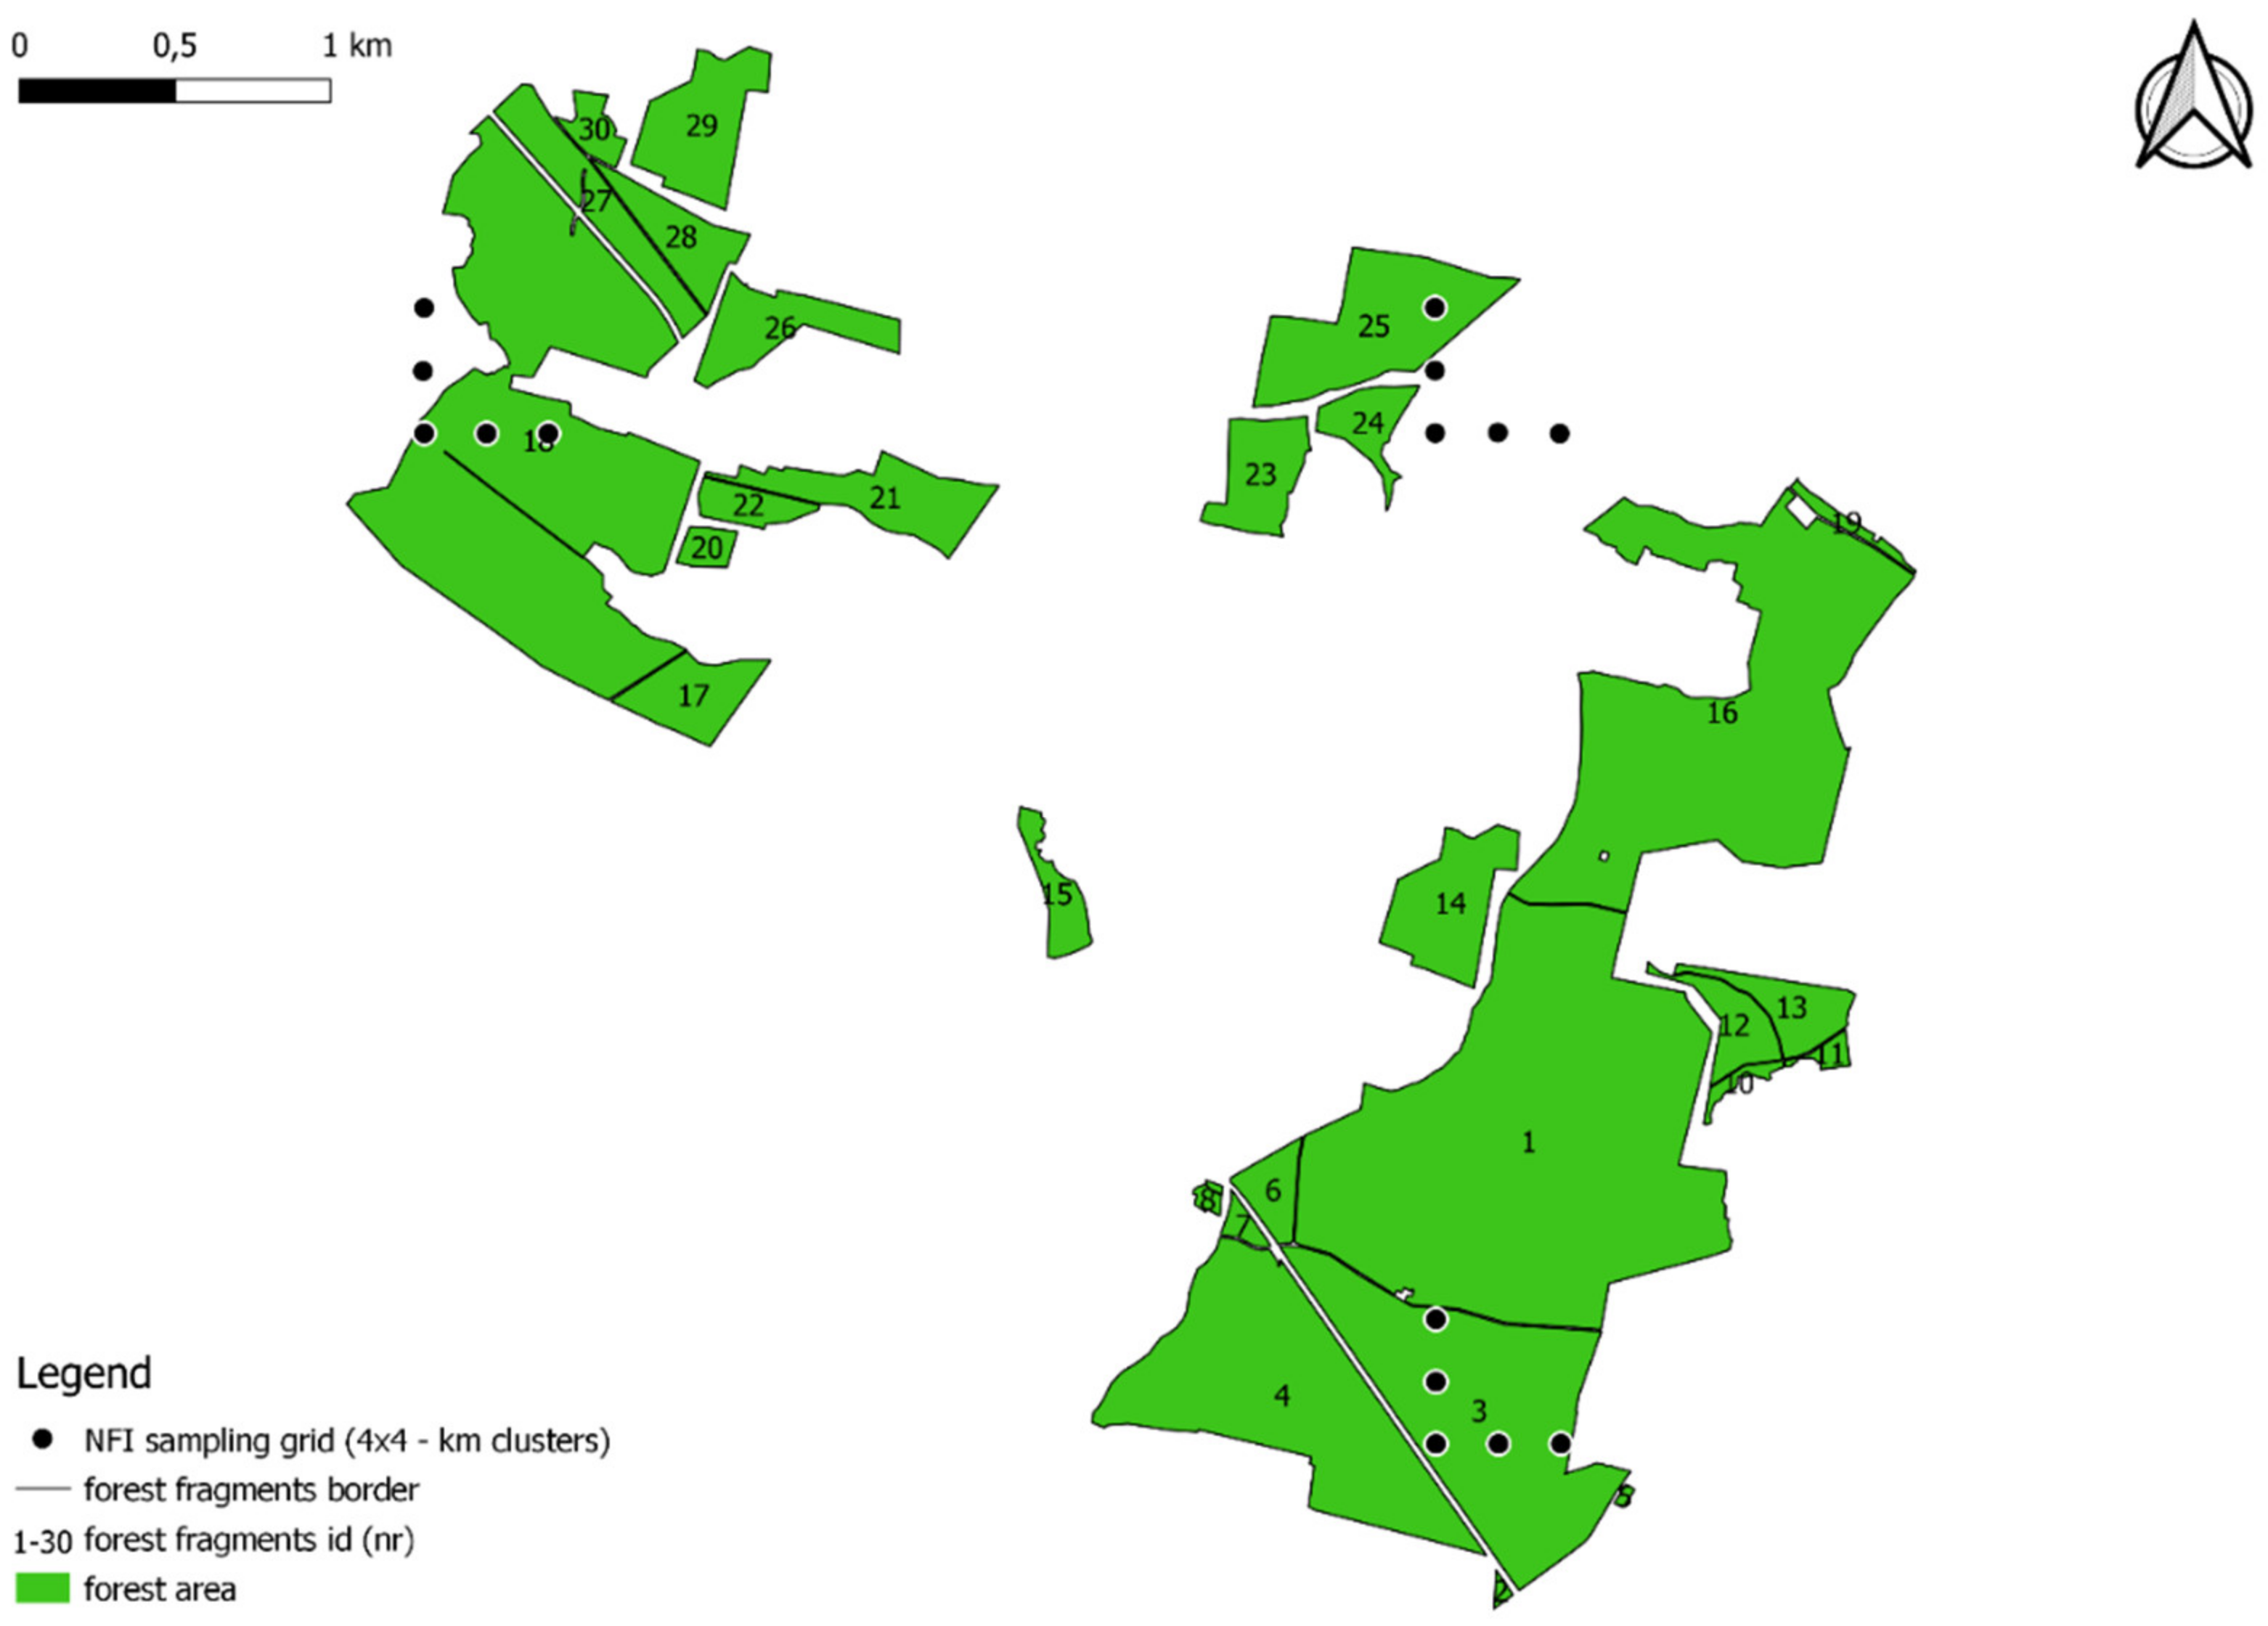
The research material consisted of data from field measurements of trees describing the condition of forests and data describing topographic objects in the country. The field data came from measurements made on National Forest Inventory (NFI) sample plots. The NFI system in Poland is a grid of sample plots grouped into clusters. The clusters are located in a 4 × 4 km grid. Each cluster has the shape of an L letter and consists of 5 permanent circular sample plots separated by a distance of 200 m (Figure 1). According to the methodological assumptions, all living trees with a diameter at breast height of 70 mm or more are measured at regular intervals (5-year cycle) in each sample plot (constant area of 0.04 ha). Diameter at breast height is measured with an accuracy of 1 mm, and tree height is measured up to 1 dcm [62].
Data from field measurements conducted during the third NFI cycle (years 2015–2019) were used for the analysis. Since the vast majority of forests in Poland are managed forests, areas under strict nature conservation were excluded from the analysis. Uniformly managed stands were selected as study material. Only NFI sample plots with tree canopy (stands) were considered. Plots without trees, e.g., temporarily unstocked due to clear-cutting as part of forest management, or those that were located along forest roads, were not included. Due to the small number, plots established in uneven-aged stands were also excluded from the analyses. To ensure homogeneity of the sample, plots established in the range of border between forest habitats that differed in fertility, humidity, species composition, age, vertical structure, or land use practices (management) were also excluded from the analyses. Based on these assumptions, of the total number of 35,342 plots listed in the 3rd cycle NFI database, the results of 20,381 plots were used for further analysis.
The Topographic Objects Database (TOD) was used to delineate forest patches. TOD is a vector database that contains the spatial location of topographic objects with their basic characteristics. Vector data representing 764,850 polygons described as forest fragments were used for the study.

2.2. Spatial Analysis and Database Analysis

The analytical work began with the integration of the NFI and TOD databases. The integration procedure consisted of three stages. In the first stage, the TOD vector data describing the forest fragments (Figure 1) were generalized using QGIS software [63]. The goal was to connect small polygons (forest fragments) into larger units (forest patches) based on structural connectivity. Forest patches were assumed to form adjacent forest fragments if the Euclidean distance between their boundaries was equal to or less than 50 m in at least one point. There are several reasons why we chose the criterion of 50 m. In the study by Ranta et al. [25], the distance indicating isolation between forest fragments was not less than 50 m. This distance as a threshold for isolation is also confirmed by other authors [64] who conducted their study in Poland. Such distance takes into account the assumptions for planned cuttings in managed forests that the clearcut area should be protected by the adjacent wall of a mature stand [53]. Foresters have often applied a “rule of thumb” that the range of protection provided by a mature stand is equal to one tree’s height [53]. Since the average height of mature stands in Poland is in the range of 25–35 m, the use of a distance of 50 m as a criterion for isolating patches seems to be correct (2 × 25 m, as the mutual distance between two forest fragments is analyzed). The last reason was that 50 m is the minimum width for expressways set by Polish law. The noise level and fences erected along such roads makes a significant barrier from this type of infrastructure. The minimum area of the forest patch was set at 0.01 hectares. As a result of spatial analyses, 764,850 forest fragments were combined into 401,045 forest patches. Among them, the largest forest patch had an area of 1377.5 thousand ha.
In the next phase, edge zones were distinguished in each forest patch. It was decided that the edge zone forms a 50 m wide strip of forest land extending from the boundary of the forest patch towards its interior. Such edge zone width value was chosen because, according to the literature studied [14,38,41,50,51,65,
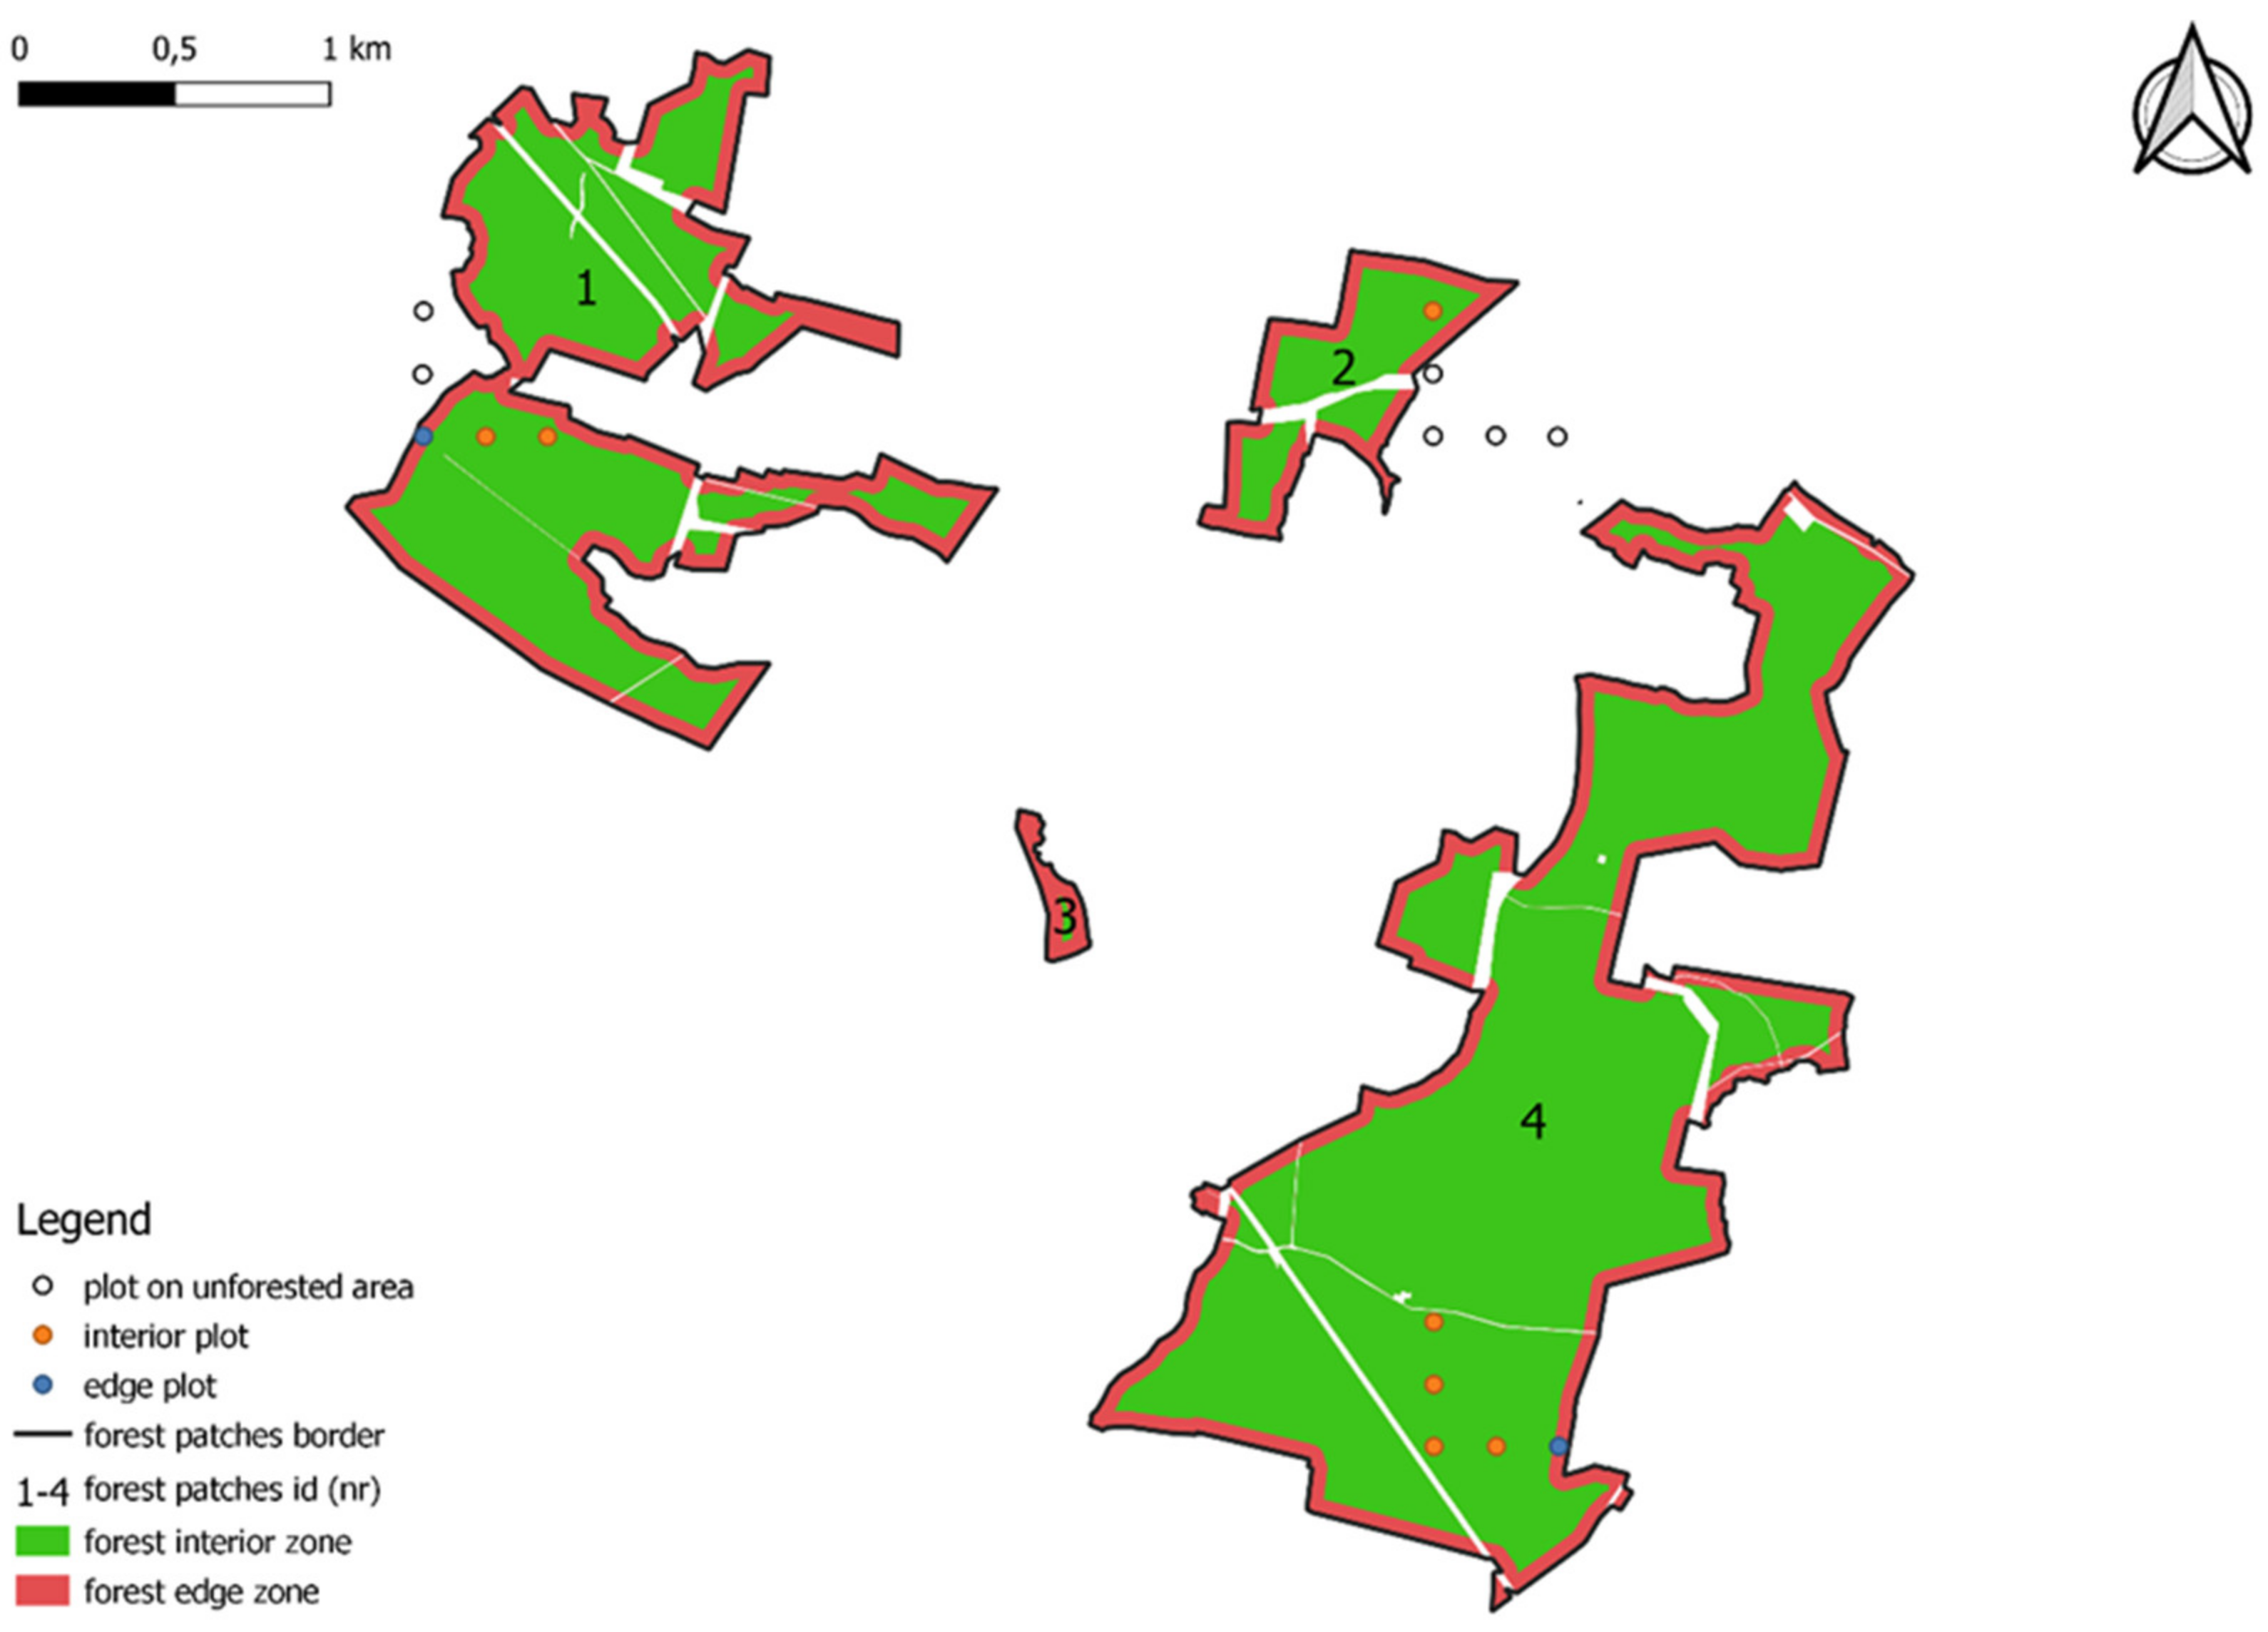
66], stands located up to 50 m from the forest margin usually are characterized by different structural parameters and microclimate conditions caused by edge effect. Only edge zones adjacent to the “open area” (matrix) were included in the study (Figure 2). The “buffer” tool in QGIS was used to determine these zones [63]. As a result of the spatial analyses along the boundaries of the forest patches and within the area of the forest fragments, an internal buffer of 50 m was determined. Then, the area of forest edge habitats and their percentage of the forest patch were calculated.
In the third phase, NFI plots were assigned to forest patches based on geographic coordinates, taking into account location: interior or edge zone (Figure 2). As a result, 17,321 interior plots and 3060 edge plots were identified.
All tested plots (20,381) were distributed within 2906 forest patches.
To evaluate the volume of the wood resources, some criteria were established to filter sample plots. Only plots that were in a stand with a vertical structure of one, two or three canopy layers were used. Sample plots with residual trees, i.e., trees left over from the previous generation of the stand that have been left to die naturally, were omitted. All analyses of the volume and structure of wood resources in the interior and the edge zones of forest patches were the same and were performed for homogeneous computational units based on the grouping of plots in terms of:
  • Species composition—Plots were assigned the name of the dominant species (species with the highest growing stock volume on the plot);
  • Stand age—Each plot was assigned an age class number, determined by the age of the dominant species. The following age class rules were adopted: the age of the dominant species 1–10 years, 1 age class; the age of the dominant species 11–20 years, 2 age class, etc.;
  • Fertility and humidity of the habitat, based on the forest site type.
In this way, homogeneous computational units in terms of management, species composition, age, and habitat conditions were obtained. To ensure the reliability of the obtained results, only the computational units consisting of at least 100 sample plots were selected for further statistical analysis. Based on this procedure, 30 computational units described by a total of 9551 plots were distinguished from 20,381 plots.
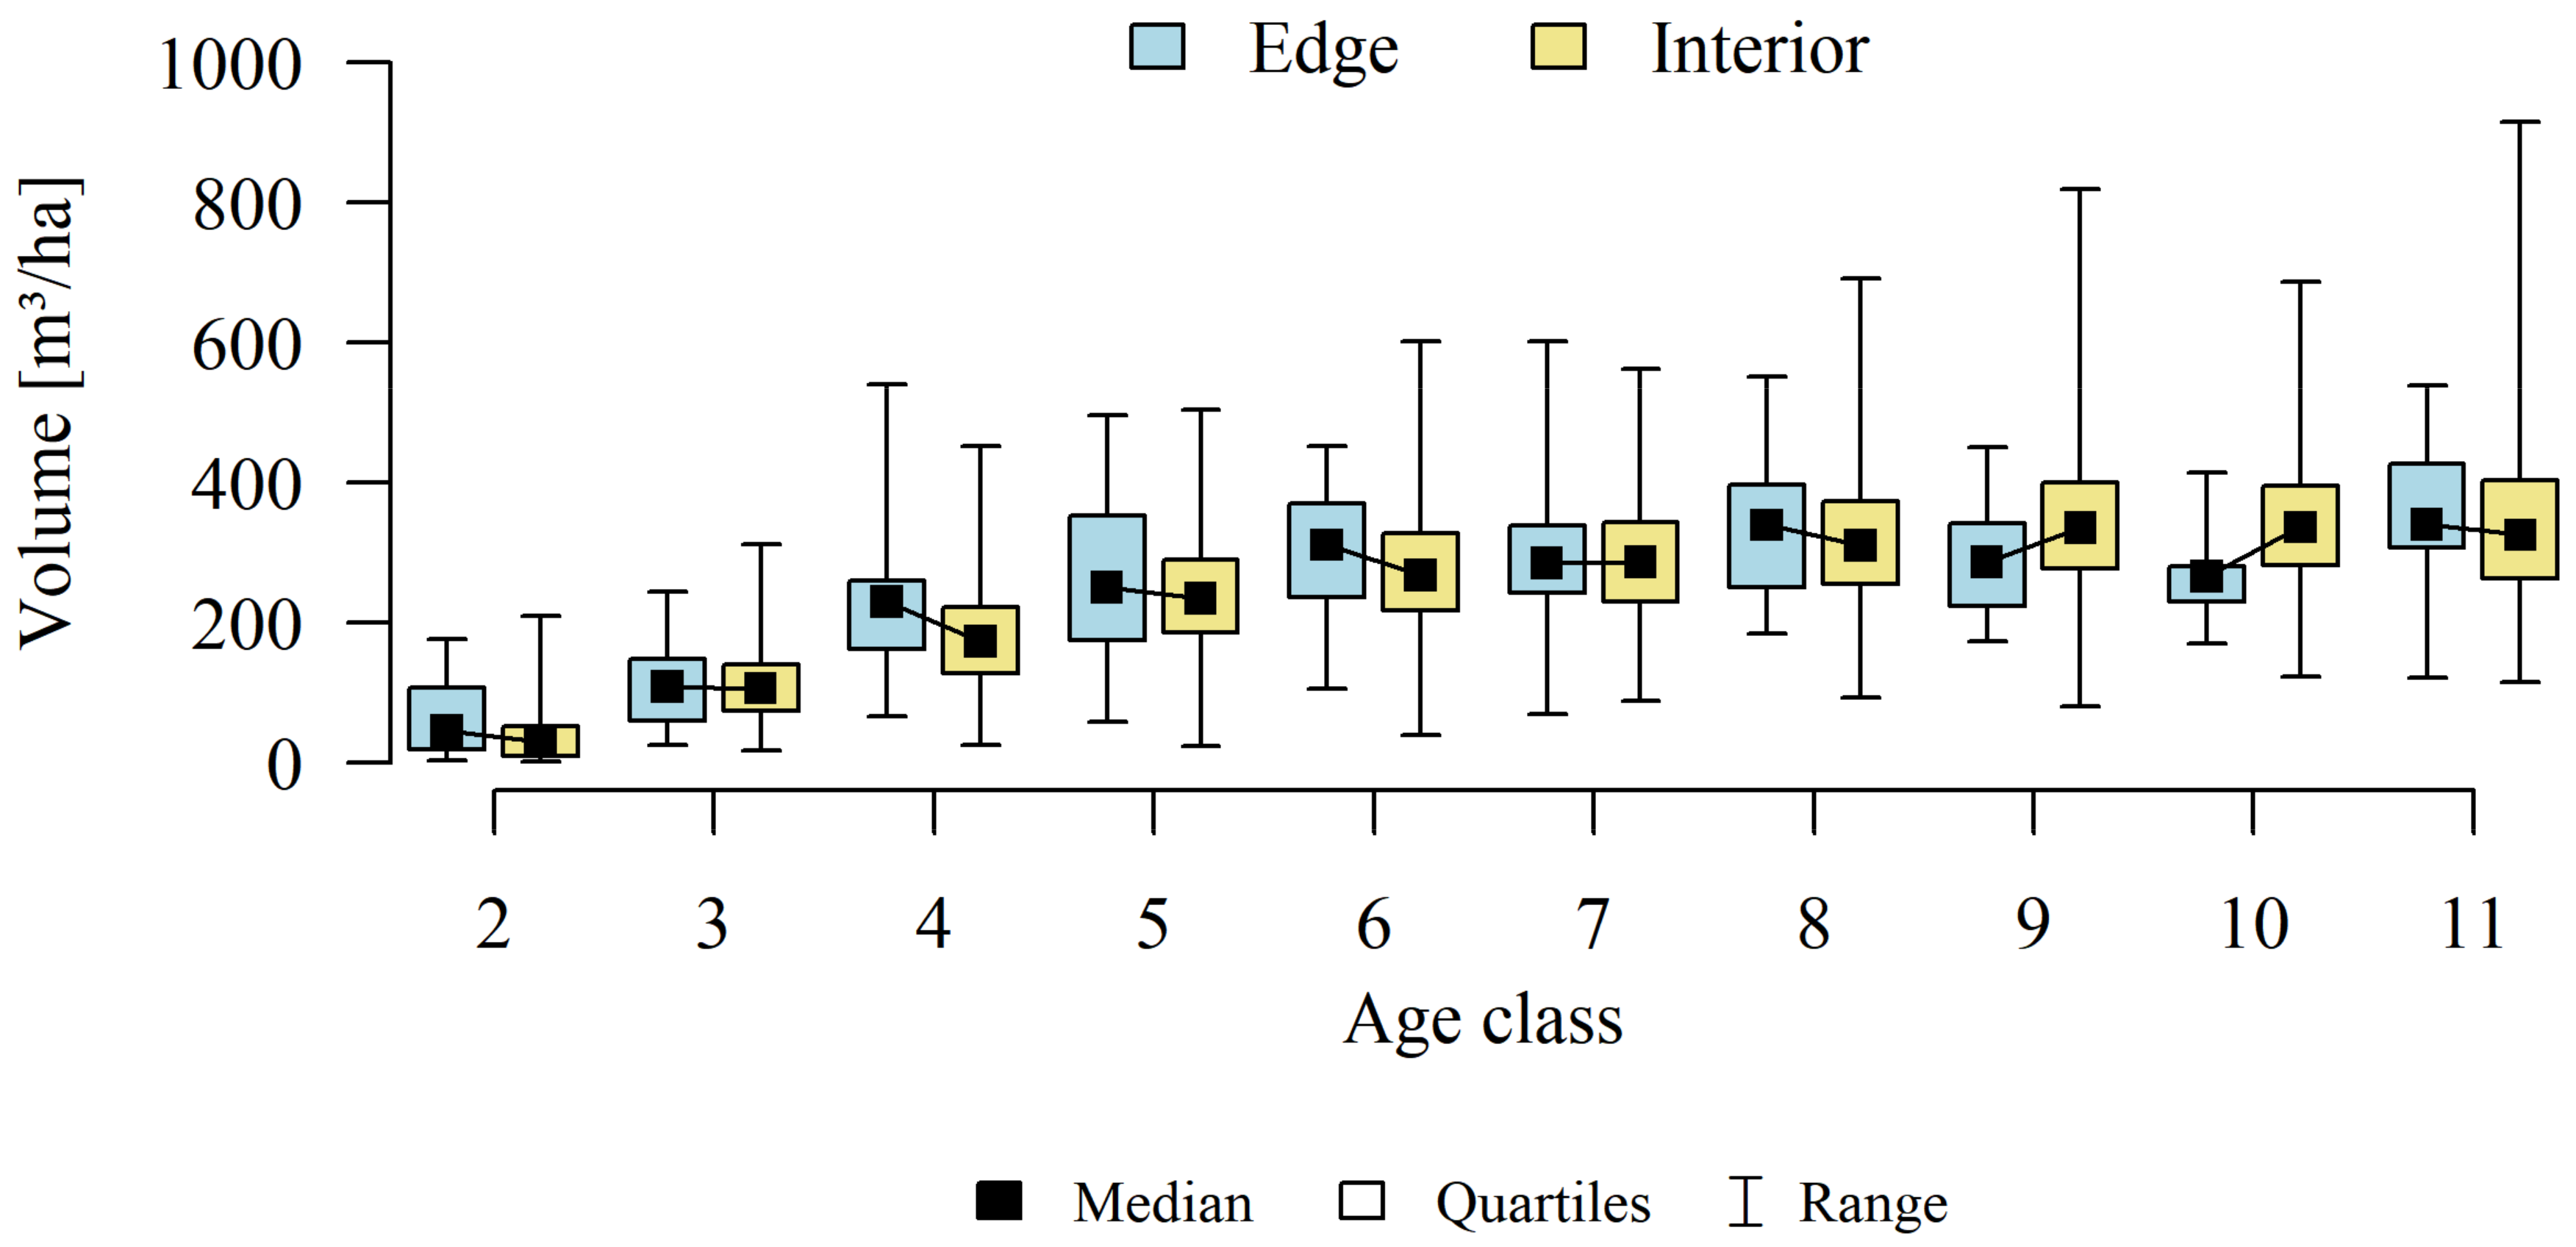
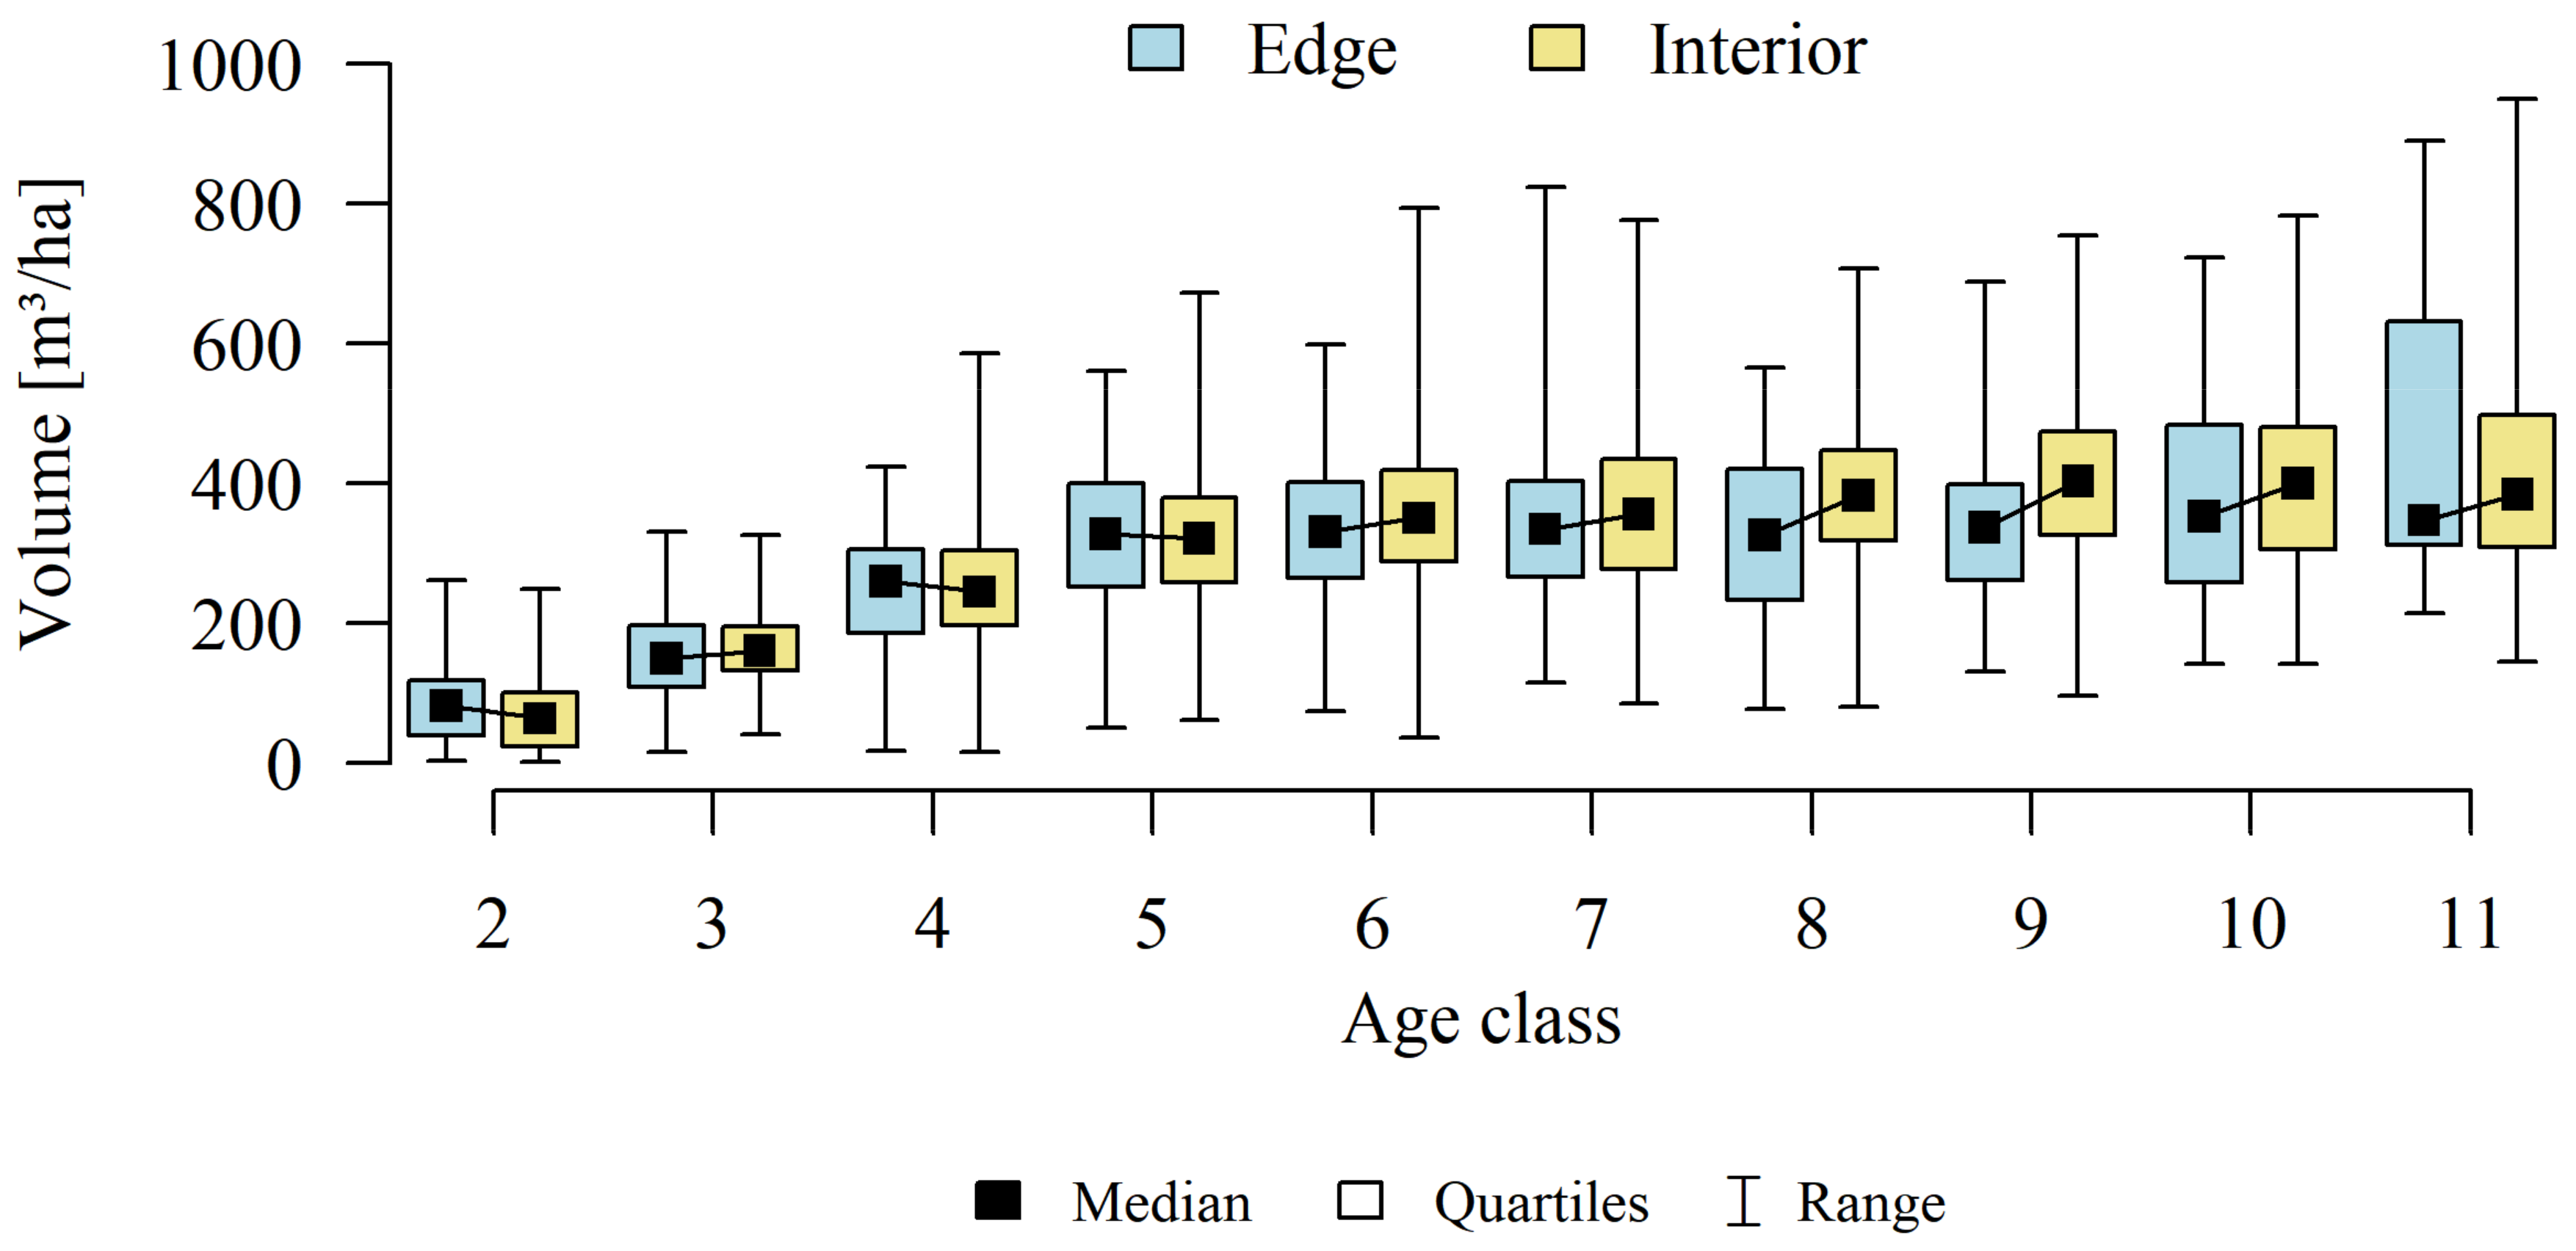
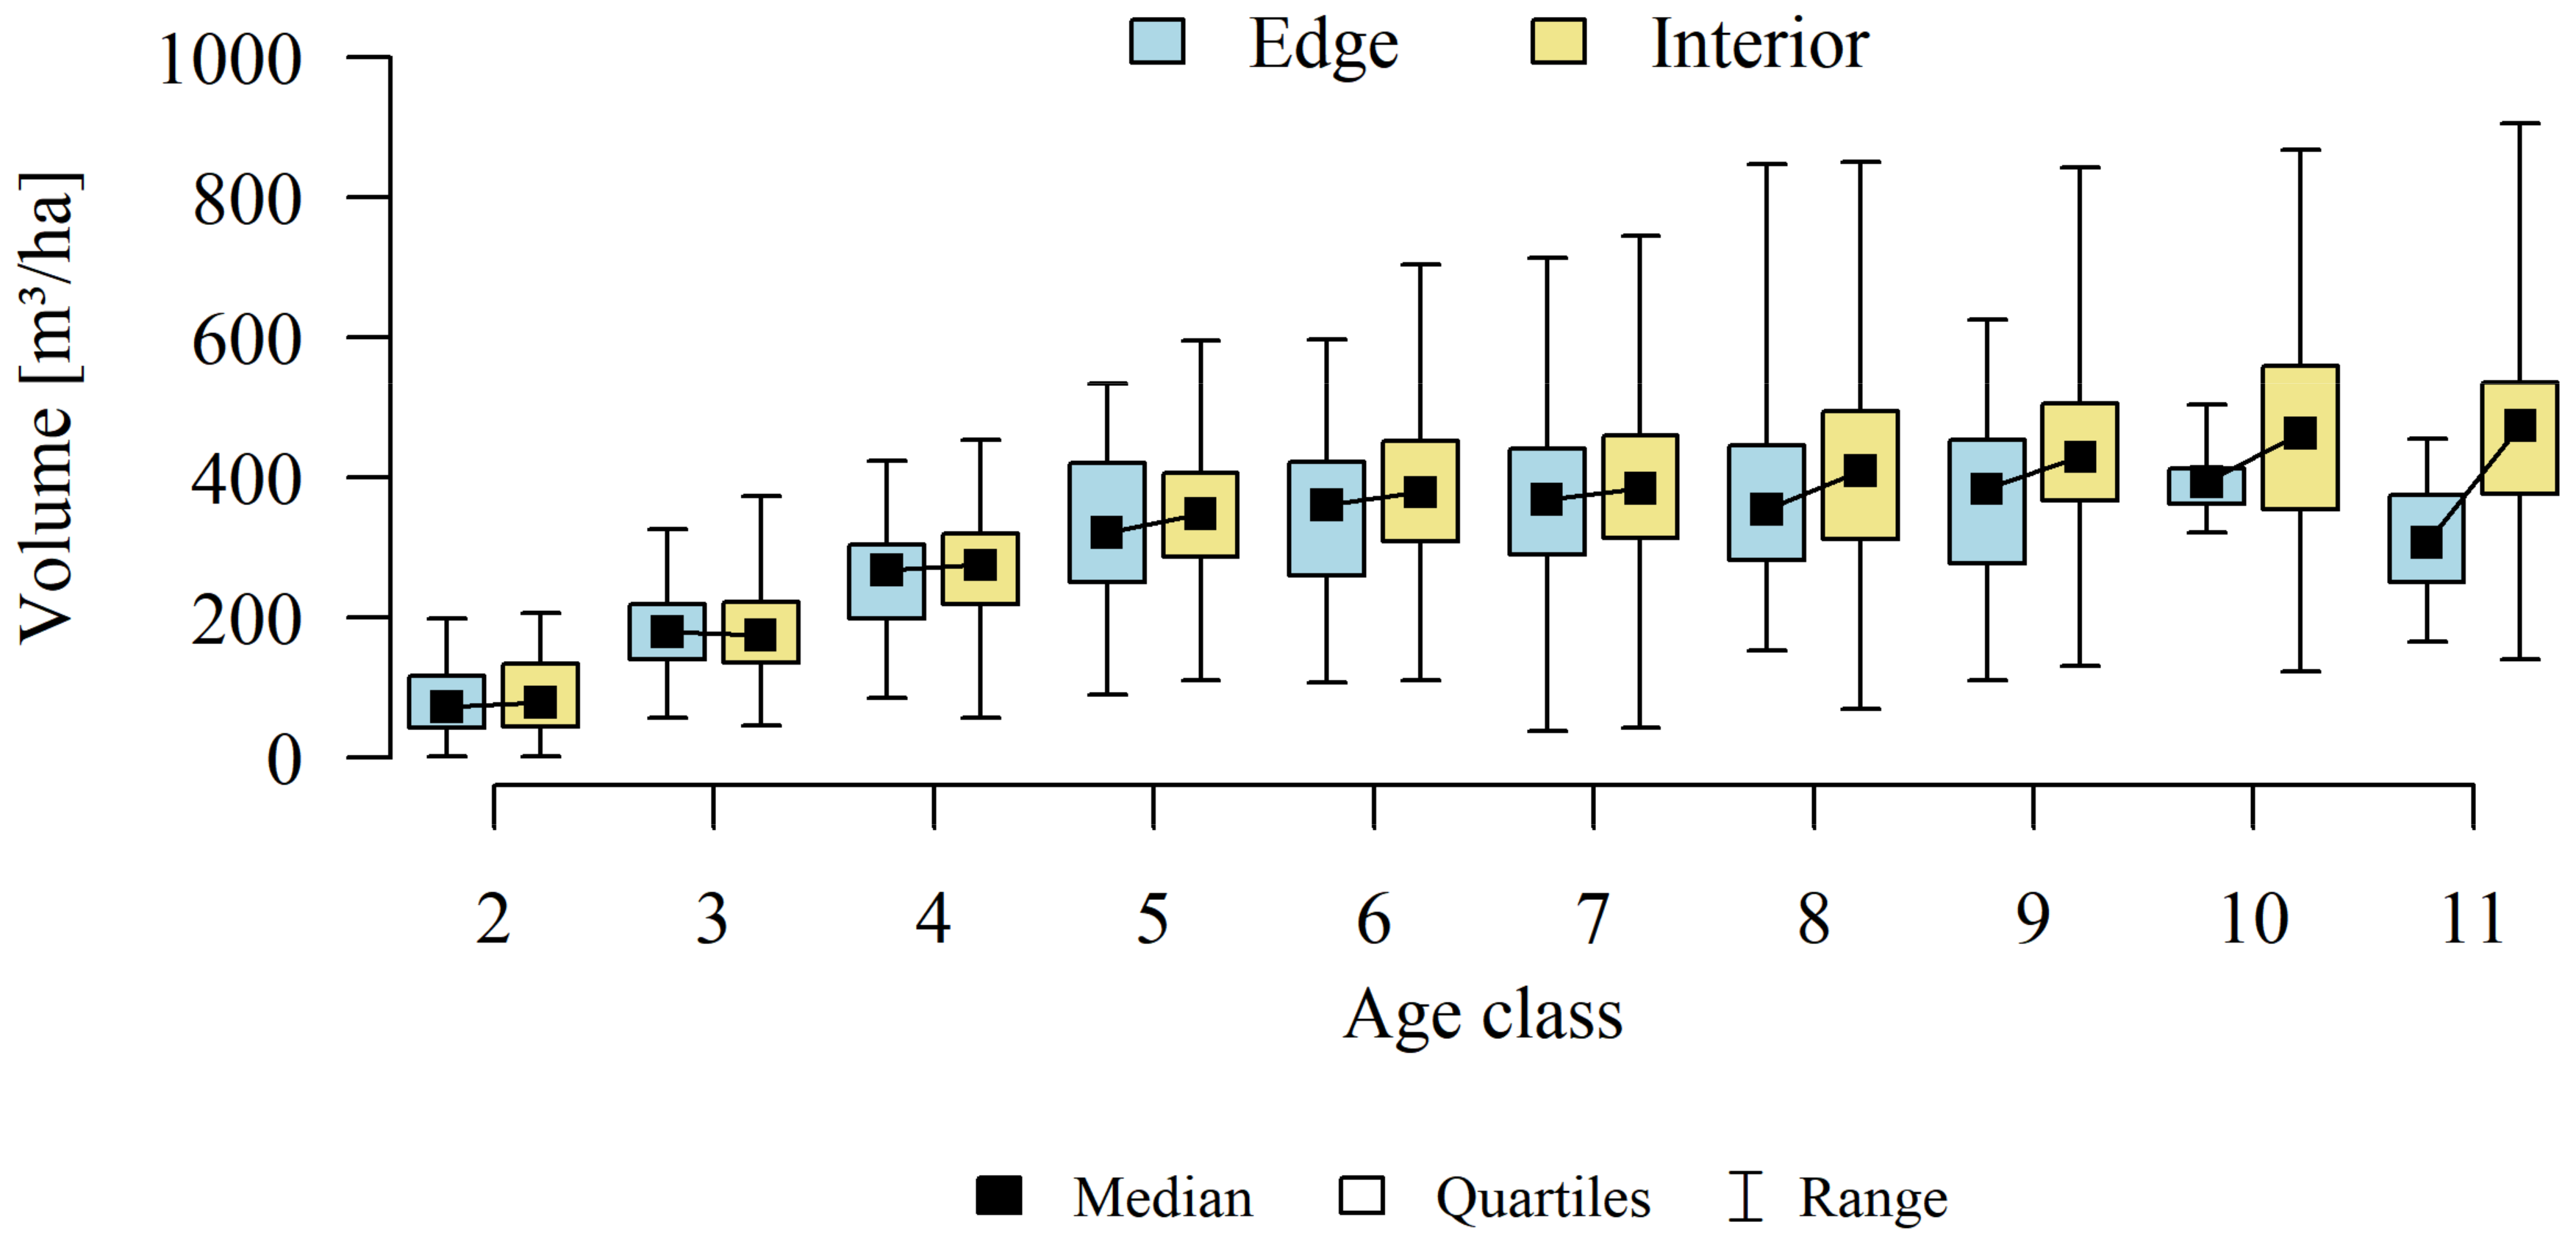
Analyses of the volume and structure of wood resources in the interior and edge zones of forest patches were conducted for stands with dominant pine in the 2 to 11 age classes in fresh coniferous forest (FCF—strongly barren habitat, fresh mixed coniferous forest (FMCF—barren habitat, and fresh mixed broadleaved forest (FMBF—moderately fertile habitat. For this purpose, the NFI database was used, from which the following characteristics were extracted for each sample plot: growing stock volume, growing stock volume increment, basal area.

2.3. Statistical Analysis and Calculations

Most statistical analyses were performed using the program R [67]. For the evaluation of the volume and structure of wood resources in scientific studies of forest ecosystems, the most commonly used characteristics are basal area, growing stock volume, and growing stock increment. However, these characteristics are often interrelated. Therefore, before conducting further analyses, we assessed whether the sample plots were significantly correlated with respect to the listed characteristics. Spearman’s rank correlation was used to evaluate the interdependence of the studied characteristics.
The obtained results confirmed that there are statistically significant correlations between basal area (g), growing stock volume (v), and growing stock volume increment (zv) (Table 1). Therefore, the studies selected one characteristic for further analysis of the volume and structure of wood resources-growing stock (v).
The study then focused on finding answers: whether there is a direct, statistically significant relationship between the relative volume of the resource (growing stock volume on plots) and the size of the forest patches (natural logarithm calculated from the area) and the proportion of the edge zone in the forest patches. A linear regression model and coefficient of determination (R2) were used.
As part of the adopted calculation procedure for each calculation unit, we investigated whether the wood resources in the interior and edge zones differ significantly. Considering that part of the observations (sample plots) are correlated with each other (plots established in the same forest patch), a mixed linear model was used to achieve the research objective. This means that the classical covariance matrix of the linear model was replaced by a matrix that allows correlations between observations.
The study of the significance of the differences between the resources in the interior of the patch and in its edge zones was carried out with a linear mixed model of the following form (Equation (1)):
y = X β + Z u + ε ,   ε ~ N 0 ,   σ 2 I ,   u ~ N 0 , U ,   C o v ε ,   u = 0
where:
  • y–is the n data vector (dependent value),
  • X–is a matrix of n x p which columns are p independent variables that are permanent effects. In our calculations, X is the location of the plot in the forest patch (a variable taking two possible values: edge or interior),
  • β–is the p vector of permanent effects parameters,
  • Z–is a matrix of n x q which columns are q independent variables that are random effects. In our calculations, Z is the id of the forest patch (a qualitative variable denoting the identification code of the patch),
  • u–is the q vector of random effects parameters,
  • ε–is the n random vector.
Differences in growing stock volume between the interior and edge zones were considered significant for p ≤ 0.05.
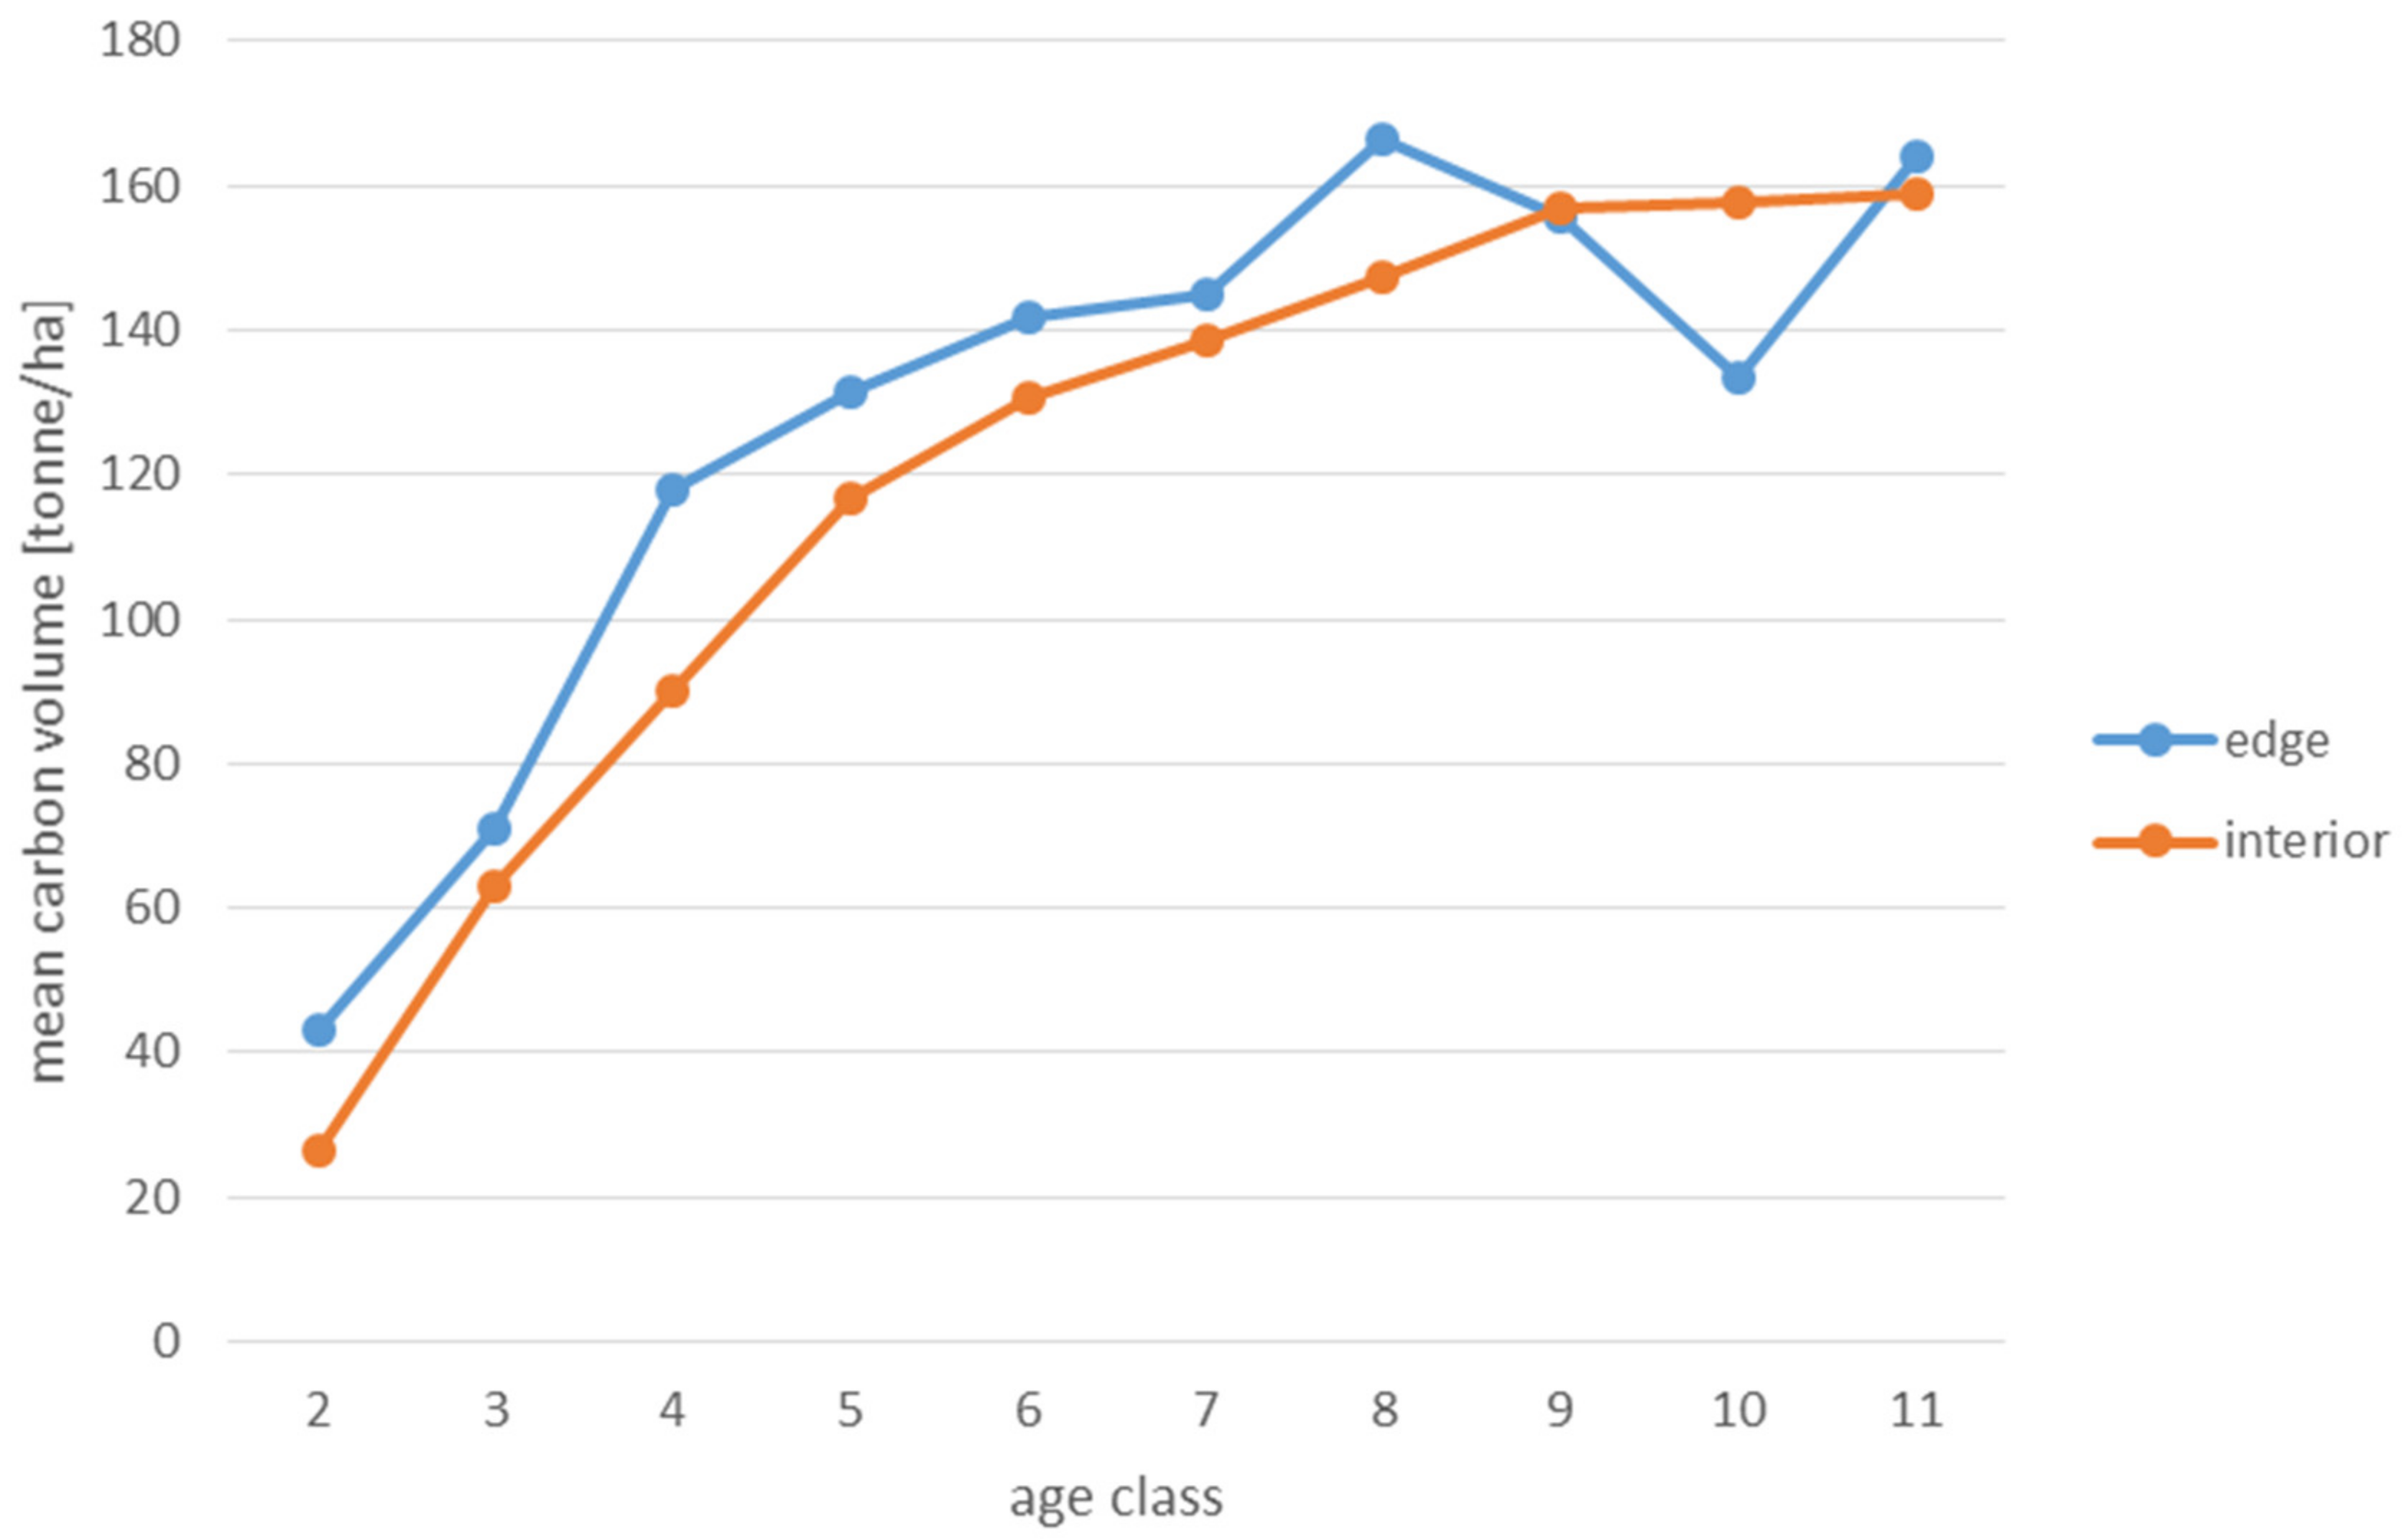
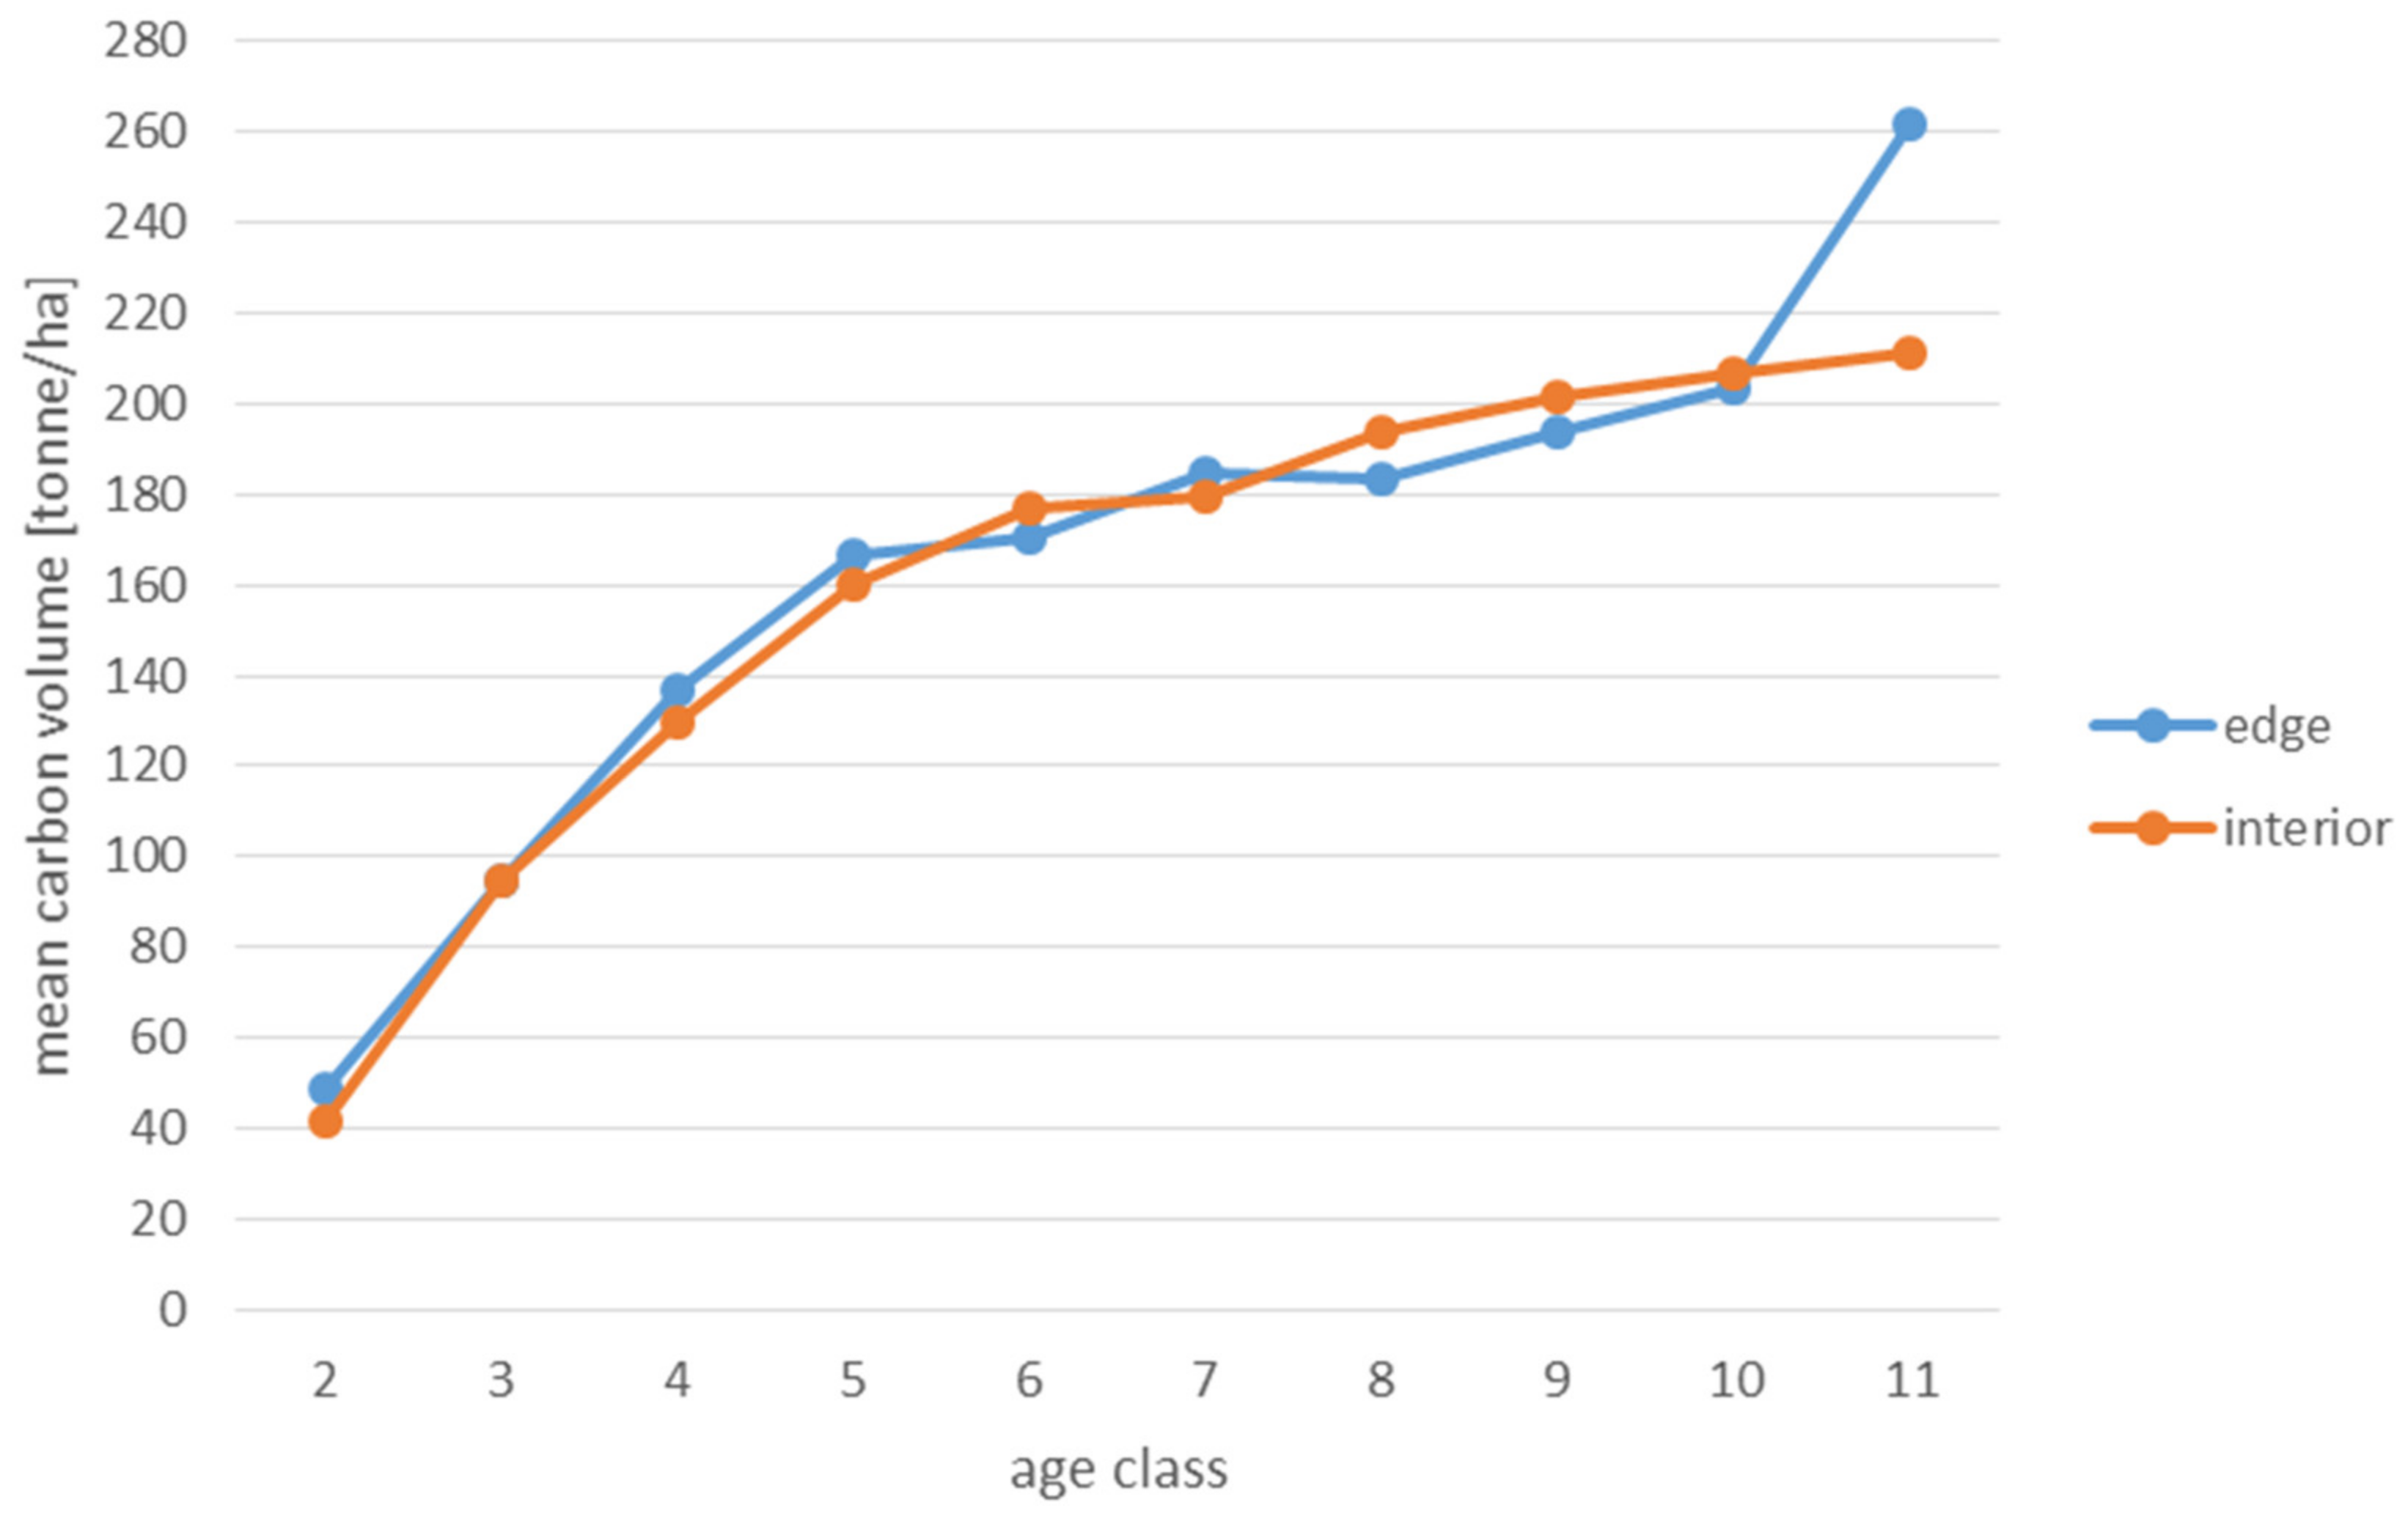
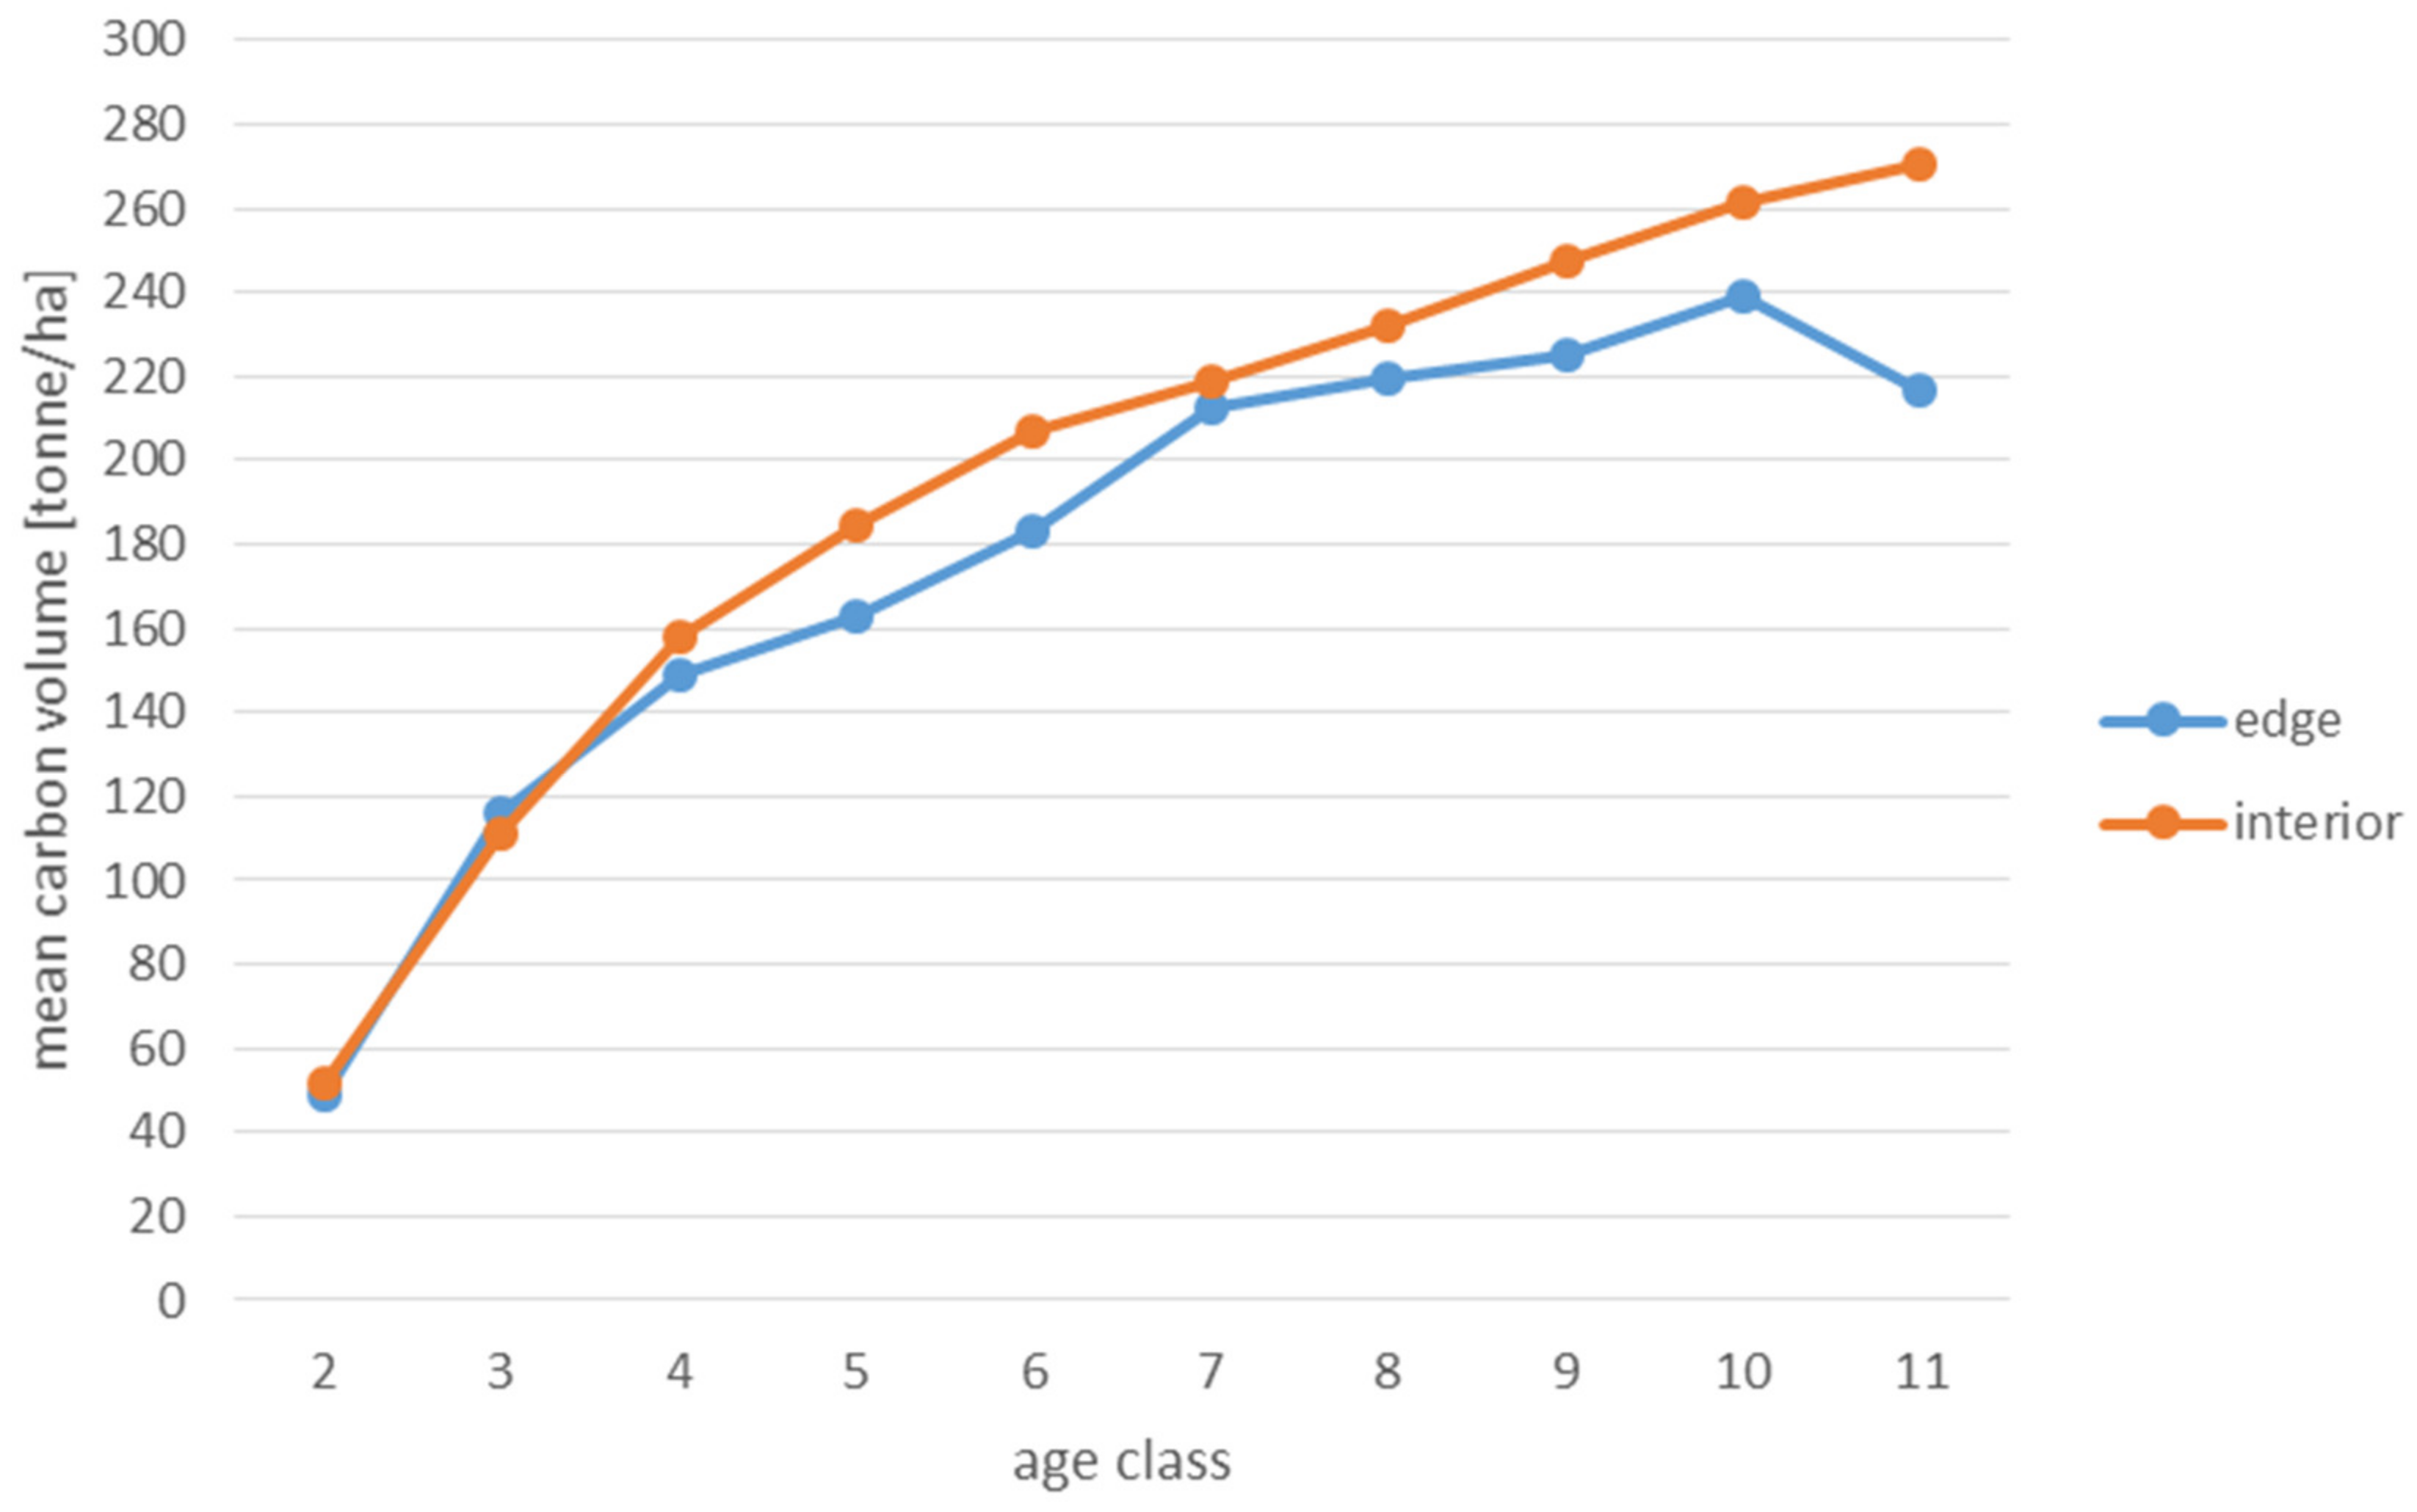
Analyses of the volume of carbon accumulated in the living biomass in the edge zone and in the interior zone were also used to assess the effects of forest fragmentation. For this purpose, the volume of the growing stock (m3) had to be converted to tonnes of carbon (C). The method proposed by the Intergovernmental Panel on Climate Change was used [68]. Appropriate coefficients were used to evaluate the amount of carbon accumulated in the living biomass according to the actual species composition of the stands on the plots. The calculation was made using the Equation (2):
C = V × B C E F × 1 + R × C F
where:
  • C–carbon in tonnes,
  • V–growing stock volume (m3),
  • BCEF–biomass conversion and expansion factor,
  • R–root factor,
  • CF–carbon fraction [tonne C (tonne dry matter)-1].
The values of BCEF, R, and CF coefficients as a function of tree species and tree age were taken from tables published by the IPCC [68]. When a tree species was not included in the IPCC tables, the values for pine were used in the case of coniferous species and for hornbeam in the case of deciduous species. The amount of carbon used to present the results is expressed in the unit t/ha (tonnes per hectare).
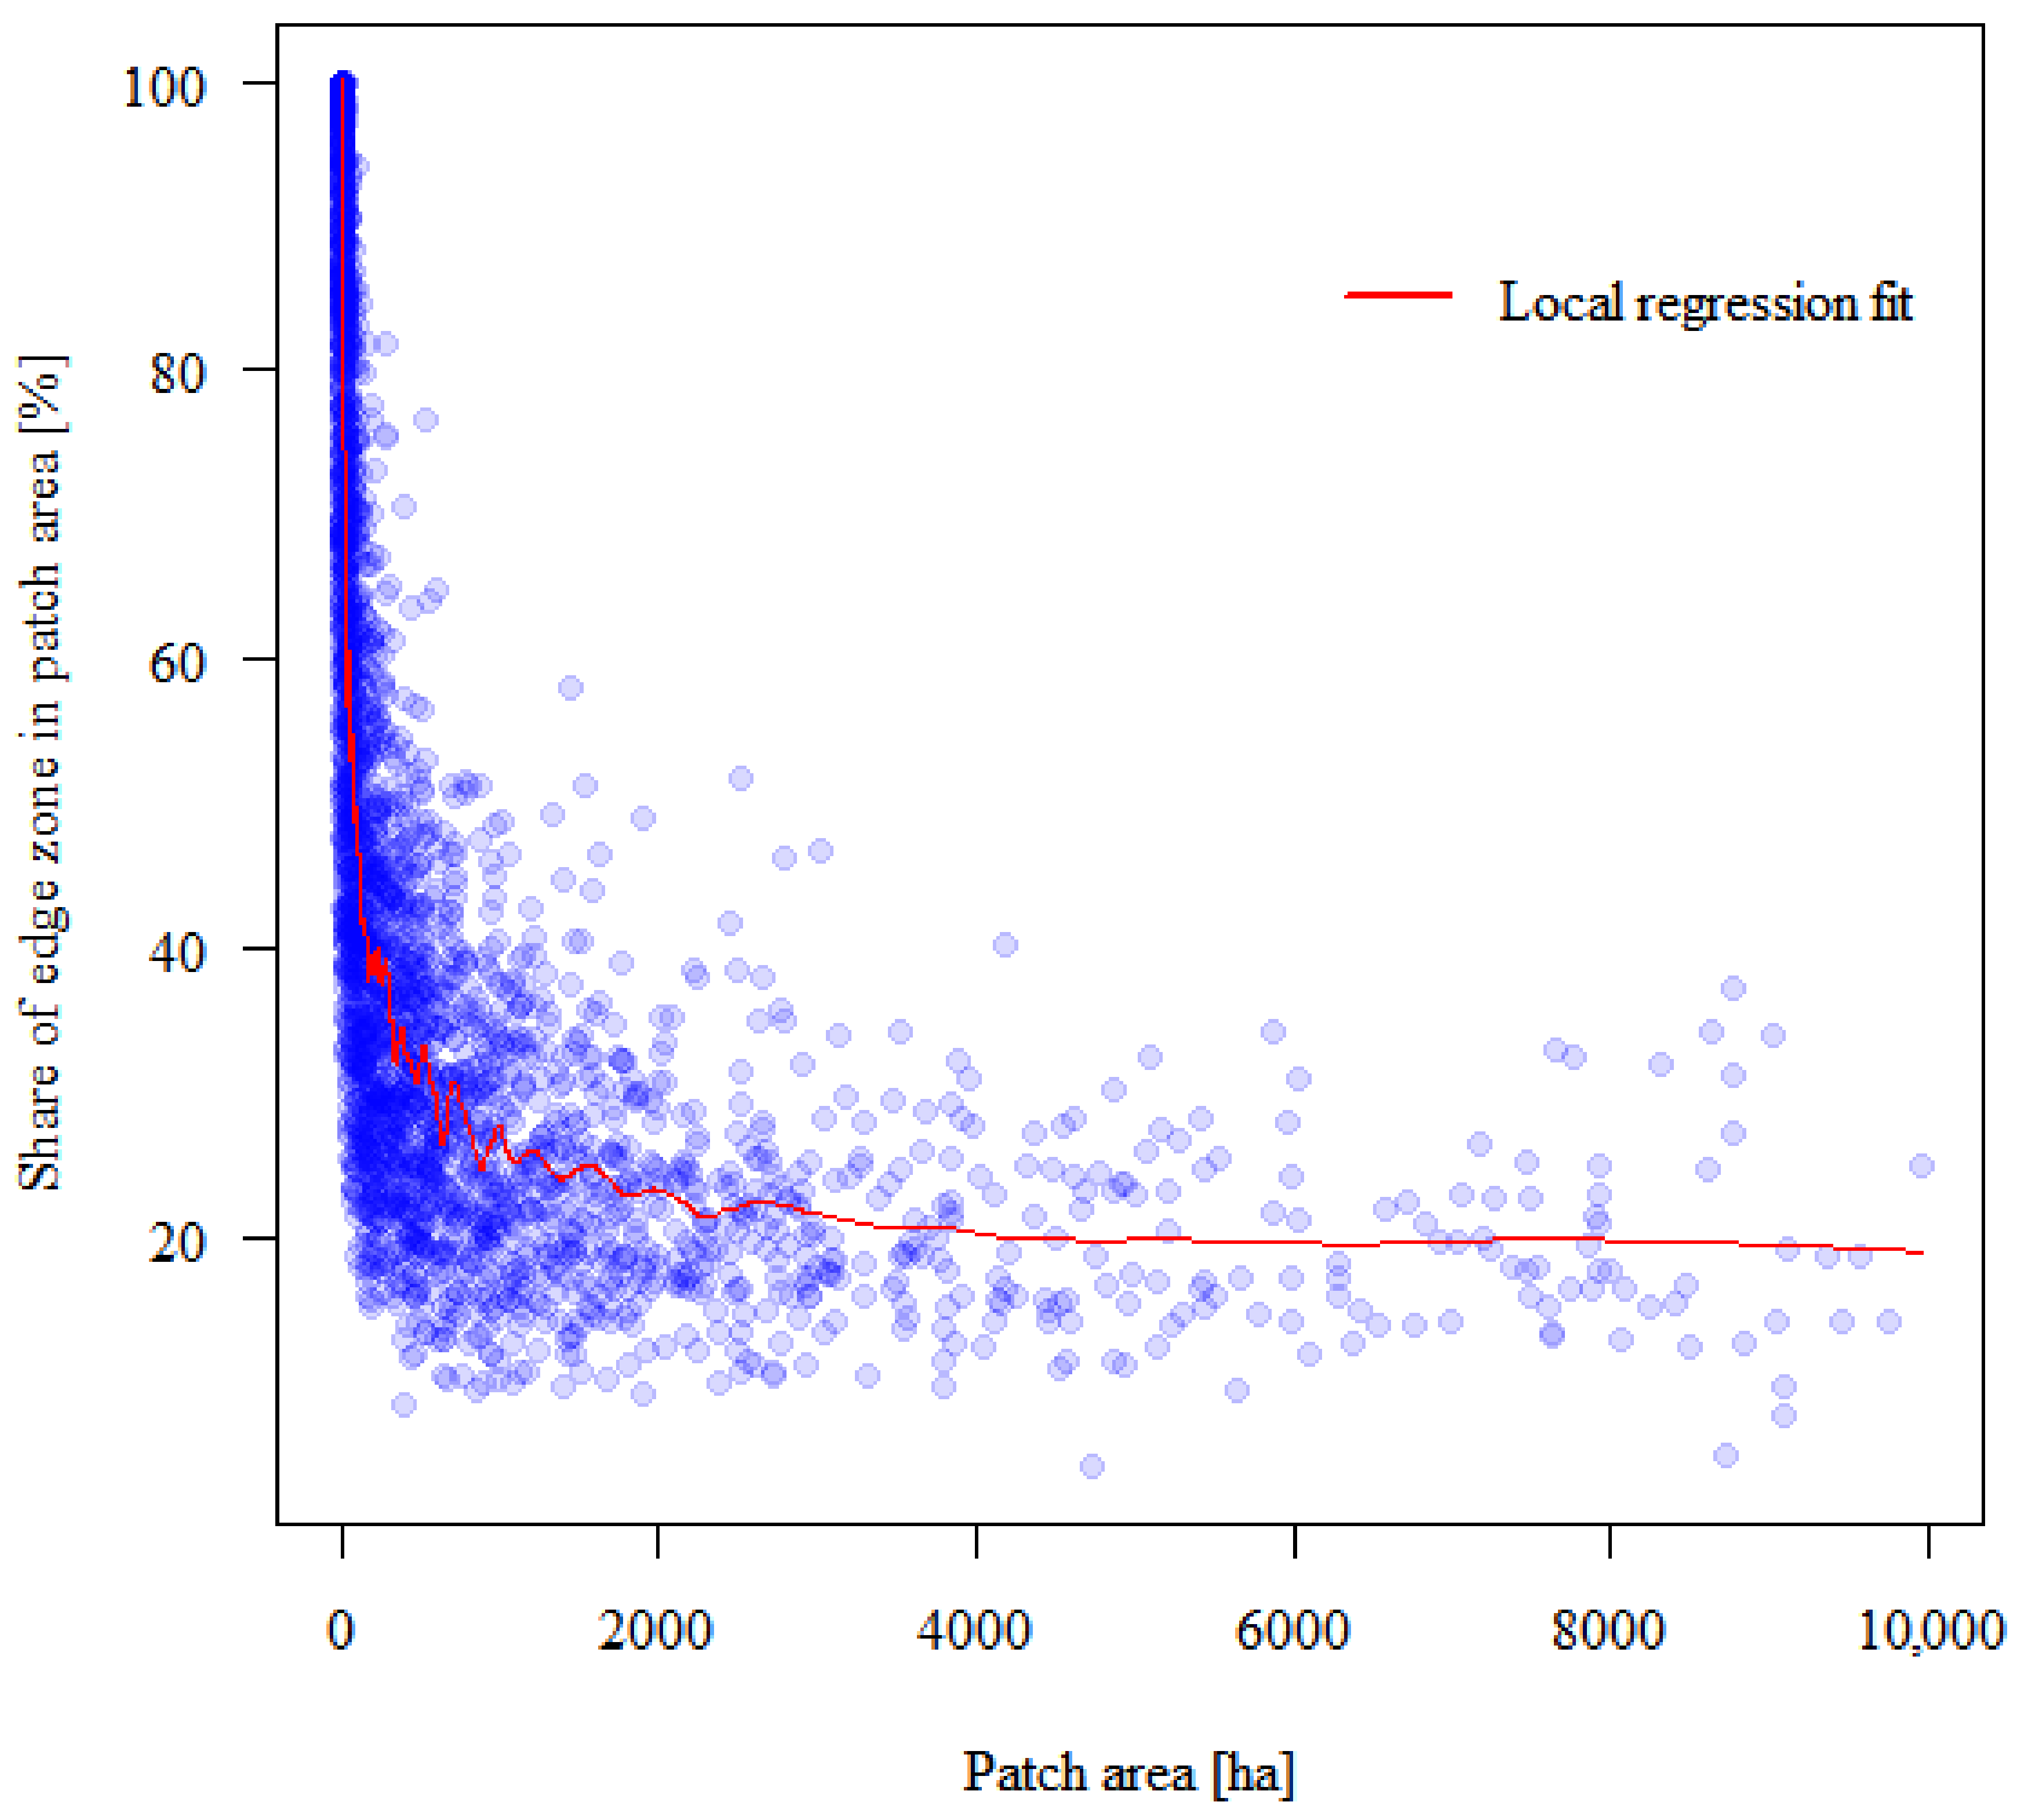
In the last stage of calculations, based on spatial analysis, the critical area of the forest patch was determined, above which the average share of the edge zones was considered a constant value. In other words, it is the size of the forest patch above which the impact of the edge effect on the volume of wood resources is considered insignificant. To this end, the local regression model was adjusted to determine the approximate area where the curve flattens. The determination of the curve near each point referred to 5% of the closest patches in terms of area, which should make the regression very local.

3. Results

The differences between the growing stock volume in the interior of the forest patches and in the edge zones were statistically significant (Table 2). It was found that growing stock volume was significantly higher in the edge zones, especially in very young stands (11–20 years) and middle-aged stands (31–40 years and 51–60 years) at FCF and FMCF sites. In older stands, the growing stock volume in the interior was higher, regardless of habitat conditions.
Although the results of the mixed linear model show significant differences within 1/3 of all computational units, the distribution of these differences within age classes and forest site types complements the compilation of descriptive statistics (Table 3 and Figure 3, Figure 4 and Figure 5). To present the results in the graphs, growing stock volume was converted to growing stock volume density (m3/ha). It is noticeable that up to and including age class 6, the median of the growing stock volume density at the FCF site is always higher in the edge zone. In the case of FMCF, the median growing stock volume density in stands of age class 6 or higher is always higher in the interior. Similarly, in the case of FMBF, the median growing stock volume density is always higher in the interior zone, but already in stands of age class 4 or higher. In addition, it was observed that, especially in older stands, the differences in the range of analyzed volumes are definitely greater in the interior than at the edge.
The analyses did not reveal a statistically significant relationship between the growing stock volumes on the plots and the area of the forest patch. In the vast majority of the calculation units, R2 did not exceed 5% (Table 4).
The analyses revealed no statistically significant relationship between the growing stock volume on the plots and the percentage of edge zones in the forest patches area. Here also, R2 did not exceed 5% in the vast majority of the computational units (Table 5).
Although R2 values in both cases (Table 4 and Table 5) do not reveal significant relationships, it should be noted that R2 in older stands reached the highest values in the units where significant differences in volume of growing stock were found (Table 2).
The relationship between the average carbon stock in the edge and interior zones differs within the three site types analyzed (Table 6). In the case of FCF (Figure 6), the edge zone stands store a greater amount of carbon than the interior stands, and these differences are observed below age class 9 (young and middle-aged stands). In the FMCF site (Figure 7), the edge zone stands store a very similar amount of carbon as the stands in the interior. In the FMBF site (Figure 8), the average amount of carbon stored in the living biomass is higher in the interior zone than in the edge from age class 4 onward. Values deviating from the observed trends (e.g., Figure 6—age class 10, Figure 7—age class 11) result from a small sample (a small number of plots assigned to the edge zones within these computational units), so caution should be exercised in interpreting these locations in the graphs.
The local regression model calculated for the proportion (percentage) of edge zone areas in the forest patches stabilizes at an area of the forest patch of about 3000–4000 ha (Figure 9). Due to the peculiarity of the model, it is not possible to give a specific limit value here. The figure refers only to forest patches up to 10,000 ha to ensure good readability of the graph (the model was also calculated considering areas larger than 10,000 ha).

4. Discussion

4.1. Forest Patches

Our work introduces the concept of assessing forest fragmentation by considering structural relationships. It was recognized that the approach of reducing the number of planning units could greatly simplify the management of fragmented forest areas and facilitate the formulation of conservation tasks for these areas. Therefore, to assess the effects of fragmentation of forest areas, we used collective units known as forest patches. They were determined by aggregating forest fragments based on structural connectivity. Landscape analyses show that the delineation of this type of unit should rather be based on the assessment of the dispersal ability of specific organisms [69]. Conducting such a comprehensive assessment is very difficult, in part because of the lack of knowledge about the dispersal abilities of some forest species [25].
Our research did not reveal a significant relationship between the size of the forest patch, which determines the extent of the edge effect, and growing stock volume. It has already been found that wood resources (per 1 ha) are similar in small and large patches [21]. The results also suggest that in forest areas larger than 3000–4000 ha, where there is a relatively constant percentage of edges, forest fragmentation should not affect the volume of wood resources. This means that differences in wood resources on similar forest sites in large forest patches are more likely to be rather the result of disturbances in structural and functional connectivity or the influence of other factors, than fragmentation.

4.2. Forest Structure

Given the multiple effects of many factors on forest patches, we have assumed that the assessment of the effects of fragmentation on the volume and structure of wood resources will be based on the analysis of the edge effect. It summarizes the effects of many fragmentation mechanisms, such as microclimate change, mortality of trees or competition with ecotone species [39,41,42,44,50,51,53,54,55,70]. The amplification of the edge effect also takes into account the shape of forest patches, which makes it a very important parameter in the management and protection of forests. However, contrary to the original assumptions, which assumed that due to the change in the proportion of edge zones in forest patches of different sizes there would be a simultaneous change in the total resources in the whole unit, this was not confirmed by statistically significant correlations. There was insufficiently strong difference in the growing stock volume between the edge and interior of the patch. Thus, with low percentage of forest edges, there was no effect on total wood resources.
However, the lack of a relationship between the proportion of the edge zone and the volume of wood resources does not mean that forest fragmentation does not affect wood resources at all. This has been demonstrated by numerous studies of habitat size, connectivity and quality, and tree stand structure. These observations have been confirmed in tropical forests [71,72,73] and temperate forests [6,26,74] among others, where it has been shown that the parameters describing forest structure depend significantly on the area of the patch. In large continuous forests, the average tree height was higher, there was a more diverse height structure, and the proportion of gaps in the canopy of the stand was lower [7]. As a result of fragmentation, characteristics such as tree density, tree height, and diameter at breast height were significantly reduced in tropical forests [8], suggesting that this was primarily due to a difference in species composition at the edge and in the interior. In Atlantic forests of South America, small patches of forest have been found to have higher tree density, including mainly pioneer species [5]. Researchers indicate that smaller forest fragments are characterized by a relatively lower basal area [6]. Lower biomass is also found in small patches [22,39,41], not only as a result of lower tree height [39,41], but also lower leaf biomass at the forest edge [22]. However, it should be considered that some studies indicate an inverse relationship [42], due to more intense growth of woody vegetation at higher temperatures at the forest edge.
An important process affecting the differential volume and structure of wood resources near the edge in forest patches is higher tree mortality [23,40,70]. Wind damage is most commonly cited as the main cause of higher tree mortality near the edge [24,57,75,76]. Stands consisting of light-demanding species such as pine are particularly affected, as are other types of stands in which species with higher light requirements are relatively common at the forest edges [77]. Some studies show that, despite the weak relationship between the size of a forest patch and the extent of wind damage, usually more damage is noted in patches with higher edginess [75]. In some countries, fires are an important factor influencing the reduction of wood resources at forest edges [54]. Many works also suggest that habitat conditions at forest edges are in some respects worse (e.g., lower humidity) [41,44,51], which may also affect the volume of wood resources. As a result, a lower volume of wood resources is usually observed at the edges than in the interior of the patch, which was also confirmed by our research. We found a very weak relationship between forest stand characteristics and patch size, as well as statistically significant differences between growing stock volume in the interior and the edge zone.

4.3. Stands Age

An important result of our research was the finding that the influence of the edge zone on the volume of wood resources is not constant and depends on the age of the trees in the stand. Previous studies in this area rarely distinguish the response of stands of different ages. Treating stands of trees of different ages as one study group may obscure the true response to fragmentation. Depending on the age of the stands, research results can often confirm conflicting hypotheses about the extent of wood resources in the edge zones. In our study, we found that in pine stands ≤20 years old growing on barren (FMCF) and strongly barren (FCF) habitats, the hypothesis assuming higher resources in the edge zone compared to the interior was confirmed. In young stands, the higher productivity at the edges [66] may be the result of greater species diversity and more favorable habitat conditions (better access to light, higher temperature), which affect less competition for environmental resources [7] and promote the formation of the so-called protective wall [4]. In mature stands (>80 years old), the hypothesis of lower resources volume near the forest edge was confirmed, mainly due to the influence of harmful abiotic factors from the matrix and an increase in the proportion of species with low wood density. As tree stands age, trees growing near the forest edge begin to devote an increasing portion of their vital energy to protection from external stressors. As a result, their upward growth dynamics is reduced and older trees at the edges have a lower height [22,39,41]. This usually leads to a lower timber volume close to the forest edge [15]. In turn, stands in the interior of the forest are usually diverse in age and structure and are characterized by a higher proportion of large trees with high stock volume [24], which is also favored by more advantageous environmental conditions [78]. Therefore, large and old trees are rarely found near the forest edge, resulting in a lower average volume of wood resources with a correspondingly higher growing stock increment.
Thus, our research has allowed us to determine the conditions under which the edge effect significantly affects the volume of wood resources in managed forests. In young pine-dominated stands in the edge zones, the growth of individual trees was more intense than in the interior, which means that fragmentation under these conditions will favor the development of wood resources. In subsequent years, the effects of edge on tree growth and biomass were not significant, and resources were not significantly different from the interior. In mature tree stands, a lower volume of growing stock in the edge zones means that fragmentation will eventually lead to a decrease in the volume of wood resources. Thus, the observed relationship between the volume of resources in the zones of edge and interior suggests that the effects of fragmentation on tree stands can be strong, but only for a short period of time [79]. Our results indicate that the edge effect is not a permanent factor in forest formation. Rather, there are spatial constructs that must be defined in terms of individual ecological situations that apply to tree stands of a particular species composition, age, and habitat.

4.4. Carbon Accumulation

Forest fragmentation may contribute to a reduction in biomass and carbon stocks [22,23,56]. In addition, the differences in carbon stocks between the edge and the interior of the forest increase over time [22]. Our studies have shown that carbon accumulation in pine stands (in case FMBF site) gradually decreases with age in the edge zone, compared to the interior. These results also confirm observations in other forests [80]. They indicate that as the forest edge ages, mortality rates increase significantly, especially for large trees that store most carbon in the stand [24]. Despite of more intensive growth of trees at the edges, the frequency of tree regeneration processes also increases due to the increasing tree mortality with the age of the stand, which finally leads to a lower carbon accumulation at the forest edges.
Structural connectivity of forests has also been shown to have a significant impact on the level of carbon accumulation in aboveground biomass [21], because it enhances the synergy between biodiversity and the amount of CO2 assimilated. The results of our research also show that fragmentation of forests by creating edges affects the amount of accumulated carbon. However, the amount of accumulation was not constant and depended on the fertility of the habitat (similar habitats were studied in relation to moisture). In strongly barren habitats (FCF), the average mass of carbon was higher in edge zones than in the interior, whereas it was not significantly different in barren habitats (FMCF). In moderately fertile habitats (FMBF), in turn, the mass of carbon was higher in the interior. These results prove once again that fragmentation is a complex phenomenon that directly and indirectly affects processes occurring in forests in multiple ways [20].

5. Conclusions

As a result of the conducted research, the following conclusions were drawn:
  • The effects of fragmentation depend on both the structure of the forest and the landscape metrics of the forest patches, especially the area of the fragments and the distance between them. To reduce the impact of fragmentation (edge effect) on the volume of wood resources, large forest patches of at least 3000 ha should be established.
  • The effects of fragmentation on the volume of wood resources in managed pine-dominated forests depend on the age of the stands and the quality of the site. To maintain a high volume of wood resources, care should be taken to counteract the occurrence of the edge effect, especially in older pine stands on moderately fertile sites (FMBF).
  • In highly barren habitats (FCF), pine-dominated stands within edge zones are characterized by a higher ability to accumulate carbon in living biomass than stands in the interior of forest patches. This means that under certain site conditions, fragmentation may increase the potential of managed forested areas to mitigate climate change.
  • The use of comparative studies is an effective way to obtain generalizations about the effects of habitat fragmentation for planning and managing fragmented forest areas. Our results provide a framework for interpreting empirical findings on forest fragmentation. However, it is also clear that more detailed experimental studies are needed. This is due to the need to identify the underlying mechanisms responsible for the fragmentation patterns observed in stands with greater species richness. This is all the more important because some species of trees may be less sensitive to the edge effect [55].

Author Contributions

The general conception of the research was provided both by P.B. and S.Z.; P.B., NFI data base analysis, spatial data analysis, and statistical analysis; P.B. and S.Z., interpretation of results, discussion and conclusions. Both authors contributed to conceptualization, drafting and preparation of the manuscript, review, and editing the text. All authors have read and agreed to the published version of the manuscript.

Funding

This study was financed by the Ministry of Science and Higher Education of the Republic of Poland (Research Project No. 900422).

Institutional Review Board Statement

Not applicable.

Informed Consent Statement

Not applicable.

Data Availability Statement

The data that support the findings of this study are available from the Forest Research Institute (Poland), but restrictions apply to the availability of these data, which were used under license for the current study and are thus not publicly available. The data are, however, available from the authors upon reasonable request and with permission from the Forest Research Institute (Poland).

Acknowledgments

The authors thank the State Forests National Forest Holding and Head Office of Geodesy and Cartography for making the data available (license no. DIO.7211.173.2019_PL_N), as well as the anonymous reviewers for their comments.

Conflicts of Interest

The authors declare no conflict of interest.

References

  1. Fahrig, L. Effects of Habitat Fragmentation on Biodiversity. Annu. Rev. Ecol. Evol. Syst. 2003, 34, 487–515. [Google Scholar] [CrossRef] [Green Version]
  2. Wilcove, D.S.; McLellan, C.H.; Dobson, A.P. Habitat fragmentation in the temperate zone. Conserv. Biol. 1986, 6, 237–256. [Google Scholar]
  3. Laurance, W.F.; Nascimento, H.E.M.; Laurance, S.G.; Andrade, A.C.; Fearnside, P.M.; Ribeiro, J.E.L.; Capretz, R.L. Rain forest fragmentation and the proliferation of successional trees. Ecology 2006, 87, 469–482. [Google Scholar] [CrossRef] [PubMed]
  4. Arellano-Rivas, A.; De-Nova, J.A.; Munguía-Rosas, M.A. Patch isolation and shape predict plant functional diversity in a naturally fragmented forest. J. Plant Ecol. 2016, 23, 119. [Google Scholar] [CrossRef]
  5. Santo-Silva, E.E.; Almeida, W.R.; Tabarelli, M.; Peres, C.A. Habitat fragmentation and the future structure of tree assemblages in a fragmented Atlantic forest landscape. Plant Ecol. 2016, 217, 1129–1140. [Google Scholar] [CrossRef]
  6. Echeverría, C.; Newton, A.C.; Lara, A.; Benayas, J.M.R.; Coomes, D.A. Impacts of forest fragmentation on species composition and forest structure in the temperate landscape of southern Chile. Glob. Ecol. Biogeogr. 2007, 16, 426–439. [Google Scholar] [CrossRef] [Green Version]
  7. Vaughn, N.R.; Asner, G.P.; Giardina, C.P. Centennial impacts of fragmentation on the canopy structure of tropical montane forest. Ecol. Appl. 2014, 24, 1638–1650. [Google Scholar] [CrossRef]
  8. Islam, M.; Deb, G.P.; Rahman, M. Forest fragmentation reduced carbon storage in a moist tropical forest in Bangladesh: Implications for policy development. Land Use Policy 2017, 65, 15–25. [Google Scholar] [CrossRef]
  9. Raši, R.; Schwarz, M. Forest Fragmentation Indicator; FOREST EUROPE Liaison Unit Bratislava: Zvolen, Slovakia, 2020. [Google Scholar]
  10. Bera, B.; Saha, S.; Bhattacharjee, S. Estimation of Forest Canopy Cover and Forest Fragmentation Mapping Using Landsat Satellite Data of Silabati River Basin (India). KN J. Cartogr. Geogr. Inf. 2020, 70, 181–197. [Google Scholar] [CrossRef]
  11. Çakir, G.; Sivrikaya, F.; Keleş, S. Forest cover change and fragmentation using Landsat data in Maçka State Forest Enterprise in Turkey. Environ. Monit. Assess. 2008, 137, 51–66. [Google Scholar] [CrossRef]
  12. Andronache, I.; Marin, M.; Fischer, R.; Ahammer, H.; Radulovic, M.; Ciobotaru, A.-M.; Jelinek, H.F.; Di Ieva, A.; Pintilii, R.-D.; Drăghici, C.-C.; et al. Dynamics of Forest Fragmentation and Connectivity Using Particle and Fractal Analysis. Sci. Rep. 2019, 9, 12228. [Google Scholar] [CrossRef] [Green Version]
  13. Muluneh, M.G.; Feyissa, M.T.; Wolde, T.M. Effect of forest fragmentation and disturbance on diversity and structure of woody species in dry Afromontane forests of northern Ethiopia. Biodivers. Conserv. 2021, 30, 1753–1779. [Google Scholar] [CrossRef]
  14. Zięba, S.; Banaś, J.; Zygmunt, R.; Bujoczek, L. Postać strefy brzegowej różnych typów drzewostanów. Stud. Mater. Cent. Edukac. Przyr. Leśnej 2014, 16, 98–108. [Google Scholar]
  15. Veselkin, D.V.; Shavnin, S.A.; Vorobeichik, E.L.; Galako, V.A.; Vlasenko, V.E. Edge effects on pine stands in a large city. Russ. J. Ecol. 2017, 48, 499–506. [Google Scholar] [CrossRef]
  16. Erasmi, S.; Klinge, M.; Dulamsuren, C.; Schneider, F.; Hauck, M. Modelling the productivity of Siberian larch forests from Landsat NDVI time series in fragmented forest stands of the Mongolian forest-steppe. Environ. Monit. Assess. 2021, 193, 200. [Google Scholar] [CrossRef]
  17. Shen, C.; Shi, N.; Fu, S.; Ye, W.; Ma, L.; Guan, D. Decline in Aboveground Biomass Due to Fragmentation in Subtropical Forests of China. Forests 2021, 12, 617. [Google Scholar] [CrossRef]
  18. Numata, I.; Cochrane, M.A.; Roberts, D.A.; Soares, J.V.; Souza, C.M.; Sales, M.H. Biomass collapse and carbon emissions from forest fragmentation in the Brazilian Amazon. J. Geophys. Res. 2010, 115, 999. [Google Scholar] [CrossRef] [Green Version]
  19. Numata, I.; Cochrane, M.A.; Souza, C.M., Jr.; Sales, M.H. Carbon emissions from deforestation and forest fragmentation in the Brazilian Amazon. Environ. Res. Lett. 2011, 6, 44003. [Google Scholar] [CrossRef]
  20. Rolo, V.; Olivier, P.I.; Pfeifer, M.; van Aarde, R.J. Functional diversity mediates contrasting direct and indirect effects of fragmentation on below- and above-ground carbon stocks of coastal dune forests. For. Ecol. Manag. 2018, 407, 174–183. [Google Scholar] [CrossRef] [Green Version]
  21. Ziter, C.; Bennett, E.M.; Gonzalez, A. Functional diversity and management mediate aboveground carbon stocks in small forest fragments. Ecosphere 2013, 4, 1–21. [Google Scholar] [CrossRef]
  22. Ordway, E.M.; Asner, G.P. Carbon declines along tropical forest edges correspond to heterogeneous effects on canopy structure and function. Proc. Natl. Acad. Sci. USA 2020, 117, 7863–7870. [Google Scholar] [CrossRef]
  23. Laurance, W.F.; Laurance, S.G.; Delamonica, P. Tropical forest fragmentation and greenhouse gas emissions. For. Ecol. Manag. 1998, 110, 173–180. [Google Scholar] [CrossRef]
  24. Laurance, W.; Delamônica, P.; Laurance, S.; Vasconcelos, H.; Lovejoy, T. Conservation: Rainforest fragmentation kills big trees. Nature 2000, 404, 836. [Google Scholar] [CrossRef]
  25. Ranta, P.; Blom, T.O.M.; Niemela, J.; Joensuu, E.; Siitonen, M. The fragmented Atlantic rain forest of Brazil: Size, shape and distribution of forest fragments. Biodivers. Conserv. 1998, 7, 385–403. [Google Scholar] [CrossRef]
  26. Iida, S.; Nakashizuka, T. Forest fragmentation and its effect on species diversity in sub-urban coppice forests in Japan. For. Ecol. Manag. 1995, 73, 197–210. [Google Scholar] [CrossRef]
  27. Kozak, J.; Ziółkowska, E.; Vogt, P.; Dobosz, M.; Kaim, D.; Kolecka, N.; Ostafin, K. Forest-Cover Increase Does Not Trigger Forest-Fragmentation Decrease: Case Study from the Polish Carpathians. Sustainability 2018, 10, 1472. [Google Scholar] [CrossRef] [Green Version]
  28. Garmendia, A.; Arroyo-Rodríguez, V.; Estrada, A.; Naranjo, E.J.; Stoner, K.E. Landscape and patch attributes impacting medium- and large-sized terrestrial mammals in a fragmented rain forest. J. Trop. Ecol. 2013, 29, 331–344. [Google Scholar] [CrossRef]
  29. Fahrig, L.; Triantis, K. Rethinking patch size and isolation effects: The habitat amount hypothesis. J. Biogeogr. 2013, 40, 1649–1663. [Google Scholar] [CrossRef]
  30. Bähner, K.W.; Tabarelli, M.; Büdel, B.; Wirth, R. Habitat fragmentation and forest management alter woody plant communities in a Central European beech forest landscape. Biodivers. Conserv. 2020, 29, 2729–2747. [Google Scholar] [CrossRef]
  31. Vogt, P. Quantifying landscape fragmentation. Simpósio Sens. Remoto 2015, 17, 1239–1246. [Google Scholar]
  32. Li, M.; Zhu, Z.; Vogelmann, J.E.; Xu, D.; Wen, W.; Liu, A. Characterizing fragmentation of the collective forests in southern China from multitemporal Landsat imagery: A case study from Kecheng district of Zhejiang province. Appl. Geogr. 2011, 31, 1026–1035. [Google Scholar] [CrossRef]
  33. Estreguil, C.; Mouton, C. Measuring and Reporting on Forest Landscape Pattern, Fragmentation and Connectivity in Europe: Methods and Indicators; JRC Scientific and Technical Reports; Office for Official Publications of the European Communities: Luxembourg, 2009. [Google Scholar]
  34. Meddens, A.J.H.; Hudak, A.T.; Evans, J.S.; Gould, W.A.; González, G. Characterizing forest fragments in boreal, temperate, and tropical ecosystems. Ambio 2008, 37, 569–576. [Google Scholar] [CrossRef] [PubMed] [Green Version]
  35. Carvalho, F.; Carvalho, R.; Mira, A.; Beja, P. Assessing landscape functional connectivity in a forest carnivore using path selection functions. Landsc. Ecol. 2016, 31, 1021–1036. [Google Scholar] [CrossRef] [Green Version]
  36. Siderhurst, L.A.; Griscom, H.P.; Kyger, C.; Stutzman, J.; Trumbo, B. Tree Species Composition and Diversity and the Abundance of Exotics in Forest Fragments of the Shenandoah Valley, Virginia. Castanea 2012, 77, 348–363. [Google Scholar] [CrossRef]
  37. Estreguil, C.; Caudullo, G.; de Rigo, D.; San-Miguel-Ayanz, J. Forest Landscape in Europe: Pattern, Fragmentation and Connectivity; JRC77295; Publications Office of the European Union: Luxembourg, 2012; Available online: https://publications.jrc.ec.europa.eu/repository/handle/JRC77295#:~:text=Forest%20edges%20are%20also%20mainly,by%20mainly%20intensive%20land%20uses (accessed on 14 December 2021).
  38. Broadbent, E.N.; Asner, G.P.; Keller, M.; Knapp, D.E.; Oliveira, P.J.C.; Silva, J.N. Forest fragmentation and edge effects from deforestation and selective logging in the Brazilian Amazon. Biol. Conserv. 2008, 141, 1745–1757. [Google Scholar] [CrossRef]
  39. Meeussen, C.; Govaert, S.; Vanneste, T.; Calders, K.; Bollmann, K.; Brunet, J.; Cousins, S.A.O.; Diekmann, M.; Graae, B.J.; Hedwall, P.-O.; et al. Structural variation of forest edges across Europe. For. Ecol. Manag. 2020, 462, 117929. [Google Scholar] [CrossRef] [Green Version]
  40. Mendes, P.G.A.; Silva, M.A.M.; Guerra, T.N.F.; Lins-e-Silva, A.C.B.; Cavalcanti, A.d.D.C.; Sampaio, E.V.d.S.B.; Rodal, M.J.N. Dynamics and Edge Effect of an Atlantic Forest Fragment in Brazil. Floresta Ambient. 2016, 23, 340–349. [Google Scholar] [CrossRef] [Green Version]
  41. Didham, R.K.; Lawton, J.H. Edge structure determines the magnitude of changes in microclimate and vegetation structure in tropical forest fragments 1. Biotropica 1999, 31, 17–30. [Google Scholar] [CrossRef]
  42. Dodonov, P.; Harper, K.A.; Silva-Matos, D.M. The role of edge contrast and forest structure in edge influence: Vegetation and microclimate at edges in the Brazilian cerrado. Plant Ecol. 2013, 214, 1345–1359. [Google Scholar] [CrossRef]
  43. Almoussawi, A.; Lenoir, J.; Jamoneau, A.; Hattab, T.; Wasof, S.; Gallet-Moron, E.; Garzon-Lopez, C.X.; Spicher, F.; Kobaissi, A.; Decocq, G.; et al. Forest fragmentation shapes the alpha–gamma relationship in plant diversity. J. Veg. Sci. 2019, 31, 63–74. [Google Scholar] [CrossRef] [Green Version]
  44. Riutta, T.; Clack, H.; Crockatt, M.; Slade, E.M. Landscape-Scale Implications of the Edge Effect on Soil Fauna Activity in a Temperate Forest. Ecosystems 2016, 19, 534–544. [Google Scholar] [CrossRef] [Green Version]
  45. Hargis, C.D.; Bissonette, J.A.; Turner, D.L. The influence of forest fragmentation and landscape pattern on American martens. J. Appl. Ecol. 1999, 36, 157–172. [Google Scholar] [CrossRef]
  46. McIntyre, N.E. Effects of forest patch size on avian diversity. Landsc. Ecol. 1995, 10, 85–99. [Google Scholar] [CrossRef]
  47. Ewers, R.M.; Thorpe, S.; Didham, R.K. Synergistic interactions between edge and area effects in a heavily fragmented landscape. Ecology 2007, 88, 96–106. [Google Scholar] [CrossRef]
  48. Bender, D.J.; Contreras, T.A.; Fahrig, L. Habitat loss and population decline: A meta-analysis of the patch size effect. Ecology 1998, 79, 517–533. [Google Scholar] [CrossRef]
  49. Riutta, T.; Slade, E.M.; Morecroft, M.D.; Bebber, D.P.; Malhi, Y. Living on the edge: Quantifying the structure of a fragmented forest landscape in England. Landsc. Ecol. 2014, 29, 949–961. [Google Scholar] [CrossRef]
  50. Harper, K.A.; Macdonald, S.E.; Burton, P.J.; Chen, J.; Brosofske, K.D.; Saunders, S.C.; Euskirchen, E.S.; Roberts, D.A.R.; Jaiteh, M.S.; Esseen, P.-A. Edge influence on forest structure and composition in fragmented landscapes. Conserv. Biol. 2005, 19, 768–782. [Google Scholar] [CrossRef]
  51. Ylisirniö, A.-L.; Mönkkönen, M.; Hallikainen, V.; Ranta-Maunus, T.; Kouki, J. Woodland key habitats in preserving polypore diversity in boreal forests: Effects of patch size, stand structure and microclimate. For. Ecol. Manag. 2016, 373, 138–148. [Google Scholar] [CrossRef]
  52. Pinto, S.R.R.; Mendes, G.; Santos, A.M.M.; Dantas, M.; Tabarelli, M.; Melo, F.P.L. Landscape attributes drive complex spatial microclimate configuration of Brazilian Atlantic forest fragments. Trop. Conserv. Sci. 2010, 3, 389–402. [Google Scholar] [CrossRef]
  53. Baker, S.C.; Spies, T.A.; Wardlaw, T.J.; Balmer, J.; Franklin, J.F.; Jordan, G.J. The harvested side of edges: Effect of retained forests on the re-establishment of biodiversity in adjacent harvested areas. For. Ecol. Manag. 2013, 302, 107–121. [Google Scholar] [CrossRef]
  54. Armenteras, D.; González, T.M.; Retana, J. Forest fragmentation and edge influence on fire occurrence and intensity under different management types in Amazon forests. Biol. Conserv. 2013, 159, 73–79. [Google Scholar] [CrossRef]
  55. Sampaio, A.B.; Scariot, A. Edge effect on tree diversity, composition and structure in a deciduous dry forest in central Brazil. Revista Árvore 2011, 35, 1121–1134. [Google Scholar] [CrossRef]
  56. Nascimento, H.E.M.; Laurance, W.F. Biomass dynamics in Amazonian forest fragments. Ecol. Appl. 2004, 14, 127–138. [Google Scholar] [CrossRef] [Green Version]
  57. Talkkari, A.; Peltola, H.; Kellomäki, S.; Strandman, H. Integration of component models from the tree, stand and regional levels to assess the risk of wind damage at forest margins. For. Ecol. Manag. 2000, 135, 303–313. [Google Scholar] [CrossRef]
  58. Żmihorski, M.; Chylarecki, P.; Rejt, Ł.; Mazgajski, T.D. The effects of forest patch size and ownership structure on tree stand characteristics in a highly deforested landscape of central Poland. Eur. J. For. Res. 2010, 129, 393–400. [Google Scholar] [CrossRef]
  59. Statistics Poland. Statistical Yearbook of Forestry 2021. Available online: https://stat.gov.pl/en/topics/statistical-yearbooks/statistical-yearbooks/statistical-yearbook-of-forestry-2021,12,4.html (accessed on 4 February 2022).
  60. Łonkiewicz, B. Rola i węzłowe problemy planowania przestrzennego w leśnictwie. Prace IBL B 1986, 5, 46–50. [Google Scholar]
  61. Budniak, P. Metoda wyróżniania kompleksów leśnych na podstawie ciągłości obszarów leśnych i zadrzewionych. Sylwan 2020, 164, 820–830. [Google Scholar] [CrossRef]
  62. Jabłoński, M.; Wysocka-Fijorek, E.; Budniak, P. Struktura lasów w Polsce na podstawie danych wielkoobszarowej inwentaryzacji stanu lasu. Sylwan 2017, 161, 267–276. [Google Scholar] [CrossRef]
  63. QGIS.org. QGIS Geographic Information System. QGIS Association. 2021. Available online: https://qgis.org/en/site/ (accessed on 18 May 2021).
  64. Zielony, R.; Rabenda, M. Lesny obszar funkcjonalny Puszcza Kozienicka. Stud. I Mater. Cent. Edukac. Przyr. Leśnej 2008, 10, 119–129. [Google Scholar]
  65. Laurance, W.F. Theory meets reality: How habitat fragmentation research has transcended island biogeographic theory. Biol. Conserv. 2008, 141, 1731–1744. [Google Scholar] [CrossRef]
  66. Murcia, C. Edge effects in fragmented forests: Implications for conservation. Trends Ecol. Evol. 1995, 10, 58–62. [Google Scholar] [CrossRef]
  67. Core Team R. R: A Language and Environment for Statistical Computing. R Foundation for Statistical Computing, Vienna. 2013. Available online: https://www.r-project.org/ (accessed on 12 October 2021).
  68. Harald, A.; Gonzalez, P.; Gytarsky, M.; Krug, T.; Kurz, W.A.; Ogle, S.; Raison, J.; Schoene, D.; Ravindranath, N.H.; Elhassan, N.G.; et al. Agriculture, Forestry and Other Land Use: Forest land (AFOLU). 2006. Available online: https://www.thegef.org/what-we-do/topics/agriculture-forestry-and-other-land-uses (accessed on 20 December 2021).
  69. Girvetz, E.H.; Greco, S.E. How to define a patch: A spatial model for hierarchically delineating organism-specific habitat patches. Landsc. Ecol. 2007, 22, 1131–1142. [Google Scholar] [CrossRef]
  70. Mesquita, R.C.G.; Delamônica, P.; Laurance, W.F. Effect of surrounding vegetation on edge-related tree mortality in Amazonian forest fragments. Biol. Conserv. 1999, 91, 129–134. [Google Scholar] [CrossRef]
  71. Mohandass, D.; Campbell, M.J.; Davidar, P. Impact of patch size on woody tree species richness and abundance in a tropical montane evergreen forest patches of south India. J. For. Res. 2018, 29, 1675–1687. [Google Scholar] [CrossRef]
  72. Majumdar, K.; Datta, B.K. Effects of patch size, disturbances on diversity and structural traits of tropical semi-evergreen forest in the lowland Indo Burma hotspot: Implication on conservation of the threatened tree species. J. Mt. Sci. 2016, 13, 1397–1410. [Google Scholar] [CrossRef]
  73. Hill, J.L.; Curran, P.J. Species composition in fragmented forests: Conservation implications of changing forest area. Appl. Geogr. 2001, 21, 157–174. [Google Scholar] [CrossRef]
  74. Estevan, H.; Lloret, F.; Vayreda, J.; Terradas, J. Determinants of woody species richness in Scot pine and beech forests: Climate, forest patch size and forest structure. Acta Oecolog. 2007, 31, 325–331. [Google Scholar] [CrossRef]
  75. Schwartz, N.B.; Uriarte, M.; DeFries, R.; Bedka, K.M.; Fernandes, K.; Gutiérrez-Vélez, V.; Pinedo-Vasquez, M.A. Fragmentation increases wind disturbance impacts on forest structure and carbon stocks in a western Amazonian landscape. Ecol. Appl. 2017, 27, 1901–1915. [Google Scholar] [CrossRef] [PubMed]
  76. Chen, J.; Franklin, J.F.; Spies, T.A. Vegetation responses to edge environments in old-growth Douglas-fir forests. Ecol. Appl. 1992, 2, 387–396. [Google Scholar] [CrossRef]
  77. Gonzalez, M.; Ladet, S.; Deconchat, M.; Cabanettes, A.; Alard, D.; Balent, G. Relative contribution of edge and interior zones to patch size effect on species richness: An example for woody plants. For. Ecol. Manag. 2010, 259, 266–274. [Google Scholar] [CrossRef]
  78. Kupfer, J.A.; Malanson, G.P.; Franklin, S.B. Not seeing the ocean for the islands: The mediating influence of matrix-based processes on forest fragmentation effects. Glob. Ecol. Biogeogr. 2006, 15, 8–20. [Google Scholar] [CrossRef]
  79. King, A.J.; Melbourne, B.A.; Davies, K.F.; Nicholls, A.O.; Austin, M.P.; Tuff, K.T.; Evans, M.J.; Hardy, C.M.; Cunningham, S.A. Spatial and temporal variability of fragmentation effects in a long term, eucalypt forest fragmentation experiment. Landsc. Ecol. 2018, 33, 609–623. [Google Scholar] [CrossRef]
  80. Silva Junior, C.H.L.; Aragão, L.E.O.C.; Anderson, L.O.; Fonseca, M.G.; Shimabukuro, Y.E.; Vancutsem, C.; Achard, F.; Beuchle, R.; Numata, I.; Silva, C.A.; et al. Persistent collapse of biomass in Amazonian forest edges following deforestation leads to unaccounted carbon losses. Sci. Adv. 2020, 6, eaaz8360. [Google Scholar] [CrossRef]
Figure 1. An example scheme showing distribution of NFI plots against the background of forest fragments.
Forests 13 00590 g001
Figure 2. Scheme of generalization of forest fragments into forest patches (4 forest patches were created from 30 forest fragments (see Figure 1)), differentiation of zones of forest patches (edge, interior), and evaluation of NFI plots location.
Forests 13 00590 g002
Figure 3. Results of statistics calculated for the growing stock volume density of pine stands on the FCF site, divided into the edge and interior zone.
Forests 13 00590 g003
Figure 4. Results of statistics calculated for the growing stock volume density of pine stands on the FMCF site, divided into the edge and interior zone.
Forests 13 00590 g004
Figure 5. Results of statistics calculated for the growing stock volume density of pine stands on the FMBF site, divided into the edge and interior zone.
Forests 13 00590 g005
Figure 6. Changes in the mean carbon volume density in the site of FCF, divided into the edge and interior zone.
Forests 13 00590 g006
Figure 7. Changes in the mean carbon volume density in the site of FMCF, divided into the edge and interior zone.
Forests 13 00590 g007
Figure 8. Changes in the mean carbon volume density in the site of FMBF, divided into the edge and interior zone.
Forests 13 00590 g008
Figure 9. Local regression model determining the impact of the area of a forest patch on the percentage of the edge zone.
Forests 13 00590 g009
Table 1. Results of the correlation of Spearman ranks, features characterizing wood resources (the relationship was considered significant at p ≤ 0.05).
Featurevgzv
v-r = 0.918, p < 0.001r = 0.683, p < 0.001
gr = 0.918, p < 0.001-r = 0.601, p < 0.001
zvr = 0.683, p < 0.001r = 0.601, p < 0.001-
Table 2. Mixed linear model results of differences in the growing stock volume between the edge and the interior (differences were considered significant at p ≤ 0.05).
Forest Site TypeAge Class
234567891011
FCF0.001 *0.6810.002 *0.2090.036 *0.5290.4460.1760.043 **0.617
FMCF0.033 *0.1260.6400.5130.1290.5920.029 **0.030 **0.3760.245
FMBF0.5240.6120.4470.4420.030 **0.2600.4300.025 **0.3710.011 **
* growing stock volume significantly higher in edge zones. ** growing stock volume significantly higher in interior zones, they were bolded.
Table 3. Median of the growing stock volume (m3/ha) in the edge (E) and in the interior (I).
Forest Site TypeAge Class
234567891011
EIEIEIEIEIEIEIEIEIEI
FCF4530108106229173249234311268284287339310286334266336339325
FMCF8163149160259244327321330350334356325382337403353399347384
FMBF7278179175267274321348360378368384354409383429394463306474
Table 4. R2 results for the linear relationship between the growing stock volume on the plots and the natural logarithm calculated from the area of the forest patches.
Forest Site TypeAge Class
234567891011
FCF0.01<0.01<0.01<0.01<0.010.03<0.010.030.010.06
FMCF0.020.01<0.01<0.010.020.020.060.040.060.02
FMBF<0.01<0.01<0.01<0.010.050.030.040.090.020.06
Table 5. R2 results for the linear relationship between the growing stock volume on the plots and the percentage of edge zones in the forest patches area.
Forest Site TypeAge Class
234567891011
FCF0.02<0.01<0.01<0.01<0.010.010.020.010.010.01
FMCF0.03<0.010.02<0.010.020.020.030.050.050.03
FMBF<0.01<0.010.03<0.010.070.070.030.10<0.010.12
Table 6. Mean (M) volume of carbon (tonne/ha), with confidence intervals (CI) in the edge (E) and in the interior (I).
Forest Site TypeVariableAge Class
234567891011
EIEIEIEIEIEIEIEIEIEI
FCFCI−3323576010187115113131128122135139144131153109153123151
M4326716311890131117142131145139167148156157134158164159
CI+5330856613694148120152134167142195151180161158162205167
FMCFCI−43388791125125156156162173173175160188175196173199153200
M48429595137130166160171177185179183194194202204206262211
CI+544610299149135176164180181196183206200212207234213370223
FMBFCI−3744100103134149143177170201195212196224187240209251172255
M4952116111149158163184183207213219220232225247239261217271
CI+6160132119164167183192196213230226243240263254269271262287
Publisher’s Note: MDPI stays neutral with regard to jurisdictional claims in published maps and institutional affiliations.

