Article

How Potential Evapotranspiration Regulates the Response of Canopy Transpiration to Soil Moisture and Leaf Area Index of the Boreal Larch Forest in China

1
School of Forestry, Northeast Forestry University, Harbin 150040, China
2
Key Laboratory of Sustainable Forest Ecosystem Management-Ministry of Education, Northeast Forestry University, Harbin 150040, China
*
Author to whom correspondence should be addressed.
Forests 2022, 13(4), 571; https://doi.org/10.3390/f13040571
Submission received: 5 March 2022 / Revised: 29 March 2022 / Accepted: 31 March 2022 / Published: 4 April 2022
(This article belongs to the Special Issue Forest Ecohydrology: From Theory to Practice)

Abstract

:
Transpiration is a critical component of the hydrological cycle in the terrestrial forest ecosystem. However, how potential evapotranspiration regulates the response of canopy transpiration to soil moisture and leaf area index of the boreal larch forest in China has rarely been evaluated. The present study was conducted in the larch (Larix gmelinii (Rupr.) Rupr.) forest, which is a typical boreal forest in China. The canopy transpiration was measured using sap flow techniques from May to September in 2021 and simultaneously observing the meteorological variables, leaf area index (LAI) and soil moisture (SWC). The results showed that there were significant differences in canopy transpiration of Larix gmelinii among the months. The correlation and regression analysis indicated that canopy transpiration was mainly influenced by potential evapotranspiration (PET), while the effect of soil moisture on canopy transpiration was lowest compared with other environmental factors. Furthermore, our results revealed that the effect of PET on canopy transpiration was not regulated by soil moisture when soil moisture exceeded 0.2 cm3 cm−3. More importantly, under the condition of sufficient soil moisture, it was demonstrated that the response of canopy transpiration to leaf area index was limited when PET exceeded 9 mm/day. These results provide valuable implications for supporting forest management and water resource utilization in the boreal forest ecosystem under the context of global warming.

1. Introduction

The terrestrial forest ecosystem provides a vital link to control the water exchange between land surface and atmosphere as well as to sequester the carbon by photosynthesis. In particular, boreal forest biomes cover approximately 11% of the area on the Earth’s surface [1], which plays an important role in maintaining the stability of the terrestrial forest ecosystem. Thus, the interest in the functions and role of the boreal forest ecosystem in water resources is increasing, especially for the transpiration across the globe [2,3,4,5].
Canopy transpiration is a crucial process of forest hydrological cycling, which couples the soil moisture and atmosphere interactions [6,7,8,9]. The results at a global scale showed that canopy transpiration accounts for about 39% of precipitation and more than 60% of evapotranspiration [10,11]. In past decades, due to the frangibility and sensitivity of the boreal forest ecosystem to climatic change [2], canopy transpiration has been increasingly influenced by global climate warming and extreme weather events [12]. With the significant progress of afforestation projects in China, such as the Natural Forest Protection Project, the boreal forest coverage in China has been greatly improved, which has greatly affected the hydrological cycle of the forest ecosystem [5,13]. Thus, determining the canopy transpiration dynamics of boreal forest in a changing environment is greatly important for better understanding the plant survival strategies and the impact of vegetation on related eco-hydrological processes.
Numerous studies analyze the response of canopy transpiration to environmental factors including air temperature, vapor pressure deficit, soil moisture, precipitation, etc. [14,15,16,17]. For example, Zhang et al. [18] concluded that increasing vapor pressure deficit promotes canopy transpiration until a certain threshold, while Han et al. [19] found the precipitation has a negative effect on canopy transpiration. However, most often, case studies have only paid attention to the single impact of meteorological factors on canopy transpiration [17,20,21]. We know that environmental factors occur concurrently under natural conditions and that canopy transpiration is affected by the interaction effects of environmental factors. However, the response mechanism of canopy transpiration to the interaction of environmental factors in the boreal forest of China is not clear.
Canopy transpiration is affected by many environmental factors, which can be divided into three aspects including atmospheric evaporative demand, such as potential evapotranspiration [9,22], soil water supply (such as soil moisture) and vegetation phenophase, such as leaf expanding or defoliation [9,23]. In previous work, some studies reported the effects of potential evapotranspiration and soil moisture on transpiration [9,21,22]. For instance, Wan et al. [24] found that soil moisture limits the response of transpiration to potential evapotranspiration. However, numerous studies only consider the atmospheric evaporative demand and water supply and ignore the change in vegetation phenophase during the growing season. Vegetation phenology reflects the dynamic of vegetation growth via leaf area variations and consequently affects the canopy transpiration [23]. Thus, analyzing how potential evapotranspiration mediates the influence of soil water supply and leaf area variation on canopy transpiration is of great significance in the boreal forest regions of China.
The native larch (Larix gmelinii (Rupr.) Rupr.) forest represents the typical zonal vegetation and prominent community of boreal forest ecosystems in northeast China, which is the southern margin of the Siberian zone and one of the largest boreal forests underlying wide permafrost in the world [25,26]. In the present study, a consecutive measurement of sap flow from May to September in 2021 in the natural forest of Larix gmelinii was performed: (1) to investigate the dynamics of canopy transpiration of Larix gmelinii forest in the growing season at different timescales, (2) to clarify the relationships between canopy transpiration and environmental factors, (3) to identify the role of soil moisture in canopy transpiration of Larix gmelinii forest, and (4) to reveal how potential evapotranspiration mediates the influence of leaf area variation on canopy transpiration of Larix gmelinii forest. These can be exploited to improve forest-water management and ecologically sustainable development, as well as to predict the effect of climate change on vegetation growth in the future.

2. Materials and Methods

2.1. Study Site

The present study was performed in the Mohe Forest Ecosystem Research station (MFERs, 53°27′59″ N, 122°20′06″ E), and the native forest is dominated by the Larix gmelinii, which represents the principal community of boreal forest ecosystems in China (Figure 1). The study site has a typical cold temperate continental monsoon climate with mean annual precipitation and temperature being 460.8 mm and −5.5 °C, respectively, from 1959 to 2017. The distribution of intra-annual precipitation was uneven and accounted for approximately 70% of the precipitation that occurred during the growing season. The soil in the study area is the Gleyic Cambisols (https://www.fao.org/soils-portal/soil-survey/soil-maps-and-databases/, accessed on 2 January 2022), and its thickness varies between 20–50 cm [27].

2.2. Forest Structure Characteristics

The field experiment was conducted in the natural forest of Larix gmelinii from May to October in 2021. A sample plot with 20 × 20 m was established and the stand density was 1250 trees per hectare. Meanwhile, the forest structure characteristics were measured, which include mean diameter at breast height (DBH), tree height, tree age and total sapwood area (SA) of sample plot, which were 13.1 ± 6.74 cm, 17.35 ± 2.56 m, 75–90 years and 2950.53 cm2 (Table 1), respectively. The main understory of the experiment plot is mainly dominated by Dahurian rhododendron (Rhododendron dauricum), which covered approximately 70% of the area in the study sample plot.
The leaf area index (LAI, m2 m−2) is an important indicator of vegetation canopy structure to characterize the growing status and water use of forests [8,9]. In the present study, the LAI of the experiment stand was measured every 5–7 days on sunny days from May to September in 2021 using Plant Canopy Analyzer (LAI-2200, Li-Cor, Lincoln, NE, USA). For each measurement, 25–30 points within the sample plot were selected and we obtained the mean LAI. Subsequently, the functional relationship between LAI and the measurement date (day of the year, DOY) was established. As shown in Figure 2, the coefficient of determination (R2) reached 0.938 (LAI = −0.0002 × DOY2 + 0.0811 × DOY−5.8637, p < 0.01, and consequently the daily LAI value was derived from interpolation using this functional relationship [9].

2.3. Sap Flow Measurement, Sapwood Area Determination and Estimation of Canopy Transpiration

In the present study, the nine sample trees were selected for sap flow measurement from 1 May to 30 September in 2021 (Table 2). We adopted the Granier’s thermal dissipation probes [28] to monitor the sap flow density (Js, g cm–2 s−1). Each thermal dissipation probe sensor was inserted into the trunk at a height of 1.3 m above the ground and minimizes the effect of radiation on sap flow [28]. The data were saved at 30 min intervals using a CR1000 datalogger (Campbell Scientific, Logan, UT, USA). The sap flow density (Js, g cm–2 s−1) can be expressed as follows:
J s   =   0 . 0119   ×   ( Δ T max     Δ T Δ T ) 1 . 231
where Js is sap flow density; ΔTmax is the maximum ΔT between sensors at nighttime, for which the sap flow density is close to zero. ΔT is the temperature difference between the two thermal dissipation probes [21,29].
The 25 trees around the sample plot were selected to estimate the relationship between the DBH and SA using an exponential regression. Firstly, the DBH of each tree was measured using a digital caliper. Then, the sapwood thickness of each tree was determined through distinguishing from the heartwood using the color change method [21,30]. Finally, the relationship between DBH and SA can be expressed as follows:
SA   =   a   ×   DBH b
where SA and DBH are sapwood area and diameter at breast height, respectively, a and b are parameters.
The canopy transpiration was estimated from sap flow density. Daily canopy transpiration per unit ground area (EC, mm/d) and canopy transpiration per unit leaf area (EL, mm/d) can be calculated [21,31,32,33] as Equations (3) and (4):
Ec   =   J s a   ×   S A c u m A S
E L   =   Ec LAI
where Jsa is the average sap flow density of all sample trees, SAcum is the cumulative sapwood area of the sample plot and As is the sample plot area (Table 1). LAI is the leaf area index (Figure 2a). Meanwhile, the day-time Ec and night-time Ec were determined by the local time of sunrise (at 6:00) and sunset (at 18:00), respectively.

2.4. Canopy Conductance Estimation

Canopy conductance (GL, mmol m−2 s−1) was estimated from EL using a simplified inverted Penman–Monteith equation [21] can be expressed as follows:
G L   =   K G E L V P D
K G   =   115.8   ±   0.4236   ×   Ta
where, VPD is the vapor pressure deficit (KPa); Ta is the air temperature (°C); KG is the conductance coefficient (kPa m3 kg−1). Furthermore, the data were excluded on rainy days and when VPD < 0.4 kPa to minimize relative errors [17,21,22]

2.5. Meteorological Variables Measurements

In the present study, the meteorological variables were measured by the Gradient meteorological observation system installed on a 36 m tower, including the air temperature (Ta, °C), relative humidity (RH, %), wind speed (Ws, m s−1). Precipitation (P, mm) was measured at the 23 m height of the tower. Photosynthetically active radiation (PAR, mol m−2 d−1) and net radiation (Rn, W m−2) was measured by an automatic weather station located in open areas neighboring the study plot. Soil moisture was measured at 5, 10, 20 and 40 cm soil depth using CS650 probes (Campbell Scientific, Logan, UT, USA) in the study plot, respectively. The profile soil moisture (SWC), which refers to the soil moisture covering the depth range between 0–40 cm, was expressed as Equation (5) [34]. All the data were saved at 30 min intervals using a CR3000 datalogger (Campbell Scientific, Logan, UT, USA). Meanwhile, the vapor pressure deficit (VPD, KPa) was calculated using the air temperature and relative humidity [35].
SWC   =   θ 1   ×   L 1   +   i   =   2 4 θ i     1   +   θ i 2   ×   L i L
where SWC is the mean of SWC at depths of 0–40 cm. θi at Li (i = 1, 2, 3, and 4) represents the soil moisture contents at depths of 5, 10, 20, and 40 cm, and L denotes the observation depth of the soil profile (40 cm).
VPD   =   0 . 611   ×   ( 1     RH )   ×   exp ( 17 . 502   ×   T a T a   +   240.97 )
where VPD represents the vapor pressure deficit (KPa), and RH and Ta are air temperature (Ta, °C) and relative humidity (RH, %), respectively.
The FAO Penman–Monteith equation was used to estimate the potential evapotranspiration (PET) during the study period [36,37]:
PET   =   0.408 Δ R n     G   +   γ   ×   900 T a   +   273   ×   U 2     e s     e a Δ   +   γ   ×   1   +   0 . 34   ×   U 2
where Δ is the slope of the vapor press curve ((kPa °C−1), Rn is the net daily radiation (W m−2), G is the soil heat flux into the ground (MJ m−2), γ is the psychrometric constant (kPa °C−1), es is the saturation vapor pressure (kPa), ea is the actual vapor pressure (kPa), U2 is the mean wind speed (m s−1) at 2 m height, and Ta is the air temperature at a 2 m height. The detailed calculation procedure of each parameter can be found in McMahon et al. [37].

2.6. Statistical Analysis of Data

To analyze the role of soil moisture in the response of canopy transpiration to atmospheric evaporative demand, canopy transpiration per unit leaf area (EL) was selected to minimize the effect of vegetation growth in the growing season.
The relationship between canopy transpiration and environmental factors was detected by Person correlation coefficient and linear or nonlinear regression. All statistical analyses were performed using IBM SPSS 24.0 statistics software (SPSS Inc., Chicago, IL, USA) and figures were prepared with Origin Pro 2021 software (Origin Lab Inc., Northampton, MA, USA). All statistical analyses were at the 0.05 significance level.

3. Results

3.1. Relationship between SA and DBH

In the present study, 25 trees of different DBH around the sample plot were selected to establish the relationship between SA and DBH using an exponential regression. As shown in Figure 3, the coefficient of determination (R2) reached 0.96 (SA = 0.5708 × DBH1.7452, p < 0.01), which demonstrated that the SA was significantly related to DBH. According to the exponential regression, the total SA of the study plot was obtained, which was 2950.53 cm2.

3.2. Atmospheric, Soil Moisture and Growth Index

It can be seen from Figure 4 that the daily Ws varied between zero and 0.65 m/s (Figure 4a). The mean daily VPD was 0.39 KPa during the study period (Figure 4b). The daily mean RH and Ta were 77.51% (Figure 4c) and 14.51 °C (Figure 4d), with a range of 34.08% to 99.90% and 2.60 °C to 24.04 °C, respectively. Meanwhile, the mean daily PAR and Rn were 342 μmol m−2 s−1 and 103.4 W m−2 in the growing season ranging from 51.6 to 646.5 μmol m−2 s−1 (Figure 4e) and 16.6 to 189.6 W m−2 (Figure 4h), respectively. A similar trend was found in PET (Figure 4g), which ranged from 0.3 to 11.9 mm, with mean daily PET being 4.7 mm. As shown in Figure 4f, the SWC in the early stage of the study period was increased due to the soil thawing processes, and subsequently, the change in SWC was significantly related to the precipitation event. The cumulative P (Pcum) from May to September was 557.9 mm (Figure 4j), of which the monthly precipitation was unevenly distributed and the highest monthly precipitation was 131.7 mm, occurring in June (Figure 4i).

3.3. Seasonal Variation in Canopy Transpiration

3.3.1. Daily Dynamics of Ec and EL

Figure 5 exhibits the canopy transpiration dynamics that shows that the changing trend in the daily Ec, daily EL and day-time Ec was similar, which increased gradually from May to July, and then decreased from August to September, while the variations in night-time Ec was relatively stable in the study period as compared with others. The range of daily Ec in the study period was 0.04 to 1.25 mm, with a mean value of 0.60 mm. For the daily EL, the mean value was 0.29 mm, with a range of 0.02 to 0.58 mm. In addition, the mean values of day-time and night-time Ec were 0.52 and 0.08 mm, with the maximum values reaching 1.12 and 0.19 mm occurring in August and September, respectively, while the minimum values of day-time and night-time Ec both reached 0.01 mm, which was found in September.

3.3.2. Monthly Ec Dynamics

As shown in Figure 6a, the mean daily Ec, day-time Ec and night-time Ec in June, July and August were significantly higher (p < 0.01) than for May and September. However, no statistically significant (p > 0.05) difference was found between May and September. Furthermore, monthly Ec, day-time Ec and night-time Ec show a single peak trend (Figure 6b). The highest monthly Ec and day-time Ec occurred in July, while the highest night-time Ec was found in June. Aside from that, Figure 6c shows that the percentage of monthly Ec, day-time Ec and night-time Ec to P is about 7.37% to 22.49%, 6.30% to 19.60% and 1.06% to 2.90%, respectively. In addition, the total Ec, day-time Ec and night-time Ec were 92.04, 80.20 and 11.84 mm, accounting for 16.50%, 14.38%, and 2.12% of P in the growing season, respectively.

3.4. Relationship between Canopy Transpiration and Environmental Factors

3.4.1. Correlation Analysis

To reveal the relationship between canopy transpiration and environmental factors, Pearson correlation analysis was used. At a monthly scale, the atmospheric evaporative demand indices including VPD, PET, PAR and Rn were significantly positively correlated with Ec in each month (Table 3); however, the RH was negatively related to Ec. For the SWC and LAI, the significant correlation with Ec was only observed in the early and later stages of the growing season. For the whole study period, the correlation between PET and Ec was highest than that for the SWC and LAI (Table 3).

3.4.2. Regression Analysis

To better understand the effects of environmental factors on Ec, the atmospheric evaporative demand indices (PET, VPD, PAR, RH, Ta, Rn and Ws), water supply indicator (SWC) and vegetation growth index (LAI) were selected. For atmospheric evaporative demand indices, Figure 7 shows that the PET impact on Ec was greater than that for the other atmospheric evaporative indices (VPD, PAR, RH, Ta, Rn and Ws), which explained 71% of the variation in Ec. Furthermore, the Ec increased with increased LAI (Figure 7i) and explained 46% of the variation in Ec during the study period. For the water supply indicator (Figure 7h), however, the SWC only explained 19% of the Ec change, which was lower than for the atmospheric evaporative demand indices and vegetation growth index.

3.5. Relaotionship between Canopy Conductance and Vapor Pressure Deficit

The relationship between GL and VPD was estimated using the linear logarithmic function. As shown in Figure 8, the coefficient of determination (R2) reached 0.54 (GL = −55.15 × ln (VPD) + 61.21, p < 0.01), which demonstrated that the GL significantly decreased with an increasing VPD during the study period. In other words, the VPD explained 54% of the GL change.

3.6. The Interaction Effects of SWC, LAI and PET on Canopy Transpiration

3.6.1. Responses of Canopy Transpiration to PET under Varying SWC

Through the analysis of Section 3.4, the PET as a compound index can effectively characterize the atmospheric evaporative demand rather than a single climate variable. We used the exponential function to fit the relationship between PET and EL in varying SWC. The R2 of each regression was higher than for the 0.51 (Table 4), which reflected that the results were reliable. Meanwhile, Figure 9a exhibits that the response of EL to PET was similar and mainly restricted by PET when SWC was more than 0.2 cm3 cm−3. To test this, we also investigated the relationships between the EL and SWC (more than 0.2 cm3 cm−3) at varied PET levels (Figure 9b and Table 5). Our results indicated that the EL was not affected by the SWC at different PET levels when SWC was greater than 0.2 cm3 cm−3 (Figure 9b) and the R2 of each regression was lower than that the 0.085 (Table 5). These results demonstrated that the PET is the dominant factor controlling the change of canopy transpiration when SWC is more than 0.2 cm3 cm−3.

3.6.2. PET Mediates the Response of Canopy Transpiration to LAI

According to the results of Section 3.6.1, the SWC had no significant effects on the Ec when SWC was more than 0.2 cm3 cm−3. Thus, providing an excellent opportunity to assess how the PET regulates the response of Ec to LAI under the elimination of the effect of soil moisture is crucial. Figure 10a and Table 6 show that the significant linear relationship between Ec and LAI was observed (p < 0.05) when PET < 9 mm/day, for which Ec increases when LAI increases. However, when PET > 9 mm/day, there was no statistically significant relationship between Ec and LAI (p > 0.05). Moreover, as shown in Figure 10b and Table 7, when PET > 9 mm/day, the Ec did not increase, but showed a slightly decreasing trend with the increase in PET (p > 0.05). These results demonstrated that the PET limits the effect of LAI on Ec when PET > 9mm/day.

4. Discussion

Canopy transpiration is one of the crucial methods of water consumption in the forest ecosystem, which affects the forest hydrological processes [19,
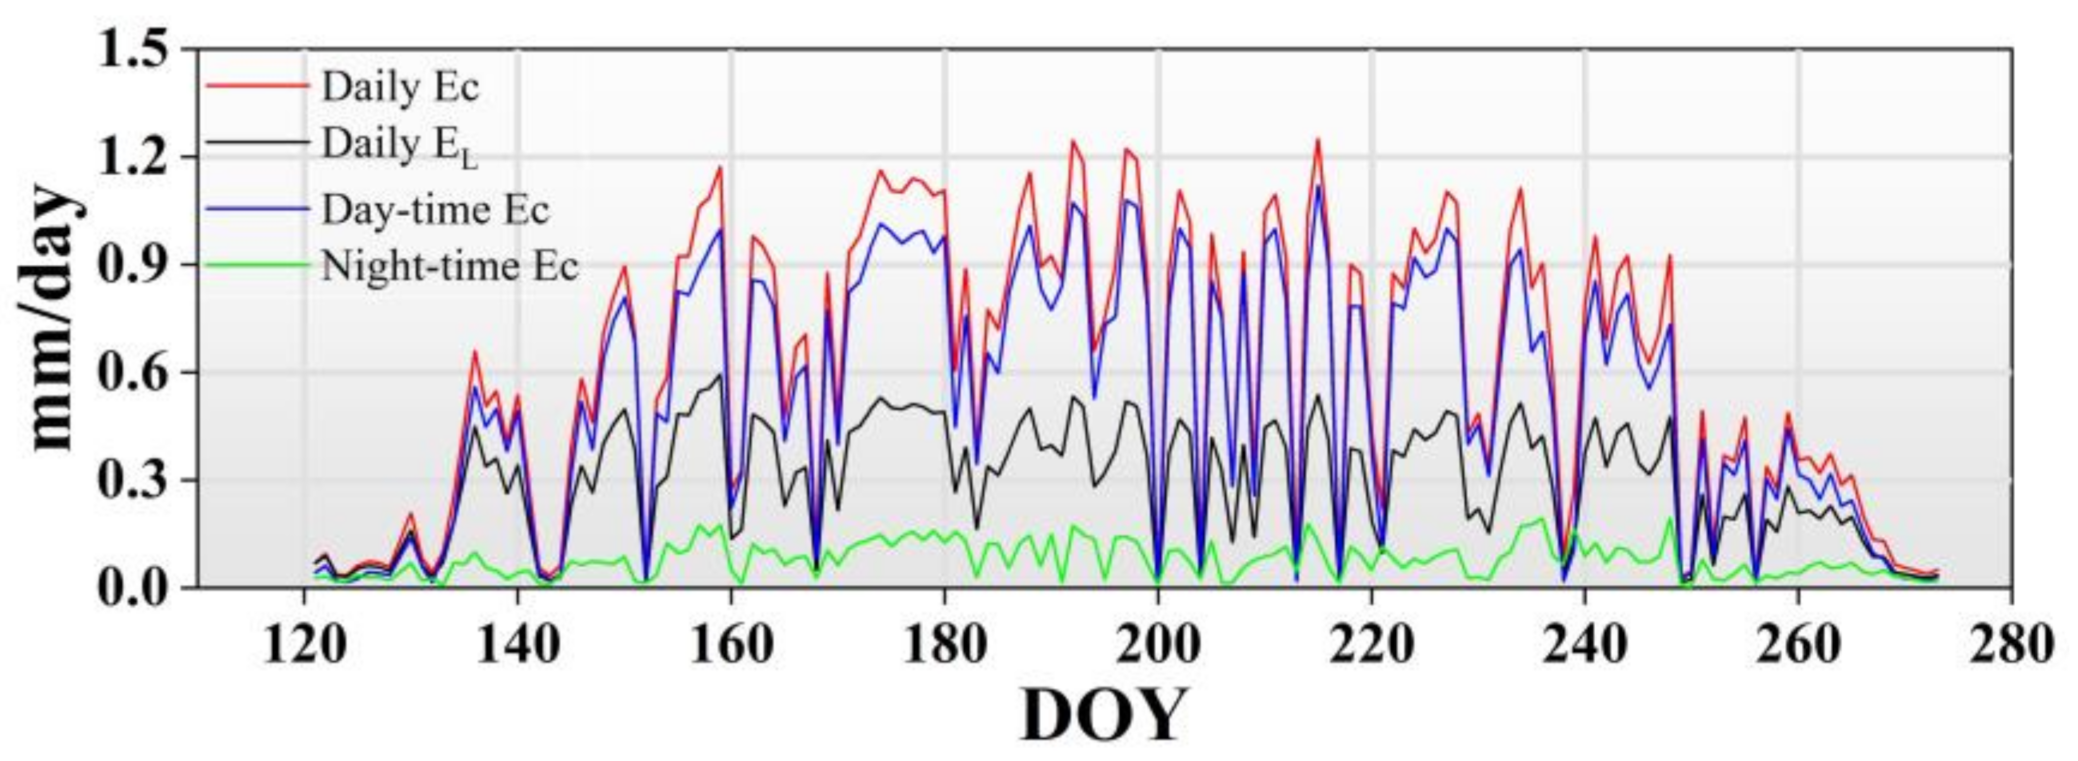
38]. Knowledge of canopy transpiration is greatly important for the forest–water relationship under the background of carbon neutrality. In the present study, the daily mean Ec was 0.60 mm/day accounting for 16.50% of P during the measurement period, which was in a reasonable range compared with previous studies [9,17,19,21]. For instance, Wang et al. [9] reported that the mean daily canopy transpiration of Larch was 0.70 mm/day, ranging from 0.02 to 1.55 mm in the growing season of 2018. However, we also found that the canopy transpiration of the present study was lower than the same tree species in the previous study [26]. The difference in Ec may be caused by forest structure and climate condition of the measurement period. In the present study, the stand density was 1250 trees ha−1, which was significantly lower than that for the 2350 trees ha−1 of Liu et al. [26]. Wang et al. [4] demonstrated that the thinning significantly reduced daily transpiration at a stand scale. Moreover, the precipitation in the study period was greatly higher than the mean annual precipitation from 1957 to 2017. Wullschleger and Hanson [39] indicated that excessive precipitation limited the level of transpiration. These reasons largely account for the lower daily canopy transpiration in the present study.
During the growing season, there were significant monthly dynamics in canopy transpiration. The higher canopy transpirations were found in June, July and August, which is consistent with other studies [19,38,40]. However, previous studies also suggested that the canopy transpiration of Mongolian pine trees in May was higher than the other months attributed to the high-growth period [41]. It is maybe closely related to the monthly dynamic of vegetation growth and climate conditions. It can be seen from 
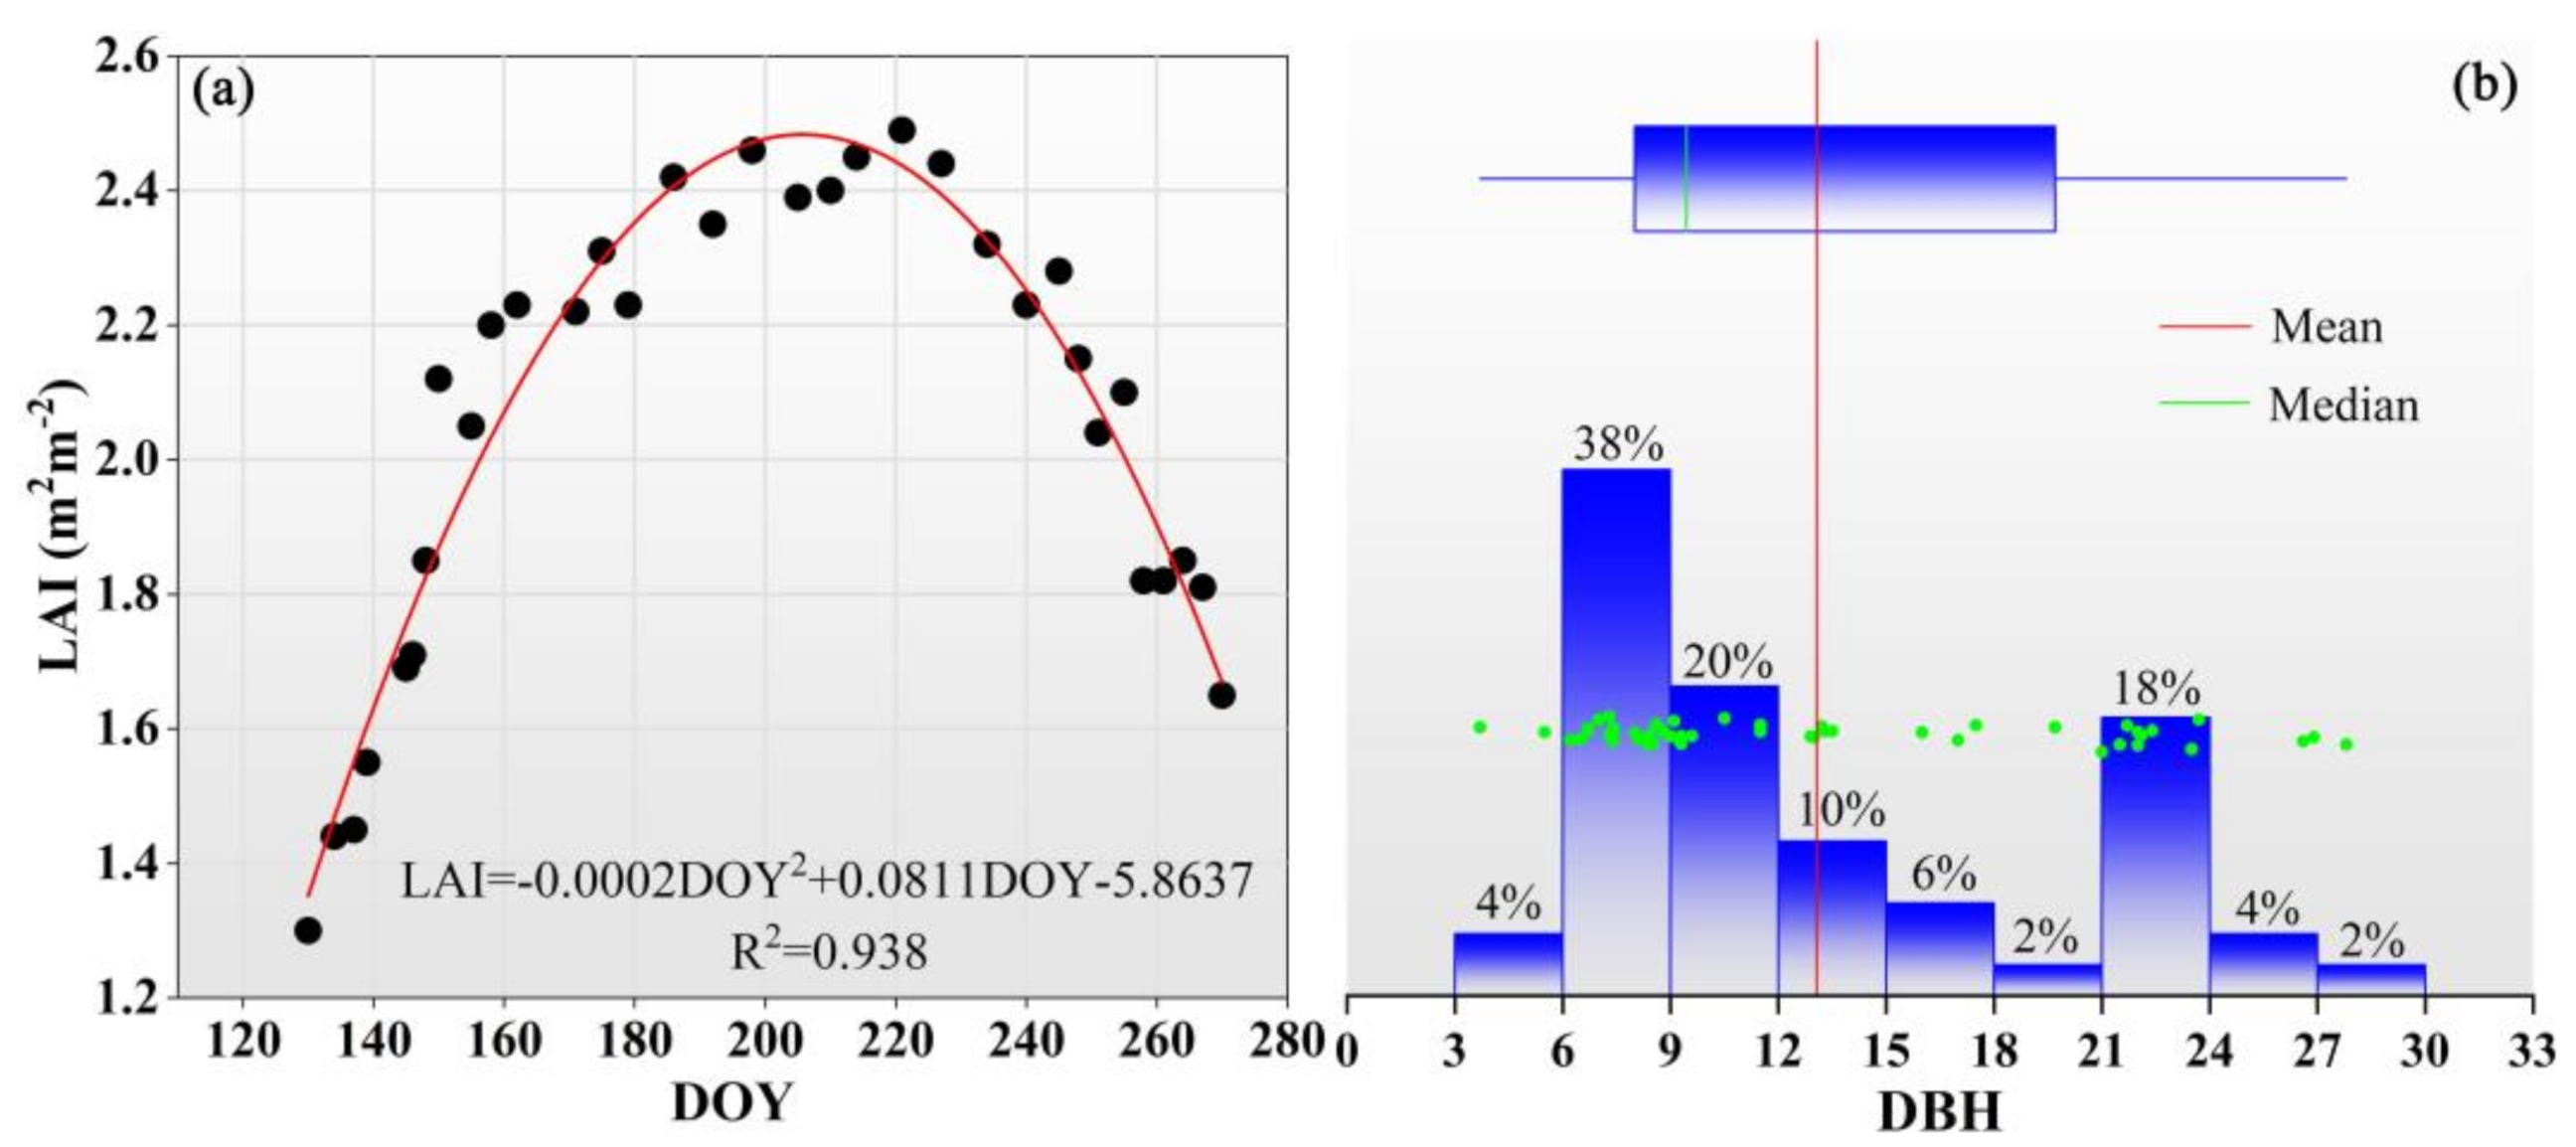
Figure 4 that the LAI and Ta in June, July and August were significantly higher than that of May and September in the present study, which leads to the higher canopy transpiration. Additionally, although the VPD and PAR in August were similar to May and September, the LAI and Ta were higher and subsequently promote canopy transpiration.
In addition, the results of correlation and regression analysis showed a significant relationship between Ec and environmental factors (Table 3 and Figure 7), which was consistent with the previous studies [42,43,44,45]. For instance, the relationship between Ec and PET has exhibited the exponential threshold function (Figure 7) and indicated that Ec increases rapidly with the increasing of PET and then tended to be saturation when PET continued to increase. Wieser et al. [42] suggested that the canopy stomatal conductance decreased with the increase in VPD. As shown in Figure 8, our study also demonstrated that the canopy conductance (GL) significantly decreased with the increase in VPD. Another possible reason is that the stomata need to be closed through the plant self-protection mechanism to maintain canopy transpiration to avoid excessive water consumption at higher atmospheric evaporative demand [42,46,47]. Furthermore, in the present study, PET as a compound index is the major driver of transpiration rather than a single environmental variable. Similarly, Song et al. [21] reported that the effects of PET on transpiration in three forest management areas of NE China were stronger than those of the other environmental variables. It is revealed that the compound index characterizing the atmospheric evaporative demand can better explain the change in transpiration. However, we found that the effect of soil moisture on the Ec of the Larix gmelinii forest was lowest compared with other environment variables. Similar results were observed in the semiarid region and boreal forest [3,21,48,49]. On the contrary, some studies revealed that canopy transpiration is significantly influenced by soil moisture [50]. These different results may be closely attributed to the different tree species, root distribution and climate conditions. Chu et al. [51] reported that the root of Larix gmelinii forest was mainly distributed in topsoil [52] combined with the excessive precipitation in the study period, which led to sufficient soil moisture in topsoil to maintain water consumption of canopy transpiration and consequently the soil moisture was not the main limiting environmental factor of canopy transpiration of Larix gmelinii forest.
Generally, canopy transpiration is influenced by the interaction effects of multiple environmental variables under natural conditions [53]. In the present study, when soil moisture was more than 0.2 cm3 cm−3 (accounting for 94.77% (145 days) of the whole study period (153 days)), we found that the effect of PET on canopy transpiration was not limited by soil moisture. It is indicated that the water supply can meet the water consumption of canopy transpiration of Larix gmelinii in the current soil moisture conditions. In addition, when PET was higher than the threshold value (PET > 9 mm/day), the response of canopy transpiration to LAI will be limited. For example, Song et al. [45] reported that the soil moisture limits the response of transpiration to atmospheric water demand in seasonal drought, while the effect was not significant in the well-water soil moisture conditions of subtropical coniferous. Some similar results were also observed in Clausnitzer et al. [33] and Zha et al. [54]. Numerous studies have indicated that the limitations of soil moisture on the response of canopy transpiration to atmospheric evaporative demand will occur in drought conditions [45,54,55]. When the soil moisture supply is insufficient or in high atmospheric evaporation demand, the leaf stomata and leaf water content of plants was closed and declined to prevent excessive water consumption [56,57,58], which is consistent with the results in Figure 8. On the other hand, it is well known that the most important water source of the forest ecosystem is from precipitation input. However, for the above-mentioned result that total canopy transpiration only accounts for 16.50% of P during the measurement period, this indicates that the water input though excessive precipitation can effectively increase soil moisture to maintain canopy transpiration in the present study. Moreover, the age of Larix gmelinii in the study sample plot ranged from 75 to 90 years, which means it is a relatively mature stand [59]. Bretfeld et al. [60] reported that transpiration is more likely to be limited by soil moisture in young forests than that of old forests due to plant root volume difference. Altogether, Larix gmelinii forest adjust its water consumption through canopy transpiration by responding to changes in the external environment.

5. Conclusions

The present study was performed to evaluate the effects of soil moisture, potential evapotranspiration and leaf area index on the canopy transpiration of a boreal larch (Larix gmelinii) forest in China. Results showed that the average canopy transpiration was 0.60 mm/day during the study period and exhibited significant monthly change. The dominant driving force of canopy transpiration is potential evapotranspiration, while the effect of soil moisture on canopy transpiration was weakest compared with other environmental factors. Meanwhile, canopy transpiration was not limited by soil moisture when soil moisture exceeded 0.2 cm3 cm−3. Furthermore, under the condition of sufficient soil moisture, the response of canopy transpiration to the changes in leaf area index can be limited by potential evapotranspiration when potential evapotranspiration exceeded 9 mm/day. Thus, we conclude that the ecological benefits such as carbon sequestration and water resource consumption of Larix gmelinii forest could be largely decided by future climate warming.

Author Contributions

Conceptualization, Z.X. and X.M.; methodology, Z.X.; software, Z.X.; validation, X.M., Y.S. and Z.X.; formal analysis, X.M.; investigation, Z.X. and Y.S.; resources, X.M. and T.C.; data curation, Z.X. and Y.S.; writing—original draft preparation, Z.X.; writing—review and editing, X.M. and T.C.; funding acquisition, T.C. All authors have read and agreed to the published version of the manuscript.

Funding

This research was funded by the Fundamental Research Funds for the Central Universities, grant number 2572020AW14, and the National Natural Science Foundation of China, grant number 31971451.

Institutional Review Board Statement

Not applicable.

Informed Consent Statement

Not applicable.

Data Availability Statement

Not applicable.

Acknowledgments

We acknowledge the Mohe Forest Ecological Research Station for providing the meteorological data.

Conflicts of Interest

The authors declare no conflict of interest.

References

  1. Bonan, G.B.; Shugart, H.H. Environmental Factors and Ecological Processes in Boreal Forests. Annu. Rev. Ecol. Syst. 1989, 20, 1–28. [Google Scholar] [CrossRef]
  2. Peng, C.; Ma, Z.; Lei, X.; Zhu, Q.; Chen, H.; Wang, W.; Liu, S.; Li, W.; Fang, X.; Zhou, X. A drought-induced pervasive increase in tree mortality across Canada’s boreal forests. Nat. Clim. Chang. 2011, 1, 467. [Google Scholar] [CrossRef]
  3. Wang, H.L.; Tetzlaff, D.; Dick, J.J.; Soulsby, C. Assessing the environmental controls on Scots pine transpiration and the im-plications for water partitioning in a boreal headwater catchment. Agric. For. Meteorol. 2017, 240–241, 58–66. [Google Scholar] [CrossRef] [Green Version]
  4. Wang, Y.; Wei, X.; del Campo, A.D.; Winkler, R.; Wu, J.; Li, Q.; Liu, W. Juvenile thinning can effectively mitigate the effects of drought on tree growth and water consumption in a young Pinus contorta stand in the interior of British Columbia, Canada. For. Ecol. Manag. 2019, 454, 117667. [Google Scholar] [CrossRef]
  5. Xu, Z.; Man, X.; Duan, L.; Cai, T. Assessing the relative contribution of increased forest cover to decreasing river runoff in two boreal forested watersheds of Northeastern China. Ecohydrol. Hydrobiol. 2021, 22, 113–125. [Google Scholar] [CrossRef]
  6. Ungar, E.D.; Rotenberg, E.; Raz-Yaseef, N.; Cohen, S.; Yakir, D.; Schiller, G. Transpiration and annual water balance of Aleppo pine in a semiarid region: Implications for forest management. For. Ecol. Manag. 2013, 298, 39–51. [Google Scholar] [CrossRef]
  7. Kumagai, T.; Tateishi, M.; Miyazawa, Y.; Kobayashi, M.; Yoshifuji, N.; Komatsu, H.; Shimizu, T. Estimation of annual forest evapotranspiration from a coniferous plantation watershed in Japan (1): Water use components in Japanese cedar stands. J. Hydrol. 2014, 508, 66–76. [Google Scholar] [CrossRef]
  8. Liu, Z.; Wang, Y.; Tian, A.; Webb, A.A.; Yu, P.; Xiong, W.; Xu, L.; Wang, Y. Modeling the Response of Daily Evapotranspiration and its Components of a Larch Plantation to the Variation of Weather, Soil Moisture, and Canopy Leaf Area Index. J. Geophys. Res. Atmos. 2018, 123, 7354–7374. [Google Scholar] [CrossRef]
  9. Wang, L.; Liu, Z.; Guo, J.; Wang, Y.; Ma, J.; Yu, S.; Yu, P.; Xu, L. Estimate canopy transpiration in larch plantations via the interactions among reference evapotranspiration, leaf area index, and soil moisture. For. Ecol. Manag. 2021, 481, 118749. [Google Scholar] [CrossRef]
  10. Jasechko, S.; Sharp, Z.D.; Gibson, J.J.; Birks, S.J.; Yi, Y.; Fawcett, P.J. Terrestrial water fluxes dominated by transpiration. Nature 2013, 496, 347–350. [Google Scholar] [CrossRef]
  11. Good, S.P.; Noone, D.; Bowen, G. Hydrologic connectivity constrains partitioning of global terrestrial water fluxes. Science 2015, 349, 175–177. [Google Scholar] [CrossRef] [PubMed] [Green Version]
  12. Sheffield, J.; Andreadis, K.M.; Wood, E.; Lettenmaier, D.P. Global and Continental Drought in the Second Half of the Twentieth Century: Severity–Area–Duration Analysis and Temporal Variability of Large-Scale Events. J. Clim. 2009, 22, 1962–1981. [Google Scholar] [CrossRef]
  13. Zhu, Y.; Zhang, J.; Zhang, Y.; Qin, S.; Shao, Y.; Gao, Y. Responses of vegetation to climatic variations in the desert region of northern China. Catena 2019, 175, 27–36. [Google Scholar] [CrossRef]
  14. Cinnirella, S.; Magnani, F.; Saracino, A.; Borghetti, M. Response of a mature Pinus laricio plantation to a three-year restriction of water supply: Structural and functional acclimation to drought. Tree Physiol. 2002, 22, 21–30. [Google Scholar] [CrossRef] [PubMed]
  15. Pfautsch, S.; Bleby, T.M.; Rennenberg, H.; Adams, M.A. Sap flow measurements reveal influence of temperature and stand structure on water use of Eucalyptus regnans forests. For. Ecol. Manag. 2010, 259, 1190–1199. [Google Scholar] [CrossRef]
  16. Tie, Q.; Hu, H.C.; Tian, F.Q.; Guan, H.D.; Lin, H. Environmental and physiological controls on sap flow in a subhumid mountainous catchment in North China. Agric. For. Meteorol. 2017, 240–241, 46–57. [Google Scholar] [CrossRef]
  17. Deng, J.; Yao, J.; Zheng, X.; Gao, G. Transpiration and canopy stomatal conductance dynamics of Mongolian pine plantations in semiarid deserts, Northern China. Agric. Water Manag. 2021, 249, 106806. [Google Scholar] [CrossRef]
  18. Zhang, H.; Wei, W.; Chen, L.; Wang, L. Effects of terracing on soil water and canopy transpiration of Pinus tabulaeformis in the Loess Plateau of China. Ecol. Eng. 2017, 102, 557–564. [Google Scholar] [CrossRef] [Green Version]
  19. Han, C.; Chen, N.; Zhang, C.K.; Liu, Y.J.; Khan, S.; Lu, K.L.; Li, Y.G.; Dong, X.X.; Zhao, C.M. Sap flow and responses to me-teorological about the Larix principis-rupprechtii plantation in Gansu Xinlong mountain, northwestern China. For. Ecol. Manag. 2019, 451, 117519. [Google Scholar] [CrossRef]
  20. Cooper, A.E.; Kirchner, J.W.; Wolf, S.; Lombardozzi, D.L.; Sullivan, B.W.; Tyler, S.W.; Harpold, A.A. Snowmelt causes different limitations on transpiration in a Sierra Nevada conifer forest. Agric. For. Meteorol. 2020, 291, 108089. [Google Scholar] [CrossRef]
  21. Song, L.; Zhu, J.; Zheng, X.; Wang, K.; Lü, L.; Zhang, X.; Hao, G. Transpiration and canopy conductance dynamics of Pinus sylvestris var. mongolica in its natural range and in an introduced region in the sandy plains of Northern China. Agric. For. Meteorol. 2020, 281, 107830. [Google Scholar] [CrossRef]
  22. Jiao, L.; Lu, N.; Fang, W.; Li, Z.; Wang, J.; Jin, Z. Determining the independent impact of soil water on forest transpiration: A case study of a black locust plantation in the Loess Plateau, China. J. Hydrol. 2019, 572, 671–681. [Google Scholar] [CrossRef]
  23. Hayat, M.; Zha, T.; Jia, X.; Iqbal, S.; Qian, D.; Bourque, C.P.-A.; Khan, A.; Tian, Y.; Bai, Y.; Liu, P.; et al. A multiple-temporal scale analysis of biophysical control of sap flow in Salix psammophila growing in a semiarid shrubland ecosystem of northwest China. Agric. For. Meteorol. 2020, 288–289, 107985. [Google Scholar] [CrossRef]
  24. Wan, Y.; Yu, P.; Wang, Y.; Wang, B.; Yu, Y.; Wang, X.; Liu, Z.; Liu, X.; Wang, S.; Xiong, W. The Variation in Water Consumption by Transpiration of Qinghai Spruce among Canopy Layers in the Qilian Mountains, Northwestern China. Forests 2020, 11, 845. [Google Scholar] [CrossRef]
  25. Yang, G.; Di, X.-Y.; Guo, Q.-X.; Shu, Z.; Zeng, T.; Yu, H.-Z.; Wang, C. The impact of climate change on forest fire danger rating in China’s boreal forest. J. For. Res. 2011, 22, 249–257. [Google Scholar] [CrossRef]
  26. Liu, J.; Cheng, F.; Munger, W.; Jiang, P.; Whitby, T.; Chen, S.; Ji, W.; Man, X. Precipitation extremes influence patterns and partitioning of evapotranspiration and transpiration in a deciduous boreal larch forest. Agric. For. Meteorol. 2020, 287, 107936. [Google Scholar] [CrossRef]
  27. Duan, B.; Man, X.; Cai, T.; Xiao, R.; Ge, Z. Increasing soil organic carbon and nitrogen stocks along with secondary forest succession in permafrost region of the Daxing’an mountains, northeast China. Glob. Ecol. Conserv. 2020, 24, e01258. [Google Scholar] [CrossRef]
  28. Granier, A. Evaluation of transpiration in a Douglas-fir stand by means of sap flow measurements. Tree Physiol. 1987, 3, 309–320. [Google Scholar] [CrossRef]
  29. Peters, R.L.; Fonti, P.; Frank, D.; Poyatos, R.; Pappas, C.; Kahmen, A.; Carraro, V.; Prendin, A.L.; Schneider, L.; Baltzer, J.L.; et al. Quantification of uncertainties in conifer sap flow measured with the thermal dissipation method. New Phytol. 2018, 219, 1283–1299. [Google Scholar] [CrossRef] [Green Version]
  30. Otieno, D.; Li, Y.; Ou, Y.; Cheng, J.; Liu, S.; Tang, X.; Zhang, Q.; Jung, E.-Y.; Zhang, D.; Tenhunen, J. Stand characteristics and water use at two elevations in a sub-tropical evergreen forest in southern China. Agric. For. Meteorol. 2014, 194, 155–166. [Google Scholar] [CrossRef]
  31. Kostner, B.; Tenhunen, J.D.; Alsheimer, M.; Wedler, M.; Scharfenberg, H.-J.; Zimmermann, R.; Falge, E.; Joss, U. Controls on Evapotranspiration in a Spruce Forest Catchment of the Fichtelgebirge. Ecol. Stud. 2001, 146, 377–415. [Google Scholar] [CrossRef]
  32. Tang, J.; Bolstad, P.V.; Ewers, B.E.; Desai, A.R.; Davis, K.J.; Carey, E.V. Sap flux-upscaled canopy transpiration, stomatal conductance, and water use efficiency in an old growth forest in the Great Lakes region of the United States. J. Geophys. Res. Biogeosci. 2006, 111. [Google Scholar] [CrossRef] [Green Version]
  33. Clausnitzer, F.; Köstner, B.; Schwärzel, K.; Bernhofer, C. Relationships between canopy transpiration, atmospheric conditions and soil water availability-analyses of long-term sap-flow measurements in an old Norway spruce forest at the Ore Moun-tains/Germany. Agric. For. Meteorol. 2011, 151, 1023–1034. [Google Scholar] [CrossRef]
  34. Gao, X.; Zhao, X.; Brocca, L.; Pan, D.; Wu, P. Testing of observation operators designed to estimate profile soil moisture from surface measurements. Hydrol. Process. 2019, 33, 575–584. [Google Scholar] [CrossRef]
  35. Howell, T.A.; Dusek, D.A. Comparison of Vapor-Pressure-Deficit Calculation Methods—Southern High Plains. J. Irrig. Drain. Eng. 1995, 121, 191–198. [Google Scholar] [CrossRef]
  36. Allen, R.G.; Pereira, L.S.; Raes, D.; Smith, M. Crop evapotranspiration-Guidelines for computing crop water requirements-FAO Irrigation and drainage paper 56. FAO: Rome, Italy, 1998; Volume 300, p. D05109. [Google Scholar]
  37. Mcmahon, T.A.; Peel, M.C.; Lowe, L.; Srikanthan, R.; Mcvicar, T. Estimating actual, potential, reference crop and pan evap-oration using standard meteorological data: A pragmatic synthesis. Hydrol. Earth Syst. Sci. 2013, 17, 1331–1363. [Google Scholar] [CrossRef] [Green Version]
  38. Ouyang, L.; Wu, J.; Zhao, P.; Li, Y.Q.; Zhu, L.W.; Ni, G.Y. Consumption of precipitation by evapotranspiration indicates po-tential drought for broadleaved and coniferous plantations in hilly lands of South China. Agric. Water Manag. 2021, 252, 106927. [Google Scholar] [CrossRef]
  39. Wullschleger, S.; Hanson, P.J. Sensitivity of canopy transpiration to altered precipitation in an upland oak forest: Evidence from a long-term field manipulation study. Glob. Chang. Biol. 2005, 12, 97–109. [Google Scholar] [CrossRef]
  40. Bai, Y.; Li, X.; Zhou, S.; Yang, X.; Yu, K.; Wang, M.; Liu, S.; Wang, P.; Wu, X.; Wang, X.; et al. Quantifying plant transpiration and canopy conductance using eddy flux data: An underlying water use efficiency method. Agric. For. Meteorol. 2019, 271, 375–384. [Google Scholar] [CrossRef]
  41. Song, L.; Zhu, J.; Li, M.; Yu, Z. Water utilization of Pinus sylvestris var. mongolica in a sparse wood grassland in the semiarid sandy region of Northeast China. Trees 2014, 28, 971–982. [Google Scholar] [CrossRef]
  42. Wieser, G.; Leo, M.; Oberhuber, W. Transpiration and canopy conductance in an inner alpine Scots pine (Pinus sylvestris L.) forest. Flora-Morphol. Distrib. Funct. Ecol. Plants 2014, 209, 491–498. [Google Scholar] [CrossRef] [PubMed] [Green Version]
  43. Ghimire, C.P.; Lubczynski, M.W.; Bruijnzeel, L.A.; Chavarro-Rincón, D. Transpiration and canopy conductance of two con-trasting forest types in the Lesser Himalaya of Central Nepal. Agric. For. Meteorol. 2014, 197, 76–90. [Google Scholar] [CrossRef]
  44. Urban, J.; Rubtsov, A.V.; Urban, A.V.; Shashkin, A.V.; Benkova, V.E. Canopy transpiration of a Larix sibirica and Pinus sylvestris forest in Central Siberia. Agric. For. Meteorol. 2019, 271, 64–72. [Google Scholar] [CrossRef]
  45. Song, X.; Lyu, S.; Wen, X. Limitation of soil moisture on the response of transpiration to vapor pressure deficit in a subtropical coniferous plantation subjected to seasonal drought. J. Hydrol. 2020, 591, 125301. [Google Scholar] [CrossRef]
  46. Hogg, E.H.; Hurdle, P.A. Sap flow in trembling aspen: Implications for stomatal responses to vapor pressure deficit. Tree Physiol. 1997, 17, 501–509. [Google Scholar] [CrossRef] [Green Version]
  47. Ge, Y.; Ghang, J.; Liu, K.; Qin, G.Q. A Physio-ecological Study on the Transpiration of Mosla hangchowensis Matsuda. Chin. J. Plant Ecol. 1999, 23, 320–326. [Google Scholar]
  48. Brito, P.; Lorenzo, J.R.; Gonzalez-Rodriguez, A.M.; Morales, D.; Wieser, G.; Jimenez, M.S. Canopy transpiration of a semiarid Pinus canariensis forest at a treeline ecotone in two hydrologically contrasting years. Agric. For. Meteorol. 2015, 201, 120–127. [Google Scholar] [CrossRef]
  49. Jiao, L.; Lu, N.; Sun, G.; Ward, E.; Fu, B. Biophysical controls on canopy transpiration in a black locust (Robinia pseudoacacia) plantation on the semi-arid Loess Plateau, China. Ecohydrology 2016, 9, 1068–1081. [Google Scholar] [CrossRef]
  50. Lagergren, F.; Lindroth, A. Transpiration response to soil moisture in pine and spruce trees in Sweden. Agric. For. Meteorol. 2002, 112, 67–85. [Google Scholar] [CrossRef]
  51. Chu, X.; Di, X.Y.; Zhang, J.L.; Cai, H.Y.; Yan, B.Z. Distribution and seasonal dynamics of fine root biomass of two types of forests in Great Xing’an Mountains. J. Northeast For. Univ. 2011, 39, 36–39. [Google Scholar]
  52. Xu, Z.; Man, X.; Duan, L.; Cai, T. Improved subsurface soil moisture prediction from surface soil moisture through the integration of the (de)coupling effect. J. Hydrol. 2022, 608, 127634. [Google Scholar] [CrossRef]
  53. Fernandes, T.; del Campo, A.; García-Bartual, R.; González-Sanchis, M. Coupling daily transpiration modelling with forest management in a semiarid pine plantation. iForest-Biogeosci. For. 2016, 9, 38–48. [Google Scholar] [CrossRef] [Green Version]
  54. Zha, T.; Qian, D.; Jia, X.; Bai, Y.; Tian, Y.; Bourque, C.P.-A.; Ma, J.; Feng, W.; Wu, B.; Peltola, H. Soil moisture control of sap-flow response to biophysical factors in a desert-shrub species, Artemisia ordosica. Biogeosciences 2017, 14, 4533–4544. [Google Scholar] [CrossRef] [Green Version]
  55. Yuan, W.; Zheng, Y.; Piao, S.; Ciais, P.; Lombardozzi, D.; Wang, Y.; Ryu, Y.; Chen, G.; Dong, W.; Hu, Z.; et al. Increased atmospheric vapor pressure deficit reduces global vegetation growth. Sci. Adv. 2019, 5, eaax1396. [Google Scholar] [CrossRef] [PubMed] [Green Version]
  56. McAdam, S.A.M.; Brodribb, T.J. Stomatal innovation and the rise of seed plants. Ecol. Lett. 2012, 15, 1–8. [Google Scholar] [CrossRef]
  57. Moshelion, M.; Halperin, O.; Wallach, R.; Oren, R.; Way, D.A. Role of aquaporins in determining transpiration and photo-synthesis in water-stressed plants: Crop water use efficiency, growth and yield. Plant Cell Environ. 2014, 38, 1785–1793. [Google Scholar]
  58. Konings, A.G.; Williams, P.; Gentine, P. Sensitivity of grassland productivity to aridity controlled by stomatal and xylem regulation. Nat. Geosci. 2017, 10, 284–288. [Google Scholar] [CrossRef]
  59. Xiao, R.H.; Man, X.L.; Duan, B.X. Carbon and Nitrogen Stocks in Three Types of Larix gmelinii Forests in Daxingʹan Mountains, Northeast China. Forests 2020, 11, 305. [Google Scholar] [CrossRef] [Green Version]
  60. Bretfeld, M.; Ewers, B.E.; Hall, J.S. Plant water use responses along secondary forest succession during the 2015–2016 El Niño drought in Panama. New Phytol. 2018, 219, 885–899. [Google Scholar] [CrossRef] [Green Version]
Figure 1. (a) The region north of 40° N (Globcover2009: http://due.esrin.esa.int/page_globcover.php, accessed on 2 January 2022). (b) The DEM of study site; (c) Sample plot. Note that the CBE/SDF, CBDF, OBDF/W, CNEF and OND/EF are closed to open (>15%) broadleaved evergreen or semi-deciduous forest (>5 m), closed (>40%) broadleaved deciduous forest (>5 m), open (15–40%) broadleaved deciduous forest/woodland (>5 m), closed (>40%) needleleaf evergreen forest (>5 m) and open (15–40%) needleleaf deciduous or evergreen forest (>5 m), respectively.
Forests 13 00571 g001
Figure 2. Plot showing the (a) LAI variations in the study period; (b) frequency distribution of the DBH in study sample plot.
Forests 13 00571 g002
Figure 3. Plot showing the relationship between SA and DBH of the Larix gmelinii forest.
Forests 13 00571 g003
Figure 4. Plots displaying the changes in environmental factors during growing season.
Forests 13 00571 g004
Figure 5. Plot showing the daily dynamics of transpiration in growing season. DOY refers to day of the year.
Forests 13 00571 g005
Figure 6. Plot showing the monthly dynamics of Ec in growing season. (a) mean daily Ec; (b) monthly Ec; (c) Percentage of P.
Forests 13 00571 g006
Figure 7. Plot exhibiting the function relationships between environmental factors and Ec in the growing season. (a) VPD; (b) PET; (c) PAR; (d) Ws; (e) Ta; (f) RH; (g) Rn; (h) SWC; (i) LAI.
Forests 13 00571 g007
Figure 8. Plot exhibiting the relationship between VPD and canopy conductance. Note that the data were excluded on rainy days and when VPD < 0.4 kPa.
Forests 13 00571 g008
Figure 9. Plot showing the role of SWC in response of canopy transpiration to PET in the study period. (a) PET; (b) SWC.
Forests 13 00571 g009
Figure 10. Plot showing the role of PET in response of canopy transpiration to LAI in study period. (a) LAI; (b) PET.
Forests 13 00571 g010
Table 1. Detailed information of forest structure in the Larix gmelinii forest.
Forest Structure Characteristics
Plot area (m2)Stand density (tree/ha)Tree age (year)Mean DBH (cm)Total SA (cm2)Mean height
(m)
Mean LAI (m2 m−2)
400125075–9013.1 ± 6.742950.5317.35 ± 7.561.96 ± 0.36
Table 2. Detailed information of sample trees for sap flow measurement.
NO.DBH (cm)SA (cm2)Tree Height (m)
123.7143.1219.24
223.2137.8917.90
320.1107.3517.33
415.165.1715.37
512.144.2814.43
611.540.5113.50
79.227.4511.25
89.026.4110.99
98.121.9810.38
Table 3. Correlation coefficients between environmental factors and canopy transpiration.
PeriodVPDPETPARWsTaRHRnSWCLAI
May0.60 **0.81 **0.64 **0.78 **0.83 **−0.44 *0.66 **0.66 **0.72 **
June0.85 **0.91 **0.89 **0.49 **0.82 **−0.81 **0.86 **0.250.40 *
July0.88 **0.83 **0.91 **0.71 **0.33−0.90 **0.88 **−0.14−0.03
August0.74 **0.84 **0.85 **0.300.40 *−0.62 **0.85 **−0.060.02
September0.46 *0.94 **0.75 **0.54 **0.74 **−0.020.85 **−0.310.67 **
Whole period0.66 **0.86 **0.58 **0.74 **0.78 **−0.27 **0.76 **0.43 **0.67 **
Note: * and ** means significance level at the 0.05 and 0.01, respectively.
Table 4. The response of Ec to PET under varying SWC.
LevelRegressionR2Sig.
SWC < 0.2EL = 0.06 × (1-e−1.57 × PET)0.51p < 0.01
0.2 ≤ SWC < 0.3EL = 0.64 × (1-e−0.16 × PET)0.69p < 0.01
0.3 ≤ SWC < 0.4EL = 0.59 × (1-e−0.16 × PET)0.83p < 0.01
SWC ≥ 0.4EL = 0.59 × (1-e−0.19 × PET)0.81p < 0.01
Table 5. The response of Ec to PET under varying SWC.
LevelRegressionR2Sig.
PET < 3EL = 0.10 × SWC + 0.100.003p > 0.05
3 ≤ PET < 6EL = 0.18 × SWC + 0.270.019p > 0.05
6 ≤ PET < 9EL = 0.22 × SWC + 0.360.085p > 0.05
PET ≥ 9EL = 0.15 × SWC + 0.440.051p > 0.05
Table 6. The response of Ec to LAI at varied PET levels.
LevelRegressionR2Sig.
PET < 2EC = 0.14 × LAI − 0.130.19p < 0.05
2 ≤ PET < 4EC = 0.40 × LAI − 0.300.23p < 0.01
4 ≤ PET < 6EC = 0.41 × LAI − 0.120.34p < 0.01
6 ≤ PET < 9EC = 0.25 × LAI + 0.400.18p < 0.05
PET ≥ 9EC = 0.21 × LAI + 0.640.11p > 0.05
Table 7. The response of Ec to PET.
LevelRegressionR2Sig.
PET < 9EC = 0.13 × PET + 0.050.71p < 0.01
PET ≥ 9EC = −0.01 × PET + 1.230.01p > 0.05
Publisher’s Note: MDPI stays neutral with regard to jurisdictional claims in published maps and institutional affiliations.

