Article

Ecological Stoichiometry in Pinus massoniana L. Plantation: Increasing Nutrient Limitation in a 48-Year Chronosequence

1
College of Horticulture and Forestry Sciences, Hubei Engineering Technology Research Center for Forestry Information, Huazhong Agricultural University, Wuhan 430070, China
2
Department of Forestry, Range and Wildlife Management, Karakoram International University, Gilgit Baltistan 15100, Pakistan
3
Department of Forestry and Wildlife Management, The University of Haripur, Haripur 22620, Pakistan
4
Department of Entomology, Faculty of Agriculture Sciences, University of Agriculture Dera Ismail Khan, Dera Ismail Khan 29120, Pakistan
5
State Key Laboratory for Conservation and Utilization of Subtropical Agro-Bio-Resources, College of Life Science and Technology, Guangxi University, Nanning 530004, China
6
Forest Education Division, Pakistan Forest Institute, Peshawar 25120, Pakistan
7
Forest Ecology Research Group, College of Life Sciences, Hebei University, Hebei 071002, China
8
Institute of Agriculture Sciences and Forestry, University of Swat, Swat 19130, Pakistan
9
Tasmanian Institute of Agriculture, University of Tasmania, Burnie, TAS 7250, Australia
10
Hainan Key Laboratory for Sustainable Utilization of Tropical Bioresource, College of Tropical Crops, Hainan University, Haikou 570228, China
11
Department of Agronomy, The University of Haripur, Haripur 22620, Pakistan
12
Planning and Design Institute of Forest Products Industry, National Forestry and Grassland Administration, Beijing 100010, China
*
Authors to whom correspondence should be addressed.
Forests 2022, 13(3), 469; https://doi.org/10.3390/f13030469
Submission received: 24 January 2022 / Revised: 22 February 2022 / Accepted: 3 March 2022 / Published: 17 March 2022

Abstract

:
Stoichiometric ratios of carbon (C), nitrogen (N), and phosphorus (P) are considered indicators of nutrient status and ultimate ecosystem health. A detailed investigation of these elements in the leaves, branches, forest layer vegetation and soil, depending on stand age, was carried out. We investigated the effects of stand age (9-, 18-, 28-, and 48-year) on the aboveground plant parts (leaf, branch, herb, shrub, plant litter) and belowground pools (soil, roots) of P. massoniana plantations. The CNP stoichiometry of trees was affected by stand age. Mean N content in the aboveground parts in the nine-yr stand was greater than the other stands (18-, 28-, 48-yr), which decreased with increasing stand age. As stands aged, the nutrient demands of the plantations increased as well as their N:P ratios in soil. C content in the soil ranged from 30 to 105, the total N was 0.06 to 1.6, and the total P content ranged from 3.3–6.4 g kg−1. Soil C, N and P contents were greatly influenced by both stand age and soil depth, because surface soil sequester C and N more actively compared to deeper horizons, and more nutrients are released to the topsoil by the plant litter layer. Similarly, the ratios of other layers had a similar pattern as CNP because more nutrients were taken up by the plantations, decreasing nutrient supply in the deeper soil horizons. The green leaves N:P ratios (16) indicate limited growth of P. massoniana, as the range for global nutrient limitation for woody plants oscillated between 14–16, indicating N and P limitation. Young stands were observed to have greater P content and P resorption efficiency (56.9%–67.3%), with lower C:P and N:P ratios (704.4; 14.8). We conclude that with stand development, the nutrient demands of the plantations also increase, and soil N:P stoichiometry shows that these improve soil quality.

1. Introduction

The major elements of carbon (C), nitrogen (N), and phosphorus (P) constitute the building blocks for living organisms and, as such, are strongly associated with their biochemical functions [1]. These elements control the normal functioning and certain ecological processes in a forest ecosystem [2]. To maintain the structure of food webs in agroecosystems and in controlling their tropic relationships, especially under stress conditions, the C:N:P stoichiometry plays a vital role [3,4,5]. According to Zhang et al. [6], a positive interaction between plants and soil is important to maximize the net primary productivity of a given agroecosystem. Plant growth, and the limitations to it, can easily be explained through plant C:N:P [1], whereas soil fertility can directly be indicated through the soil stoichiometry and indirectly through plant nutrient status [7].
Nutrient resorption is a highly complex process where the nutrients are transferred from the organs to new tissues or storage structures, and this has a vital strategic role in plants for conservation and optimization of the nutrient’s availability [8]. Niu et al. [9] and Yuan et al. [10] (2019) concluded that nutrient use efficiency, and thus plant growth and development, can be increased by nutrient resorption. In this process, soil microbes can significantly improve nutrient resorption by enhancing plant litter quality and its rate of decomposition [11]. As a result, decomposed plant litter releases nutrients and plays a part in the overall nutrient cycle while also ensuring adequate vegetative and reproductive plant growth [7].
As one of China’s key forest types, forest plantations have rapidly increased in recent years [12]. It is anticipated that, by the end of this century, forest plantations will triple globally [13]. The extension of forest plantations to promote biodiversity conservation [14,15] and the ecosystem amenities of plantations can perform well if managed properly [16]. In such forests, the species composition is mainly comprised of understory trees, as forest plantations are usually composed of one tree species [14]. For water and soil conservation, such understory plants play a significant role [17], as well as in energy flow and nutrient cycling [18]. Therefore, there is an increased need to understand the potential role of understory plant species in energy cycling within the plantation ecosystem.
Soil is a source for plant growth and a medium for plant development, and consequently has a vital role to play in forest ecosystem [19]. Plants greatly influence soil properties and, ultimately, soil properties affect plant growth and composition [20]. Moreover, different plants have different requirements for soil nutrients [21]. Thus, different plants can create diverse litter which will eventually decompose and alter the fertility of soil in different ways [19,22]. The vertically and horizontally spatial heterogeneity of soils can be influenced by human actions, climate, parent materials, and topographical factors [23,24]. It has also been observed that the vegetation’s cover and vertical structure of the forests influence the soil’s physical properties [25]. In turn, the variability of the properties of the soil may affect plant composition [18,26]. Furthermore, recent studies found that N deposition [20] and P limitation [27] were vital factors for the development and growth of plants. However, in plantations the plant components and soil nutrient relationship have been scarce, and reports on relationships between different soil depths and stand age are even rarer [28].
Forest management practices such as harvesting, along with litter accumulation, could significantly influence the biogeochemical cycle of a forest [29]. Different factors affect the contents of C, N, and P, as well as their ratios both in the plants and in the soil, which are responsible for the determination and distribution of elements. Among others, these factors include the stand structure, community structure, chemical traits, and the root biomass [30]. Studies have revealed that management activities and forest succession may enhance SOC [31]. Furthermore, the plant and soil nutrient relationship and their stoichiometry may provide a better understanding of biogeochemical cycling [32]. C, N, P, and the relationship among different layers of forest ecosystem biomass has rarely been considered. Secondary forests have an age gradient that includes natural C and N dynamics that is useful for investigating the temporal heterogeneity of the C:N ratios [18]. Several studies considered C and N dynamics during the formation of stands (e.g., Niu et al. [9]), and thus provide the opportunity to quantify temporal trends of stoichiometric C: N in diverse ecosystems over the age series. During stand growth, the dynamics of C:N ratios, however, remains controversial. In plant tissues, a significant increase in C:N:P ratios was reported with stand age [33]. Conversely, no change was observed by Cui et al. [34] in the C:N ratios of plant tissue over the age sequence. To expose generalized trends and improve our knowledge of C:N stoichiometry during the creation of the stand, it is therefore essential to synthesize various findings among different studies.
In China, plantations constitute approximately 6.9 × 10⁷ ha (31%), and are mostly comprised of single species (State Forestry Administration [35]). The main purpose of these plantations is economic, which can sometimes lead to serious ecological issues such as soil degradation and overall low primary productivity [36]. As a fast-growing species, P. massoniana is widely planted on degraded lands in China. Due to its fast growth, good timber quality, and strong resilience to low-quality soils, this species can also be found in the subtropical forests of Hubei province in central China [37]. However, its status in the present study has not been previously investigated. Previous studies showed that stand age management has led to increased productivity and soil fertility in P. massoniana plantations [9,38].
In this study, we analyzed plant C, N, P stoichiometry, senesced and green leaves, understory vegetation, litter, soil, and the resorption of N and P in P. massoniana plantations of different ages located in the northern subtropical forests of central China. A further goal of this analysis is to find the relationship between nutrient contents, nutrient resorption efficiency, and key stoichiometric properties. Thus, the study is guided by the following questions: (1) How are nutrient contents and plant stoichiometric ratios, leaf litter, and soil in P. massoniana plantations affected by stand age? (2) Are P. massoniana leaves efficient in terms of nutrient resorption? and (3) Is there any relationship among the available soil nutrients and the nutrient resorption in the leaves? We hypothesize that (1) C, N, P contents both in plant and soil could be increased with stand age management, which will in turn alter the C:N:P ratios; (2) resorption efficiencies of N and P could increase as stand age increases due to greater nutrient availability; and (3) the leaves’ nutrient resorption efficiency is significantly and negatively correlated to soil nutrient content. Addressing these questions will improve the current understanding of ecological processes and the nutrients’ status in P. massoniana plantations with manipulated stand age and provide a scientific basis for better plantation management via more effective restoration plans.

2. Material and Methods

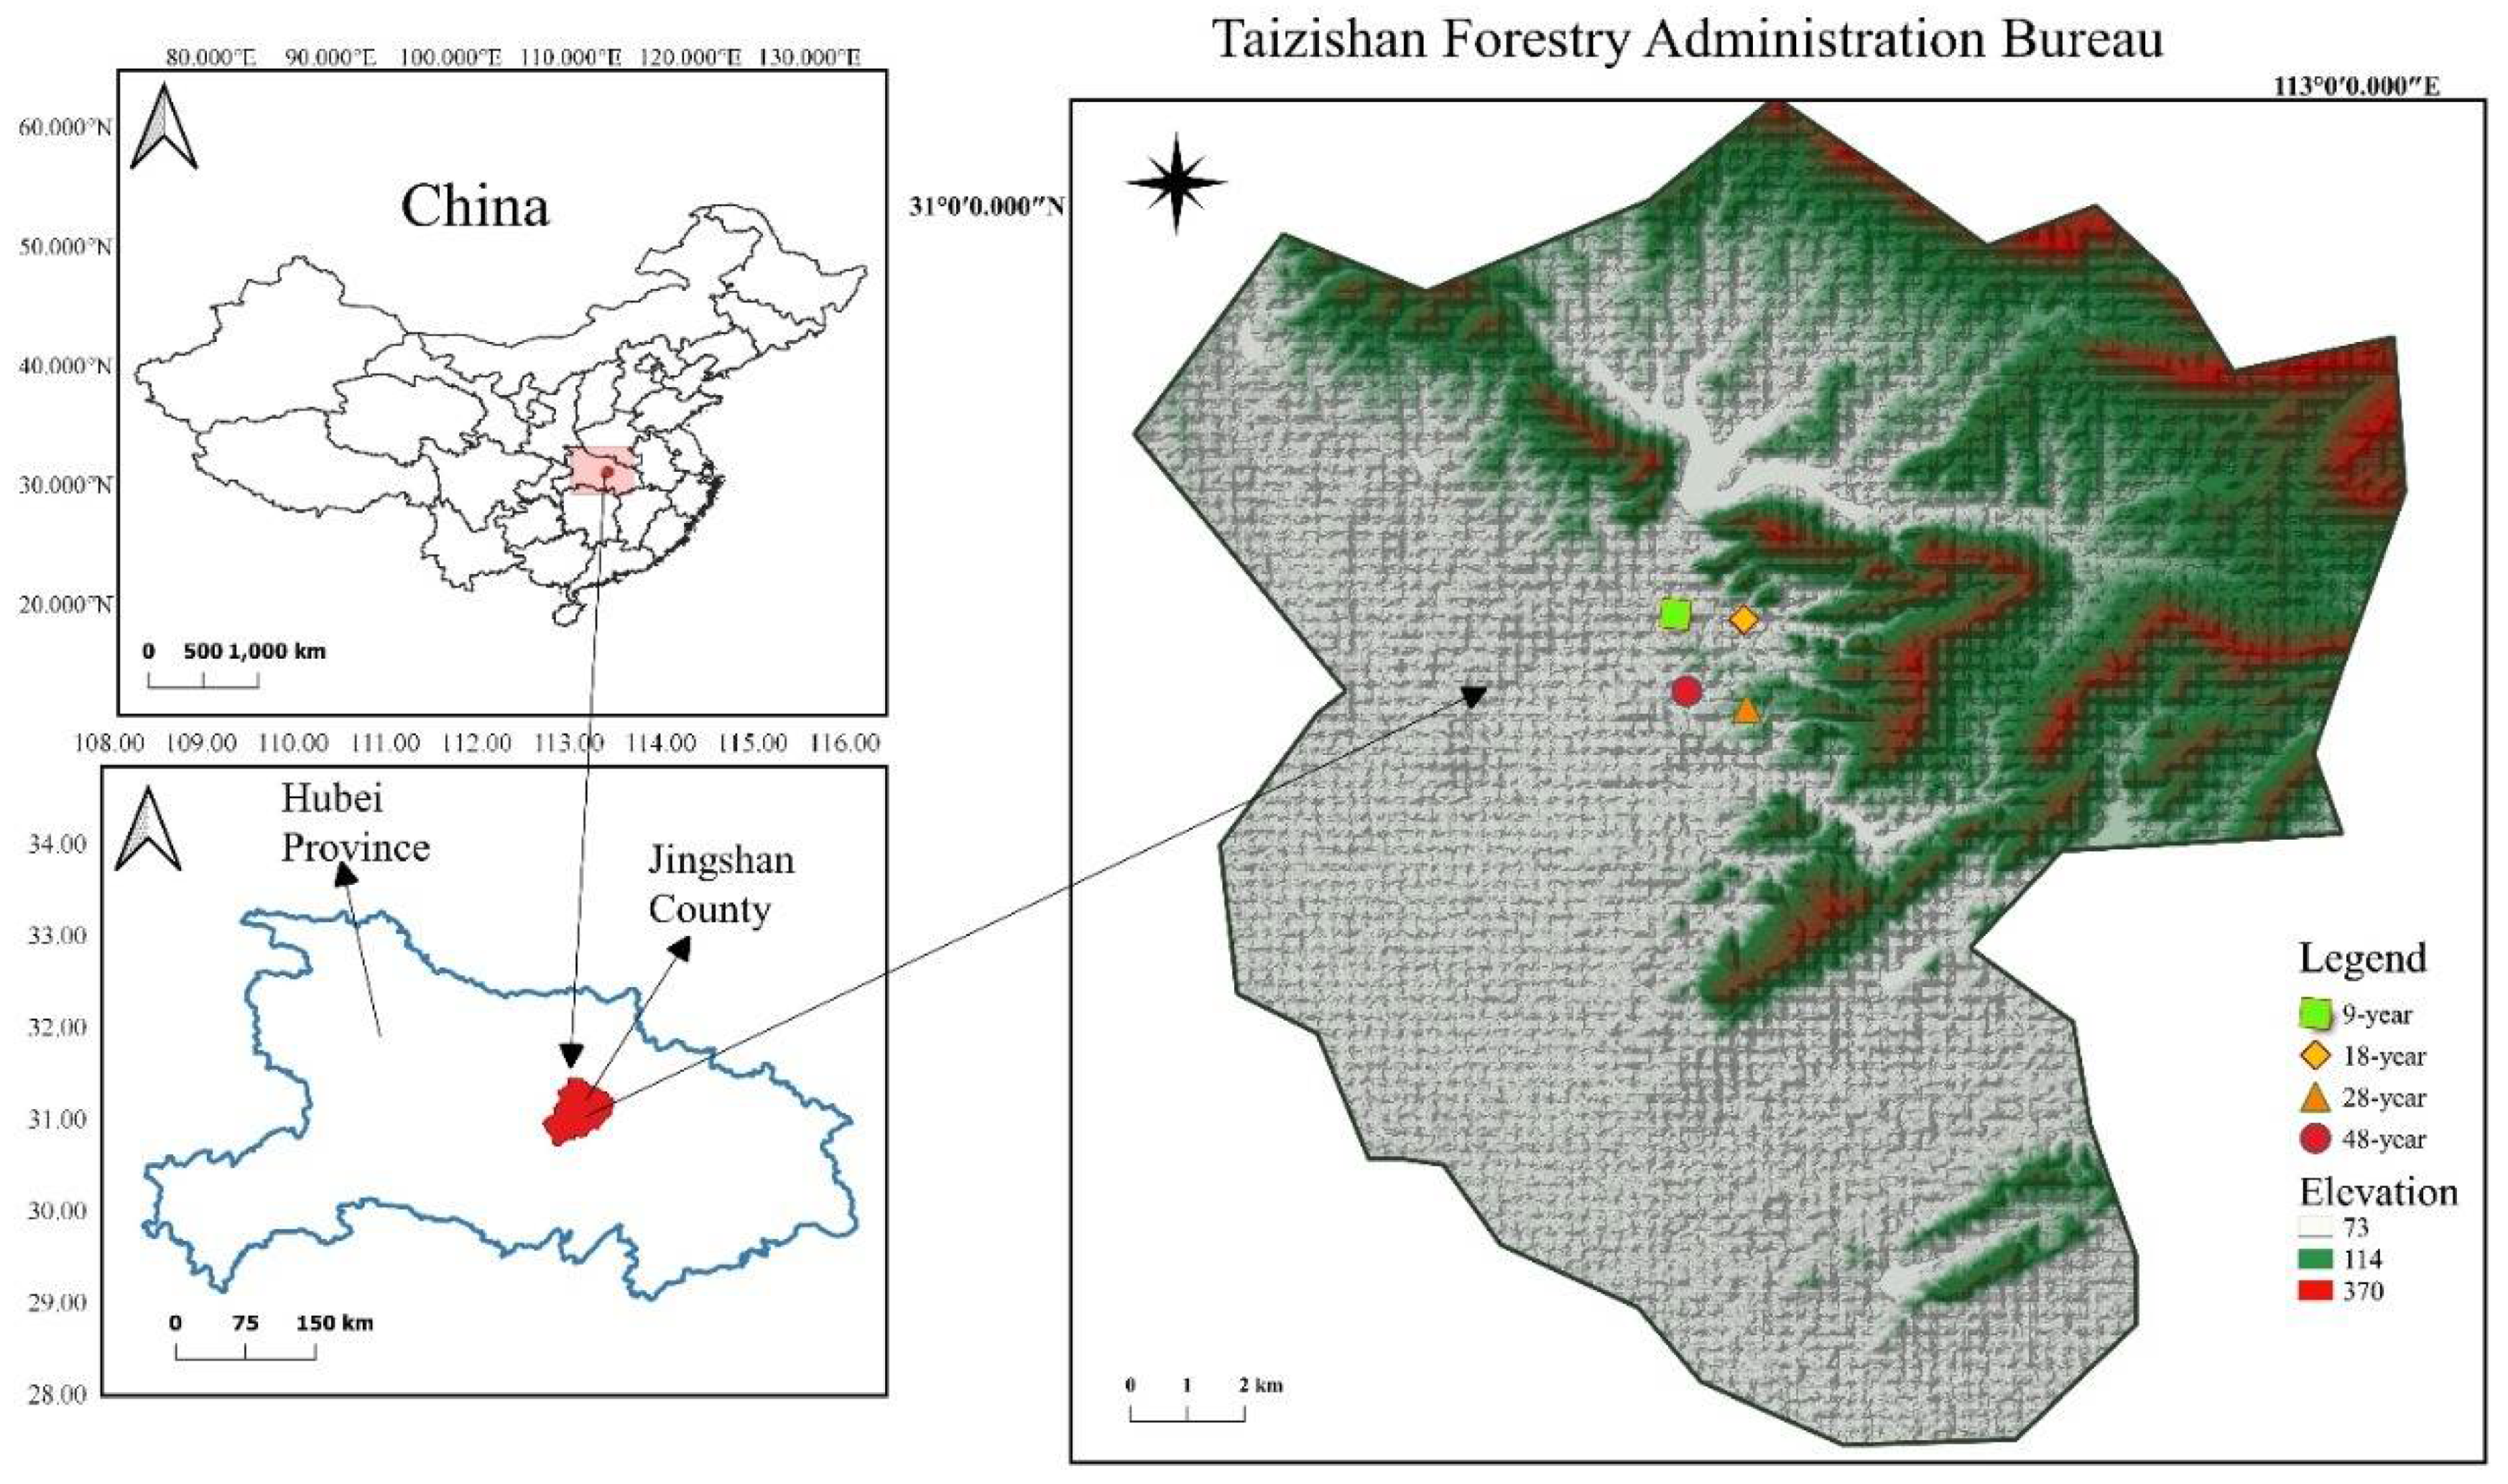
2.1. Study Area and Plantation

The Taizishan Forestry Administration Bureau (TFBC; 112°48.113°03′ E, 30°48.31°02′ N), is within the subtropical humid monsoon climate zone of Hubei Province, Central China (Figure 1). Winters in this region are usually cold while summer is hot and humid with increased precipitation. Data from the Taizishan Forestry Farm (2016–2020) shows that the mean annual precipitation was 1090 mm with increased rainfall recorded in July and September. July is the warmest month in Taizhishan, and the mean annual temperature is 16.4 °C, with a maximum temperature of 39.2 °C. The free-frost period spans about 240 days. Forests of the study area have been classified into mixed coniferous forests, broad-leaved forests, and the evergreen coniferous forests. Three major soil types exist in the area, which are the yellow-brown soil, mountain yellow-brown soil, and yellow-cinnamon soil, with an average soil depth of 40–60 cm.
P. massoniana is a widespread pine species and has been largely used as a plantation species all over China. Plantations at the research site were established in 1957 with the initial objective of timber production until a decade ago (Table 1). Thinning and understory clearing were the two management practices adopted by the TFBC with the principal goal of cutting the large trees and maintaining the small ones. The initial thinning age in TFBC was 10–15-yr, depending upon the growth status of the trees. Afterwards, thinning had been done at approximately 10-yr intervals, until reaching maturity (50-yr for this species). Thinning has usually been applied to all of the plantations in the area. Contrastingly, the understory clearing was conducted after five years at some sites for reducing fire risk and for the improvement of the driving visibility of the logging roadsides. The clearing was done with a machine that cut the aboveground parts of the understory vegetations. Artemisia sacrorum and Carex stenophylloides were the dominant species among the herb species in the understory layer, while Rosa xanthine, Lonicera japonica, and Lonicera microphylla were the dominant species in the shrub layer.

2.2. Plant Sampling Design and Data Collection

Following a comprehensive review of P. massoniana L. plantations, a site representing standard elevation, slope, aspect, and soil conditions was selected for the present investigation. The chosen plantations were established in 1957 and were comprised of pure P. massoniana with limited herb and shrub diversity. Different management activities were conducted in different years, mainly through tending operations and pruning. In 2018, 24 plots of 30 m × 30 m size with similar management practices were established representing four stand ages (i.e., 9, 18, 28, and 48 yr), with three replicate plots for each age group treatment. To prevent edge effects, a 5 m wide buffer zone was set around each plot, whereas the distance between both plots was less than 5 km.
The growing season in Taizishan normally starts in May and finishes in September. Therefore, field samples were collected in July and October 2018. To generate a composite sample for each plot, we collected green leaves from five standard trees with the same diameter at breast height (DBH), height and similar physical condition using a pole pruner. For mixed samples of senesced leaves per plot, specimens were collected through five nylon (of 0.1 mm thickness) litter traps which were positioned 0.5 m above the ground. Herb and shrub composite samples were also collected from the same plots. An autoanalyzer (Kjeltec 2300 Analyzer Unit, Foss, Sweden) was used to determine the contents of C and N after the samples were ground, while the standard ammonium molybdate method was used to determine P concentration [39,40]. Leaf samples were oven dried at 105 °C for 15 min prior to analysis, after which the temperature was reduced to 85 °C until constant mass was attained. Nutrient resorption efficiency (NuRE) was determined through the following equation:
N u R E = ( 1 N s N g M L C F ) × 100 %
where NuRE denotes nutrient (N or P) resorptions efficiency, Ns and Ng are the nutrients content (N and P g kg−1) in the NRE and PRE (nitrogen resorption efficiency, phosphorus resorption efficiency), respectively, and mass loss correction factor (MLCF), for which 0.745 was adopted to correct unbiased resorption value [41]. An elemental analyzer (FLASH20000 CHNS/O, Thermo, Waltham, MA, USA) was used for the determination of total carbon (TC) and nitrogen (TN) both in the soil and leaf samples, while total phosphorus (TP) was established by colorimetry after digestion with H2SO4−H2O2 and H2SO4−HClO4, respectively [42]. Soil water content (SWC) and bulk density (BD) of the soil were also determined using the cutting ring method [18]. For determination of the soil available P (SAP), the method based on colorimetry after extraction with NaHCO3 was used, while NaOH hydrolysis was used to measure soil available N (SAN) [42]. A standard pH meter was utilized to measure soil pH by applying a soil-water mixture of 1:2.5 [43].

2.3. Soil Sample and Analysis

At each of the four stand ages, subplot sampling areas of 2 m × 2 m were used to randomly collect soil samples at nine different points at each plot and replicate. Subplots in each treatment were used to get samples from the top 40 cm (0–10, 10–20, 20–40 cm) soil layer with a 5 cm auger. Soil samples were then collected and composited across subplots sampling areas for each depth. A 2-mm mesh was used to sieve all soil samples after removing stones, plant debris, and roots. We grouped all soil samples into two parts, one for chemical analyses and another for microbial biomass analysis which was stored at 4 °C. A conductance meter was used to measure the electrical conductivity (EC) (1:5 soil-water) [42,44]. The chloroform fumigation method of extraction was used for the determination of soil microbial biomass C (MBC) and N (MBN) [45]. To analyze soil total organic carbon (TOC), a Multi N/C analyzer was utilized (Multi N/C 3100, Analytic Jena, Jena, Germany).

2.4. Data Analysis

Prior to data processing, the normality and homogeneity of variance for all the parameters under analysis were checked and, when required, data were transformed. A one-way analysis of variance (ANOVA) was used to check the effect of age group and Tukey’s comparison test was applied for determination of significant differences among stand age groups. A level of significance was defined at 0.05. Regression analysis was used to determine the relations between green and sensed leaf C, N and P, between soil and senesced leaves, and between soil and green leaves. Analyses of data were performed using SPSS 23.0 (IBM Corp., Armonk, NY, USA). To test the relationship among NuRE, C, N, P contents, and stoichiometry ratios in leaves and soil, linear regressions were used. We used the principal component analysis (PCA) and redundancy analysis (RDA) for the determination of the relationships among soil properties and stoichiometry with respect to different treatments by Canoco5 software.

3. Results

3.1. Changes in Soil Properties among Stand Ages

Changes in all soil properties across stand ages, except for soil water content, were detected (Table S1). Higher soil bulk density (p < 0.05) in 9- and 18-yr stands was observed. Soil pH decreased in the 48-yr stands compared to the 9-yr stand. Higher soil available N (SAN) was detected in the 18-yr stands, while in the young stands soil available P (SAP) was higher than the two older stands (Figure 2c,d). Furthermore, EC and MBC were higher in 28-yr stands, but lower MBC and MBN was reported in the 9-yr stand than the 48-yr stands (Figure 2a,b).

3.2. Soil C:N:P and Stand Age

Soil C, N, P and their ratios were influenced by both stand age and soil depth (p < 0.05) (Figure 3). Soil C content varied from 30 to 105 g kg−1, total N content from 0.06 to 1.6 g kg−1, and total P content from 3.3 to 6.4 g kg−1 (Figure 3a–c). Distribution patterns of soil C, N, and P varied in the soil layers, as soil C and P contents first increased and then decreased with depths, while soil N content increased, then decreased, and increased again (Figure 3c). Higher C (93.15) and N (0.96) contents were observed in the topsoil layer which decreased (p < 0.05) with soil depth, while P (4.91) remained stable with no difference detected among soil depths (p > 0.05). Mean soil C and N contents of 28- and 48-years stands were higher (p < 0.05) than 9 and 18-year stands (Figure 3a–c). Mean soil N contents in the 9- and 28-year stands varied (p < 0.05) among age stands. A similar pattern for P contents of soil was observed compared to 9- and 28-years stands. In the 28-year stand, average C:N ratios were higher (p < 0.05) compared to the others. Lower mean C:P ratios (p < 0.05) were seen in the following order: 48 > 18 > 28 > 9 year (Figure 3d–f). Furthermore, mean N:P ratios in the 9- and 28-year stands were lower (p < 0.05) than the 18- and 48-year stands (Figure 3d–f).

3.3. C:N:P and Stand Age

C, N and P contents in most tree components (leaf, branch, root, litter), were affected by stand age (p < 0.05). In the 48-year-old stands, mean C content in the leaf, branch, root, and litter was lower (Table S2, p < 0.05). With stand development an increasing and decreasing trend in N content was seen, which was higher in the 9-year-old stand (p < 0.05), later on decreasing with stand growth. Similarly, the N content in root increased (p < 0.05) with stand age (Table S2). Furthermore, the C:N ratio in herbs of the 18-year stand was high (60 g kg−1), whereas P content was higher in the 9-year-old stands. In the shrubs a similar trend to that of the herbs was seen in these plantations. In the C, N, P contents of herbs and shrubs, negligible differences were (p > 0.05) observed (Table S2).
As the stands aged, the C:N ration decreased (p < 0.05) in branches of P. massoniana stands (Table S3), while the C:N ratio (611) in branches of the 18-year old stand was higher among all age groups. In the 28-year-old stand the C:P ratio increased (p < 0.05), but later on decreased in the branch tissues of the 48-year stand. In the 28-yr old stands, the N:P ratio showed a similar pattern as that of C:P ratios, with increased values in the 28-year stand compared to the other stand ages (Table S3). Higher C:N ratios in the root of the 48-year stand was observed as it decreased with increasing stand age. High root C: P and N: P ratios were seen in the 9-year stand as compared to the 48-year stand. In the herb and shrub layer, C:N ratios were lower (p < 0.05) in the 9- and 48-year stands, whereas the 18-year stand had a higher C:P ratio. High N:P ratios in the 9-, 18-, and 28-yr stands were recorded in both herb and shrub. Changes in the C:N ratio were recorded in the litter of the 28- and 48-year stands (p < 0.05), but no changes in C:N ratios were seen among other stands (Table S3). C and N content in the aboveground carbon was approximately 10% and 21.2% more than the belowground C content, while the P content was 18.4% higher in the belowground soil content in P. massoniana stands. As the stands aged, the contents of C, N and P increased in the middle age (18-yr) and then decreased in the mature stands. Middle aged stands (18- and 28-year) were recorded have better nutrient cycling patterns compared to the young and mature stands (Figure 4).

3.4. Nutrient Resorption Efficiency (NuRE) and the Relationship among Stoichiometry Ratios

Carbon content in the green leaf was higher (p < 0.05) in the 18-year-old stand (Figure 5a), while the 18- and 48-year stands had 20% higher N and P contents, respectively, compared to other stands of P. massoniana (Figure 5b,c). Stand age has increased C and N content (p < 0.05), while the P contents in all stands remained unchanged (p > 0.05). Similarly, in the senesced leaves, the 18- and 28-year stands had higher values (Figure 5b,c). Higher C:N and C:P ratios were recorded in the 48-year stand in the senesced leaf of the 48-year stands, while the 18-year stand had a higher N:P ratio (Figure 5f). A high N:P ratio was observed in the 18-year stand’s green leaf components (Figure 5d). The NRE and PRE in stand ages varied between 51.8%–56.5% and 56.9%–67.3%, respectively (Figure 6a,b). No changes (p > 0.05) in PRE were seen (Figure 6b). A strong relationship was observed between NRE and PRE in the stands of P. massoniana plantations (Figure 6c).
Leaf P was influenced by soil P while the leaf N:P ratio was affected by the soil N:P ratio (Figure 7a,b). Similarly, the PRE was affected by stand age and was related to leaf stoichiometry (Figure 7d).

3.5. Response of CNP Stoichiometry to Different Stand Ages

The PCA presented in Figure 8a of the responses of the contents of soil C, N, and P and different plant components along with their stoichiometric ratios in various age stands was determined. The cumulative variance of stand ages (9-, 18-, 28-, and 48-year) contribution explained 64.4% and 43.1% of PC1 and PC2. Among four different stand ages (9-, 18-, 28-, 48-yr), the18- and 28-year stands were considered good stands for C, N, and P contents (Figure 8b).
The relationship between the contents of C, N, and P, and stoichiometric ratios with soil variables (SWC, SAN, EC, BD, pH, MBN, MBC, SAP), were examined based on RDA (Figure 6b). RDA analysis showed variation in x-axis 48.9% and y-axis 25.6%, respectively (Figure 6b). Results showed a strong correlation of SAP with soil C, P and C:P ratios, while soil C:N ratio showed a good relationship with EC. Furthermore, strong correlations of soil N and N:P ratio with soil pH, MBN, and MBC were found.

4. Discussion

4.1. Ecological Stoichiometry and Stand Age

Forest ecosystems are considered to be the most adaptive ecosystems, as plants in these systems can survive in poor environmental conditions [9]. Our study shows that the soil fertility of P. massoniana plantations decreased after 48 years after planting and when the available soil nutrients failed to fulfill the plant nutrient requirements, the rapid growth of the tree species would ultimately slow down. The decrease in leaf C, N and P contents and the concomitant increase in the leaf C:N ratios might be due to the changes in the tree biomass and environmental changes [46].
Generally, the aboveground stoichiometric ratios is related to the soil properties [21]. Soil C content greatly depended on organic matter availability and the size of soil humus. This pattern of soil C accumulation was in agreement with some previously published results [47]. The biological N fixation and N inputs through precipitation are considered main sources of N in the soil, while most of the P comes from the disintegration of rocks and the leaching process and less by the organic matter input [48]. In this context, the relationship between soil factors and the stoichiometry of plant communities could be used for elucidating major soil factors that greatly affect these plant communities. Native soil fertility has a vital role in providing nutrients to the plant that control the growth and development of plants, thus controlling the rates of plant metabolism and its overall nutrition [49]. At the beginning of the plantations, the community structure of P. massoniana was not well developed and during speedy growth periods, the dominant species needed to absorb large amounts of the available soil nutrients. Increased soil erosion and weathering could restrict soil nutrients enrichment [50]. With increasing stand age, an increasing trend in the C:P, C:N ratios of P. massoniana plantation was generally observed but decreased after maturity. This shows that the degree of humification of the organic matter has initially decreased and then increased.
In this study the mean leaf N:P ratio was 1.2, which was higher compared to the same species in southern subtropical China [51]; that could be the reason that stand age and soil depth affected N:P ratios in the current study. The understory could possibly decrease N loss, and this was beneficial for increasing N content and limited the P release in the parent soil material [52]. Differences in the rate of nutrient turnover due to different soil N and P sources may also explain this phenomenon [18].

4.2. Stand Age and Plant Component C:N:P Stoichiometry

Growth rates at the senescence stage of P. massoniana decreased and the capacity of N fixing rhizobium also decreased, which ultimately resulted in high N:P ratios. The total amount of elements content in the understory species was positively correlated to the C, N and P contents, similar to observations from Niu et al. [9]. Moreover, positive relationships were found among the changes in the plant stoichiometry and its nutrient contents. Since the factors affecting nutrient limitation in plantations are often very complex and integrated, the threshold for N and P limitation in various ecosystems can hardly be defined [53]. C:N:P ratios are actually the representation of the effects of the nutrients limitation [9]. N is the key factor responsible for the growth of P. massoniana plantations in the area, which has also been shown in different other studies [53]. Limited N and P availability in the terrestrial ecosystems is considered to affect plant community composition, plant traits, biodiversity, and plant growth [6,54]. Therefore, for assessing the elements limitation in plant development, the study of the ratios of N and P has proved to be an effective indicator of productivity and overall ecosystem health [22,52]. In the current study, the leaf N:P ratios was 15.1:1, which is close to the national mean values of 14.1:1 in China [22,34], but higher than the mean value at the global scale (11.8:1) [7]. This value was also lower than that of P. massoniana in the tropical forests in China (16.1:1) and higher than the global values of the genus Pinus, suggesting that the limited growth of P. massoniana are mainly due to N and P (9.6:1) [7].

4.3. Leaf C, N, P Status

Leaves are an important tree organ for photosynthesis [46], while stems are the conducting organs that build a connection between the belowground roots for absorption and the aboveground leaves performing the assimilation [40]. No major dissimilarities were detected for the C content of the younger age groups (Figure 5a). Stand age increased; however, C played an increasingly significant role in the structural basis and plant productivity, similar to previous findings from Yang et al. [46] and Qiu et al. [7]. Similarly, as stand age increased, the N and P contents also increased (Figure 5b,c), due to an increase in the growth rate in the middle age stands, a finding that is in agreement with previous observations from Russo et al. [55]. As trees grew in the middle age stands (18- and 28-years), they required more P-rich ribosomal RNA and N-rich protein for maintaining and supporting their fast growth [56], which was an obvious explanation for the increase of green leaf N and P. Several researchers [22,57] reported that C, N, P ratios are generally negatively correlated to the growth of the stands, thus the lower C:N and C:P ratios (Figure 5d,e) in the green leaves had a possible impact promoting plant growth. Furthermore, the green leaf N:P ratio is a strong indicator of plant nutrient availability. Schreeg [58] proposed that a leaf N:P ratio less than 14 indicates N limitation, between 14–16 indicates N and P limitation, and greater than 16 indicates P limitation, respectively. In our study, the mean N:P value (15.2) was greater than 14 and smaller than the mean value (16.3) in China. It has been observed that in the autotrophic organisms, when the growth rate is relatively low, the N:P ratios increase gradually but decreases as growth rate increases [55]. Thus, in the initial stages of P. massoniana plantations, increased N:P ratios in the leaf were observed and then dropped down with increasing stand age. Our results reflect the limited growth of P. massoniana both due to N and P, which aligns with the results of other studies conducted in the subtropical forests [51,59].
The current results showed that C, N, and P fluctuated significantly among different age groups of P. massoniana stands (Figure 6a–c), indicating that due to litter decomposition more nutrients were returned to the soil. The literature showed that N:P ratio <22 is an indication of P-limited decomposition for herbaceous wetland species [4,52]. The mean N:P ratio in the present study was 14.5, suggesting an N limitation of P. massoniana in senesced leaf decomposition. The mean N:P ratios of the 18- and 28-yr stands were higher than others (Figure 5f), reflecting more N limitations in the 9- and 48-yr stands.

4.4. NRE and PRE in Different Age Groups

For the improvement of nutrient cycling in nutrient poor environments and increased plant fitness, the decomposition of litter provides nutrients to the soil and is closely associated with the growth and development of P. massoniana plantations. The NRE and PRE for P. massoniana stands were 54.4% and 58.7% lower than the mean NRE and PRE for the global forest [60]. Among different age groups of P. massoniana, there were no significant differences observed (Figure 7a), which was discussed in the results of Zhang et al. [6] and Cheng et al. [61]. The current results showed no relationship among the NRE and N status in the soil and green leaves, similar to results from Deng et al. [38]. A recent study from Xu et al. [62] suggests that nutrient resorption and transfer might be an inheriting feature of the tree species and the genetic diversity might be important in determining nutrient resorption. Significantly high PRE values in the 48-yr stands were observed compared to the other age stands (Figure 7c). The trend might be attributed to increasing soil P, SAP and green leaf P, ultimately reducing P resorption in senesced leaf because of stable P supply. NRE: PRE ratios in the 9- and 18-yr stands were considerably less than in the 28- and 48-yr stands (Figure 7b), suggesting that the 28- and 48-yr stands resorbed more N than P compared to the other stand ages. These findings were in agreement with the ‘nutrient resorption hypothesis’ which explains that more N or P would be resorbed when plants are in growing stages under N or P limited environments [63].
In the green and sensed leaf, the N:P status suggested N limitation in the growth of the P. massoniana plantation in the area. However, fertilization experiments are needed to further confirm N limitations and to also determine the N:P ratio thresholds. Planting N fixing plan species in afforestation and reforestation projects could be valuable in maintaining and balancing the nutrient limitations and improving soil N inputs and nutrient cycling [58,64]. In our study, stand age has significantly increased C content in the soil with a fluctuating trend shown by N and P contents in the soil, green, and senesced leaf.

5. Conclusions

Using comprehensive field and lab investigations, we studied the stoichiometric ratios of C, N and P in plant components, leaf, litter, root, understory vegetation and soil in a P. massoniana chronosequence. Our results revealed important differences in different plant components, suggesting that the stoichiometric ratios may be biologically or inherently flexible in the current study area. Higher tree leaf P content and resorption efficiency (PRE) were recorded, but C:P and N:P ratios were markedly lesser in young stands compared to the older stands of P. massoniana. This study suggests that P stoichiometry and PRE are more sensitive degradation indicators of P. massoniana. The P in the leaves was completely resorbed, showing the efficiency of these tree species to adapt their nutrient uptake pathways based on the current soil nutrient availability. We argue that as stand age increases, the nutrient demands of the plantations also increase possibly due to an increase in biomass and climate-induced factors. The soil N:P stoichiometry shows that these changes could enhance the soil quality of the degraded landscapes in central China. Overall, our results show the occurrence of significant changes in C:N:P ratios among different age stands and exhibit the enhancement of soil quality, but it would still take almost two decades to see significant improvement.

Supplementary Materials

The following supporting information can be downloaded at: https://www.mdpi.com/article/10.3390/f13030469/s1, Table S1: Soil properties characterization of different stand ages of P. massoniana plantations. The lower-case letters (a–c) represent significant difference among the age treatments (p < 0.05). Table S2: Contents of C, N and P in different plant components of P. massoniana plantations chronosequence. (±=standard deviation, the lower-case letters (a–c) represent significant difference among the age treatments (p < 0.05).). Table S3: Stoichiometry of C, N and P in different plant components of P. massoniana plantations chronosequence. Values are mean ± standard deviation. Lower-case letters represent significant difference among the treatments.

Author Contributions

Conceptualization: A.A. (Ashfaq Ali), B.A. and Z.Z.; Data curation: S.A., K.A. and M.W.M.; Formal analysis: A.Z., B.A. and S.M.N.; Investigation: A.A. (Ashfaq Ali); Methodology: M.H. and A.A. (Ashfaq Ali); Resources: Z.Z. and S.Y.; Writing—original draft: A.A. (Ashfaq Ali) and M.T.H.; Writing—review & editing: A.A. (Ashfaq Ali), S.F. and M.T.H. All authors have read and agreed to the published version of the manuscript.

Funding

This work was sponsored by the Major Scientific and Technical Innovation Project of Hubei Province, China (Grant number 2018ABA074), the National Key R&D Program of China (Grant number 2016YFD0600201, 2017YFC0505603) and the Long-term Track Research Program of Forest Ecological Station in Three Gorges Reservoir Region (Zigui) of the Yangtze River, China.

Institutional Review Board Statement

Not Applicable.

Informed Consent Statement

Not Applicable.

Data Availability Statement

Not applicable.

Acknowledgments

We express our deepest gratitude to Taizishan Forestry Administration Bureau of Hubei province for providing support and permission to conduct this research. The authors sincerely acknowledge the efforts of Dafeng Hui and Yakov Kuzyakov for scientific review and technical comments on our manuscript. We are thankful to Xin Huang, Kuirong Zheng, Dong Dai and other colleagues for their assistance in data collection. We are grateful to Yongjian Wang and Wei He for technical inputs on the manuscript.

Conflicts of Interest

The authors declare that they have no competing interests.

References

  1. Ågren, G.I. Stoichiometry and nutrition of plant growth in natural communities. Annu. Rev. Ecol. Evol. Syst. 2008, 39, 153–170. [Google Scholar] [CrossRef]
  2. Sardans, J.; Rivas-Ubach, A.; Penuelas, J. The C:N:P stoichiometry of organisms and ecosystems in a changing world: A review and perspectives. Perspect. Plant Ecol. Evol. Syst. 2012, 14, 33–47. [Google Scholar] [CrossRef]
  3. Elser, J.J.; Bracken, M.E.; Cleland, E.E.; Grunner, D.S.; Harpole, W.S.; Hillebrand, H.; Ngai, J.T.; Seabloom, E.W.; Shurin, J.B.; Smith, J.E. Global analysis of nitrogen and phosphorus limitation of primary producers in freshwater, marine and terrestrial ecosystems. Ecol. Lett. 2007, 10, 1135–1142. [Google Scholar] [CrossRef] [PubMed] [Green Version]
  4. Güsewell, S. N: P ratios in terrestrial plants: Variation and functional significance. New Phytol. 2004, 164, 243–266. [Google Scholar] [CrossRef] [PubMed]
  5. Liu, T.Y.; Lin, K.C.; Vadeboncoeur, M.A.; Chen, M.Z.; Huang, M.Y.; Lin, T.C. Understorey plant community and light availability in conifer plantations and natural hardwood forests in Taiwan. Appl. Veg. Sci. 2015, 18, 591–602. [Google Scholar] [CrossRef] [Green Version]
  6. Zhang, W.; Liu, W.; Xu, M.; Deng, J.; Han, X.; Yang, G.; Feng, Y.; Ren, G. Response of forest growth to C: N: P stoichiometry in plants and soils during Robinia pseudoacacia afforestation on the Loess Plateau, China. Geoderma 2019, 337, 280–289. [Google Scholar] [CrossRef]
  7. Qiu, X.; Wang, H.; Peng, D.; Liu, X.; Yang, F.; Li, Z.; Cheng, S. Thinning drives C:N:P stoichiometry and nutrient resorption in Larix principis-rupprechtii plantations in North China. For. Ecol. Manag. 2020, 462, 117984. [Google Scholar] [CrossRef]
  8. Cao, Y.; Chen, Y. Ecosystem C:N:P stoichiometry and carbon storage in plantations and a secondary forest on the Loess Plateau, China. Ecol. Eng. 2017, 105, 125–132. [Google Scholar] [CrossRef]
  9. Niu, S.; Ren, L.; Song, L.; Duan, Y.; Huang, T.; Han, X.; Hao, W. Plant stoichiometry characteristics and relationships with soil nutrients in Robinia pseudoacacia communities of different planting ages. Acta Ecol. Sin. 2017, 37, 355–362. [Google Scholar] [CrossRef]
  10. Yuan, Z.Y.; Chen, H.Y.H. Global-scale patterns of nutrient resorption associated with latitude, temperature and precipitation. Glob. Ecol. Biogeogr. 2009, 18, 11–18. [Google Scholar] [CrossRef]
  11. Battaglia, M.A.; Mitchell, R.J.; Mou, P.P.; Pecot, S.D. Light Transmittance Estimates in a longleaf pine woodland. For. Sci. 2003, 49, 752–762. [Google Scholar]
  12. Jiang, P. C:N:P Stoichiometry and Carbon Storage in a Naturally-Regenerated Secondary Quercus variabilis Forest Age Sequence in the Qinling Mountains, China. Forests 2017, 8, 281. [Google Scholar] [CrossRef]
  13. Dhiedt, E.; Verheyen, K.; De Smedt, P.; Ponette, Q.; Baeten, L. Early Tree Diversity and Composition Effects on Topsoil Chemistry in Young Forest Plantations Depend on Site Context. Ecosystems 2021, 24, 1638–1653. [Google Scholar] [CrossRef]
  14. Carnus, J.-M.; Parrotta, J.; Brockerhoff, E.; Arbez, M.; Jactel, H.; Kremer, A.; Lamb, D.; O’Hara, K.; Walters, B. Planted forests and biodiversity. J. For. 2006, 104, 65–77. [Google Scholar] [CrossRef]
  15. Dangal, S.P.; Das, A.K.; Paudel, S.K. Effectiveness of management interventions on forest carbon stock in planted forests in Nepal. J. Environ. Manag. 2017, 196, 511–517. [Google Scholar] [CrossRef] [PubMed]
  16. Stefańska-Krzaczek, E.; Szymura, T.H. Species diversity of forest floor vegetation in age gradient of managed scots pine stands. Balt. For. 2015, 21, 233–243. [Google Scholar]
  17. Sitzia, T.; Trentanovi, G.; Dainese, M.; Gobbo, G.; Lingua, E.; Sommacal, M. Stand structure and plant species diversity in managed and abandoned silver fir mature woodlands. For. Ecol. Manag. 2012, 270, 232–238. [Google Scholar] [CrossRef]
  18. Jiao, J.; Zhang, Z.; Bai, W.; Jia, Y.; Wang, N. Assessing the Ecological Success of Restoration by Afforestation on the Chinese Loess Plateau. Restor. Ecol. 2012, 20, 240–249. [Google Scholar] [CrossRef]
  19. Szymura, T.H.; Szymura, M. Soil properties and light availability determine species richness and vegetation diversity in an overgrown coppice oak stand. Polish J. Ecol. 2011, 59, 523–533. [Google Scholar]
  20. Kumar, P.; Chen, H.Y.H.; Thomas, S.C.; Shahi, C. Linking resource availability and heterogeneity to understorey species diversity through succession in boreal forest of Canada. J. Ecol. 2018, 106, 1266–1276. [Google Scholar] [CrossRef]
  21. Sun, Z.; Liu, L.; Peng, S.; Penuelas, J.; Zeng, H.; Piao, S. Age-Related Modulation of the Nitrogen Resorption Efficiency Response to Growth Requirements and Soil Nitrogen Availability in a Temperate Pine Plantation. Ecosystems 2016, 19, 698–709. [Google Scholar] [CrossRef] [Green Version]
  22. Zhang, J.; Zhao, N.; Liu, C.; Yang, H.; Li, M.; Yu, G.; Wilcox, K.; Yu, Q.; He, N. C:N:P stoichiometry in China’ s forests: From organs to ecosystems. Funct. Ecol. 2018, 32, 50–60. [Google Scholar] [CrossRef]
  23. Noormets, A.; Epron, D.; Domec, J.C.; McNulty, S.G.; Fox, T.; Sun, G.; King, J.S. Effects of forest management on productivity and carbon sequestration: A review and hypothesis. For. Ecol. Manag. 2014, 355, 124–140. [Google Scholar] [CrossRef] [Green Version]
  24. Ali, A.; Ahmad, A.; Akhtar, K.; Teng, M.; Zeng, W.; Yan, Z.; Zhou, Z. Patterns of Biomass, carbon, and soil properties in Masson pine (Pinus massoniana Lamb) plantations with different stand ages and management practices. Forests 2019, 10, 645. [Google Scholar] [CrossRef] [Green Version]
  25. Ray, G.; Ochoa, C.G.; Deboodt, T.; Mata-Gonzalez, R. Overstory–understory vegetation cover and soil water content observations in western juniper woodlands: A paired watershed study in Central Oregon, USA. Forests 2019, 10, 151. [Google Scholar] [CrossRef] [Green Version]
  26. Dzwonko, Z.; Gawroński, S. Effect of litter removal on species richness and acidification of a mixed oak-pine woodland. Biol. Conserv. 2002, 106, 389–398. [Google Scholar] [CrossRef]
  27. Zemunik, G.; Turner, B.L.; Lambers, H.; Laliberté, E. Diversity of plant nutrient-acquisition strategies increases during long-term ecosystem development. Nat. Plants 2015, 1, 15050. [Google Scholar] [CrossRef]
  28. Bai, Y.F.; Shen, Y.Y.; Jin, Y.D.; Hong, Y.; Liu, Y.Y.; Li, Y.Q.; Liu, R.; Zhang, Z.W.; Jiang, C.Q.; Wang, Y.J. Selective thinning and initial planting density management promote biomass and carbon storage in a chronosequence of evergreen conifer plantations in Southeast China. Glob. Ecol. Conserv. 2020, 24, e01216. [Google Scholar] [CrossRef]
  29. Wen, L.; Lei, P.; Xiang, W.; Yan, W.; Liu, S. Forest Ecology and Management Soil microbial biomass carbon and nitrogen in pure and mixed stands of Pinus massoniana and Cinnamomum camphora differing in stand age. For. Ecol. Manag. 2014, 328, 150–158. [Google Scholar] [CrossRef]
  30. Zhao, J.; Wang, X.; Shao, Y.; Xu, G.; Fu, S. Effects of vegetation removal on soil properties and decomposer organisms. Soil Biol. Biochem. 2011, 43, 954–960. [Google Scholar] [CrossRef]
  31. Liu, C.L.C.; Kuchma, O.; Krutovsky, K.V. Mixed-species versus monocultures in plantation forestry: Development, benefits, ecosystem services and perspectives for the future. Glob. Ecol. Conserv. 2018, 15, e00419. [Google Scholar] [CrossRef]
  32. Wilson, D.S.; Puettmann, K.J. Density management and biodiversity in young Douglas-fir forests: Challenges of managing across scales. For. Ecol. Manag. 2007, 246, 123–134. [Google Scholar] [CrossRef]
  33. Yang, H.-X.; Wang, S.-L.; Fan, B.; Zhang, W.-D.; Wei, C.-E. Dynamics of nutrients in an age sequence of Pinus massoniana plantation. Chin. J. Appl. Ecol. 2010, 21, 1907–1914. [Google Scholar]
  34. Cui, N.J.; Liu, X.B.; ZHANG, J. The distribution pattern of carbon, nitrogen and phosphorus and the stoichimotey characteristics of Pinusmassoniana plantion in different ages. Ecol. Environ. Sci 2014, 23, 188. [Google Scholar]
  35. State Forestry Administration (SFA). Tree Biomass Methods and Related Parameters of Carbon Accumulating in Pinus Massonina; China Forestry Publisher: Beijing, China, 2014. [Google Scholar]
  36. Peng, S.L.; Li, Q.F.; Li, D.; Wang, Z.F.; Wang, D.P. Genetic diversity of Pinus massoniana revealed by RAPD markers. Silvae Genet. 2003, 52, 60–62. [Google Scholar]
  37. Song, Y.-J.; Tian, W.-B.; Liu, X.-Y.; Yin, F.; Cheng, J.-Y.; Zhu, D.-N.; Ali, A.; Yan, E.-R. Associations between litterfall dynamics and micro-climate in forests of Putuoshan Island, Zhejiang, China. Chin. J. Plant Ecol. 2016, 40, 1154. [Google Scholar] [CrossRef] [Green Version]
  38. Deng, J.; Wang, S.; Ren, C.; Zhang, W.; Zhao, F.; Li, X. Nitrogen and Phosphorus Resorption in Relation to Nutrition Limitation along the Chronosequence of Black Locust (Robinia pseudoacacia L.) Plantation. Forests 2019, 10, 261. [Google Scholar] [CrossRef] [Green Version]
  39. Saeed, S.; Yujun, S.; Beckline, M.; Chen, L.; Zhang, B. Forest edge effect on biomass carbon along altitudinal gradients in Chinese Forest edge effect on biomass carbon along altitudinal gradients in Chinese Fir (Cunninghamia lanceolata): A study from Southeastern China. Carbon Manag. 2019, 10, 11–22. [Google Scholar] [CrossRef]
  40. Liu, W.D.; Su, J.R.; Li, S.F.; Zhang, Z.J.; Li, Z.W. Stoichiometry study of C, N and P in plant and soil at different successional stages of monsoon evergreen broad-leaved forest in Pu’er, Yunnan Province. Acta Ecol. Sin. 2010, 30, 6581–6590. [Google Scholar]
  41. Vergutz, L.; Manzoni, S.; Porporato, A.; Novais, R.F.; Robert, B. Jackson Global resorption efficiencies and concentrations of carbon and nutrients in leaves of terrestrial plants. Ecol. Monogr. 2012, 82, 205–220. [Google Scholar] [CrossRef] [Green Version]
  42. Bao, S.D. Agro-Chemical Analysis of Soil; Agricultural Publish House of China: Beijing, China, 2000. [Google Scholar]
  43. Ali, A.; Dai, D.; Akhtar, K.; Teng, M.; Yan, Z.; Urbina-Cardona, N.; Mullerova, J.; Zhou, Z. Response of understory vegetation, tree regeneration, and soil quality to manipulated stand density in a Pinus massoniana plantation. Glob. Ecol. Conserv. 2019, 20, e00775. [Google Scholar] [CrossRef]
  44. Rahman, M.; Zhang, K.; Wang, Y.; Ahmad, B.; Ahmad, A.; Zhang, Z.; Khan, D.; Muhammad, D.; Ali, A. Variations in soil physico-chemical properties, soil stocks, and soil stoichiometry under different soil layers, the major forest region Liupan Mountains of Northwest China. Braz. J. Biol. 2022, 84, e256565. [Google Scholar] [CrossRef] [PubMed]
  45. Vance, E.D.; Brookes, P.C.; Jeninson, D.S. An Extraction Method for Measuring Microbial Biomass C. Soil Biol. Biochem. 1987, 19, 703–707. [Google Scholar] [CrossRef]
  46. Yang, Y.; Liu, B.; An, S. Ecological stoichiometry in leaves, roots, litters and soil among di ff erent plant communities in a deserti fi ed region of Northern China. Catena 2018, 166, 328–338. [Google Scholar] [CrossRef]
  47. Forrester, D.I.; Bauhus, J.; Cowie, A.L.; Vanclay, J.K. Mixed-species plantations of Eucalyptus with nitrogen-fixing trees: A review. For. Ecol. Manag. 2006, 233, 211–230. [Google Scholar] [CrossRef] [Green Version]
  48. Liu, Y.; Lei, P.; Xiang, W.; Yan, W.; Chen, X. Accumulation of soil organic C and N in planted forests fostered by tree species mixture. Biogeosciences 2017, 14, 3937–3945. [Google Scholar] [CrossRef] [Green Version]
  49. Yang, X.; Tang, Z.; Ji, C.; Liu, H.; Ma, W.; Mohhamot, A.; Zheng, C. Scaling of nitrogen and phosphorus across plant organs in shrubland biomes. Sci. Rep. 2014, 4, 5448. [Google Scholar] [CrossRef]
  50. Yang, J.J.; Zhang, X.R.; Ma, L.S.; Chen, Y.N.; Dang, Y.H.; An, S.S. Ecological stoichiometric relationships between components of Robinia pseudoacacia forest in Loess Plateau. Acta Pedol. Sin. 2014, 51, 133–142. [Google Scholar]
  51. Liu, J.; Gu, Z.; Shao, H.; Zhou, F.; Peng, S. N–P stoichiometry in soil and leaves of Pinus massoniana forest at different stand ages in the subtropical soil erosion area of China. Environ. Earth Sci. 2016, 75, 1091. [Google Scholar] [CrossRef]
  52. Pang, D.; Wang, G.; Li, G.; Sun, Y.; Liu, Y. Ecological Stoichiometric Characteristics of Two Typical Plantations in the Karst Ecosystem of Southwestern China. Forests 2018, 9, 56. [Google Scholar] [CrossRef] [Green Version]
  53. Zhang, C.; Xie, G.; Fan, S.; Zhen, L. Variation in vegetation structure and soil properties, and the relation between understory plants and environmental variables under different phyllostachys pubescens forests in Southeastern China. Environ. Manag. 2010, 45, 779–792. [Google Scholar] [CrossRef] [PubMed]
  54. Aerts, R.; Caluwe, H.D.; Beltman, B. Is the relation between nutrient supply and biodiversity co-determined by the type of nutrient limitation? Oikos 2003, 101, 489–498. [Google Scholar] [CrossRef]
  55. Russo, D.; Marziliano, P.A.; Macri, G.; Proto, A.R.; Zimbalatti, G.; Lombardi, F. Does Thinning Intensity Affect Wood Quality? An Analysis of Calabrian Pine in Southern Italy Using a Non-Destructive Acoustic Method. Forests 2019, 10, 303. [Google Scholar] [CrossRef] [Green Version]
  56. Matzek, V.; Vitousek, P.M. LETTER N:P stoichiometry and protein: RNA ratios in vascular plants: An evaluation of the growth-rate hypothesis. Ecol. Lett. 2009, 12, 765–771. [Google Scholar] [CrossRef] [PubMed]
  57. Xue, L.; Jacobs, D.F.; Zeng, S.; Yang, Z.; Guo, S.; Liu, B. Relationship between above-ground biomass allocation and stand density index in Populus × euramericana stands. Forestry 2012, 85, 611–619. [Google Scholar] [CrossRef] [Green Version]
  58. Schreeg, L.A.; Santiago, L.S.; Wright, S.J.B.L.T. Stem, root, and older leaf N:P ratios are more responsive R eports R eports. Ecology 2014, 95, 2062–2068. [Google Scholar] [CrossRef] [Green Version]
  59. Han, W.; Fang, J.; Guo, D.; Zhang, Y. Leaf nitrogen and phosphorus stoichiometry across 753 terrestrial plant species in China. New Phytol. 2005, 168, 377–385. [Google Scholar] [CrossRef]
  60. Reed, S.C.; Townsend, A.R.; Davidson, E.A.; Cleveland, C.C. Stoichiometric patterns in foliar nutrient resorption across multiple scales. New Phytol. 2012, 196, 173–180. [Google Scholar] [CrossRef]
  61. Cheng, X.; Yu, M.; Wang, G.G. Effects of Thinning on Soil Organic Carbon Fractions and Soil Properties in Cunninghamia lanceolata Stands in Eastern China. Forests 2017, 8, 198. [Google Scholar] [CrossRef] [Green Version]
  62. Xu, M.; Zhong, Z.; Sun, Z.; Han, X.; Ren, C.; Yang, G. Soil available phosphorus and moisture drive nutrient resorption patterns in plantations on the Loess Plateau. For. Ecol. Manag. 2020, 461, 117910. [Google Scholar] [CrossRef]
  63. Han, X.; Gao, G.; Chang, R.; Li, Z.; Ma, Y.; Wang, S.; Wang, C.; Lü, Y.; Fu, B. Changes in soil organic and inorganic carbon stocks in deep pro fi les following cropland abandonment along a precipitation gradient across the Loess Plateau of China. Agric. Ecosyst. Environ. 2018, 258, 1–13. [Google Scholar] [CrossRef]
  64. Houlton, B.Z.; Wang, Y.-P.; Vitousek, P.M.; Field, C.B. A unifying framework for dinitrogen fixation in the terrestrial biosphere. Nature 2008, 454, 327. [Google Scholar] [CrossRef] [PubMed]
Figure 1. Study area location in the Jingshan County, Hubei province, central China. Different shapes represent different stand age groups of P. massoniana.
Forests 13 00469 g001
Figure 2. Soil properties in soil layer of P. massoniana chronosequence. Lines represent mean value with three replicates (n = 3; p < 0.05). (ad) represents MBN, MBC, SAP, SAN in different soil depths, repectively. Error bars show standard error.
Forests 13 00469 g002
Figure 3. Changes in contents of soil carbon (C), nitrogen (N), and phosphorus (P) (ac) and stoichiometric ratios (df) in a Masson pine chronosequence and within soil layers (0–40 cm). Error bars show standard error while the lines represent mean value with three replicates.
Forests 13 00469 g003
Figure 4. Pattern of aboveground and belowground component C, N, P stoichiometry Masson pine chronosequence. Error bars show standard error while the lines represent mean value with three replicates (n = 3), whereas the lower-case letters (ac) represent the three among the stand age (p < 0.05). (df) shows ratios of C, N and P in the above and belowground components.
Forests 13 00469 g004
Figure 5. Change in the green and senesced leaf contents of C, N and P (ac) and stoichiometric ratios (df) in a chronosequence of P. massoniana plantations. Error bars show standard error while the lines represent average value with three replicates (n = 3), whereas the lower-case letters (a–d) represent the trend among stand age (p < 0.05).
Forests 13 00469 g005
Figure 6. Changes in (a) NRE (nitrogen resorption efficiency), (b) NRE: PRE and (c) PRE in stand ages, and the relationship among NRE and PRE (d) among P. massoniana plantation chronosequence. Lines represent the average value with three replicates (n = 3), whereas the lower-case letters (a,b) represent the trend among stand age (p < 0.05). Error bars represent standard error.
Forests 13 00469 g006
Figure 7. Relationship between (a) tree and soil stoichiometry, (a); R2 = 0.5437, p = 0.000: (b); R2 = 0.4247, p < 0.005 (c) Nutrient resorption efficiency and leaf stoichiometry, (NRE-nitrogen resorption efficiency) R2 = 0.3009, p = 0.6314: (d); (PRE-phosphorus resorption efficiency) R2 = 0.6587, p < 0.001, in P. massoniana chronosequence.
Forests 13 00469 g007
Figure 8. (a) The relationship between plant components (blue-arrows) and C:N:P contents (red-arrows) in the stand age of P. massoniana plantations chronosequence was determined using principal component analysis (PCA). (b) Redundancy analysis (RDA) was used to determine the relationships between soil properties (blue-arrows) and C:N:P ratios (red-arrows) in different stand age treatments (9-, 18-, 28-, 48-year). Soil available phosphorus (SAP), microbial biomass carbon (MBC), microbial biomass nitrogen (MBN), soil water content (SWC), bulk density (BD).
Forests 13 00469 g008
Table 1. Stand characteristics in different age groups in P. massoniana plantation in the study area. Values are presented as mean ± standard deviation. DBH: Diameter at breast height.
Stand Age (Year)Stand Density
(Trees ha−1)
DBH (cm)Height (m)Light Transmittance (%)
9-yr3651 ± 3939.1 ± 0.75.74 ± 0.335.1 ± 2.8
18-yr1556 ± 23914.9 ± 0.211.4 ± 0.933.6 ± 2.5
28-yr1196 ± 5121.6 ± 0.415.3 ± 0.649.8 ± 3.5
48-yr774 ± 9225.5 ± 2.916.8 ± 2.248.2 ± 5.4
Publisher’s Note: MDPI stays neutral with regard to jurisdictional claims in published maps and institutional affiliations.

