Article

Does Vertical Greening Really Play Such a Big Role in an Indoor Thermal Environment?

School of Architecture and Art, Central South University, Changsha 410083, China
*
Author to whom correspondence should be addressed.
Forests 2022, 13(2), 358; https://doi.org/10.3390/f13020358
Submission received: 20 January 2022 / Revised: 15 February 2022 / Accepted: 18 February 2022 / Published: 20 February 2022
(This article belongs to the Special Issue Urban Forest and Urban Microclimate)

Abstract

:
Little attention has been paid to indoor cooling compared with the surface cooling of vertical greening. The few studies on the indoor cooling of vertical greening are almost all conducted in a hot climate area with windowless building models, which is suspected to exaggerate the role of vertical greening in an indoor thermal environment. Through two improvements, this paper explored the realistic impact of vertical greening on an indoor thermal environment. First, we built models according to the actual window-to-wall ratio rather than a fictitious model without windows. Second, an annual cycle evaluation, considering both hot summer and cold winter, was used to replace the typical hot day. With the support of Envi-met and Kriging models, the results revealed that the existing research not only exaggerated vertical greening’s positive effects on an indoor thermal environment in hot seasons but also ignored its potential harms to thermal perception in cold seasons. These exaggerated results could easily cause the abuse of vertical greening in cities. In actual windowed buildings, the role of vertical greening in indoor temperatures is not always positive, and the positive effect is not as strong as previous studies suggest.

1. Introduction

Since the twentieth century, investigations on urban greening have substantially increased [1,2,3]. Among those studies, more and more attention has been paid to the use of vertical greening, because building facades occupy a higher and higher proportion of the city [4,5,6]. Vertical greening has been confirmed as an effective contributor to cooling in the built environment [7,8,9]. Although the wall-surface temperature and indoor air temperature are closely linked [10,11], regarding vertical greening, the majority of concern is given to wall-surface cooling rather than to indoor air cooling [12,13,14]. Only a few studies have investigated indoor air cooling of vertical greening [15,16]. Olivieri et al. pointed out that vegetal façades reduced a building’s average interior air temperature by 4 °C [17]. Similarly, another experiment also claimed that an indoor mean air temperature decrease of 4 °C was achieved, with a maximum decrement of 6 °C observed [18]. In Coma’s study, the mean reduction of indoor air temperature was only 1 °C [19]. In addition, Haggag et al. measured indoor air temperatures during the hottest month of July in a hot and arid climate zone, where the green facades maintained a reduction of 5 °C in indoor air temperature [20]. Existing studies have concluded that room size and weather conditions are two factors affecting the cooling performance of vertical greening [21], and another experiment with a similar room size and climatic conditions only reached a maximum indoor cooling of 1.5 °C [22]. Comparing the settings, in Chen’s experiment [22], the building model had windows, but for the other studies mentioned above, they were all conducted in windowless buildings. Glasses have a higher solar heat gain coefficient (SHGC) and a higher coefficient of heat conductivity [23,24], which is the main channel of heat exchange. Besides this, previous investigations have found that the cooling effect of vertical greening in summer was stronger than of that in winter [25,26]. Almost all of the existing articles about indoor cooling, in terms of vertical greening, choose a typical summer day to evaluate [27,28]. These deficiencies all contribute to the exaggeration of vertical greening’s performance on indoor cooling. These magnified performances could lead to the abuse of vertical greening.
This research aimed to pragmatically evaluate the indoor cooling performance of vertical greening. Compared with the previous studies, two improvements were made in this research. First, this study no longer took the typical summer day as the research cycle, and the research area was not limited to the tropical region; instead, the annual evaluation cycle was used to explore vertical greening in hot summer and cold winter climate zones. Second, this research abandoned the windowless model and constructed the research model according to the actual window-to-wall ratio.
The typical building model in Changsha, China, was built according to the actual layout of the urban environment. Subsequently, the Envi-met model was employed as the research tool after the field measurement was conducted to validate its accuracy [29,30]. The average meteorological data of the 12 months in 2020 were reviewed and used as the boundary conditions. Finally, the annual distributions of indoor temperature for five vertical greening scenarios were fitted with the Kriging model [31].

2. Materials and Methods

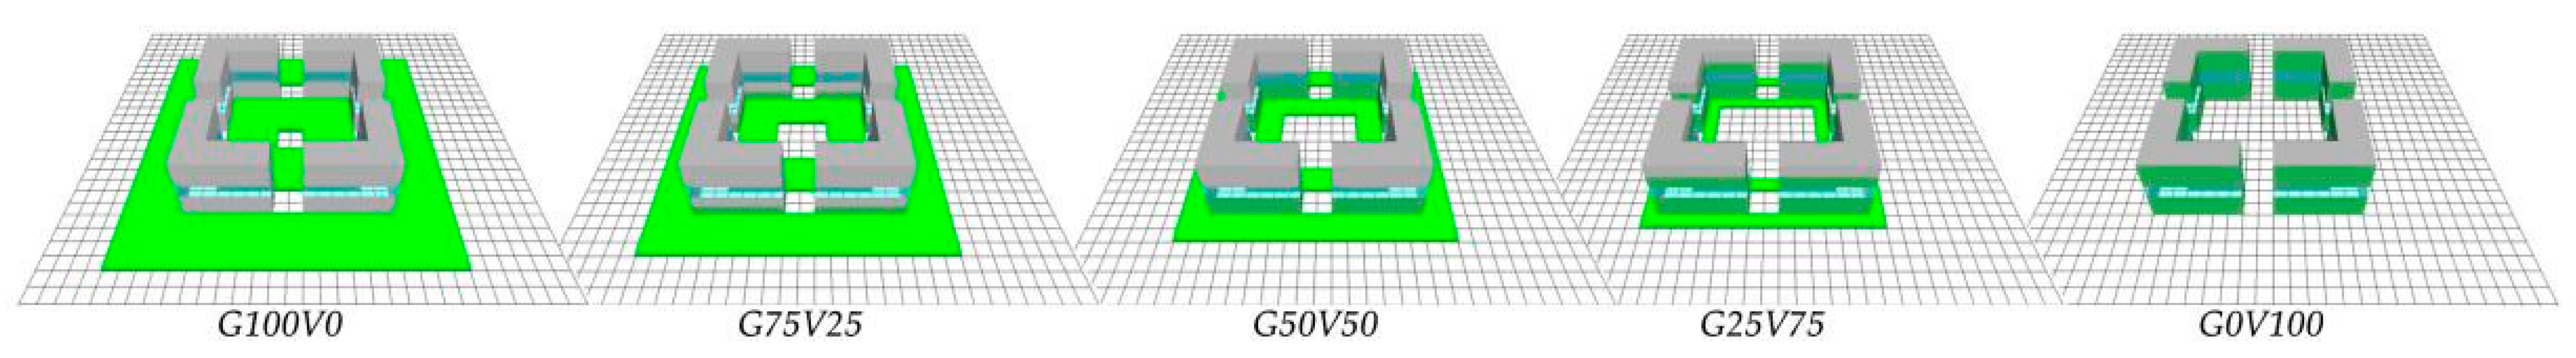
2.1. Analytical Scenarios

The study was carried out in Changsha, located at 28.19° N, 113.22° E, in the subtropical monsoon climate zone. Changsha has become one of the “four furnaces” in China [32], whose mean temperature ranges from 16.8 to 17.3 °C. Changsha experiences the lowest temperature between 4.4 and 5.1 °C in January, while the highest temperature above 30 °C happens in July [33]. The extremely hot summer brings threats to energy consumption and citizens’ health [34,35]. Cooling the city, therefore, is an urgent issue in climate-responsive urban planning [36]. Urban planners concentrate on the total amount of greening in the form of indicators, including vertical greening ratio and ground greening ratio. Meanwhile, ground grass has no shading effect on indoor thermal environments compared with vertical greening, which is essential to indoor cooling [37]. Therefore, this model explored the changes of an indoor thermal environment during the transformation from ground greening to vertical greening when the total greening area was fixed. Considering the mean window-to-wall ratios of Changsha, we adopted a 20% window-to-wall ratio in this research [38]. The research model covered an area of 7744 m2 and was composed of 22 × 22 grids. The buildings were 20 m high and 8 m wide. The research model is presented in Figure 1, where V is the ratio of vertical greening, and G represents the ratio of ground greening.
The area of the wall in each model was 7680 m2, where the window area was 1536 m2. The areas of each wall component in every scenario are displayed in Table 1.
In this research, we adopted grass as the plant of ground greening and took modular greening as the vertical greening. The attributes of ground greening and vertical greening are listed in Table 2.
Clear float glass is commonly used in Changsha’s residential buildings. Here, we employed clear float glass as the material of the window in this research. The parameters of the clear float glass are shown in Table 3 [39].
The walls of the buildings had a thickness of 310 mm, and were composed of concrete, with a roughness length of 0.02. The attributes of concrete are presented in Table 4 [40].

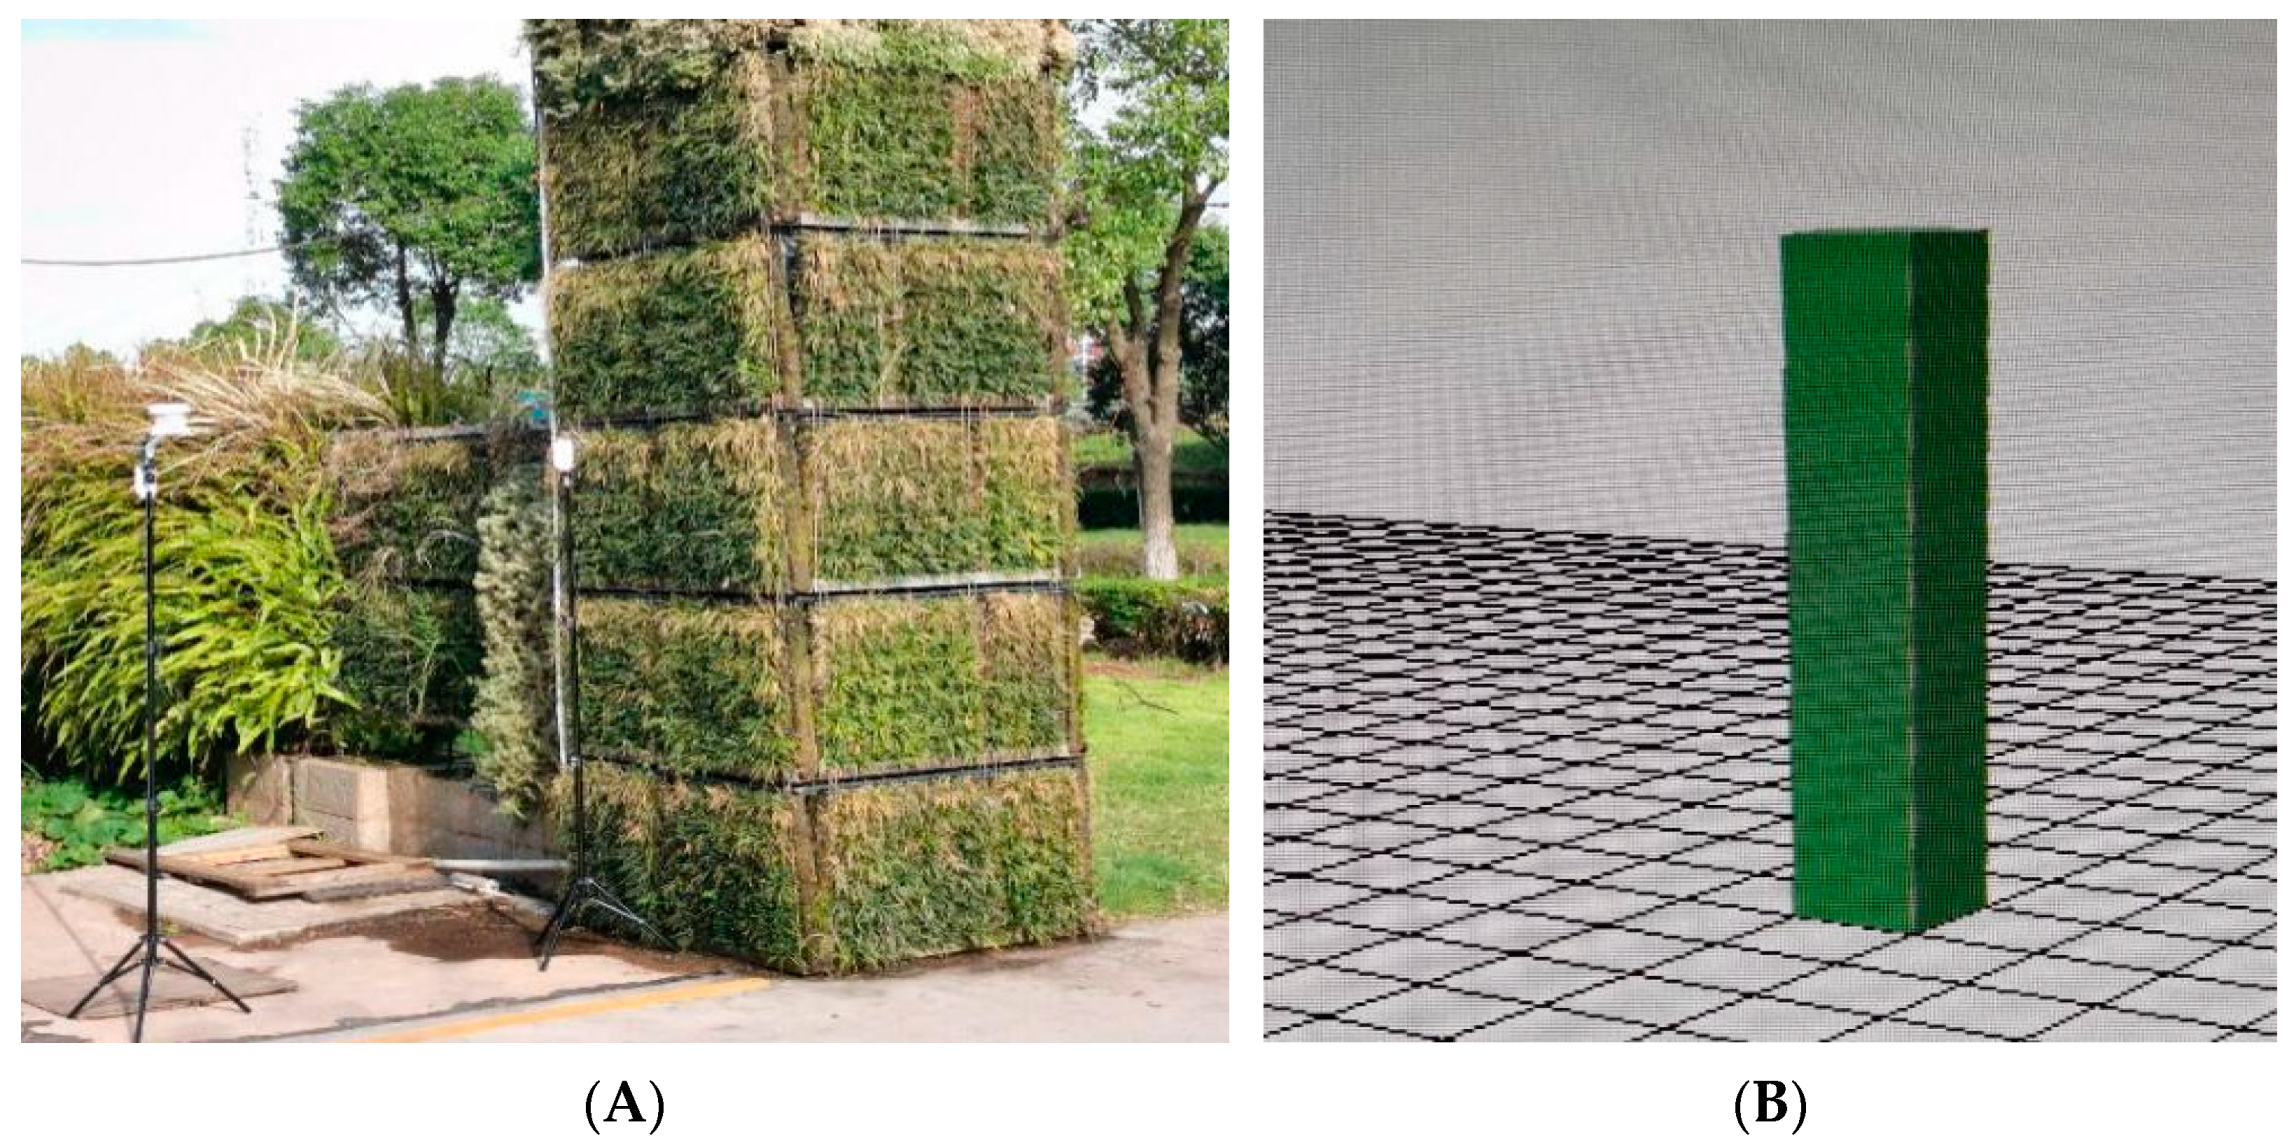
2.2. Simulation Tools
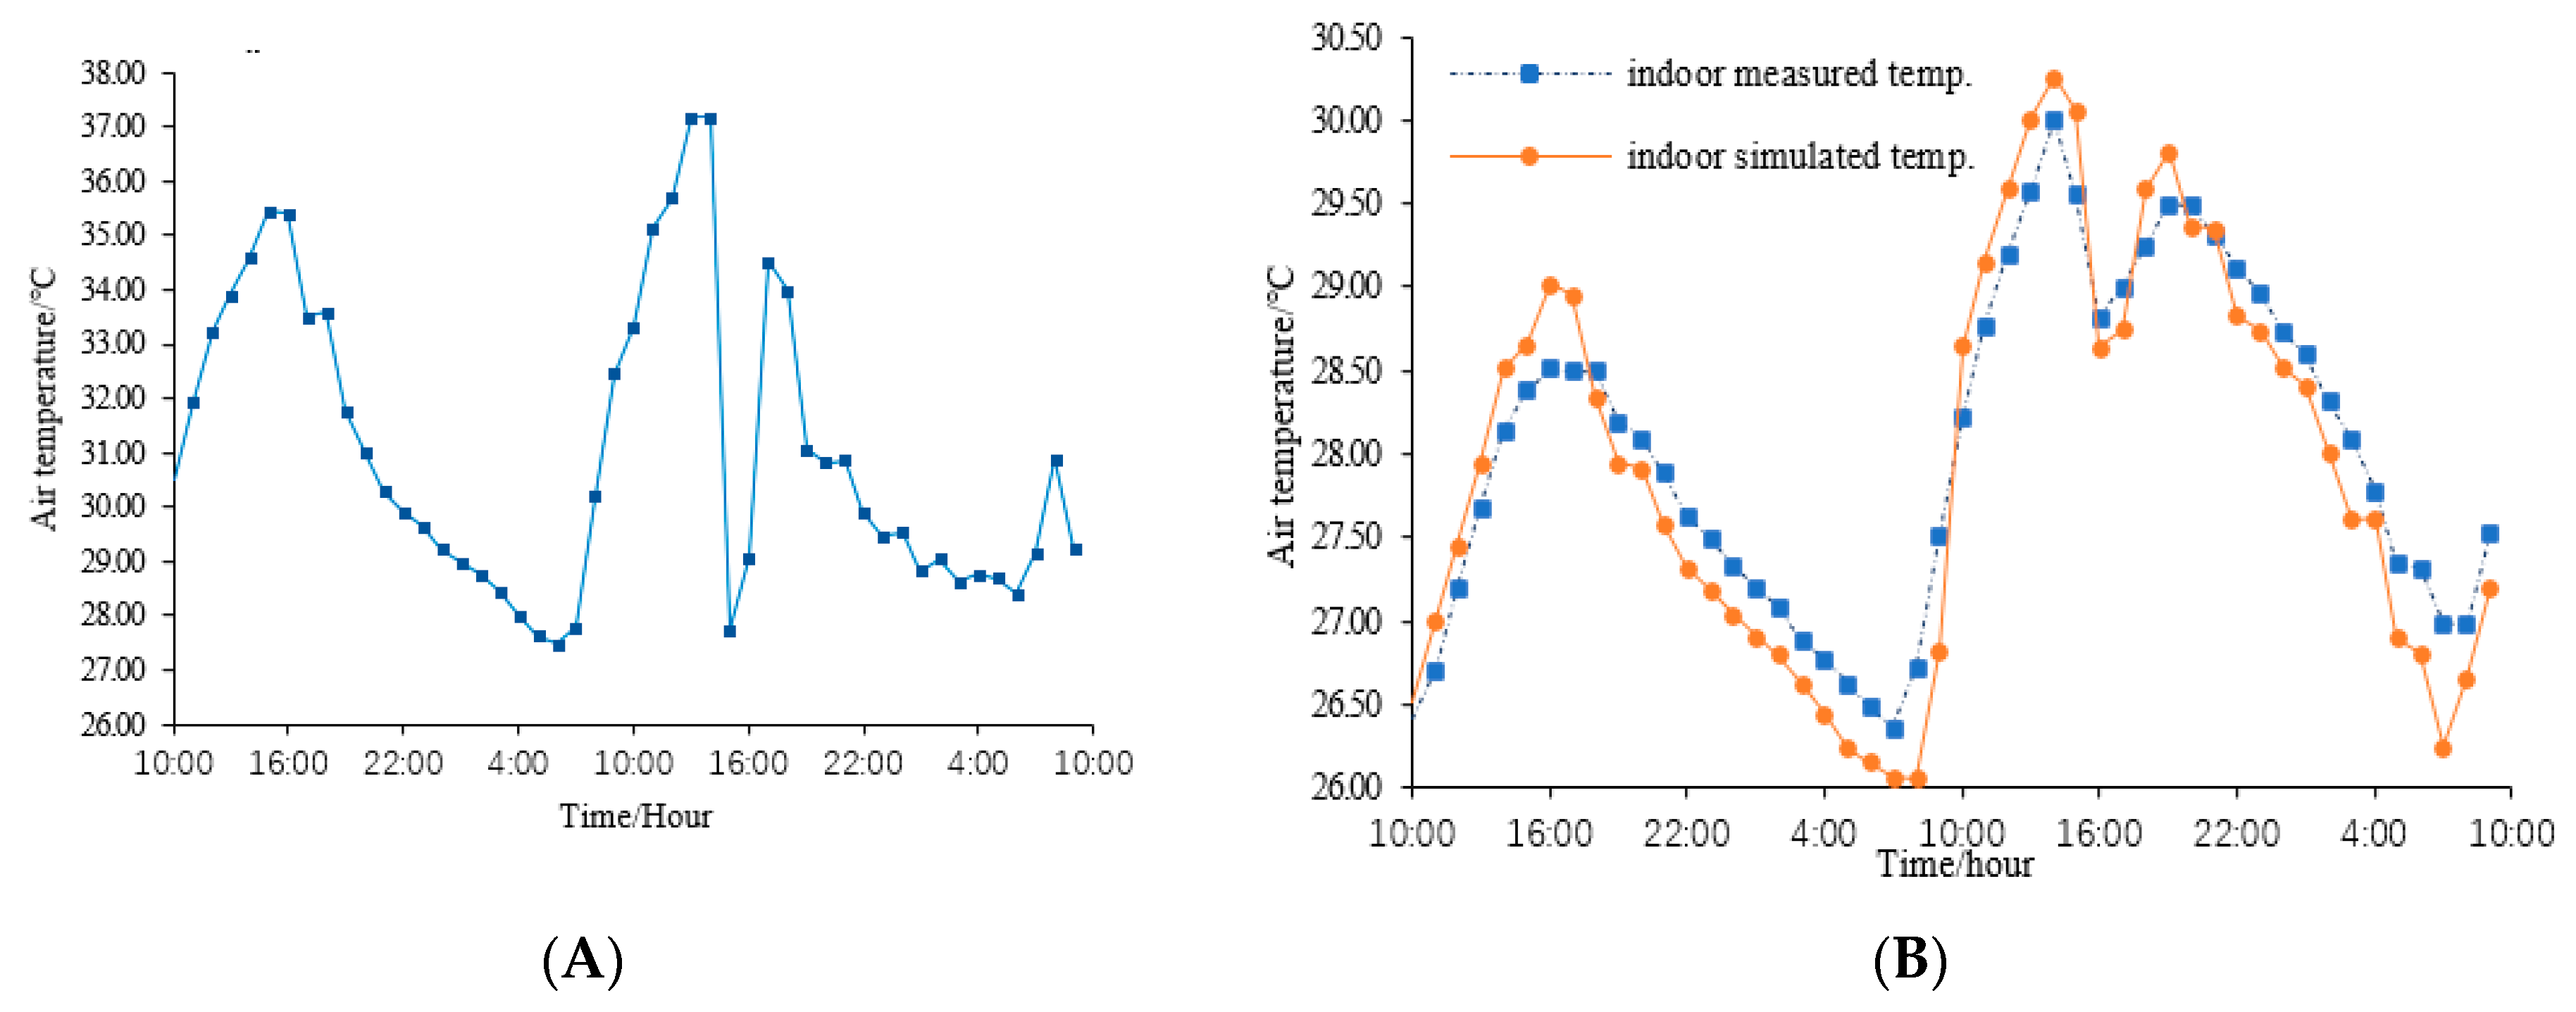
The Envi-met model was employed as the research tool in this research. Unlike other simulation tools, Envi-met can model vegetated surfaces and their substrates, including heat and moisture transfer, as well as their interactions with the building [41]. It calculates the leaf temperature individually for each model grid box and can also simulate the photosynthetic rate, the evapotranspiration rate, and the water availability in the soil, all of which make Envi-met preferable to the other simulation tools in the simulation of facade greening [42]. Envi-met derives the indoor air temperature from the heat convection on the interior surface of the associated walls and roofs and the energy transmitted through the transparent glass [29]. The indoor temperature is calculated by Equation (1) [43].
T i * = T i + 1 C p V e = 1 E A ( e ) ( Q s w t r ( e ) + h c , i ( T 3 * ( e ) T i ) ) d t
In the formula, T i means the original air temperature in zone i, V is the volume of zone i, C p represents the specific heat capacity of air, and T i * indicates the updated air temperature after time dt. E shows the number of façades in zone i, and A(e) is the surface area of zone i. Q s w t r indicates the shortwave radiation transmitted into zone i though the transparent façade e, and h c , i means the heat convection coefficient between the inner walls and ambient air.
Many documents have validated the accuracy of the Envi-met model [44,45]. For example, it was reported that the square correlation coefficients (R2) of measurement and simulation were between 0.52 and 0.97 for all the variables, and those of air temperature ranged from 0.91 to 0.97 [46]. This study also conducted a survey to confirm the accuracy of the Envi-met model in terms of simulating the effects of greening on indoor temperature.
The validation survey was conducted in Changsha (113.109° E, 28.235° N) from 22 to 24 August 2020. A HOBO Data Logger (MX2302), which is a compact, battery-powered device equipped with an internal microprocessor, data storage, and sensors, was employed to record the temperatures. The field experiment is shown in Figure 2A, where two HOBO Data Loggers were set to record the air temperature both inside and outside the vertical greening building. The Envi-met model of the experiment is presented in Figure 2B. The variation of the outdoor air temperature recorded by the Data Logger is presented in Figure 3A, and the indoor air temperatures as measured and simulated are shown in Figure 3B.
Statistical results revealed that the Pearson coefficient of the simulated and measured indoor air temperatures was 0.969, which confirmed that the Envi-met model was reliable for this research.

2.3. Data Resources

Meteorological data applied in this research were obtained from the Changsha historical weather website (http://lishi.tianqi.com/changsha/, accessed on 20 April 2021). The annual temperatures of 2020 indicated that August was the hottest month of Changsha. The average meteorological data within August at each hour in 2020 were intensively studied. Analytical results showed that the mean high air temperature in August was 35 °C, and that of the average low air temperature was 26 °C. The mean wind velocity was 3.5 m/s, and the relative humidity ranged from 78% to 88%. Similarly, the remaining 11 months were also intensively reviewed. The averages of the meteorological data of each month are shown in Table 5 and are used as the boundary conditions in the following simulations.
In addition, the other basic settings of the simulation are shown in Table 6.

3. Results and Discussion

According to the average meteorological data of the 12 months in 2020, 60 (5 × 12) models were simulated, where 5 indicated the 5 greening scenarios and 12 meant the 12 months. In total, 1440 (24 × 5 × 12) indoor air temperatures were collected. A group of the simulated models of the five scenarios is shown in Figure 4, representing the indoor air temperatures at 6:00 in August 2020.

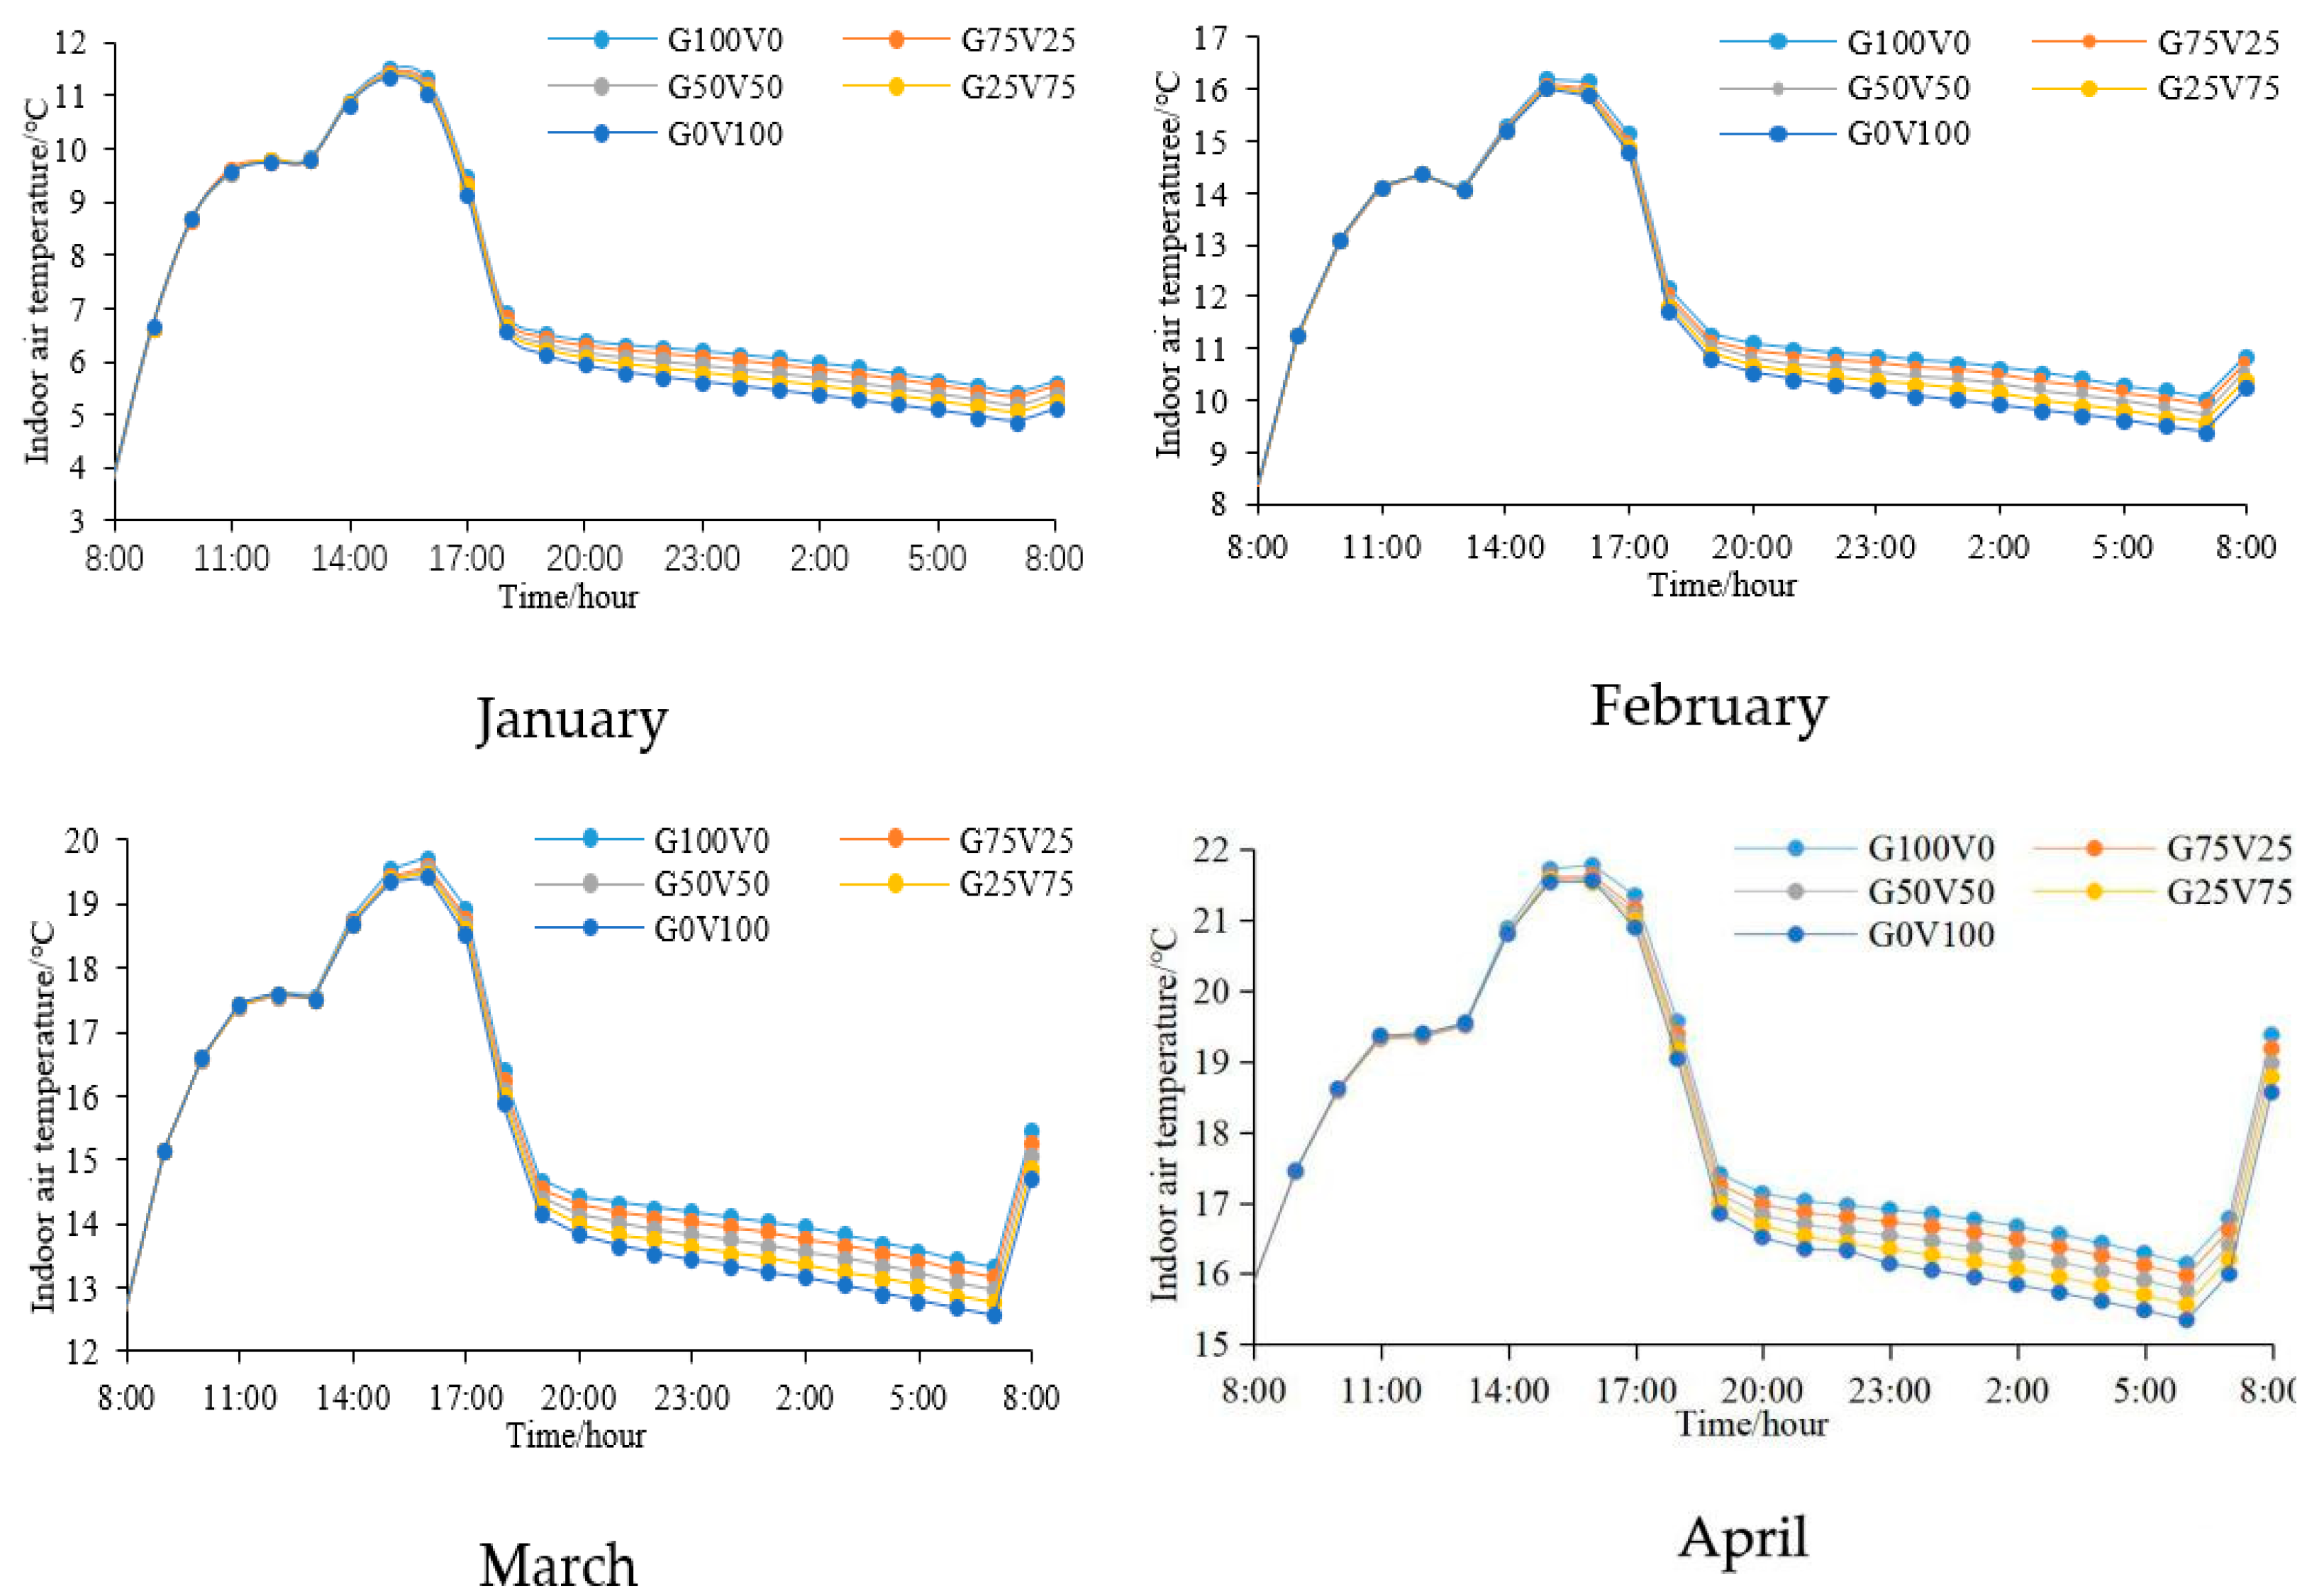
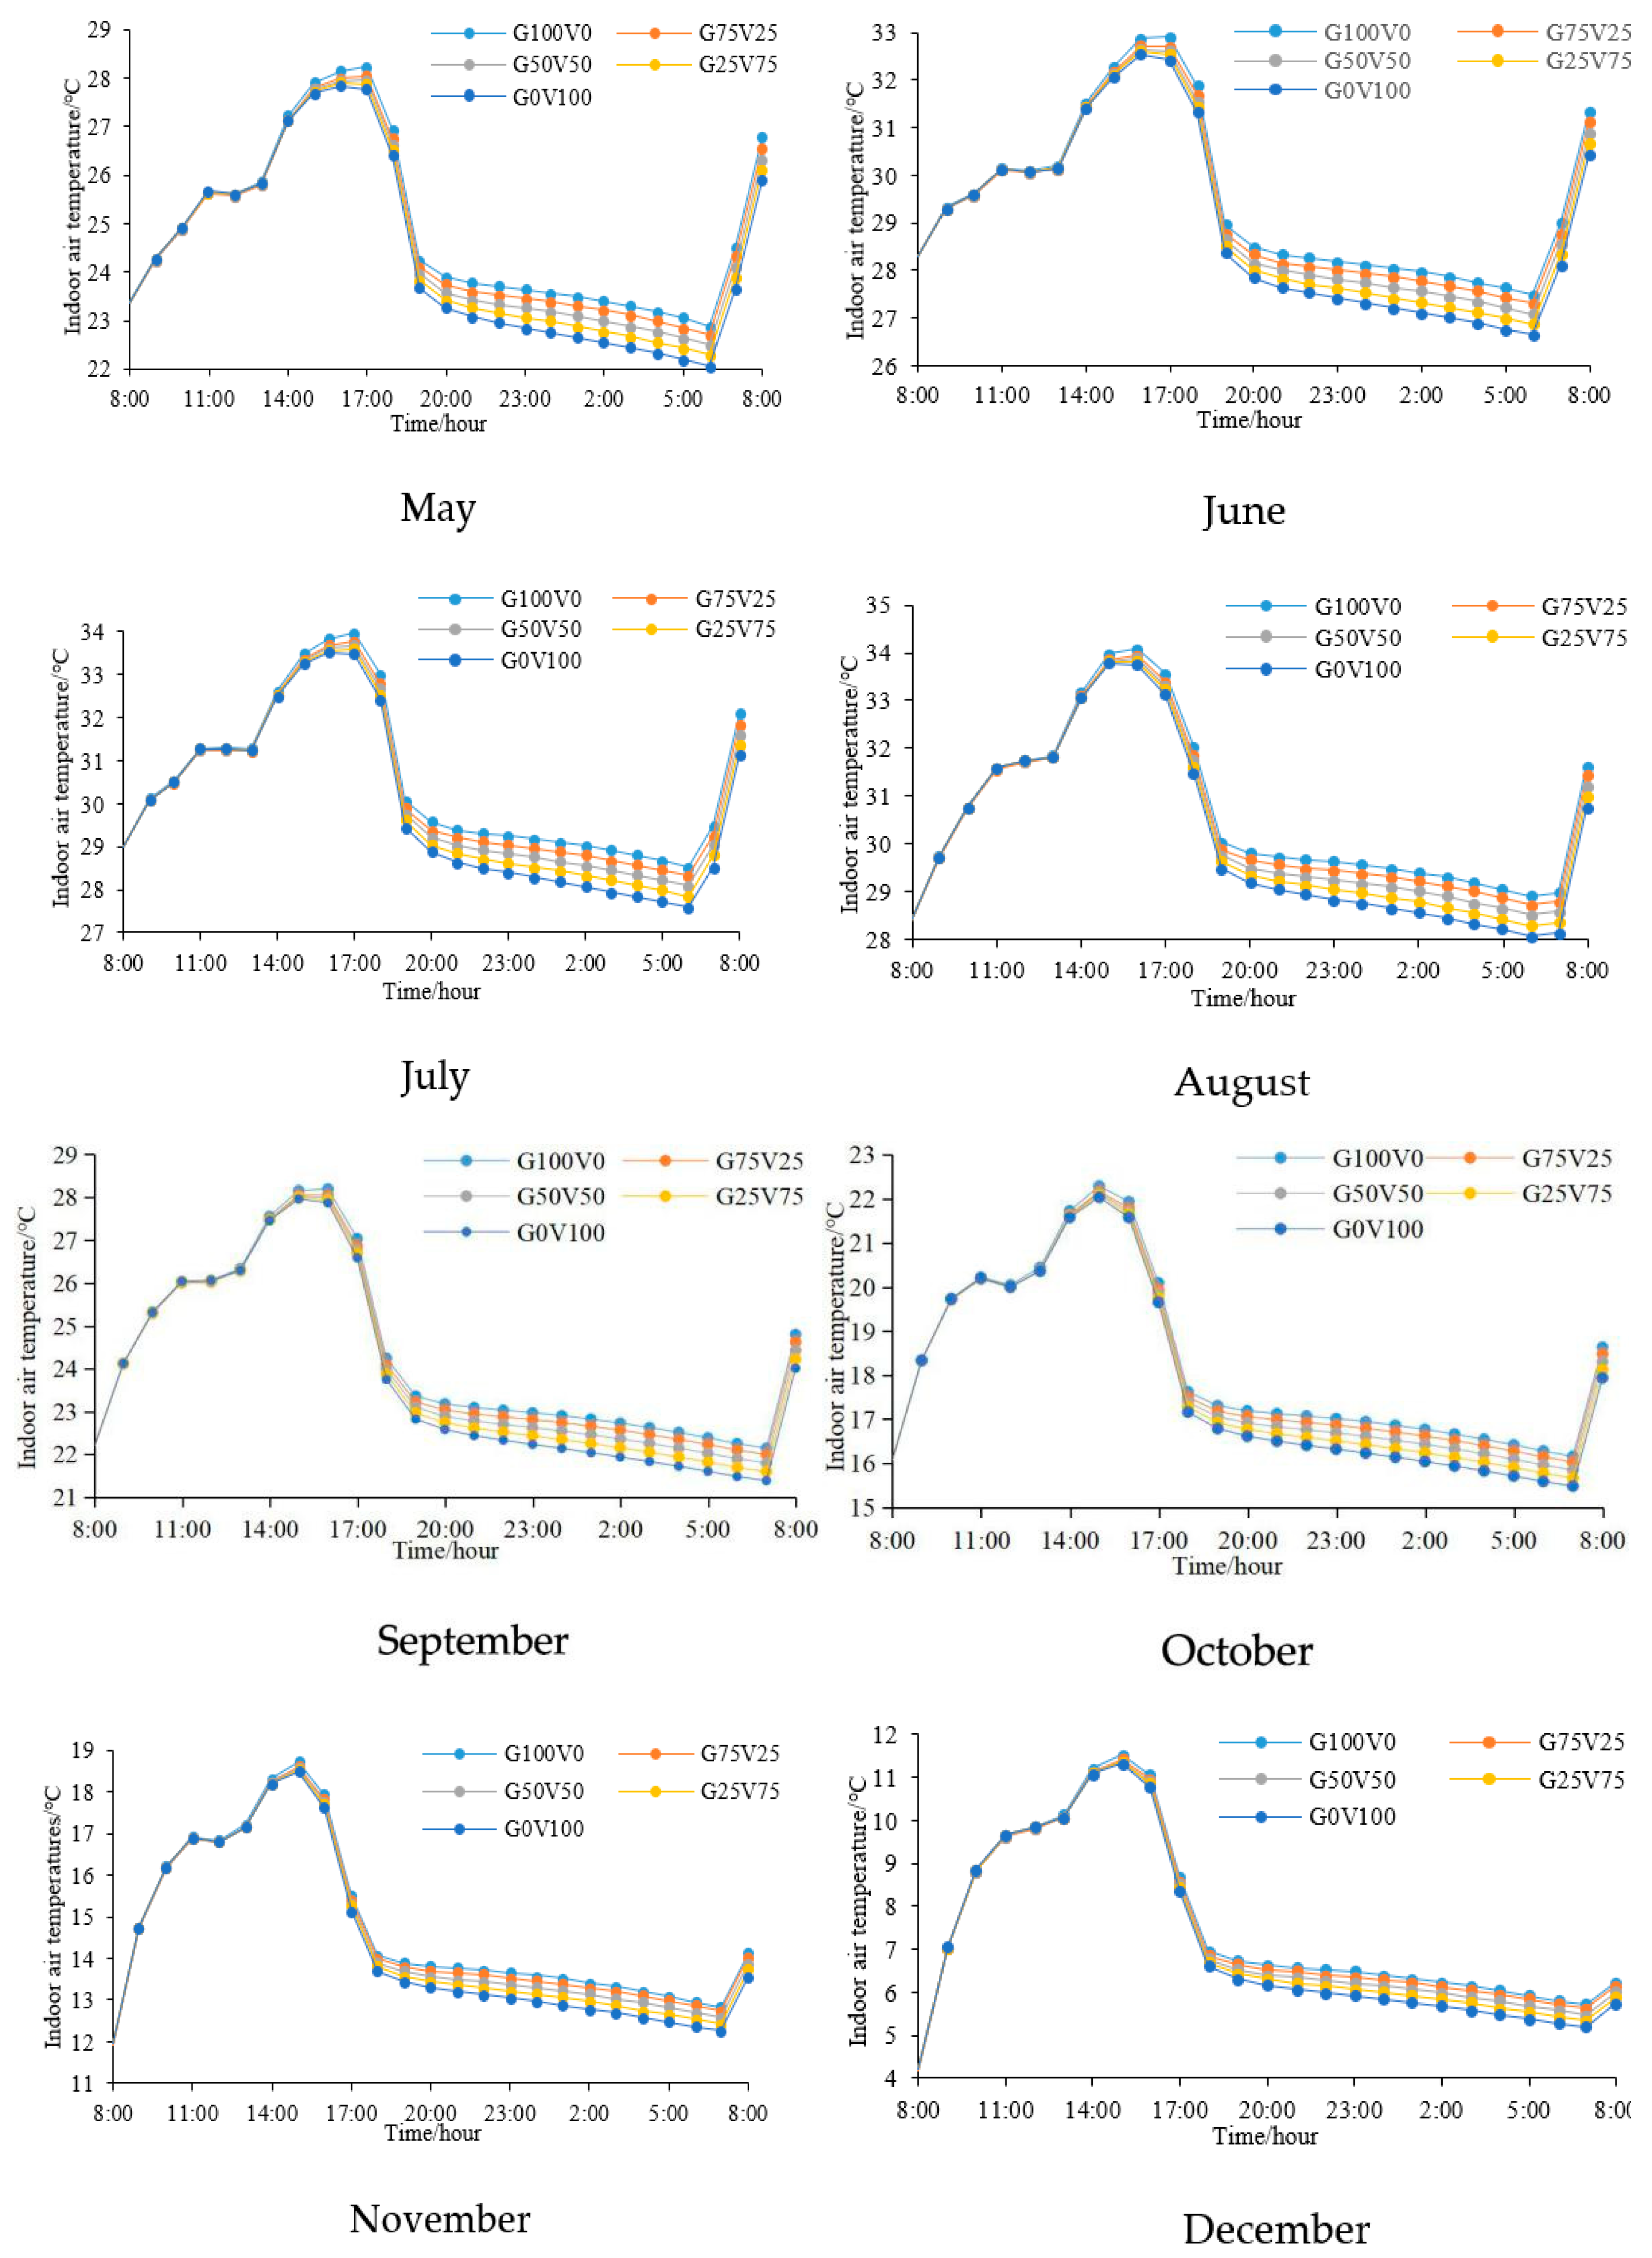
3.1. Cooling Differences of Greening Scenarios in Each Month

Based on the average meteorological data of the 12 months, 60 (5 × 12) scenarios were simulated. The indoor daily temperatures of each month were analyzed one by one and are presented in Figure 5. In Figure 5, the five lines in each subgraph correspond to the five greening scenarios.
The variations in the indoor air temperatures in the 12 months under the five greening scenarios illustrate that vertical greening cools the indoor air temperature, as the higher the vertical greening rate, the lower the indoor temperature throughout the year. Besides this, the indoor cooling of vertical greening at night was greater than that of the daytime. In addition, no matter which month, the maximum indoor cooling of vertical greening occurred at 6:00. The specific mean indoor air temperature of the average day in each month under the five greening scenarios is shown in Table 7.
Statistical results revealed that the max-cooling effects of the five greening scenarios in the 12 months were 0.36 °C (January), 0.42 °C (February), 0.47 °C (March), 0.48 °C (April), 0.52 °C (May), 0.52 °C (June), 0.56 °C (July), 0.51 °C (August), 0.47 °C (September), 0.45 °C (October), 0.38 °C (November), and 0.34 °C (December). The analytical results verified that high outdoor temperature improved the indoor cooling performance of vertical greening, which means that, in the previous studies, the cooling performances of vertical greening on a typical summer day represented its best performance rather than the average cooling performance throughout the year. This validates the idea that selecting a typical summer day as the evaluation cycle exaggerates the cooling performance of vertical greening.
Besides this, even in the hottest season, under the windowed model, the reduction of indoor air temperature caused by vertical greening was still much lower than those results of 4 °C in the previous studies with windowless models [17,18].

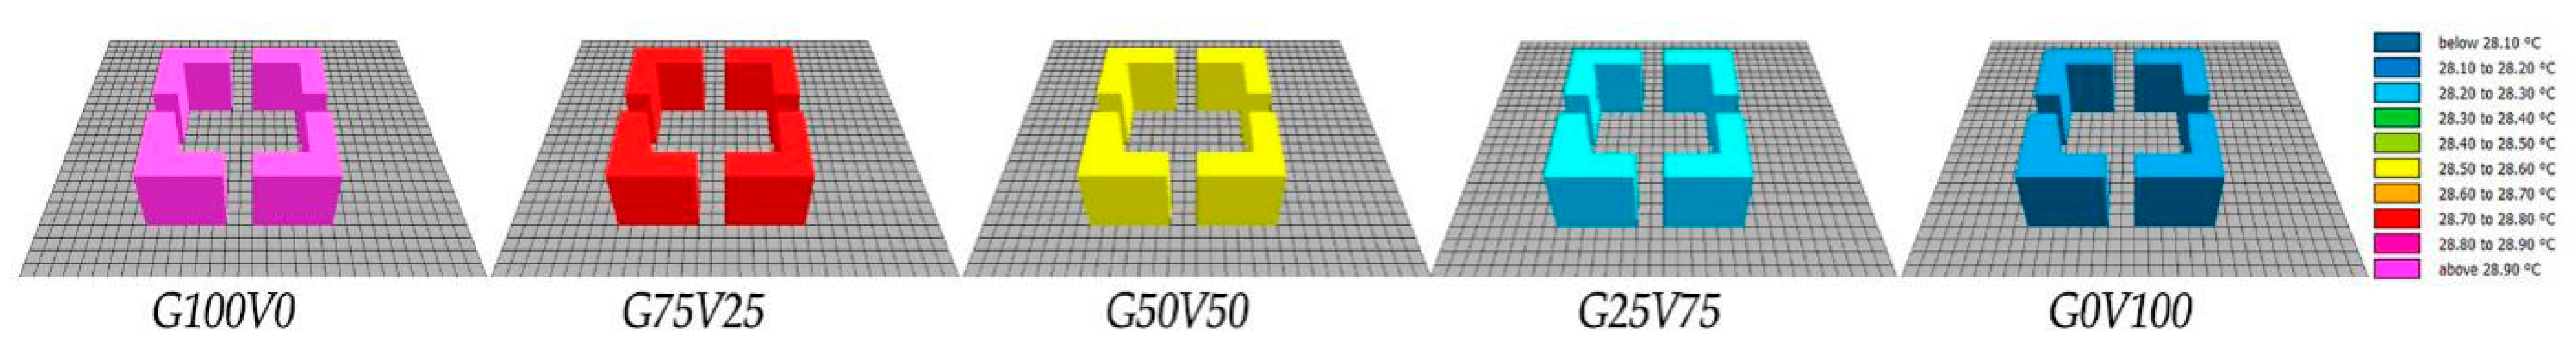
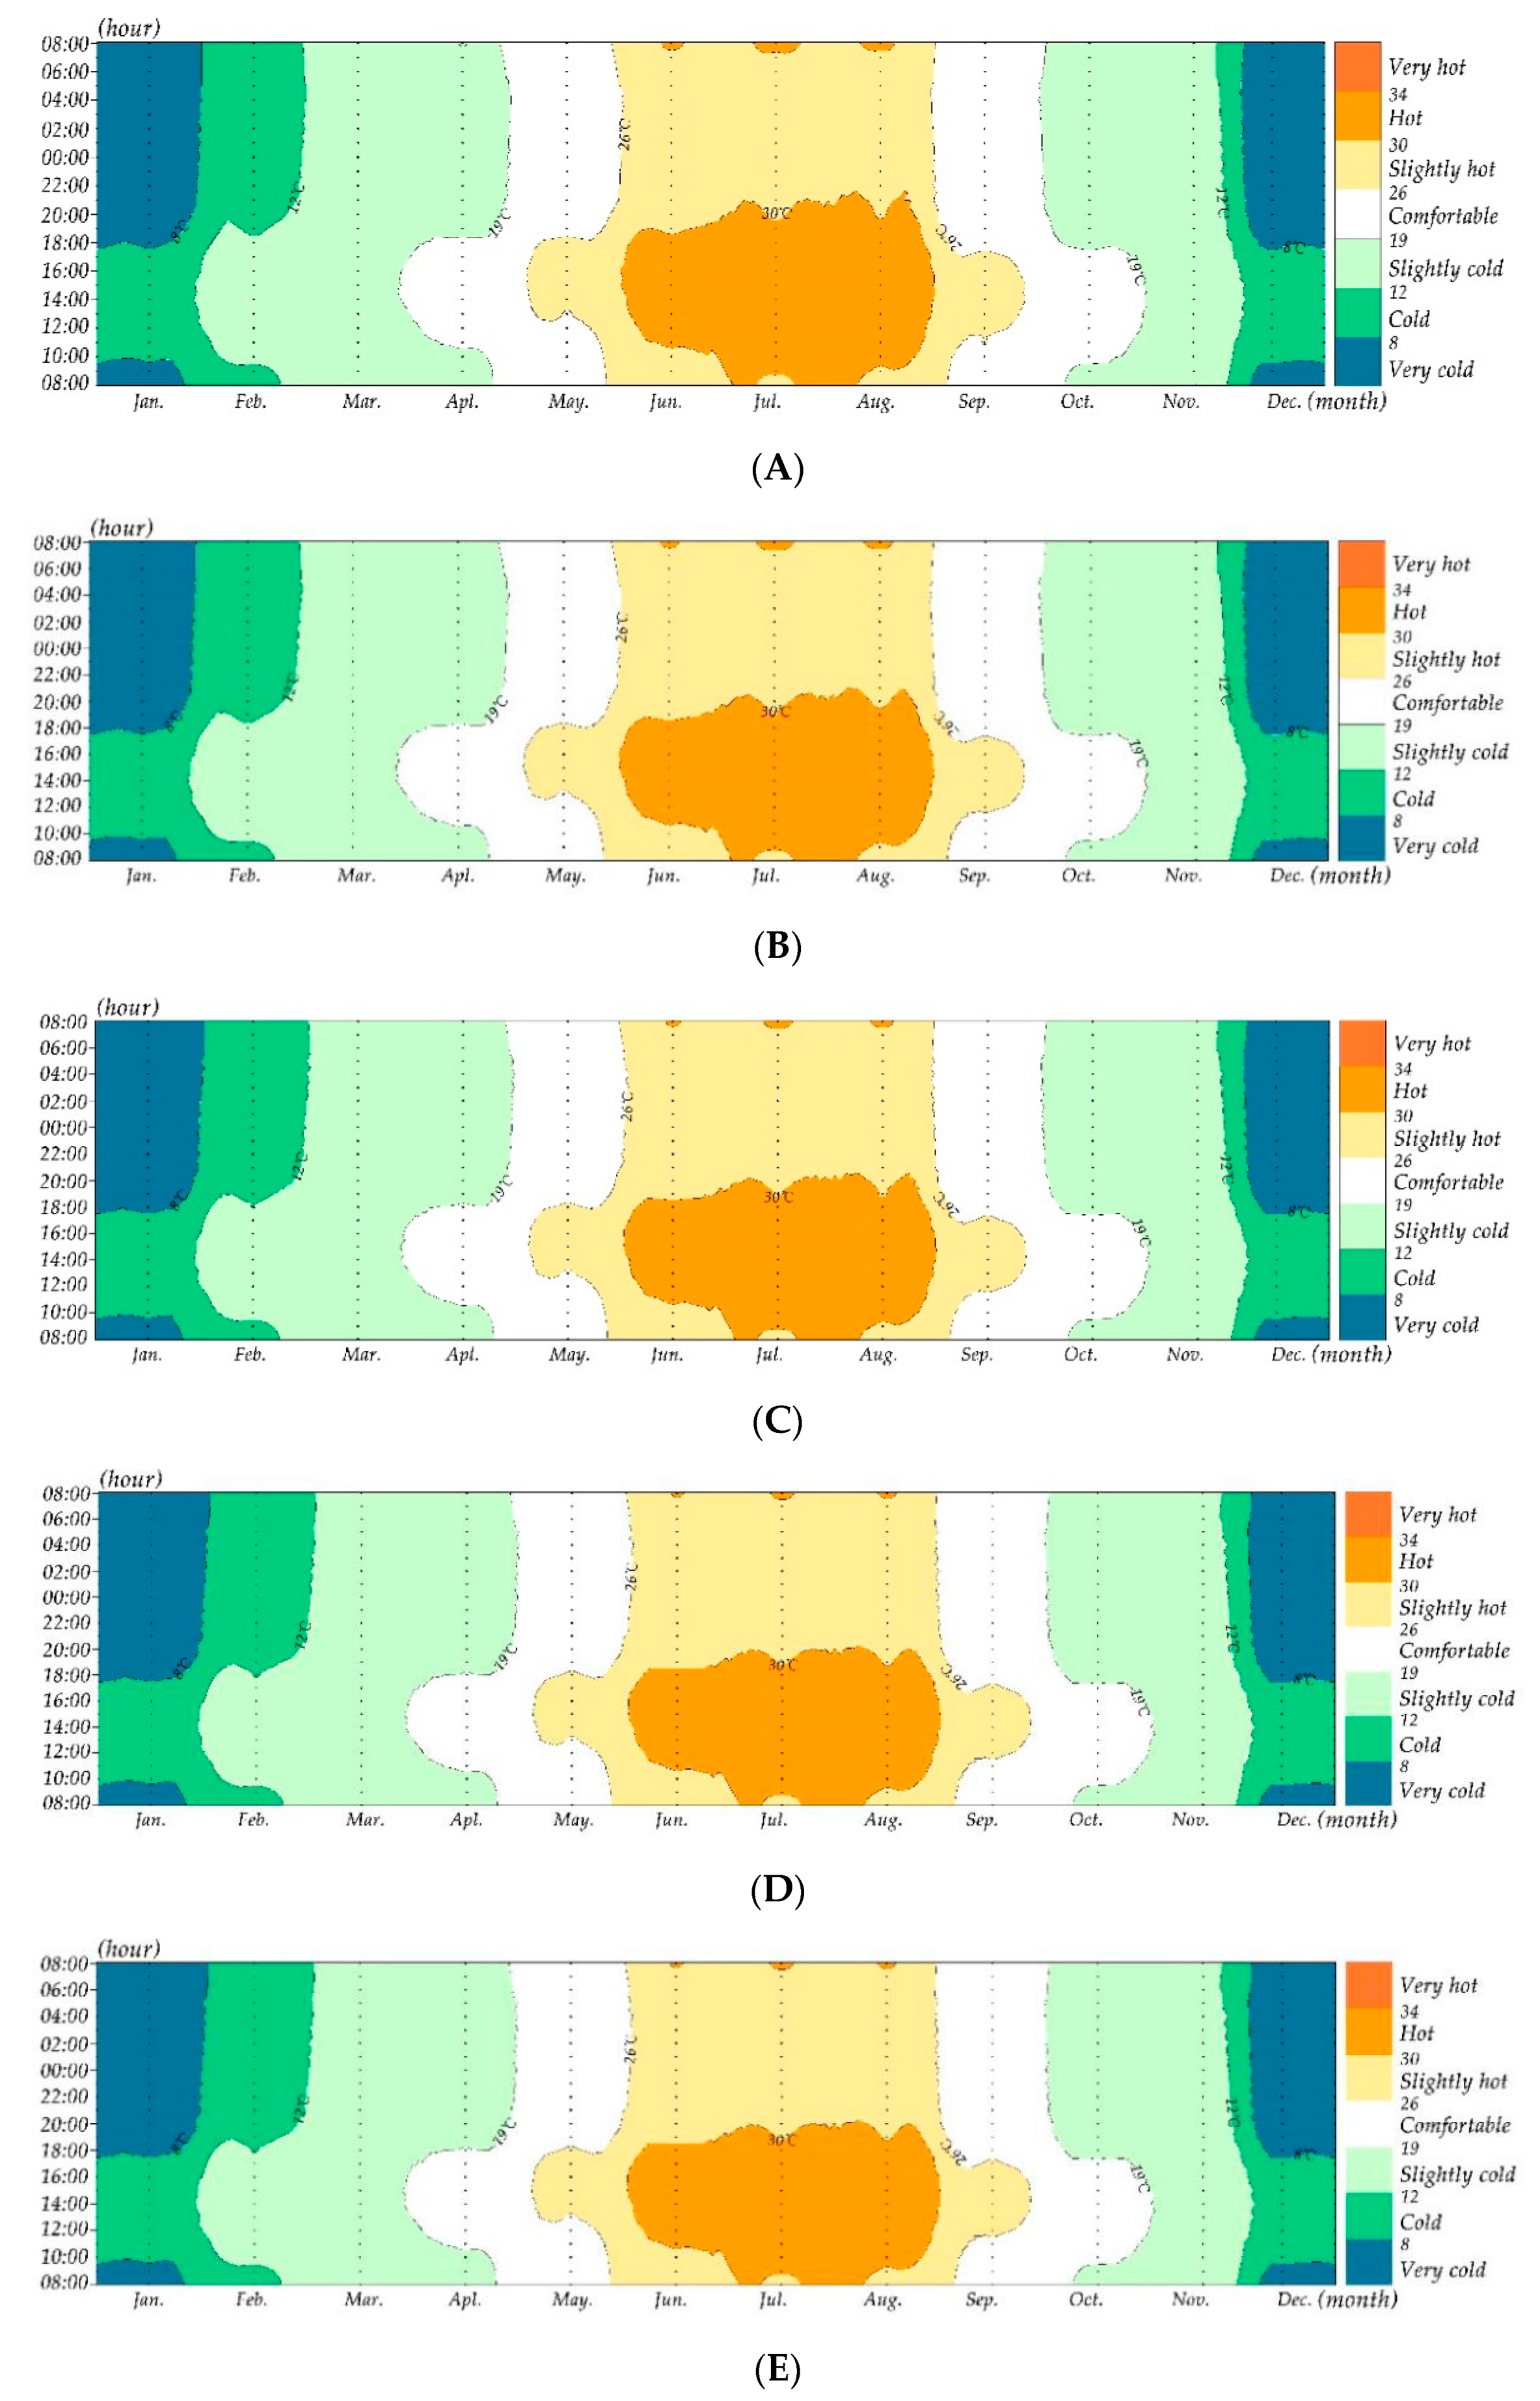
3.2. Daily Distribution of an Indoor Thermal Environment around the Year

In each greening scenario, the average indoor air temperatures in the 12 months were analyzed, but the monthly mean indoor air temperature hardly indicated the successive impacts of vertical greening on an indoor thermal distribution throughout the year. Here, the Kriging model was employed as the translation tool to quantify indoor thermal improvements of the five vertical greenings. The Kriging model has been confirmed feasible for temperature interpolation [47,48]. The Kriging model used in this research was supported by Surfer software [49]. With the help of the Kriging model, the continuous variations of indoor air temperatures throughout the year are drawn in Figure 6A–E, respectively, indicate the annual indoor temperature distributions of the G100V0, G75V25, G50V50, G25V75, and G0V100 scenarios. For each subgraph in Figure 6, the X coordinate means the months, and the Y coordinate represents the daily time, with the Z value indicating the indoor air temperature at that moment. The Z values were calculated based on the monthly average meteorological data at the corresponding moment. For example, the indoor air temperature at 8:00 in January was simulated with the average meteorological data at 8:00 of the 31 days in January 2020. In this way, a total of 1440 (24 h × 12 months × 5 scenarios) items of indoor air temperature were calculated. Besides this, the improvement of thermal perception was an important index to evaluate the role of vertical greening. Referring to the previous studies [50,51,52], the research took 8, 12, 19, 26, 30 and 34 °C as the perception boundaries of indoor temperature to quantify the improvements of vertical greening on indoor thermal perception. The thermal perception standard was very cold (below 8 °C), cold (8–12 °C), slightly cold (12–19 °C), comfortable (19–26 °C), slightly hot (26–30 °C), hot (30–34 °C), and very hot (above 34 °C).
From the annual thermal distribution, the hottest time of the year occurred at noon in July, and the coldest time of the year happened at night from December to January. Meanwhile, for the five vertical greening scenarios, the differences in indoor thermal perceptions throughout the year were not as obvious as the previous study suggested, where the greening wall without windows substantially reduced the thermal perceptions of “cold”, “hot”, and “very hot” by 5.40%, 17.88%, and 2.01%, respectively [50]. To quantify the full-year influences of vertical greening on an indoor thermal environment under the windowed model, by calculating the area proportions, this research calculated the annual proportion and duration of each thermal perception in every vertical greening scenario. The annual proportion and duration of each thermal perception are presented in Table 8.
Vertical greening increased the duration of the cold and reduced the duration of heat throughout the year. The “very hot” perception did not happen in the indoor environment of Changsha due to the climate characters and building materials. The “hot” perception was obviously affected by vertical greening. Compared with the G100V0 scenario, the G0V100 scenario reduced the duration of “hot” perception by 107 h, but it was still far from the result achieved in a previous study where the vertical greening reduced the duration of “hot” perception in a windowless building by 1566 h [50]. Apart from that, the cooling performance was far lower than that in the fictional windowless model in summer. From the view of thermal perception, this research also revealed that vertical greening harmed the indoor thermal environment in winter. The G0V100 scenario extended the annual duration of “very cold” perception by 44 h, which was adverse to indoor thermal comfort. For the other thermal perceptions in the annual cycle, the perceptions of “cold”, “slightly cold”, “comfortable”, “slightly hot”, and “hot” changed by vertical greening were, respectively, within 26, 8, 10 and 28 h.
Compared with the previous studies of windowless models, in windowed buildings, the effect of vertical greening on the improvement of the indoor thermal environment was limited. Regarding the best performance, the cooling effects of vertical greening in a windowed building were only 50% and 12.5% compared with the results of 1.1 and 4 °C achieved in the windowless research [17,22]. In addition, from the perspective of the annual cycle, although vertical greening benefited the indoor thermal perception by cooling in summer, the cooling also deteriorated the indoor thermal perception in winter. Therefore, in the windowed building, the role of vertical greening on indoor temperature was not always positive, and the positive effect was not as strong as the previous study suggested.

4. Conclusions

Little attention has been paid to indoor cooling compared with the surface cooling of vertical greening. The few studies on the indoor cooling of vertical greening are almost all conducted in a hot climate area with windowless building models, which is suspected of amplifying the positive effect of vertical greening on an indoor thermal environment. Compared with previous studies, this study used annual periodic evaluation rather than typical summer days. Besides this, this study constructed the vertical greening building model according to the actual window-to-wall ratio, rather than a fictional windowless model. The analytical results revealed that vertical greening cooled the indoor air temperature around the year because the growth of vertical greening rate strengthened the indoor cooling performance in every month. However, the indoor cooling performance varied throughout the year, with the highest cooling performance occurring in summer. Even the highest cooling effect in summer in this research was only 0.56 °C, which is far from the results of 4 °C derived from the windowless models in the previous studies [17,18]. Besides this, from the view of thermal perceptions, the windowed buildings fully covered with vertical greening only reduced the “hot” perception by 107 h, which is also far from the 1566 h achieved in a windowless building in a previous report [50]. However, except for the unsatisfactory performance in the summer, vertical greening also prolonged the “very cold” time of windowed buildings by 44 h throughout the year. Generally, the existing research on vertical greening exaggerated its positive performance on an indoor thermal environment in hot seasons, and conversely, ignored its potential negative impact in cold seasons.
Although this study gives us a realistic understanding of the actual performance of vertical greening, there are still some limitations that need to be explored further.
(1)
In this study, the window and door are closed where the building was treated as zero ventilation and zero infiltration. If the buildings are ventilated or infiltrated, what will the results be?
(2)
The greening adopted here is modular greening. If other modes of greening are adopted, what will the results be?

Author Contributions

Conceptualization, J.L. and B.Z.; methodology, J.L.; software, J.L.; validation, J.L.; formal analysis, B.Z.; investigation, J.L.; resources, J.L.; data curation, B.Z.; writing—original draft preparation, J.L.; writing—review and editing, J.L.; visualization, J.L.; supervision, B.Z.; project administration, J.L.; funding acquisition, B.Z. All authors have read and agreed to the published version of the manuscript.

Funding

This research was funded by the China Scholarship Council, grant number 202006370126; Hunan Provincial Philosophy and Social Science Planning Fund Office, grant number XSP20ZDI020.

Institutional Review Board Statement

Not applicable.

Data Availability Statement

The data is available on request from the corresponding author.

Acknowledgments

Thanks are given to the Hunan Shangjia Green Company for help in the field experiment.

Conflicts of Interest

The authors declare no conflict of interest.

References

  1. Eisenman, T.S.; Churkina, G.; Jariwala, S.P.; Kumar, P.; Lovasi, G.S.; Pataki, D.E.; Weinberger, K.R.; Whitlow, T.H. Urban trees, air quality, and asthma: An interdisciplinary review. Landsc. Urban Plan. 2019, 187, 47–59. [Google Scholar] [CrossRef]
  2. Shams, Z.I. Changes in diversity and composition of flora along a corridor of different land uses in Karachi over 20 years: Causes and implications. Urban For. Urban Green. 2016, 17, 71–79. [Google Scholar] [CrossRef]
  3. Ren, Z.; He, X.; Zheng, H.; Zhang, D.; Yu, X.; Shen, G.; Guo, R. Estimation of the relationship between urban park characteristics and park cool island intensity by remote sensing data and field measurement. Forests 2013, 4, 868–886. [Google Scholar] [CrossRef] [Green Version]
  4. Tiwary, A.; Godsmark, K.; Smethurst, J. Field evaluation of precipitation interception potential of green façades. Ecol. Eng. 2018, 122, 69–75. [Google Scholar] [CrossRef]
  5. Widiastuti, R.; Zaini, J.; Caesarendra, W. Field measurement on the model of green facade systems and its effect to building indoor thermal comfort. Measurement 2020, 166, 108212. [Google Scholar] [CrossRef]
  6. Stanley, C.H.; Helletsgruber, C.; Hof, A. Mutual Influences of Urban Microclimate and Urban Trees: An Investigation of Phenology and Cooling Capacity. Forests 2019, 10, 533. [Google Scholar] [CrossRef] [Green Version]
  7. Coccolo, S.; Kämpf, J.; Mauree, D.; Scartezzini, J.-L. Cooling potential of greening in the urban environment, a step further towards practice. Sustain. Cities Soc. 2018, 38, 543–559. [Google Scholar] [CrossRef]
  8. Li, J.; Zheng, B.; Shen, W.; Xiang, Y.; Chen, X.; Qi, Z. Cooling and energy-saving performance of different green wall design: A simulation study of a block. Energies 2019, 12, 2912. [Google Scholar] [CrossRef] [Green Version]
  9. Balany, F.; Ng, A.W.; Muttil, N.; Muthukumaran, S.; Wong, M.S. Green infrastructure as an urban heat island mitigation strategy—A review. Water 2020, 12, 3577. [Google Scholar] [CrossRef]
  10. Vivian, J.; Chiodarelli, U.; Emmi, G.; Zarrella, A. A sensitivity analysis on the heating and cooling energy flexibility of residential buildings. Sustain. Cities Soc. 2020, 52, 101815. [Google Scholar] [CrossRef]
  11. Zhang, L.; Deng, Z.; Liang, L.; Zhang, Y.; Meng, Q.; Wang, J.; Santamouris, M. Thermal behavior of a vertical green facade and its impact on the indoor and outdoor thermal environment. Energy Build. 2019, 204, 109502. [Google Scholar] [CrossRef]
  12. Medl, A.; Stangl, R.; Florineth, F. Vertical greening systems—A review on recent technologies and research advancement. Build. Environ. 2017, 125, 227–239. [Google Scholar] [CrossRef]
  13. Morakinyo, T.E.; Lai, A.; Lau, K.K.-L.; Ng, E. Thermal benefits of vertical greening in a high-density city: Case study of Hong Kong. Urban For. Urban Green. 2019, 37, 42–55. [Google Scholar] [CrossRef]
  14. Zhou, W.; Cao, F.; Wang, G. Effects of spatial pattern of forest vegetation on urban cooling in a compact megacity. Forests 2019, 10, 282. [Google Scholar] [CrossRef] [Green Version]
  15. Raji, B.; Tenpierik, M.J.; van den Dobbelsteen, A. The impact of greening systems on building energy performance: A literature review. Renew. Sustain. Energy Rev. 2015, 45, 610–623. [Google Scholar] [CrossRef] [Green Version]
  16. Moya, T.A.; van den Dobbelsteen, A.; Ottele, M.; Bluyssen, P.M. A review of green systems within the indoor environment. Indoor Built Environ. 2019, 28, 298–309. [Google Scholar] [CrossRef]
  17. Olivieri, F.; Olivieri, L.; Neila, J. Experimental study of the thermal-energy performance of an insulated vegetal façade under summer conditions in a continental mediterranean climate. Build. Environ. 2014, 77, 61–76. [Google Scholar] [CrossRef]
  18. Fernández-Cañero, R.; Urrestarazu, L.P.; Franco Salas, A. Assessment of the cooling potential of an indoor living wall using different substrates in a warm climate. Indoor Built Environ. 2012, 21, 642–650. [Google Scholar] [CrossRef]
  19. Coma, J.; Pérez, G.; Solé, C.; Castell, A.; Cabeza, L.F. New green facades as passive systems for energy savings on buildings. Energy Procedia 2014, 57, 1851–1859. [Google Scholar] [CrossRef] [Green Version]
  20. Haggag, M.; Hassan, A.; Elmasry, S. Experimental study on reduced heat gain through green façades in a high heat load climate. Energy Build. 2014, 82, 668–674. [Google Scholar] [CrossRef]
  21. Seyam, S. The impact of greenery systems on building energy: Systematic review. J. Build. Eng. 2019, 26, 100887. [Google Scholar] [CrossRef]
  22. Chen, Q.; Li, B.; Liu, X. An experimental evaluation of the living wall system in hot and humid climate. Energy Build. 2013, 61, 298–307. [Google Scholar] [CrossRef]
  23. Bhatia, A.; Sangireddy, S.A.R.; Garg, V. An approach to calculate the equivalent solar heat gain coefficient of glass windows with fixed and dynamic shading in tropical climates. J. Build. Eng. 2019, 22, 90–100. [Google Scholar] [CrossRef]
  24. Kumar, K.; Saboor, S.; Kumar, V.; Kim, K.-H.; Ashok Babu, T.P. Experimental and theoretical studies of various solar control window glasses for the reduction of cooling and heating loads in buildings across different climatic regions. Energy Build. 2018, 173, 326–336. [Google Scholar]
  25. Hami, A.; Abdi, B.; Zarehaghi, D.; Maulan, S.B. Assessing the thermal comfort effects of green spaces: A systematic review of methods, parameters, and plants’ attributes. Sustain. Cities Soc. 2019, 49, 101634. [Google Scholar] [CrossRef]
  26. Yang, F.; Yuan, F.; Qian, F.; Zhuang, Z.; Yao, J. Summertime thermal and energy performance of a double-skin green facade: A case study in Shanghai. Sustain. Cities Soc. 2018, 39, 43–51. [Google Scholar] [CrossRef]
  27. Daemei, A.B.; Azmoodeh, M.; Zamani, Z.; Khotbehsara, E.M. Experimental and simulation studies on the thermal behavior of vertical greenery system for temperature mitigation in urban spaces. J. Build. Eng. 2018, 20, 277–284. [Google Scholar] [CrossRef]
  28. Liao, J.; Tan, X.; Li, J. Evaluating the vertical cooling performances of urban vegetation scenarios in a residential environment. J. Build. Eng. 2021, 39, 102313. [Google Scholar] [CrossRef]
  29. Forouzandeh, A. Prediction of surface temperature of building surrounding envelopes using holistic microclimate ENVI-met model. Sustain. Cities Soc. 2021, 70, 102878. [Google Scholar] [CrossRef]
  30. Tsoka, S.; Tsikaloudaki, A.; Theodosiou, T. Analyzing the ENVI-met microclimate model’s performance and assessing cool materials and urban vegetation applications—A review. Sustain. Cities Soc. 2018, 43, 55–76. [Google Scholar] [CrossRef]
  31. Laaha, G.; Skøien, J.O.; Nobilis, F.; Blöschl, G. Spatial prediction of stream temperatures using Top-kriging with an external drift. Environ. Model. Assess. 2013, 18, 671–683. [Google Scholar] [CrossRef] [Green Version]
  32. Chaoqun, C. Researches on application of the renewable energy technologies in the development of low-carbon rural tourism. Energy Procedia 2011, 5, 1722–1726. [Google Scholar] [CrossRef] [Green Version]
  33. Mi, X.; Liu, R.; Cui, H.; Memon, S.A.; Xing, F.; Lo, Y. Energy and economic analysis of building integrated with PCM in different cities of China. Appl. Energy 2016, 175, 324–336. [Google Scholar] [CrossRef]
  34. Mohajerani, A.; Bakaric, J.; Jeffrey-Bailey, T. The urban heat island effect, its causes, and mitigation, with reference to the thermal properties of asphalt concrete. J. Environ. Manag. 2017, 197, 522–538. [Google Scholar] [CrossRef]
  35. Ng, E.; Ren, C. China’s adaptation to climate & urban climatic changes: A critical review. Urban Clim. 2018, 23, 352–372. [Google Scholar] [PubMed]
  36. Osman, M.M.; Sevinc, H. Adaptation of climate-responsive building design strategies and resilience to climate change in the hot/arid region of Khartoum, Sudan. Sustain. Cities Soc. 2019, 47, 101429. [Google Scholar] [CrossRef]
  37. Priya, U.K.; Senthil, R. A review of the impact of the green landscape interventions on the urban microclimate of tropical areas. Build. Environ. 2021, 205, 108190. [Google Scholar] [CrossRef]
  38. Li, J.; Zheng, B.; Chen, X.; Zhou, Y.; Rao, J.; Bedra, K.B. Research on Annual Thermal Environment of Non-Hvac Building Regulated by Window-to-Wall Ratio in a Chinese City (Chenzhou). Sustainability 2020, 12, 6637. [Google Scholar] [CrossRef]
  39. Smyth, M.; Eames, P.; Norton, B. Annual performance of heat retaining integrated collector/storage solar water heaters in a northern maritime climate. Sol. Energy 2001, 70, 391–401. [Google Scholar] [CrossRef]
  40. Apreda, C.; Reder, A.; Mercogliano, P. Urban morphology parameterization for assessing the effects of housing blocks layouts on air temperature in the Euro-Mediterranean context. Energy Build. 2020, 223, 110171. [Google Scholar] [CrossRef]
  41. Liu, Z.; Cheng, W.; Jim, C.Y.; Morakinyo, T.E.; Shi, Y.; Ng, E. Heat mitigation benefits of urban green and blue infrastructures: A systematic review of modeling techniques, validation and scenario simulation in ENVI-met V4. Build. Environ. 2021, 200, 107939. [Google Scholar] [CrossRef]
  42. Simon, H.; Fallmann, J.; Kropp, T.; Tost, H.; Bruse, M. Urban trees and their impact on local ozone concentration—A microclimate modeling study. Atmosphere 2019, 10, 154. [Google Scholar] [CrossRef] [Green Version]
  43. Bruse, M. ENVI-met 3.0: Updated Model Overview; University of Bochum: Bochum, Germany, 2004; Available online: www.envi-met.com (accessed on 12 October 2021).
  44. Chen, Y.-C.; Lin, T.-P.; Matzarakis, A. Comparison of mean radiant temperature from field experiment and modelling: A case study in Freiburg, Germany. Theor. Appl. Climatol. 2014, 118, 535–551. [Google Scholar] [CrossRef]
  45. Salata, F.; Golasi, I.; de Lieto Vollaro, R.; de Lieto Vollaro, A. Urban microclimate and outdoor thermal comfort. A proper procedure to fit ENVI-met simulation outputs to experimental data. Sustain. Cities Soc. 2016, 26, 318–343. [Google Scholar] [CrossRef]
  46. Yang, X.; Zhao, L.; Bruse, M.; Meng, Q. Evaluation of a microclimate model for predicting the thermal behavior of different ground surfaces. Build. Environ. 2013, 60, 93–104. [Google Scholar] [CrossRef]
  47. Wu, T.; Li, Y. Spatial interpolation of temperature in the United States using residual kriging. Appl. Geogr. 2013, 44, 112–120. [Google Scholar] [CrossRef]
  48. Yu, Z.; Song, Y.; Song, D.; Liu, Y. Spatial interpolation-based analysis method targeting visualization of the indoor thermal environment. Build. Environ. 2021, 188, 107484. [Google Scholar] [CrossRef]
  49. Abdeladim, K.; Razagui, A.; Semaoui, S.; Arab, A.H. Updating Algerian solar atlas using MEERA-2 data source. Energy Rep. 2020, 6, 281–287. [Google Scholar] [CrossRef]
  50. Li, J.; Zheng, B.; Chen, X.; Qi, Z.; Bedra, K.B.; Zheng, J.; Li, Z.; Liu, L. Study on a full-year improvement of indoor thermal comfort by different vertical greening patterns. J. Build. Eng. 2021, 35, 101969. [Google Scholar] [CrossRef]
  51. Liu, W.; Zhang, Y.; Deng, Q. The effects of urban microclimate on outdoor thermal sensation and neutral temperature in hot-summer and cold-winter climate. Energy Build. 2016, 128, 190–197. [Google Scholar] [CrossRef]
  52. Yang, W.; Wong, N.H.; Zhang, G. A comparative analysis of human thermal conditions in outdoor urban spaces in the summer season in Singapore and Changsha, China. Int. J. Biometeorol. 2013, 57, 895–907. [Google Scholar] [CrossRef] [PubMed]
Figure 1. Research models. G represents the ratio of ground greening to total greening, and V represents the ratio of vertical greening to total greening.
Forests 13 00358 g001
Figure 2. Measured and simulated models: (A) measurement of indoor and outdoor air temperatures; (B) simulation model of the measured building.
Forests 13 00358 g002
Figure 3. Variations of outdoor temperatures and indoor air temperatures: (A) variation of outdoor air temperatures; (B) measured indoor air temperatures and the simulated indoor air temperature.
Forests 13 00358 g003
Figure 4. Example of the simulated results. G represents the ratio of ground greening to the total greening, and V represents the ratio of vertical greening to the total greening.
Forests 13 00358 g004
Figure 5. Daily variations of simulated indoor air temperature in the 12 months.
Forests 13 00358 g005aForests 13 00358 g005b
Figure 6. Improvements caused by vertical greening on annual thermal perceptions. (A) Annual indoor thermal perceptions of the G100V0 scenario. (B) Annual indoor thermal perceptions of the G75V25 scenario. (C) Annual indoor thermal perceptions of the G50V50 scenario. (D) Annual indoor thermal perceptions of the G25V75 scenario. (E) Annual indoor thermal perceptions of the G0V100 scenario.
Forests 13 00358 g006
Table 1. The areas of each wall component.
ScenariosGround Greening (m2)Vertical Greening (m2)Window (m2)
G100V0614401536
G75V25460815361536
G50V50307230721536
G25V75153646081536
G0V100061441536
Table 2. The attributes of ground greening and vertical greening.
Greening TypeElementsParametersValue
Ground greeningPlantLeaf typeGrass
Albedo0.20
Transmittance (Frac)0.30
Plant height (m)0.25
Root zone depth (m)0.20
LAD0.30
RAD0.10
Vertical greeningPlantLAI (m2/m2)1.5
Leaf angle distribution0.5
SubstrateEmissivity of Substrate (Frac)0.95
Albedo of Substrate (Frac)0.30
Water Coefficient of Substrate for plant0.50
Air Gap between Substrate and wall (m)0.0
Table 3. The attributes of clear float glass.
ParametersValue
Thickness (mm)20.00
Absorption (Frac)0.05
Transmission (Frac)0.90
Solar heat gain coefficient0.80
Reflection (Frac)0.05
Emissivity (Frac)0.90
Specific Heat (J/(kg·K)750.00
Thermal conductivity (W/(m·K)1.05
Density (kg/m3)2500.00
Table 4. The attributes of the concrete in this simulation.
ParametersValue
Absorption0.50
Transmission (Frac)0.00
Reflection (Frac)0.50
Emissivity (Frac)0.90
Specific heat (J/kg∗k)0.90
Thermal conductivity (W/m∗k)1.60
Density (kg/m3)2220.00
Table 5. The averages of the meteorological data in every month of 2020.
MonthInitial Meteorological ConditionDataMonthInitial Meteorological ConditionData
JanuaryWind velocity (m/s) (10 m off the ground)3FebruaryWind velocity (m/s) (10 m off the ground)3
Wind angle (°)315Wind angle (°)135
Mean max—air temperature (°C)8Mean max—air temperature (°C)14
Mean min—air temperature (°C)4Mean min—air temperature (°C)8
Mean max—relative humidity (%)95Mean max—relative humidity (%)91
Mean min—relative humidity (%)85Mean min—relative humidity (%)81
MarchWind velocity (m/s) (10 m off the ground)3AprilWind velocity (m/s) (10 m off the ground)3
Wind angle (°)315Wind angle (°)315
Mean max—air temperature (°C)17Mean max—air temperature (°C)22
Mean min—air temperature (°C)11Mean min—air temperature (°C)13
Mean max—relative humidity (%)88Mean max—relative humidity (%)89
Mean min—relative humidity (%)78Mean min—relative humidity (%)79
MayWind velocity (m/s) (10 m off the ground)3JuneWind velocity (m/s) (10 m off the ground)3.5
Wind angle (°)315Wind angle (°)315
Mean max—air temperature (°C)28Mean max—air temperature (°C)31
Mean min—air temperature (°C)20Mean min—air temperature (°C)25
Mean max—relative humidity (%)88Mean max—relative humidity (%)89
Mean min—relative humidity (%)78Mean min—relative humidity (%)79
JulyWind velocity (m/s) (10 m off the ground)3AugustWind velocity (m/s) (10 m off the ground)3.5
Wind angle (°)270Wind angle (°)135
Mean max—air temperature (°C)32Mean max—air temperature (°C)35
Mean min—air temperature (°C)26Mean min—air temperature (°C)26
Mean max—relative humidity (%)80Mean max—relative humidity (%)88
Mean min—relative humidity (%)70Mean min—relative humidity (%)78
SeptemberWind velocity (m/s) (10 m off the ground)3OctoberWind velocity (m/s) (10 m off the ground)3.5
Wind angle (°)0Wind angle (°)315
Mean max—air temperature (°C)26Mean max—air temperature (°C)21
Mean min—air temperature (°C)20Mean min—air temperature (°C)14
Mean max—relative humidity (%)90Mean max—relative humidity (%)88
Mean min—relative humidity (%)80Mean min—relative humidity (%)78
NovemberWind velocity (m/s) (10 m off the ground)3.5DecemberWind velocity (m/s) (10 m off the ground)3
Wind angle (°)0Wind angle (°)315
Mean max—air temperature (°C)18Mean max—air temperature (°C)10
Mean min—air temperature (°C)11Mean min—air temperature (°C)4
Mean max—relative humidity (%)87Mean max—relative humidity (%)87
Mean min—relative humidity (%)77Mean min—relative humidity (%)77
Table 6. The other basic settings of the simulation.
LocationData
Longitude113.109° E
Latitude28.235° N
Beginning time and total simulation timeData
Beginning time8:00 am
Total simulation time24 h
Table 7. Mean indoor air temperatures under the five greening scenarios of the 12 months.
ScenarioG100V0 (°C)G75V25 (°C)G50V50 (°C)G25V75 (°C)G0V100 (°C)
Month
January7.297.217.127.036.93
February11.9911.8911.7911.6911.58
March15.5115.3815.2715.1615.04
April18.1117.9817.8617.7517.63
May24.8624.7224.6024.4824.35
June29.4729.3229.2029.0828.94
July30.4730.3130.1830.0529.91
August30.6130.4830.3630.2430.11
September24.2424.1224.0123.8923.77
October18.2218.1118.0017.8917.77
November14.6914.6014.5014.4114.30
December7.477.397.317.227.13
Table 8. The proportion and duration of indoor temperature state of each greening scenario.
Scenarios<8 °C8–12 °C12–19 °C19–26 °C26–30 °C30–34 °C
G100V0Proportion (%)9.6%11.7%29.4%19.5%18.6%11.1%
Duration (h)841.31024.42579.21710.51631.9972.7
G75V25Proportion (%)9.7%11.8%29.5%19.6%18.8%10.6%
duration (h)850.391030.82587.41715.31647.9928.2
G50V50proportion (%)9.9%11.8%29.5%19.6%18.9%10.3%
duration (h)863.71037.02585.11716.61654.3903.4
G25V75proportion (%)10.0%11.9%29.5%19.6%19.0%10.1%
duration (h)874.21043.32581.81717.41659.9883.5
G0V100proportion (%)10.1%12.0%29.4%19.6%19.0%9.9%
duration (h)885.701050.12579.21720.01659.6865.3
Publisher’s Note: MDPI stays neutral with regard to jurisdictional claims in published maps and institutional affiliations.

