Review

The Potential of Low-Cost 3D Imaging Technologies for Forestry Applications: Setting a Research Agenda for Low-Cost Remote Sensing Inventory Tasks

1
School of Science, RMIT University, 124 La Trobe St., Melbourne, VIC 3000, Australia
2
School of Geography, Planning and Spatial Science, University of Tasmania, Churchill Ave., Hobart, TAS 7005, Australia
*
Author to whom correspondence should be addressed.
These authors contributed equally to this work.
Forests 2022, 13(2), 204; https://doi.org/10.3390/f13020204
Submission received: 21 December 2021 / Revised: 24 January 2022 / Accepted: 25 January 2022 / Published: 28 January 2022
(This article belongs to the Section Forest Inventory, Modeling and Remote Sensing)

Abstract

:
Limitations with benchmark light detection and ranging (LiDAR) technologies in forestry have prompted the exploration of handheld or wearable low-cost 3D sensors (<2000 USD). These sensors are now being integrated into consumer devices, such as the Apple iPad Pro 2020. This study was aimed at determining future research recommendations to promote the adoption of terrestrial low-cost technologies within forest measurement tasks. We reviewed the current literature surrounding the application of low-cost 3D remote sensing (RS) technologies. We also surveyed forestry professionals to determine what inventory metrics were considered important and/or difficult to capture using conventional methods. The current research focus regarding inventory metrics captured by low-cost sensors aligns with the metrics identified as important by survey respondents. Based on the literature review and survey, a suite of research directions are proposed to democratise the access to and development of low-cost 3D for forestry: (1) the development of methods for integrating standalone colour and depth (RGB-D) sensors into handheld or wearable devices; (2) the development of a sensor-agnostic method for determining the optimal capture procedures with low-cost RS technologies in forestry settings; (3) the development of simultaneous localisation and mapping (SLAM) algorithms designed for forestry environments; and (4) the exploration of plot-scale forestry captures that utilise low-cost devices at both terrestrial and airborne scales.

1. Introduction

Information is a key factor for the effective planning and management of any natural resource. In the case of forestry, relevant data are typically gathered through forest inventories, procedures applied for the repeatable collection of information regarding the extent, quantity and condition of forest resources [1,2,3]. The overall aim of forest inventories is to provide measurements of specific vegetation characteristics, either at the individual tree or stand level or over larger specified plot areas or defined boundaries [4]. These measured characteristics commonly include individual biophysical attributes such as stem diameter at breast height (DBH), stem height, crown diameter and above-ground biomass, but can also include area-based properties such as forest health and mortality, biodiversity, stocking density and overall forest area [5].
Due to the large spatial extent of forests, inventory measurements are based on sampling, typically at the plot scale, to draw conclusions about the greater population. These inventory samples are carried out over varying spatial and temporal extents based on the end use. Furthermore, a sufficient number of plots is required in order to accurately characterise the natural variability that occurs within forests [4]. Traditional non-destructive methods for the collection of common forest inventory metrics, such as DBH and stem height, involve manual measurements utilising tools such as calipers and clinometers to capture plot-level individual tree measurements. In a study by Luoma et al. [6], the authors found that experienced professionals utilising conventional instruments were able to measure individual stem (n = 319) DBH and height with minimal error compared to the true measurements (DBH RMSE = 0.3   c m , 1.5%; height RMSE = 0.5   m , 2.9%). In some national forest inventory guides, visual assessment supplements these conventional methods to increase the time efficiency of inventory capture and estimate metrics that would otherwise require destructive sampling. However, the accuracy of visual inventory assessment is highly dependant on technician experience and forest condition due to factors such as vegetation occlusion, the site’s extent and topography and naturally occurring stand variations [7]. Furthermore, when implemented over a large area, these conventional methods can be time-consuming and therefore expensive, depending on the number of inventory variables being measured and the difficulty associated with their capture [5]. In addition, Luoma et al. [6] suggest that there is a significant difference in the accuracy of manual forest inventory measurements when collected by field staff with different levels of experience. This is particularly important for repeat measurements of challenging metrics such as stem condition or metrics that need to be captured at a precise location, such as DBH, which is highly dependant on where the ground height is taken or where measurements are taken on stems subject to deformation because of basal forking or knots.
Over the past two decades, three-dimensional (3D) remote sensing (RS) technologies that are used to derive point-cloud information, such as light detection and ranging (LiDAR) and structure-from-motion (SFM) photogrammetric approaches, have seen increased use within forestry in both the public and commercial sectors. During this time there has also been the development and exploration of platforms to utilise these 3D RS technologies, with sensors now being deployed within backpacks or handheld units or mounted on drones. This uptake has been driven by the need for forest managers to make effective decisions surrounding the timing, location and scale of forestry operations and the ability of 3D RS technologies to accurately digitise forest stand characteristics automatically at both the plot scale and over larger areas [8,9,10,11,12]. This automated and potentially rapid method of data acquisition is particularly important within forest stands, where structural conditions can change over a period of months, because of seasonal growth, or days, due to disturbance events, such as fire [8]. The application of RS technologies has allowed for the acquisition of 3D structural representations of forestry plots, which then enables the extraction of measurements that are impossible to capture with conventional tools or which otherwise require destructive sampling or allometric modelling [13,14,15,16]. Furthermore, the repeatable nature of these data also allows for detailed and spatially consistent records of forest conditions to accumulate over time, allowing for further temporal analysis.
This growth in the application of 3D RS technologies for forest measurement can largely be attributed to the continued development and accessibility of LiDAR technologies. It is generally accepted that a multiple scan station (MSS) approach using terrestrial laser scanning (TLS), or using a drone-mounted airborne LiDAR (ALS) approach when capturing canopy structures, can achieve the most accurate forest inventory measurements when compared to other RS technologies deployed within the same area of interest [9,17]. Therefore, these technologies form the benchmark that other prospective sensors are compared to. These benchmark approaches are not without limitations, however, with both techniques subject to incomplete characterisations of forest structure due to occlusion and point spacing when capturing a forest structure from different angles [18,19].
The application of ALS, utilising drones, for forest inventory acquisition has only undergone a thorough examination within the past decade [20,21]. As such, some current limitations are related to capturing variables, including flight speed, altitude and overlap, which are still in a state of inquiry. Conversely, TLS has been present within forestry for twice as long, with data acquisition procedures being reasonably refined. As such, the limitations associated with MSS TLS, such as long capture times and occlusion, are closely tied to the static nature of the sensor and are unlikely to be resolved in the near future. In addition, although hardware costs associated with TLS and ALS technologies are decreasing, they are still relatively expensive as an acquisition source. It is this, alongside advancements in feature matching and localisation algorithms, that has driven the exploration of alternative terrestrial approaches such as mobile laser scanning (MLS), personal laser scanning (PLS) and close-range photogrammetry (CRP) [22,23], as well as airborne approaches such as digital aerial photogrammetry (DAP) [8,24].
Fundamentally, the adoption of any RS technology relies on the ability of sensors to capture accurate structural measurements at an appropriate hardware and technician cost [25]. This is even more important in some sectors, such as metropolitan settings, where there are limited resources to be allocated towards urban tree inventories [26]. Therefore, technologies with an initial low cost of entry are highly beneficial to such sectors. One such approach is the aforementioned CRP, with the most common workflow being SFM [8]. This approach is attractive as it combines both low-cost hardware with relatively straightforward and rapid data capture procedures when compared to MSS TLS. It is for similar reasons that airborne approaches using low-cost drones and SfM are being explored as an alternative to ALS [8,24].
The rapid evolution of RS technologies, coupled with innovative image processing techniques, provide an opportunity for alternative low-cost approaches to be explored for forestry applications. In addition to CRP, another emerging RS technology is colour and depth (RGB-D) sensors—otherwise referred to as range cameras—that incorporate a traditional RGB camera with the use of a range-sensing solution to record their surroundings. These are consumer-grade devices and are mass-manufactured, making them easily available to a large user base, offering a low initial entry price, creating the potential to deploy numerous sensors simultaneously, and they are designed for end-user application, making the level of expertise required to operate them low [27]. These new, low-cost RS technologies and associated point-cloud reconstruction algorithms provide the opportunity to explore alternative approaches for the acquisition of individual tree- and plot-scale terrestrial forest inventory metrics, where conventional 3D RS technologies have previously seen extensive research over the past decade [28]. When considered alongside the limitations of capture time and hardware cost that exist with benchmark terrestrial RS approaches, low-cost RS technologies are appealing.
In this study, we investigated the role, requirements and opportunities provided by low-cost RS technologies within the forestry sector for capturing inventory information in both rural, semi-urban and urban environments, and aimed to identify and present the future research agenda needed to develop and enable the uptake of these low-cost CRP and RGB-D technologies for forest inventory tasks. Accordingly, the objectives of this study were to:
(1)
Provide an overview of CRP and RGB-D remote sensing technologies, summarising their principles of operation, and their benefits and limitations within the context of forest inventory capture;
(2)
Report the results of a survey completed by forestry practitioners pertaining to the importance of common forest inventory measurements, the complexity of capturing these inventory measurements with conventional methods, and the opportunities provided by low-cost RS technologies when conducting forest inventory tasks; and
(3)
Review how terrestrial low-cost sensors have been used to derive forest inventory metrics in the recent literature.

2. Background

The following sections outline the predominant low-cost sensor approaches for 3D terrestrial forest inventory acquisition. This includes the operating principles for each technology, in which errors may propagate within measurements derived from these approaches and their limitations in capturing 3D biophysical information in structurally complex forestry environments.

2.1. Close-Range Photogrammetry

Currently, the most common terrestrial CRP approach for estimating biophysical stem characteristics from point-cloud information is SfM [8]. This is an iterative process that uses a series of overlapping images, captured from different viewing angles and orientations relative to the object of interest, to find matching features and then simultaneously estimate camera location and scene geometry. This is conducted in a series of steps. First, an image matching algorithm (otherwise known as an interest operator), such as the scale-invariant feature transform (SIFT) [29] or speeded-up robust features (SURF) [30], is used to identify distinct regions that appear within multiple overlapping images. These feature regions are then used to simultaneously determine the relative 3D positions of cameras and features within an arbitrary coordinate system using a bundle adjustment. The absolute exterior orientation of the captured scene can then be determined through the addition of scale-referencing information, commonly in the form of ground control targets dispersed throughout the forestry plot, or attached to or around the stem in the case of single tree captures. Finally, dense image matching algorithms, such as multi-view stereo-photogrammetry (MVS) are used to generate dense point clouds.
One of the major benefits offered by SfM is that this method does not require any prior knowledge of cameras, the location or specific calibration parameters, and as such allows for the use of very low-cost hardware, including cameras incorporated into mobile phones [31]. Furthermore, due to continued advancements in SfM photogrammetry and feature-matching algorithms, the level of user proficiency and experience required to achieve dense and accurate point clouds has declined significantly since its introduction [32]. This largely arises from the fact that features can be identified from images regardless of camera orientation, viewing angle, or scale. It is this combination of lightweight and manoeuvrable hardware and the freedom it provides from very specific camera locations during data acquisition that means that forest plots can be captured relatively rapidly when compared to MSS TLS approaches, while still achieving adequate plot coverage to reduce occlusion [8].
Beyond terrestrial acquisition, SfM DAP approaches that utilise airborne platforms such as drones can be used to model forest canopy structure [33]. This approach, given a sufficient power supply, can cover larger areas of forest autonomously using pre-defined flight paths and rapidly when compared to capturing the same extent using terrestrial approaches [34,35]. However, utilising passive sensors means that this method can encounter difficulty in achieving sufficient points beneath the canopy surface due to occlusion, and thus struggles to accurately characterise vertical sub-canopy vegetation structures [36,37]. These limitations have led to recent studies exploring the integration of DAP and terrestrial CRP point-cloud fusion, acquiring above- and below-canopy characteristics that would otherwise be impossible to measure if utilising only one method [24], as well as the exploration of flying drones beneath the canopy to reduce occlusion [38].
The overall effectiveness of CRP, much like any RS method for providing forest inventory metrics, is highly dependent on the quality of the acquired data and the end requirements of the information. Despite the aforementioned benefits offered by SfM approaches, there are still limitations associated with their application in forestry settings. These limitations are often related to insufficient feature recognition within images due to either poor hardware calibration, capture methodologies or the influence of ambient environmental conditions present within a forestry setting [8]. Capture processes that have poor image geometry can result in positional inaccuracy when predicting feature locations, thus increasing error when it comes to estimating forest measurements [8,39]. The inability to account for occlusion caused by vegetation elements can result in incomplete data because of an insufficient number of images capturing the same feature from multiple positions. Strong ambient light intensity can also influence SfM accuracy, as shadows cast by the upper canopy can result in the uneven or shifting illumination of features within images that then affect the resultant point-cloud reconstruction [8,40]. Wind also has a similar effect by shifting the location of features, particularly pliant vegetation, between image captures, resulting in either an increase in point-cloud noise around objects or failed feature matches [8,41]. SfM is reliant on hard edges and unique features, creating surface contrast, something that can be difficult to find in a forestry setting due to the homogeneous hues and textures present, as well as soft edge effects caused by foliage. Finally, as SfM is a passive RS method, the coordinate space used for building dense point clouds lacks scale. As such, there must be prior knowledge of sensor location and orientation or the use of sufficient registration marks placed within the scene and accurately digitised. Failure to do so can result in an increase in measurement inaccuracy.
These limitations associated with feature matching can be reduced by using higher-quality images and strong image geometry, as well as ensuring that the area of interest is sufficiently covered with a large number of captures with high overlap and intersect angles that reduce occlusion. Iglhaut et al. [8] suggest that in heavily vegetated forestry settings important features should be included in at least five images (with an image overlap of ≥ 80 ° ) if scene elements are to be reconstructed successfully. However, increasing the resolution and number of images within a data set also increases the complexity of the already computationally intensive SfM algorithms. Therefore, to decrease processing times requires high-end, and often expensive, computing resources.

2.2. Low-Cost Depth Sensors

Since their initial introduction into the market in 2010, RGB-D devices, marketed primarily towards consumer applications, have undergone continued development and refinement. This technology emerged primarily for application within the film and video game industries, acting as a peripheral sensor for dynamic body tracking. However, recent advancements in RGB-D technologies have allowed for their use to be explored within a variety of industries, including forestry [42,43,44]. These devices are primarily designed for use by untrained personnel, balancing user experience with important traits such as data quality, sensor performance and the time taken to both capture and post-process 3D data [45]. Many recent RGB-D devices contain an inertial measurement unit (IMU) that allows the sensor to record the angular pitch and motion associated with each captured depth frame in six degrees of freedom. This inclusion allows for the depth imagery data captured with RGB-D sensors to be co-aligned in near-real time utilising simultaneous localisation and mapping (SLAM) algorithms. PLS also utilises a similar SLAM-based workflow and, because of this, RGB-D sensors can operate in a similar manner but with a shorter effective range and for a lesser cost [42]. This swift capture and processing time is one of the major benefits that RGB-D sensors offer over many single-camera CRP approaches.
Almost all consumer-grade RGB-D sensors collect 3D information based on an area approach, simultaneously capturing depth imagery for the entire FOV of the sensor [45]. However, the type of 3D depth sensor technology implemented within an RGB-D device can affect how appropriate it may be when deployed within a forestry setting. This is due to the fact that different sensor technologies respond differently to factors such as ambient light (orientation and intensity); the distance from the sensor to the target; and—akin to SfM—environments that have soft edges, complex geometry or semi-transparent surfaces [27]. Furthermore, RGB-D sensors are often prone to specific ocular distortion and noise issues that can vary in intensity depending on the sensor technology used. These issues are, in most cases, solved by post-processing procedures that are conducted by the device during capture. This automatic post-processing is conducted because of the ‘general consumer’ approach that these sensors are designed around and thus it is relatively easy to achieve an approximated output from them. However, this inbuilt post-processing approach is designed to optimise 3D data capture under specific conditions, commonly indoor environments. Therefore, utilising the sensor outside of these areas, such as outdoors, can result in an increase in the aforementioned sensor issues that must still be dealt with afterwards.
The method used to obtain 3D point-cloud information depends upon which of the two main RGB-D technology types is used: either time of flight (ToF) or triangulation, with the latter broken down further into the three categories of passive stereo (PS), active stereo (AS) and structured light (SL) systems. The following sections outline these technologies within the context of depth sensors in greater detail.

2.2.1. Time-of-Flight RGB-D Systems

RGB-D devices that utilise ToF technology to capture 3D information operate by calculating the distance between the device and object surfaces within its FoV. This approach is based on the time it takes the electromagnetic radiation (EMR) to be emitted by an illumination unit, reflect off objects within its direct environment and then return to the device’s near-infrared (NIR) camera. A traditional RGB camera often operates alongside a depth camera, separated at a known fixed distance known as a baseline, so that the RGB image can be easily transformed to the geometry of the depth image. Traditional LiDAR scanners, employed in TLS and ALS approaches, use highly accurate chronometers and mechanical components to calculate the time it takes for a single pulse of EMR to be emitted and return to the sensor’s receiver. These components, however, are costly and complex, and therefore ToF RGB-D sensors commonly operate on the basis of EMR phase shift, otherwise known as continuous wave (CW) ToF. This approach slightly adjusts the frequency of EMR wavelengths that are projected across the entire FOV of the depth sensor. Location and distance of features are then calculated based off the mean returned EMR frequency captured by each NIR camera pixel. These ToF calculations are commonly carried out on the CMOS or CCD sensor chip, depending on the imaging technology used by the RGB-D device. The accuracy of depth measurements obtained with CW ToF sensors can be improved by increasing the range of modulation in the wavelength frequency or resolution of the depth camera. The easiest way this is achieved is by conducting multiple acquisitions over a short period of time at slightly different variations in wavelength frequency and camera position [27].
Although implementing CW ToF RGB-D devices considerably reduces the cost of 3D data capture hardware when compared to traditional LiDAR systems, it also significantly limits the effective range at which information can be acquired. For example, the Microsoft Azure Kinect (Microsoft, Redmond, WA, USA), a CW ToF RGB-D sensor, released in late 2019, has a maximum range, as stated by the manufacturer, of up to 6 m when collecting depth information under ideal environmental conditions. Conversely, pulse-based ToF systems can often capture information at a distance up to several hundred metres [9]. Additionally, the NIR projection system implemented within CW ToF RGB-D devices can be influenced by ambient light if being used outdoors, effectively ‘washing out’ the reflected EMR. This can result in a reduced effective sensor range and an increase in the amount of noise coming off surfaces [46]. Recent advances in CW ToF RGB-D devices, such as the Azure Kinect, have offered the ability to reduce the depth camera resolution to improve sensor range, thus potentially offering greater applicability in outdoor settings [47]. However, as sensor accuracy is tied to the resolution of the incorporated depth camera, this can potentially result in a loss of scene detail depending on the spatial resolution of pixels as a function of distance and the NIR camera resolution.
It is worth noting that the emerging RGB-D sensors that utilise ToF technologies are becoming increasingly implemented into consumer devices such as mobile phones and augmented-reality headsets, increasing the accessibility of this 3D technology (e.g., Apple iPhone 12 Pro and Microsoft Hololens 2). The driving factor behind the use of CW ToF RGB-D systems over those that operate based on triangulation is that their small form factor allows for easier integration into pre-existing devices.

2.2.2. Triangulation RGB-D Systems

RGB-D sensors that operate on the principal of stereo vision capture 3D point-cloud information using two or more cameras with overlapping FOVs. Commonly, stereo RGB-D sensors operate on the principle of binocular stereo vision with some active stereo systems including a third camera to include RGB texture rather than an additional triangulation point. These cameras are mounted and calibrated so that their location and orientation in relation to one another is known. This distance between the centre point of any two cameras, similarly to ToF RGB-D, is referred to as the baseline. The accuracy of the baseline calibration is vital for the precision of depth measurements taken with stereo RGB-D sensors. Therefore, some devices—such as the Stereolabs ZED2 (Stereolabs, San Francisco, CA, USA)—incorporate thermometers as a peripheral sensor to account for distortions in camera position and focal length that may be caused by heat generated by device components during operation.
To capture point clouds, depth information is acquired by first finding pixels associated with corresponding features within the FOV of each sensor. From these matching pixels, the 3D position of each point can be calculated through triangulation using the known baseline between each sensor [48]. Although feature matching is a computationally complex procedure, as seen in single-camera SfM approaches, this process is expedited by knowing the baseline distance between the optical centre of each sensor component. By transforming each frame so that both camera horizontal axes are level point matches can only occur along the same pixel lines within each image, allowing for one-dimensional epipolar searches. These processes for expediting feature matching allow for geometry to be reconstructed in near-real time and thus, with an incorporated IMU, allow for SLAM point-cloud reconstruction.
As previously discussed, the accuracy of depth measurements acquired with RGB-D sensors that use triangulation systems is tied to the baseline distance between the left and right cameras. By increasing the baseline, and therefore the triangulation angle, the depth accuracy of measurements is increased. There is a tradeoff, however, where a larger baseline results in an increase in potential scene areas that both cameras cannot capture simultaneously, because of either occlusion from scene elements or self occlusion, thus resulting in missing depth data [49]. Self-occlusion, otherwise referred to as the minimum effective range for stereo systems, occurs when an object is so close to the sensor that it is captured within the FOV of one camera but not the other. In some stereo RGB-D devices, the optical axis of each camera is turned inwards slightly to increase the overlap within each sensor’s FOV and reduce this effect. Furthermore, consumer triangulation RGB-D sensors are incentivised to have small forms, and therefore shorter baselines, to potentially integrate more easily into other devices, much like ToF RGB-D devices.

Passive Stereo

PS vision approaches for the derivation of 3D depth data use the input from two or more conventional RGB cameras separated along a baseline [50]. This approach is considered passive, as the sensor does not contain an active NIR projection component that alters the appearance of the scene captured by the sensor’s FOV. This is the main factor that differentiates this sensor type from the other triangulation methods, both of which use active components.
The benefit of using passive triangulation within an RGB-D device arises from the fact that they do not contain active EMR projection components. This makes the sensors very cost- and energy-efficient in terms of hardware. Having a good power efficiency also allows for potentially longer capture times when passive triangulation sensors are working off an external power source or when integrated into other devices as a peripheral sensor. Furthermore, as these sensors are not reliant on emitted EMR they have a greater effective sensor range when compared to active technologies. For example, the Stereolabs ZED 2 passive stereo RGB-D sensor has a maximum depth range of up to 20 m , with a depth measurement accuracy <1% up to 3 m and <5% up to 15 m . Although RGB cameras may be able to discern features at distances greater than the maximum passive stereo distance, due to the fact that the disparity between the left and right images is so small, accurate depth measurements cannot be obtained [51].
Although PS RGB-D sensors still utilise the known baseline distance between cameras to assist in point matching, they are reliant purely on RGB data and therefore, similarly to SfM approaches, struggle in scenes with low texture, highly homogeneous features or low ambient lighting that can cause missing depth data because of insufficient point matches [48].

Active Stereo

AS vision systems incorporate a set of stereo NIR sensors alongside a single RGB camera for RGB texture and a NIR projection subsystem. AS systems aim to resolve the aforementioned issue with PS systems concerning low or homogeneous textures and poorly lit scenes by artificially enhancing the texture within the sensor’s environment. This is done by projecting a highly textured and semi-random static pattern that overlays the environment within the sensor’s FOV to then assist in the point-matching procedure [52]. Beyond simplifying the point-matching process, the NIR pattern also allows for a greater point density within the scene due to a higher number of feature matches [45].
AS RGB-D devices do not require prior knowledge of the projected NIR pattern that is emitted by the sensor, as depth geometry is not calculated by distortion within the projected pattern. Therefore, multiple AS devices can operate simultaneously within the same environment without the risk of one sensor causing interference with another due to the projected NIR pattern. Grunnet-Jepsen et al. [52] suggest that by adding additional NIR projectors to the scene captured by an AS depth sensor might improve performance because of the increase in texture and scene illumination. Furthermore, the non-reliance on a specific pattern to calculate depth makes the sensor more resilient in outdoor settings where the influence of ambient light will not severely affect the performance of the sensor beyond potentially ‘washing out’ sections of the projected pattern [48]. Although offering significant benefits in performance and accuracy when compared to PS systems, AS is not without its limitations, having a greater power consumption rate, as well as a smaller effective range. Although range can be extended slightly by utilising a laser-based projection system rather than an LED one, this also increases the power consumption of the sensor. Furthermore, laser-based projectors are subject to the effect of laser-speckle, caused by interference, as EMR is refracted from different points on a surface. Although laser-speckle can be reduced, it cannot be completely eliminated and, as such, active stereo systems that use LED projectors provide >30% more accurate depth measurements.

Structured Light

SL systems, otherwise known as coded light, incorporate a single NIR camera and a coded light projector that are separated along a baseline to estimate scene depth. The system operates by projecting a known, structured pattern of points onto the scene captured within the camera’s FOV. The geometry of the scene is then calculated based on the deformation observed in the captured NIR pattern when compared to the known pattern. This deformation is caused by beam divergence, interaction with the sensor’s surroundings and the baseline distance between the projector and the NIR camera [45,53].
There are two main approaches for determining the correspondence between the pixels of the NIR camera and the coded light projection unit for calculating scene geometry. The first method is spatial encoding, where a static pattern of points is projected into the environment and the correspondence between points and NIR camera pixels is determined and refined based on local neighbourhoods of pixels. The second method is temporal encoding, where a series of known point patterns are cycled at the same frame-rate as the NIR camera and the depth geometry of the scene is refined based on deformation within the projected patterns [48].
As SL systems are reliant on prior knowledge of the projected pattern, only a single device can be deployed in the same FOV at a single time. This is due to the fact that the patterns projected by two devices would cause confusion in the feature-matching process when calculating the scene geometry. It is due to this reliance on a known pattern that SL systems are much more subject to the influence of ambient EMR compared to AS systems. It is because of this, as well as the inability to fall back on a PS approach, that SL systems have largely been superseded by AS approaches.

2.2.3. Summary

Table 1 provides a summary of the low-cost technologies described in Section 2, and provides examples of consumer devices that incorporate these sensors.

3. Method

In order to assess the current opportunities and future research directions for low-cost RS technologies in the acquisition of forest inventory, we conducted two processes, comprising (1) a review of the current publications pertaining to low-cost terrestrial 3D RS methods in forestry, and (2) a survey of current forestry professionals concerning the importance and capture complexity of different inventory measurements. The following section outlines the design of these processes.

3.1. Literature Review for the Application of Low-Cost Terrestrial Sensors for Forest Inventory

To review the literature surrounding the application of low-cost RS technologies for the terrestrial capture of forest inventory metrics, a search for scientific publications was conducted using the Scopus peer-reviewed literature database, from Elsevier, and their advanced search tool (https://www.scopus.com, accessed on 15 December 2021). This search was carried out by finding publications containing the following terms within their title, abstract or keyword sections with the Boolean operators of: RGB-D OR depth sensor* OR range camera* OR structure from motion OR SfM OR close range photogrammetry OR image based point cloud* AND forest* OR forest inventor* OR tree. This search was conducted using a temporal constraint of 2016 to 2021. By considering only literature published within this time frame, the information summarised remains relevant to current technology capabilities and potential future research directions. Based on these criteria, we manually filtered the returned literature to find critical publications that assessed terrestrial low-cost CRP and RGB-D RS technologies for the acquisition of forest inventory metrics.
Following the search, the key literature was broken down into separate categories based on the capture technology, capture method, and the forest inventory metrics contained within each publication. The identified capture technologies were categorised as either CRP, stereo CRP (utilising two or more cameras separated at a known fixed distance) or the different RGB-D technologies (ToF RGB-D, SL RGB-D, AS RGB-D and PS RGB-D). The capture method referred to how the RS technology was used to obtain forest inventory information. In the case of single-stem capture methodologies, this referred to if a partial or complete capture of the stem’s basal area was conducted. On the other hand, in the case of data collection at a plot scale, it referred to the method employed to move the RS technology through the plot—this was identified as either a stop-and-go or continuous mobile method. Finally, the identified forest inventory metrics were categorised as DBH, perimeter at breast height (PBH), stem diameter, stem circumference, stem taper, stem volume and stem detection (the ability to capture stem density, location within a plot and the overall completeness of resultant point-clouds).

3.2. Forest Inventory Metrics Survey

In addition to the review of current publications pertaining to the application of low-cost terrestrial RS methods for the acquisition of forest inventory metrics, we also conducted an anonymous survey of current forestry professionals. The primary aim of this survey was to rate the importance of different forest inventory metrics and the capture complexity associated with each of these measurements when using current manual methodologies. Respondents were selected based on stratified sampling, with the survey circulated globally to forestry research institutions and forestry corporations based on professional connections with the authors or through correspondence because of the publication of significant literature within the field. These communications contained a link to the survey and a request to circulate the e-mail to any further contacts the recipient may have who they believe could contribute to this research. Beyond this, we also published the survey within an Australian and New Zealand weekly newsletter that has a focus on forestry news, equipment and emerging technologies (https://www.fridayoffcuts.com/, accessed on 5 February 2021). The survey was first published in mid-January 2021 and ran for approximately two months, until mid-March. It was administered in English using the Qualtrics platform.
The survey consisted in total of 17 questions. Two questions captured the professional demographic of the respondents, recording information regarding their role in either gathering or using forest inventory data and their level of experience in this role. Four questions captured where the respondents gather their inventory data, including the type of forest tenure, the dominant forest type their employer manages, the country where their forests are located and the purpose of their forest management. Four questions captured their inventory measurement procedures, including plot layout, sampling density and distribution, stand age when inventory measurements are acquired and the average time this process takes. Two questions asked respondents to rate the importance of a list of inventory metrics using the following categories, (1) unimportant, (2) optional, (3) important, (4) very important and (5) critical. Two questions asked respondents to rate the complexity of capture associated with the same inventory metrics on a scale. This scale used the categories of (1) very easy, (2) easy, (3) neither easy nor difficult, (4) difficult, (5) very difficult. If a respondent was unsure of the complexity of the capture regarding any metric, they were able to mark it as not applicable. Finally, two questions asked the respondents to state what they considered would be the maximum price ($USD) associated with a sensor for it to still be regarded as low-cost and how such a sensor may be used within their inventory procedures if they had any thoughts on the matter.
The inventory metrics listed within this survey contained plot-scale and individual stem measurements with the potential to be captured by terrestrial RS techniques. These metrics included conventional measurements such as DBH, stem height to canopy and first branch, stem taper, stem location, stem count, stand age, coarse woody debris, mortality and canopy cover, and also included less common measurements such as stem sweep (uniform curvature along the stem), forking, stem damage, bark texture, stem hollows and invasive species detection. Respondents were also asked to state any metrics of critical importance that were not included within the aforementioned list of metrics and if they were considered to fall into the ‘very difficult’ category of capture complexity.
Survey results describing the importance and capture complexity associated with forest inventory metrics were analysed as a whole, using the rating mode as a descriptive statistic. Responses were also categorised into two groups based on if the respondent conducted inventory measurements for commercial timber purposes or for purposes related to general land management, conservation and monitoring. This was conducted to discern if there was a difference in survey responses based on forest type.

4. Results

4.1. Literature Review for the Application of Low-Cost Terrestrial Sensors for Forest Inventory Capture

Using the Scopus literature search engine and the search parameters specified in Section 3.1, a total of 548 publications were returned. From this literature, key publications that utilised either low-cost CRP or RGB-D terrestrial approaches for forest inventory acquisition were identified (n = 18). In addition to the identified literature, four alternative publications were included that have particular relevance in this review. All identified publications have been summarised based on the scale of capture within the study; either a single-stem approach (n = 11, Table 2) or a plot-scale approach (n = 12, Table 3). These tables present the type of low-cost technology and sensor used to capture forest inventory, the method used to capture information with the sensor, the inventory measurements explored within the study and the number of stems recorded. The majority of recent publications focused on the acquisition of linear inventory metrics, including DBH, perimeter at breast height (PBH), stem diameter and circumference measurements (for stem curve taper estimation), stem height and stem detection (including stem location and completeness of point clouds). In addition to these, two studies also estimate stem volume. The most commonly investigated measurement was stem DBH or PBH (n = 20).

4.1.1. Terrestrial Close Range Photogrammetry Literature Analysis

Most identified publications concerned the application of SfM CRP for conducting forest inventory tasks (n = 17), and comparing CRP-derived point cloud estimates to those captured in the field with manual instruments, TLS or PLS approaches. Of these studies, eight were conducted at a single-tree scale, and nine captured inventory data at the plot scale. Almost all the identified studies utilised a single-camera CRP approach; however, three publications utilised approaches that applied two [54] or more cameras [40,55] separated at a fixed distance on a rig carried by an operator.
Single-stem studies have largely explored the accuracy of SfM CRP measurements and the influence that different capture approaches have on resultant point clouds. This was then used to draw inferences surrounding the optimal capture procedure in terms of distance from target stem and image overlap, as well as the effect that species may have when estimating structural measurements. As mentioned above, all single-stem CRP methods used a single camera except for Mulverhill et al. [54], who explored a stereo-CRP approach (similar to PS RGB-D) as a method to reduce the capture and processing time for each stem by maintaining a fixed overlap and relationship between the two cameras. All individual stem CRP approaches captured the entirety of each tree’s basal area, noting only studies that also investigated height and taper measurements and attempted to capture images of locations further up the stem. Akpo et al. [39] suggest that when capturing individual trees, images taken 2 m from the stem at 30 ° intervals achieve the highest accuracy when deriving PBH estimates from point clouds. This is largely in agreement with Bauwens et al. [56], who also suggest that maintaining a high image overlap is integral to reliable and accurate point-cloud reconstruction. The main justification behind utilising a single-stem approach within these publications, as opposed to continuous plot-scale capture, was that it reduces the long computational times associated with SfM CRP when reconstructing point clouds of larger areas [32].
DBH was used as a measurement in six of the individual stem CRP publications (Table 2), with root mean square error (RMSE) values ranging between 0.37   c m and 1.71   c m when compared to measurements acquired with manual tools. PBH was used as an alternative to DBH in two of the identified publications [39,57], and used alongside DBH in another two [58,59]. PBH measurements derived from SfM had a reported RMSE between 0.25   c m and 1.87   c m when compared to manual measurements. Fang and Strimbu [10] estimated stem taper curve with an RMSE of 1.67   c m , using the second estimation model presented by Kozak [60]. Conversely, when using a stereo CRP approach Mulverhill et al. [54] found that although a similar curve estimation method worked best at heights below 8 m (RMSE = 0.5   c m ), for heights above this, estimates based on allometric models using DBH and stem-height estimates worked best (RMSE ≤ 1 c m ). Only two publications estimate volume, once for the entire stem [54] (RMSE = 0.094   m 3 /15.5%) compared to single-scan TLS estimates, and once for just the stem bole [39] (error = 2%) compared to manual tape measurements taken at 0.5   m intervals.
Studies that captured inventory metrics at a plot scale utilising CRP methodologies have used either moving capture approaches, using a stop-and-go or a mobile method, or a stationary approach, where images were captured from the centre of the plot, only capturing partial-stem views but reducing overall capture and processing times [40,61]. Regarding the former, Mokroš et al. [62] compared a series of capture methodologies based on those previously defined by Liang et al. [63] and Liang et al. [64], provided the most accurate stem measurements using a vertical camera orientation and navigating around the plot exterior facing inwards, with two central transects facing out. Although a vertical camera orientation yielded the best results Mokroš et al. [62] stated that it requires a higher operator precision during the capture process to ensure that a sufficient overlap is maintained between image captures. Piermattei et al. [32] later expanded upon this method, comparing SfM CRP to TLS and PLS approaches, finding SfM to be comparable to benchmark MSS TLS when estimating stem location, DBH and stem curve taper up to a height of 3 m above ground height.
In plots that were successfully reconstructed, stem detection rates ranged between 65% and 98% with commission errors mostly being caused due to plot boundary issues as opposed to point-cloud noise. DBH was measured in all plot-scale publications, with RMSE values ranging between 1.11   c m and 9.5   c m . Large DBH errors were attributed to either incomplete stem captures [40] or scaling errors within the point cloud because of erroneous registration marks inside the plots [62]. Piermattei et al. [32] found that stem taper estimates, captured at a sensor height of 1.3   m were accurate to a height of 3 m with errors ranging between 0.58   c m and 2.45   c m . Conversely, Hunčaga et al. [65] were able to capture stem taper to 8 m up the stem with an RMSE value of 1.9   c m . The study by Bayati et al. [66] was the only publication to estimate stem height from a plot-scale capture approach. The authors used a similar method in [62]; however, there was a significant difference in height metrics derived from field measurements and CRP estimates, with an RMSE value of 3.1   m (−11.3%).
It is the consensus within the identified publications that the variations in the accuracy of CRP measurements presented within the current literature is largely due to the species captured, as well as natural variations in structural plot complexity caused by stem density, occlusion or thick undergrowth. Furthermore, harsh lighting conditions can negatively influence the SfM feature-matching process, particularly when conducting plot-scale captures. Marzulli et al. [67] suggested that performing field campaigns when the sun is at its peak or on overcast days may result in a higher chance of successful point-cloud reconstruction. Iglhaut et al. [8] conducted a comprehensive review in 2019 on the state of SfM CRP for deriving forest inventory metrics at that time. Although there is some overlap in the reviewed terrestrial literature, we have included relevant studies published since that time. Our findings regarding the accuracy and methodologies used, as well as the justifications for variations in accuracy, still largely correlate with theirs.

4.1.2. Terrestrial Low-Cost Depth Sensor Literature Analysis

Of the identified literature, seven publications explored the application of RGB-D devices. Two of these studies were conducted at the individual stem scale [42,47] and four at the plot scale [43,55,68,69]. Only Fan et al. [44] utilised an RGB-D sensor at both the individual stem and plot capture scales within the one study in order to best target different inventory measurements.
In a prior study, we explored the application of CW ToF RGB-D for acquiring urban tree DBH measurements from partial stem views [47]. This is similar to a publication by Hyyppä et al. [42], who explored alternative SL and CW ToF RGB-D devices for acquiring DBH and stem taper measurements ( 1.3   m ) in a natural forest setting, as well as Fan et al. [44], who captured partial stem views to derive DBH estimates in near-real time. These studies were all conducted at a single-stem scale, with DBH RMSE ranging between 0.73   c m and 3.35   c m when compared to manual measurements. Hyyppä et al. [42] found that partial stem views captured with the SL RGB-D sensor provided DBH estimates comparable to those collected with calipers (DBH RMSE = 1.9   c m ); however, capturing a complete stem view provided the best results (DBH RMSE = 0.73   c m ) when compared to manual tape measurements.
The primary aim of these aforementioned studies was the exploration of emerging RGB-D technologies and of how they performed in forestry settings. Hyyppä et al. [42] found that stem measurement accuracy was highly dependent on SLAM positional drift and loop closure detection when capturing a complete view of stems. This effect was increased when attempting to record more than one stem in a single capture, with the combination of sensor drift and failed SLAM loop closure resulting in increased misalignment error. Tomaštík et al. [43], utilising the same CW ToF RGB-D device, the Lenovo Phab 2 Pro with Google Tango (Lenovo Group Limited, Quarry Bay, Hong Kong), were able to avoid this aliment error when capturing RS data at a plot scale by capturing a single aspect of each stem within the sample plot only once when moving through the area in a spiral pattern. However, such an approach results in higher comparative DBH error (RMSE = 1.91   c m ) and incomplete plot coverage. Coincident SfM CRP, captured using a stop-and-go approach, had over ten times the point density compared to RGB-D capture and demonstrated lower error when estimating DBH measurements (RMSE = 1.15   c m ) because of its ability to account for complete plot coverage.
Recently, publications have explored the application of the CW ToF RGB-D sensor integrated into the 2020-generation iPad Pro and iPhone 13 Pro (Apple Inc., Cupertino, CA, USA) [55,68]. Both Gollob et al. [68] and Mokroš et al. [55] investigated the performance of the integrated RGB-D sensor, alongside a selection of software native to the device that is used to capture and pre-process the data within a forestry setting. Gollob et al. [68] found that stem location estimates had an RMSE between 10.9   c m and 21.8   c m when comparing each stem’s location to that of neighbouring trees. When predicting DBH, RMSE ranged between 3.13   c m (10.5%) and 4.51   c m (15.1%), depending on the preprocessing software used to capture the data. They derived the best DBH estimates using a direct least squares ellipsoid fitting algorithm on resultant point clouds. Gollob et al. [68] found that DBH was underestimated for stems with DBH <15 c m and overestimated with stems >30 c m . However, the DBH threshold where stems were over- or underestimated depended on the software used to pre-process the RGB-D information. These findings concur with those by Mokroš et al. [55], who compared the iPad RGB-D sensor to TLS, PLS and stereo CRP approaches for detecting stems and estimating DBH. The authors reported a DBH RMSE of 3.14   c m (10.89%) across all plots. The RGB-D estimates had a higher reported accuracy compared to PLS (RMSE = 6.26   c m , 18.88%) and stereo CRP (RMSE = 6.98   c m , 22.86%), but were out performed by TLS (RMSE = 1.45   c m , 5.18%). Similarly, RGB-D stem detection (DBH > 7 c m ) was 77.24% across all plots, performing better than the PLS (67.91%) and mobile stereo CRP (64.18%) capture approaches, but worse than TLS (95.15%). The authors suggested that the reason the iPad RGB-D sensor performed better than the PLS and stereo CRP approaches was that the latter two sensors experienced increased noise around the stems. Unlike prior studies, both authors were able to achieve a more complete plot coverage (with complete stem captures), without increased point-cloud misalignment and positional error due to SLAM drift. However, Mokroš et al. [55] conducted data capture in such a way as to avoid re-scanning already captured stems. Where this was not avoided, the accuracy of stem reconstruction deteriorated.
In response to this issue of sensor drift within the application of RGB-D devices in forest environments; Fan et al. [69] designed a trunk-based SLAM algorithm for forest environments that could operate in real time on a mobile phone with an integrated CW ToF RGB-D sensor. This comprised a trunk detection algorithm where, when a stem is observed, it is compared to all previously captured stems within 3 m based on: (1) the DBH estimate of the observed trunk and all previous trunks, and (2) their respective positional measurements. This is then used to determine the probability of it being a new stem or a previously detected one and thus positional drift is corrected based on this. The mean positional error of stems using this SLAM approach was 0.09   m ; an improvement over previous approaches for stem-based mapping by Fan et al. [44] and Tomaštík et al. [43], which reported a positional accuracy of 0.12   m and 0.2   m , respectively.
Table 2. Overview of reviewed scientific publications, from 2016 to present, pertaining to the application of low-cost terrestrial RS for the acquisition of forest inventory metrics from single tree stems. Publications have been categorised based upon: (1) the capture technology used to acquire point-cloud information, either close-range photogrammetry (CRP) or colour and depth sensor (RGB-D); (2) the name of the sensor used; (3) if either partial or complete stem views were captured; (4) the inventory metrics analysed within the study (diameter at breast height (DBH), perimeter at breast height (PBH), stem curve taper and stem detection including location); and (5) the number of tree stems captured. Publications marked with * denote that they did not fall within the defined search parameters but have been included due to their relevance.
ReferenceCapture TechnologySensor NameCapture MethodInventory MetricsNumber of Stems
Akpo et al. [57]CRPCanon 77DComplete Stem ViewPBH30
McGlade et al. [47]ToF RGB-DMicrosoft Azure KinectPartial Stem ViewDBH51
Mokroš et al. [58]CRPCanon 70D (Fisheye Lens)Complete Stem ViewDBH
PBH
Stem Diameter (0.8 m, 1.8 m)
Stem Circumference (0.8 m, 1.8 m)
40
Akpo et al. [39]CRPCanon 77DComplete Stem ViewPBH
Bole Volume
30
Mulverhill et al. [54]Stereo CRPRICOH Theta S (Fisheye Lens)Complete Stem ViewDBH
Stem Diameter (0.8 m, 1.8 m)
Volume
15
Fan et al. [44] *ToF RGBDGoogle TangoPartial Stem ViewDBH
Stem Height
193
Mokroš et al. [70]CRPCanon 70D (Fisheye Lens)Complete Stem ViewDBH
Stem Diameter (0.8 m, 1.8 m)
40
Hyyppä et al. [42]ToF RGB-D
SL RGB-D
Google Tango
Microsoft Kinect V1
Complete Stem View (ToF)
Partial Stem View (SL)
DBH
Stem Taper
240 (ToF)
41 (SL)
Bauwens et al. [56]CRPNikon D90Complete Stem ViewDBH46
Fang and Strimbu [10]CRPNikon D3200Complete Stem ViewDBH
Stem Taper
18
Surovỳ et al. [59]CRPSony NEX 7Complete Stem ViewDBH
PBH
20
Table 3. Overview of reviewed scientific publications, from 2016 to present, pertaining to the application of low-cost terrestrial RS for the acquisition of forest inventory metrics at a plot scale. Publications have been categorised based upon: (1) the capture technology used to acquire point cloud information, either close-range photogrammetry (CRP) or colour and depth sensor (RGB-D); (2) the name of the sensor used; (3) the approach used to capture information with the sensor; (4) the inventory metrics analysed within the study (diameter at breast height (DBH), perimeter at breast height (PBH), stem curve taper and stem detection including location); and (5) the number of tree stems captured. Publications marked with * denote that they did not fall within the defined search parameters but have been included due to their relevance.
ReferenceCapture TechnologySensor NameCapture MethodInventory MetricsNumber of Stems
Mokroš et al. [55] *ToF RGB-D
Stereo CRP
Apple iPad LiDAR
Sony A6300
Mobile
Mobile
DBH
Stem Detection
268
Gollob et al. [68] *ToF RGB-D Apple iPad LiDAR Mobile DBH
Stem Detection
424
Bayati et al. [66]CRPNikon D5500Stop-and-GoDBH
Stem Height
Stem Detection
35
Fan et al. [69] *ToF RGB-DGoogle TangoMobileStem Detection334
Hunčaga et al. [65]CRPCanon EOS 5D MkIIStop-and-GoDBH
Stem Taper (0.3 m–8 m)
43
Marzulli et al. [67]CRPSamsung Galaxy S6Stop-and-GoDBH
Stem Volume
45 (DBH)
15 (Volume)
Piermattei et al. [32]CRPNikon D800Stop-and-GoDBH
Stem Taper (<0.65 m)
Stem Detection
307
Fan et al. [44] *ToF RGB-DGoogle TangoMobileStem Detection193
Mokroš et al. [62]CRPCanon EOS 5D MkIIStop-and-Go
Mobile
DBH
Stem Detection
67
Berveglieri et al. [61]CRPNikon D3100 (Fisheye Lens)Plot Centre Nadir CaptureDBH
Stem Detection
7
Tomaštík et al. [43]ToF RGB-D
CRP
Google Tango
Canon EOS 5D MKII
Mobile
Stop-and-Go
DBH
Stem Detection
118
Forsman et al. [40]Stereo CRPCanon 7D
Canon 40D
Plot Centre Stop-and-GoDBH
Stem Detection
160
Fan et al. [44] were the only authors to explore the capture of stem height estimates with RGB-D devices, comparing the estimates to those derived with a total station. Because of the limited range of active RGB-D devices, height was estimated by capturing the entire top of the stem within the FOV of the sensor, recording its position and then calculating the geometric relationship between the visible top of the stem and the basal area of the trunk that was still within range of the depth sensor to capture the horizontal distance between the sensor and target tree. Estimated height RMSE ranged from 0.46   m to 2.44   m across all the captured plots and worked best when the target tree height was less than 20 m .

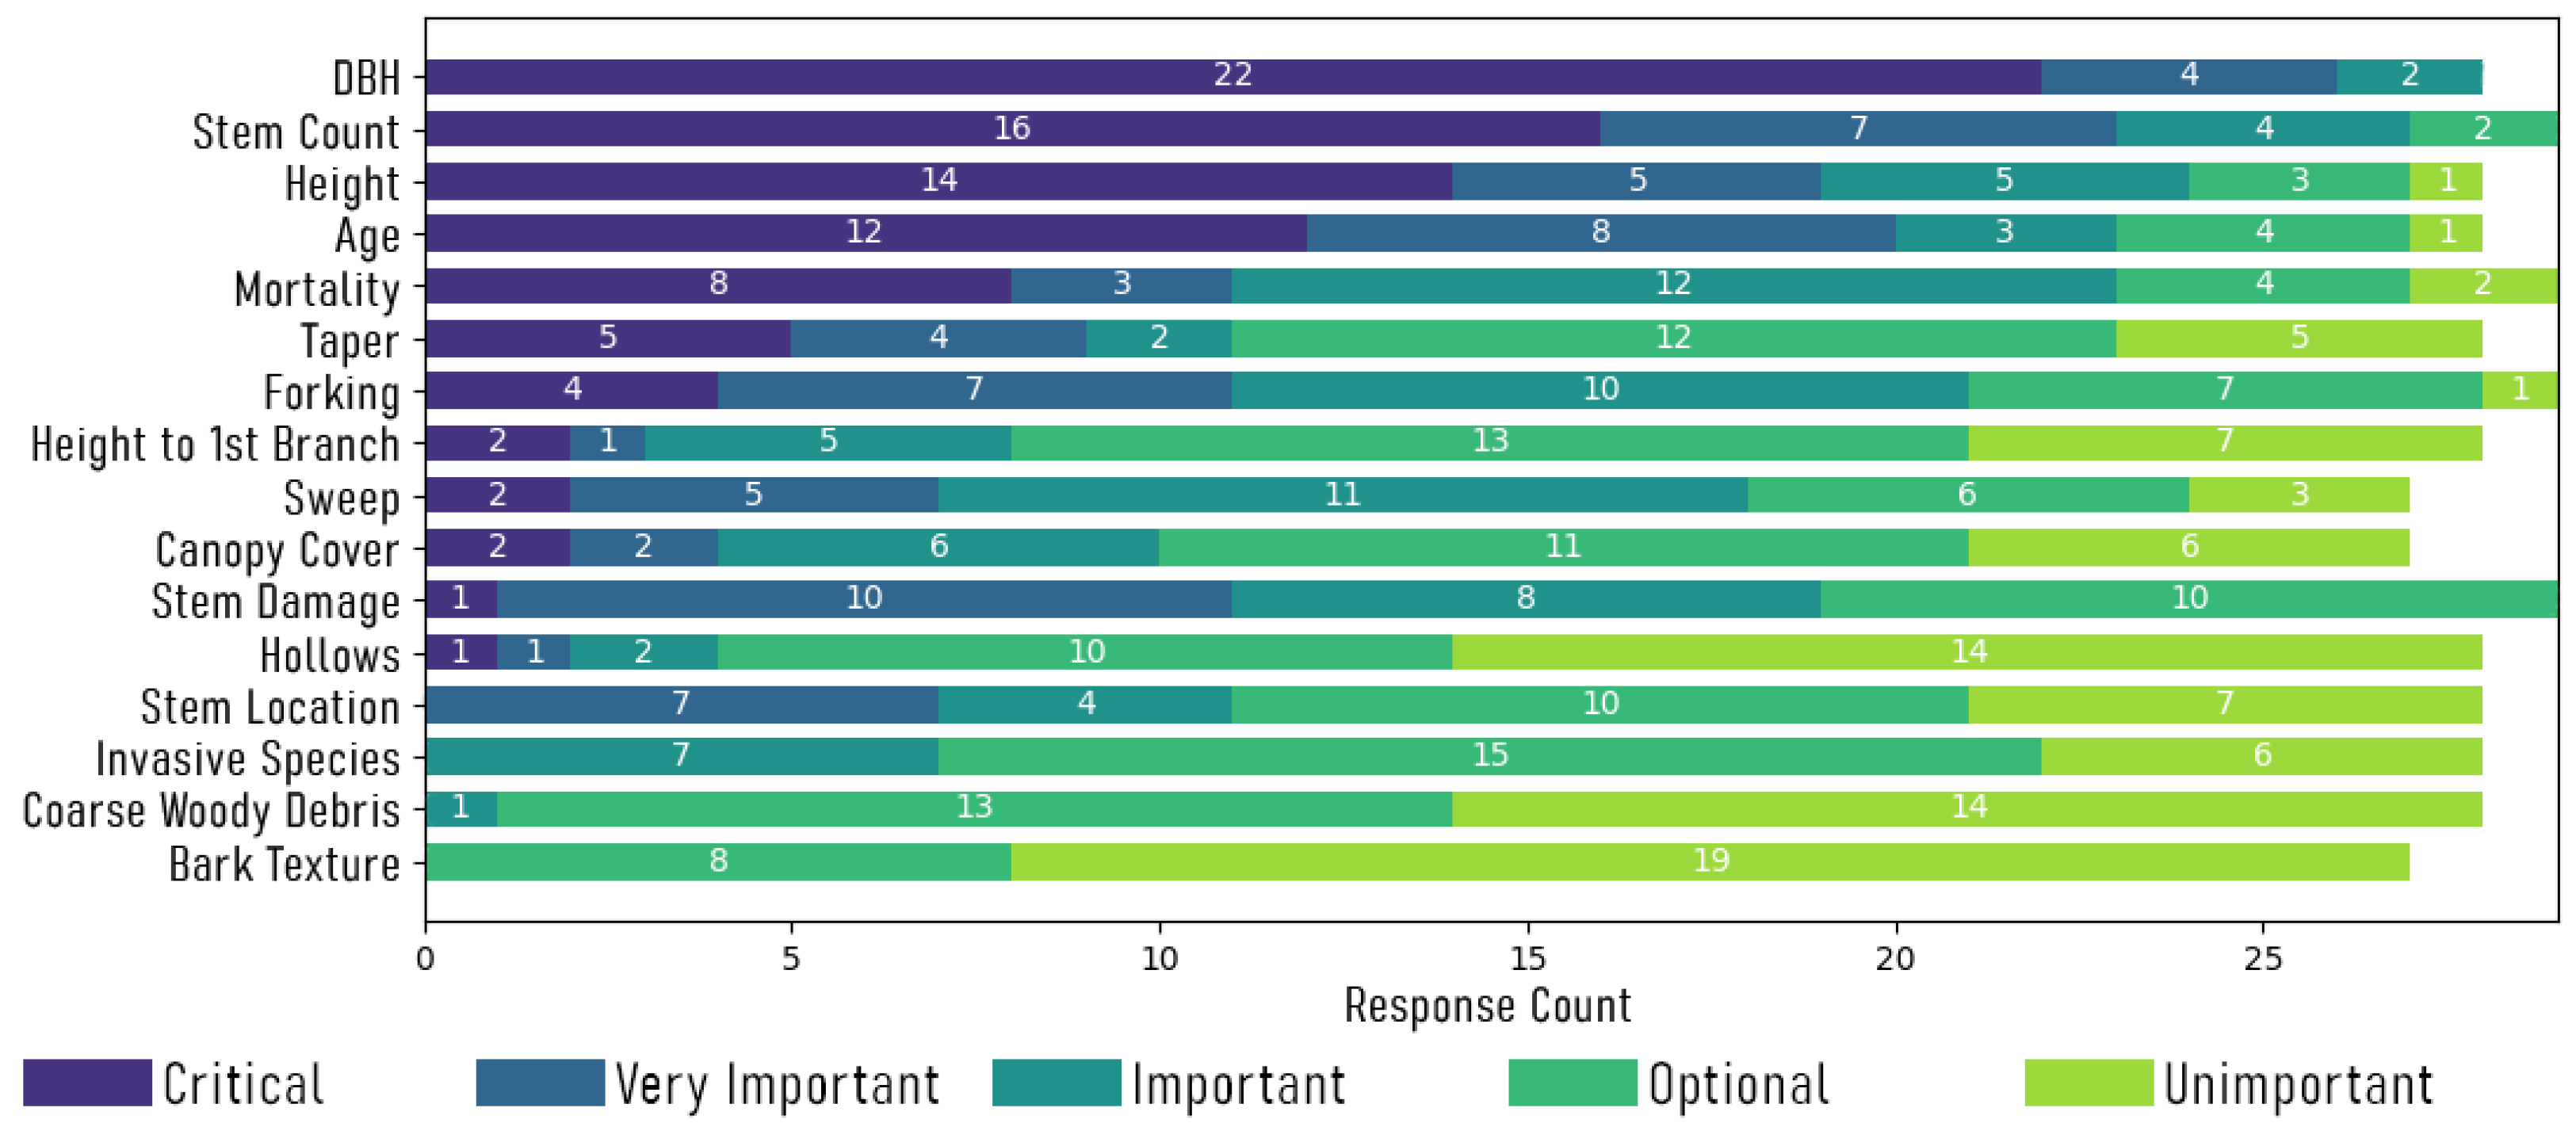
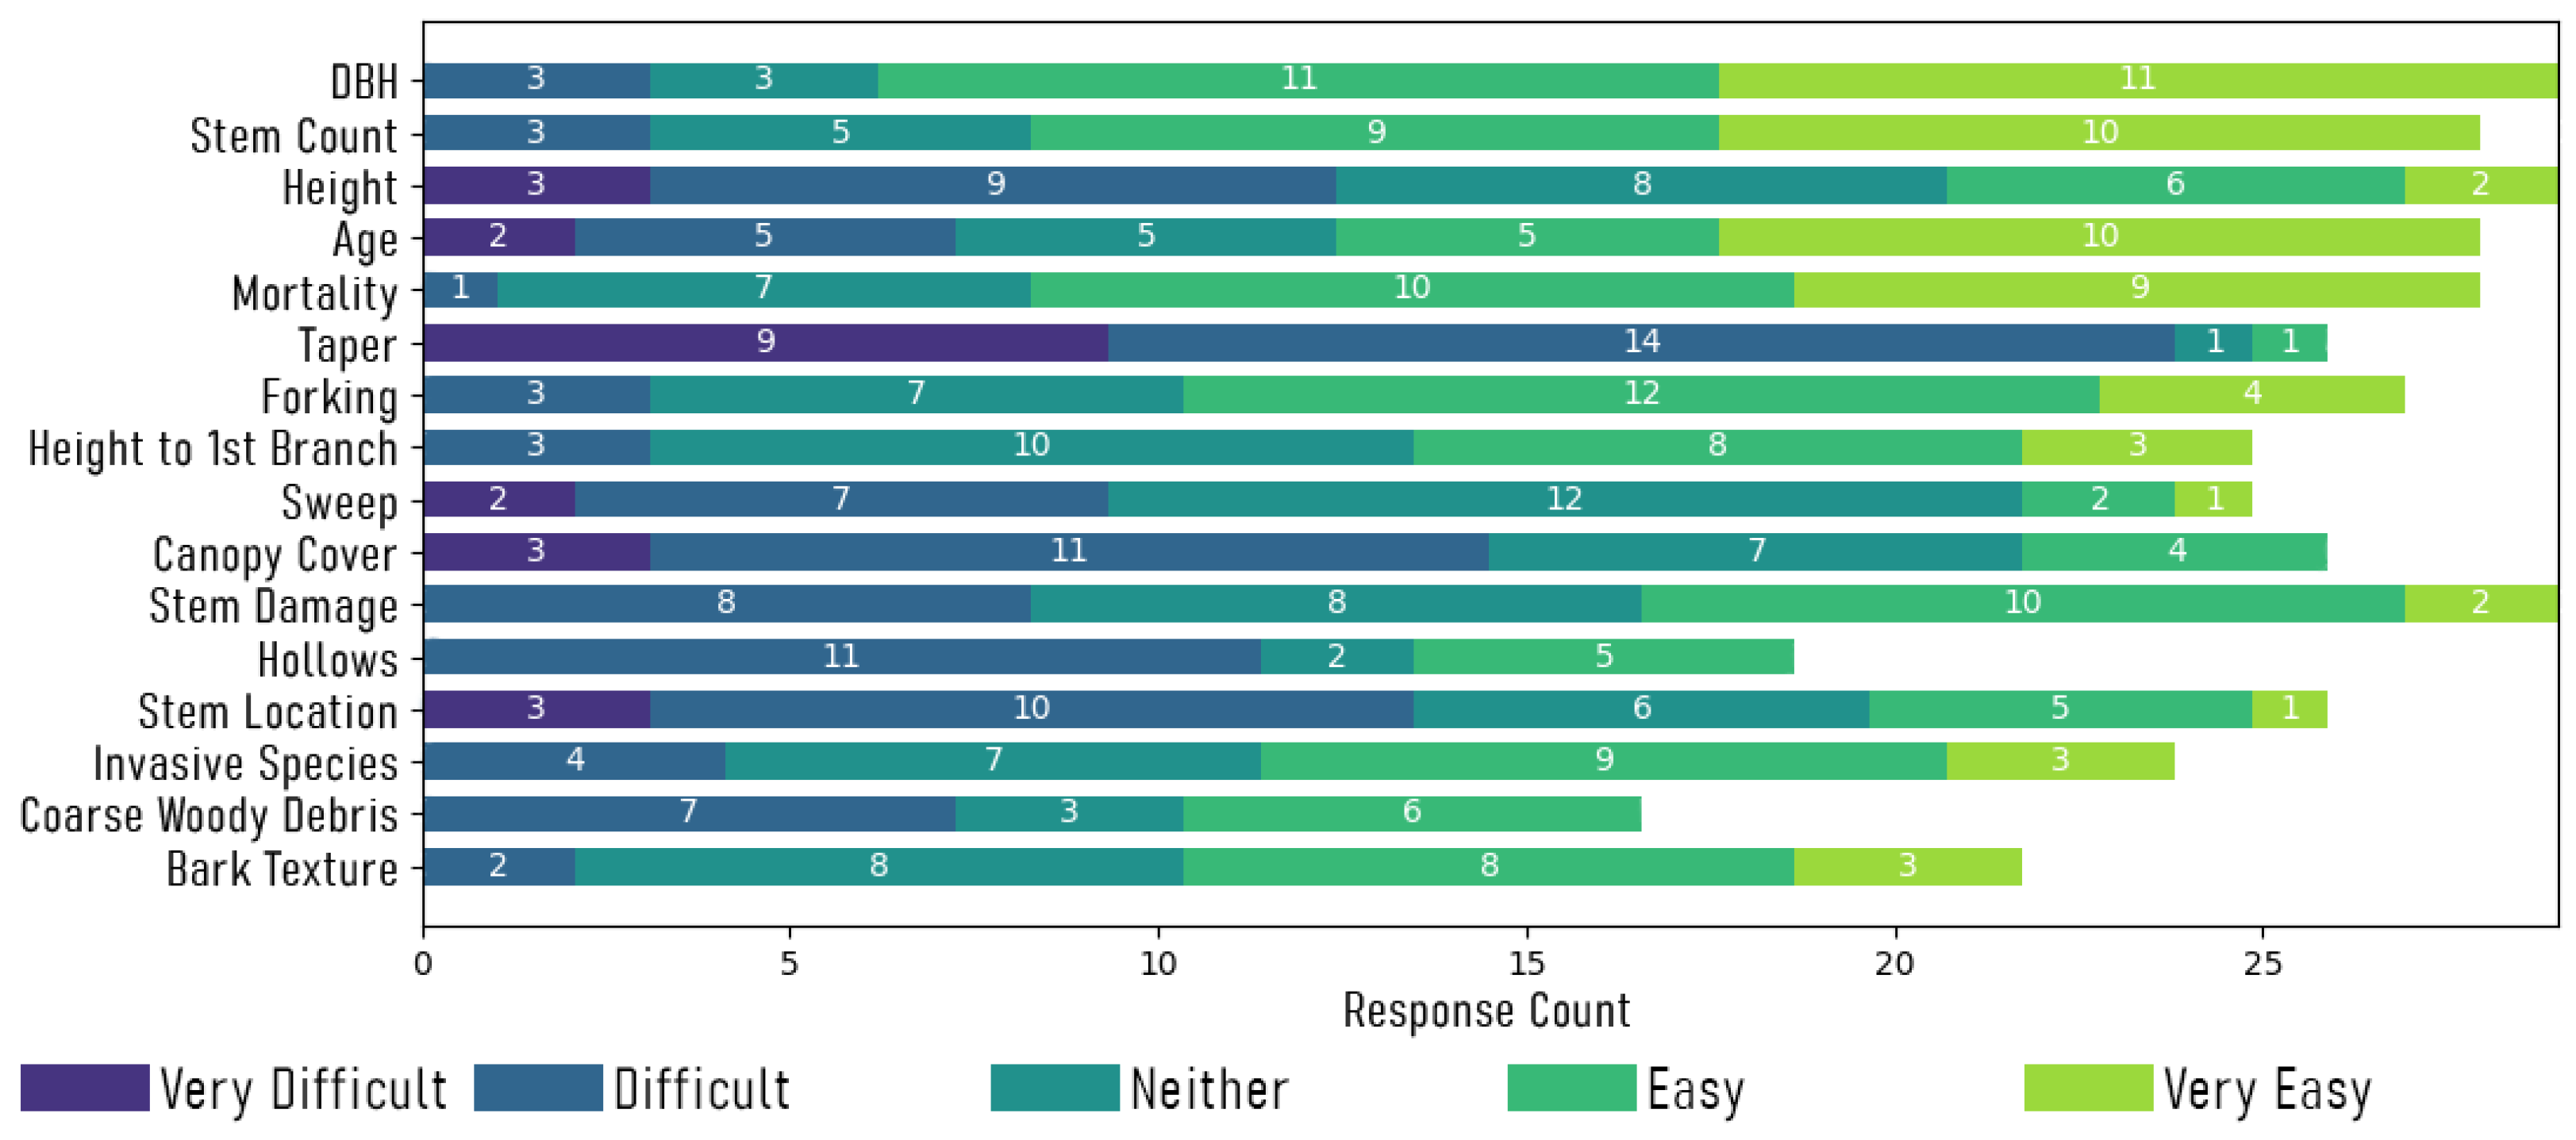
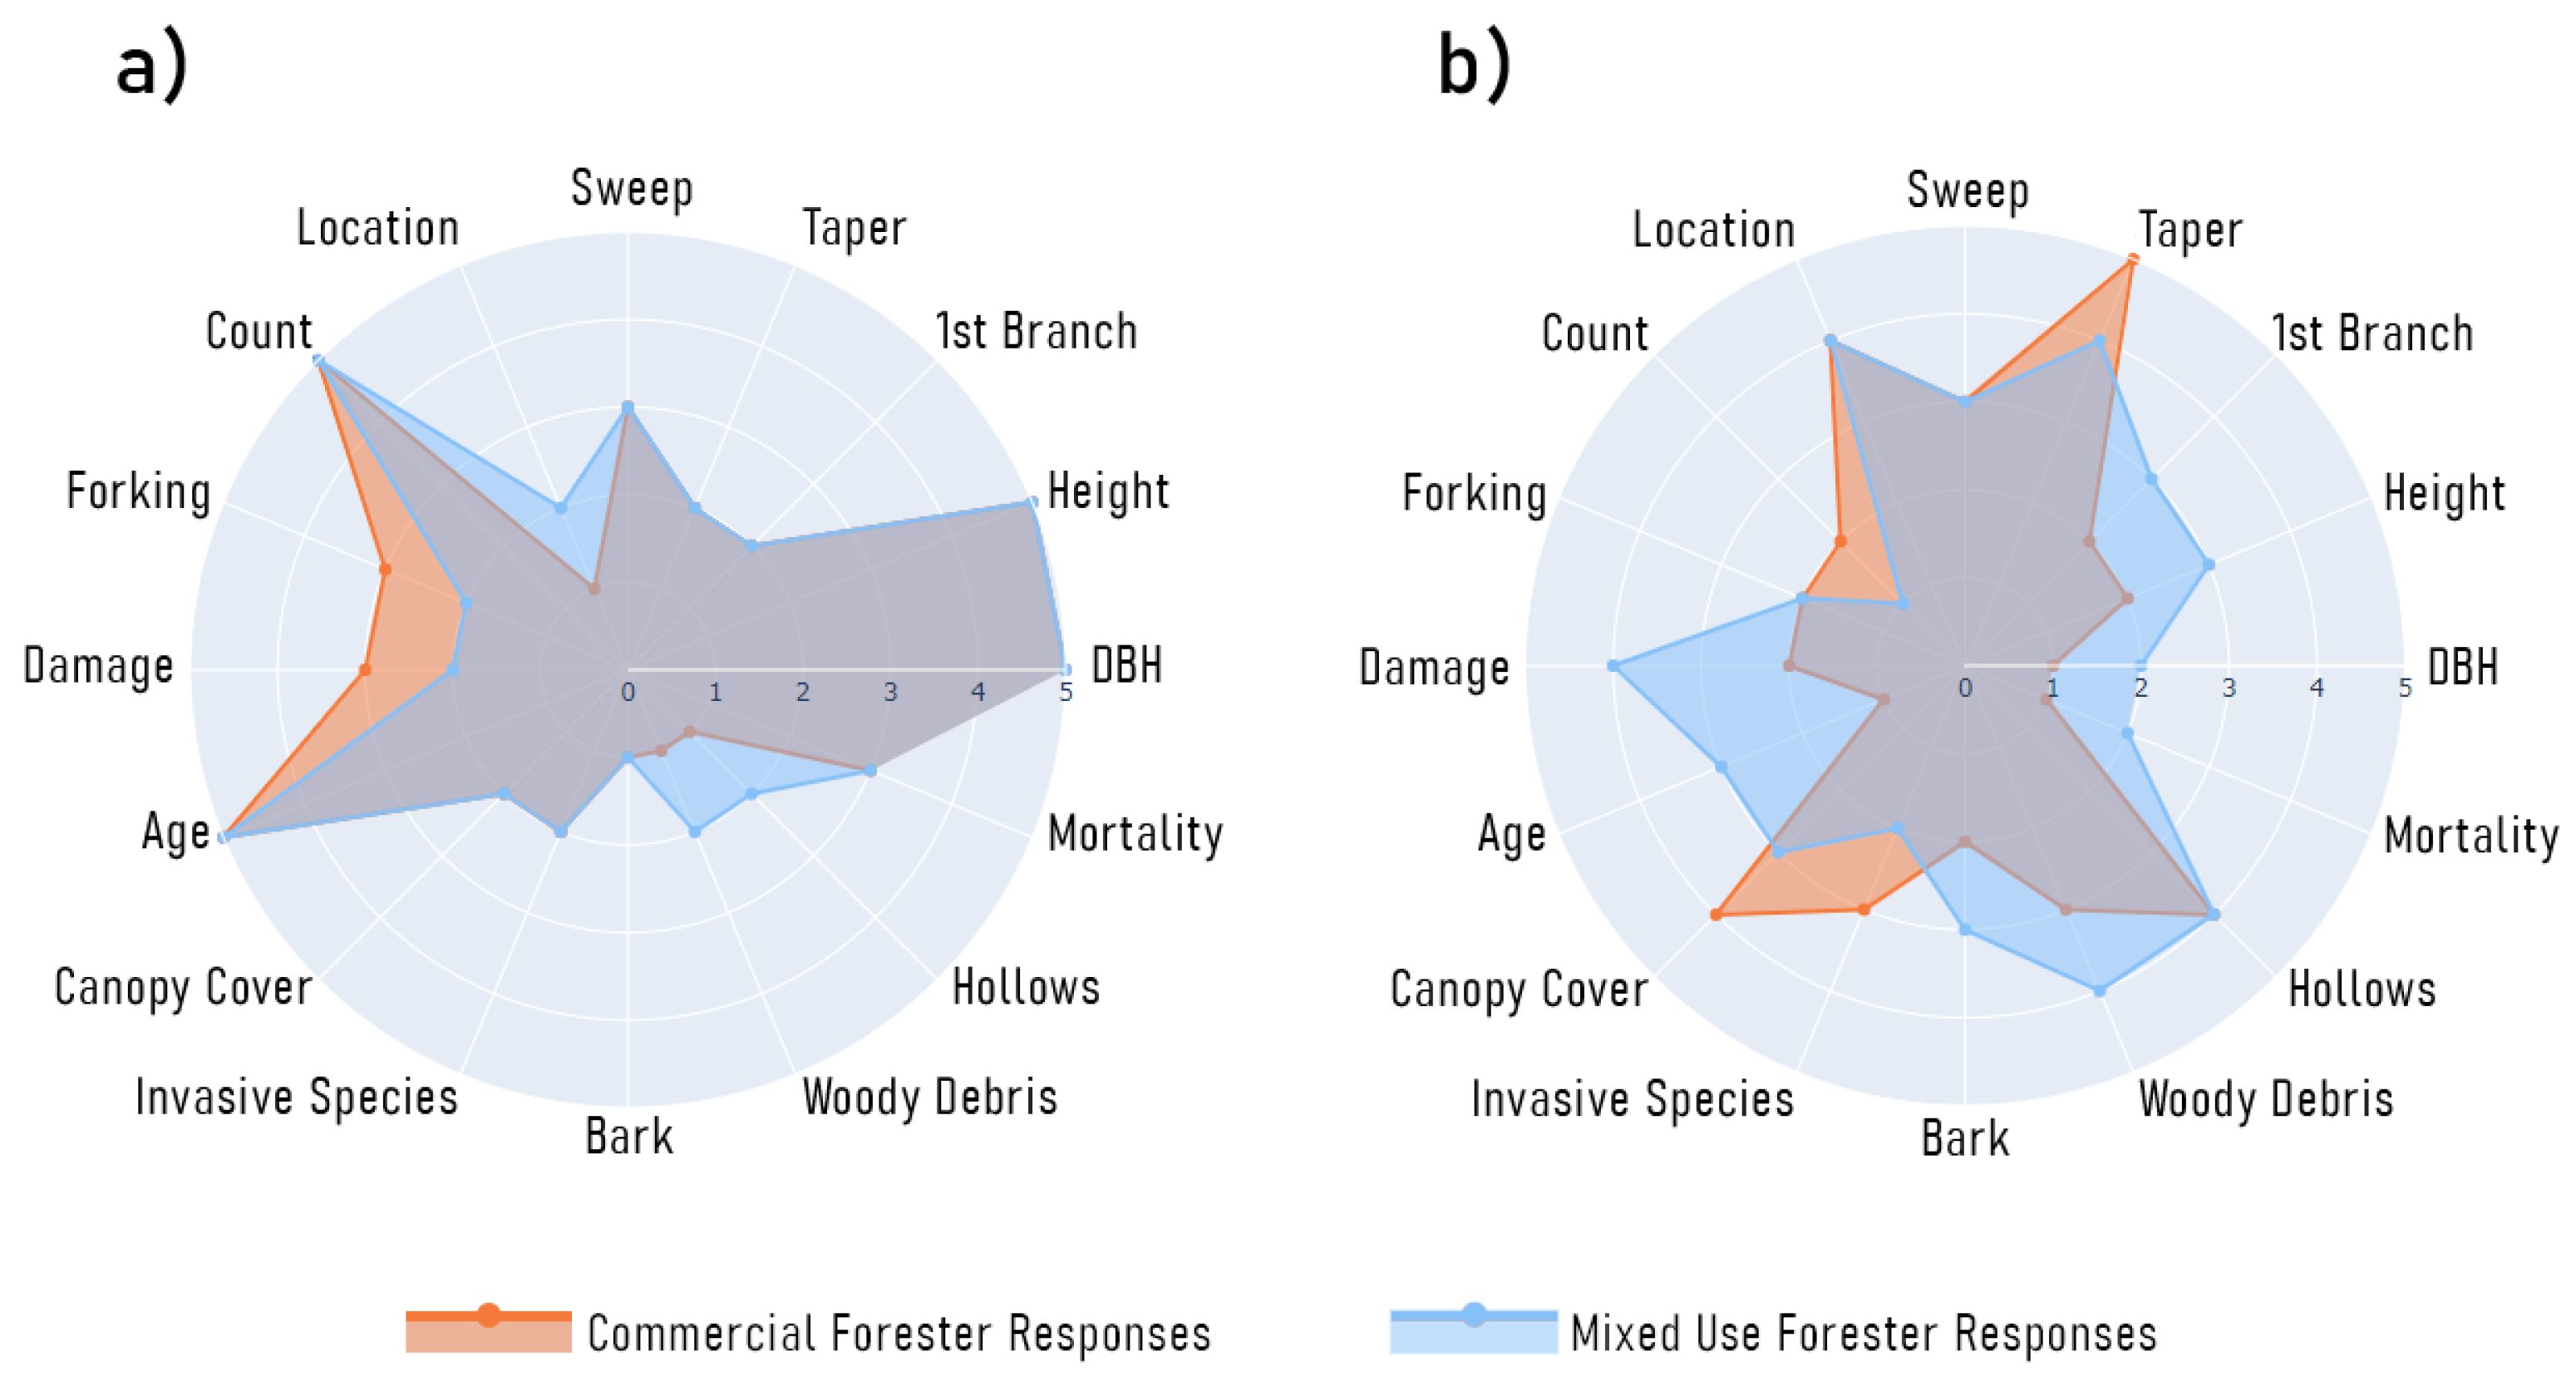
4.2. Forest Inventory Metrics Survey Results

A total of 32 forestry professionals took part in the survey. Most respondents managed forests within Australia (n = 21, 65.6%) with smaller proportions of respondents conducting their management procedures in New Zealand (n = 3, 9.4%); the United Kingdom (n = 2, 6.3%); and one respondent from each of Finland, Indonesia, South Africa, Spain and the United States. Only one respondent did not list a specific country in which they conducted their inventory measurements. Regarding the primary role of respondents in the capture or use of forest inventory metrics within their organisation, twelve (37.5%) of the respondents conducted data analysis and modelling, eight (25%) forest management and policy, six (18.8%) forestry research, and two (6.3%) identified as geographic information systems (GIS) Officers. Only four (12.5%) of the respondents identified as regularly capturing and collecting forest inventory metrics. Most respondents identified as having over 10 years of experience in their respective forestry role (n = 17, 53.1%) with the next largest group having between 1 year to 5 years of experience (n = 9, 28.1%). Only two respondents (6.3%) identified as having less than 1 year of experience in their forestry role.
Respondents were asked to state the main reasons that they collected forest inventory measurements. Based on the options provided within the survey, most respondents utilised inventory measurements solely for commercial forestry (n = 18). Specifically, 10 respondents captured inventory measurements for both commercial harvesting purposes and alternative reasons such as carbon sequestration (n = 6), conservation (n = 5), fire hazard management (n = 3), the administration of private offsets (n = 3) and watershed management (n = 1). Only four respondents did not capture inventory metrics for commercial timber purposes, instead stating multiple overlapping reasons, including conducting research (n = 2), taking general observations for management (n = 2) and carbon sequestration monitoring (n = 2).
Figure 1 depicts the ratings of different inventory metrics based on their importance, as indicated by respondents. In addition to the inventory metrics listed in the survey, some respondents also identified plot species composition (n = 2), individual tree height (n = 3), fire damage (n = 1) and tree health (n = 1) as measurements of critical importance in their inventory procedures. Figure 2 depicts the respondents’ ratings of different inventory metrics based on their associated complexity when it comes to their capture procedures and accuracy requirements. In addition to the metrics listed within the survey, respondents also identified bark thickness (n = 1), external signs that show internal health issues or decay (n = 1) and wood characteristics related to stiffness (n = 1) as metrics that were difficult to capture but which were still of critical importance to their overall forest management purposes. Finally respondents were asked to rate the acceptable percentage error associated with select inventory measurements. Mode responses suggested that DBH error should ideally not exceed 2% error and stem height or the stem taper curve should not exceed 5% error.
Based on the aforementioned responses regarding the purpose of inventory capture, the respondents were further analysed and placed into two categories, either as solely commercial management or as mixed-use forestry (including research and general management), to analyse the difference in responses regarding the importance and capture difficulty associated with different forest inventory metrics. The rationale behind separating these two groups this way is because although commercial foresters are more often concerned with the structural and volumetric measurements of individual stems, forestry technicians capturing inventory measurements for purposes such as fire hazard management or conservation in conjunction with commercial forestry may be concerned with a wider array of different inventory metrics. The mode of each group was used to characterise the rating of importance and capture the difficulties associated with each metric; Figure 3 shows the differences in ratings between the two groups. The mode response between the two respondent groups in regards to inventory metric importance was mostly the same for all measurements (Figure 3a). The exceptions to this were stem forking and damage, which were rated one category higher by commercial foresters, and stem location, coarse woody debris and stem hollow detection, which were rated one category higher by mixed-use foresters. There was greater variation in mode response between the two forester groups regarding the difficulty associated with capturing inventory metrics (Figure 3b)). Only stem forks, location and hollows were identified by both groups as metrics with the same level of complexity to capture. However, for all but two of the remaining metrics, capture difficulty fell within one rating level. Measurements of stem damage and stand age were the exception to this, with mixed-use foresters rating the difficulty of capturing these metrics two levels higher than commercial foresters.

5. Discussion

In this study, we reviewed the current utility and performance of low-cost RS technologies, as well as their corresponding methods, for the acquisition of biophysical forest measurements. Alongside this review, we surveyed forestry professionals to determine the industry requirements regarding the importance and complexity associated with forest measurements used within their management procedures, as well as how low-cost sensors may be utilised for these inventory tasks. Inherent limitations within MSS TLS, which forms the benchmark method used for RS inventory acquisition, has prompted the exploration of alternative sensor technologies such as drone LiDAR and PLS. The hardware associated with these mobile LiDAR technologies is still expensive, and inventory collection procedures have to be both accurate and acquirable at an appropriate cost for widespread implementation. Therefore, the investigation of substitute technologies has focused on emerging low-cost terrestrial techniques and technologies such as SfM CRP and RGB-D sensors.
The results of our survey indicated the respondents’ expert opinions on the metrics considered most important for forest inventory, as well as those metrics considered to be most difficult or complex to capture and/or accurately measure. Based on the survey results, stem count, age, height and DBH were rated as metrics of the highest importance to forest management. Stem curve taper, sweep (a measure of stem straightness along the z-axis), canopy area and stem location within plots were all identified as measurements that were either very difficult or difficult to capture and/or accurately measure using manual tools and approaches. No single metric fell into the high ratings of being both important and difficult to capture and/or measure. These metrics, identified as either important or difficult to capture, largely correlated with forest measurements that are currently being explored within the current literature focusing on the exploration and application of low-cost terrestrial RS technologies. The exceptions to this are measurements of stem sweep and canopy area, which were not investigated within publications identified as a part of this review, and stand age, which was already a known metric for many experimental plots and would otherwise be difficult to obtain purely with point-cloud data without the use of allometric modelling.
The most important metric identified in the survey was DBH (n = 22, 68.8%). This fits the trend identified in the literature review, where DBH was also the most commonly used measurement used to validate sensor performance when capturing structural forest attributes (n = 19, 86.4%). In some studies that used single-stem capture approaches, measurements of DBH were supplemented or replaced with PBH [39,57,58,59]. The rationale behind this choice is that stem perimeter measurements better accommodate for irregularities across the surface of the stem and thus give a better estimation of stem size. The reason diameter measurements are more commonly used within conventional inventory procedures is because these are faster to capture when using calipers, as opposed to a diameter tape, and as such this become a staple metric when quantifying forests.
Many measurements collected for forest inventories are employed because they are able to be easily captured using conventional manual tools or visual assessment procedures. The overall trend within the recent literature that focuses on the exploration and application of CRP and RGB-D technologies for biophysical measurements of forests is the assessment of sensor accuracy and the continued refinement of optimal capture procedures with these technologies. In both areas of sensor research, inventory metrics are used to determine the accuracy of RS technologies and the effectiveness of capture methodologies with measurements derived from point clouds obtained with low-cost sensors compared to those captured with manual instruments or established RS technologies, commonly TLS. Therefore, although conventional measurements are a simple way to assess the accuracy of RS technologies in forestry environments, 3D point clouds offer an abundance of information that previously could not be easily extracted because of the structural complexity of forests. Moving forward, once a sensor is known to accurately capture forest structures, the challenge now comes from the identification and extraction of new biophysical forestry information that is valid for the management of forest environments and obtainable only through point-cloud information [13]. However, this identification and capture of new metrics is likely to be first accomplished with established benchmark sensing technologies such as TLS and drone LiDAR.
The consensus from reviewed publications is that low-cost alternatives to current benchmark RS approaches can successfully characterise biophysical stem measurements that are commonly captured for forest inventory tasks and which were identified as important by survey respondents. Piermattei et al. [32] found SfM CRP, captured using a stop-and-go approach, to be comparable to MSS TLS for DBH and stem curve taper measurements at a plot scale. Furthermore, Mokroš et al. [55] suggested that iPad CW ToF RGB-D outperformed plot-scale measurements derived from PLS (GeoSLAM Horizon), as well as stereo CRP acquired with a mobile capture method. Approaches that captured individual stems, as opposed to a continuous plot-scale capture methods, were largely shown to have a greater level of accuracy and to allow for the capture of structural information at heights further up the stem. However, as single-stem approaches remain more time-consuming, research continues to investigate methods to improve its time efficiency. Akpo et al. [39] suggest that integrating a multiple-camera approach for the acquisition of SfM point clouds can potentially reduce the time needed to acquire data. Furthermore, utilising a camera rig with a known baseline may potentially help to reduce processing times as the camera relationship is known and acts as a form of scale (thus making this similar to a PS RGB-D approach). Mulverhill et al. [54] concur with this statement as, utilising two cameras at a fixed distance from one another along a baseline mounted on a mono-pod, they were able to capture stem diameter and volume estimates from individual trees within 8 min, including the setup of registration marks and the processing of point clouds. It remains the case, however, that single-stem approaches do not allow for the capture of other potentially important plot-scale measurements, such as the relative location of stems, understory vegetation or coarse woody debris. It is in this aspect that RGB-D devices, utilising SLAM reconstruction, allow for a time efficiency that is otherwise unobtainable with SfM CRP approaches when capturing and processing point-cloud information. Mokroš et al. [55] reported that for a 25 m by 25 m plot, acquisition with the Apple iPad RGB-D sensor took 15 min. A mobile stereo CRP approach within the same plot took 8 min to capture, with the resultant measurements having a lower level of accuracy. Alternatively, when using single-camera CRP with a stop-and-go approach within a slightly larger plot ( 35 m by 35 m ) Mokroš et al. [62] reported a capture time of 31 min. This does not account for the processing time associated with SfM algorithms, whereas SLAM enabled RGB-D allows for near-real-time assessments of point clouds within the field.
The success of RGB-D sensors for the acquisition of complete single-stem and plot-scale point-cloud captures that are capable of providing accurate forest measurements is tied closely to the ability of SLAM algorithms to accurately track the path of a device through a forestry plot with minimal point cloud co-alignment error. Therefore, to see the widespread adoption of RGB-D devices for forestry applications, the continued development of bespoke SLAM algorithms that are capable of performing feature identification and matching in homogeneous environments with soft edge features is paramount. Although Fan et al. [69] have begun to explore this concept with their trunk-based feature detection SLAM algorithm, more development within this space is needed.
In addition to time efficiency, RGB-D sensors provide a reliability of capture that is not guaranteed when using SfM CRP approaches. As long as the target object is within the effective range of the RGB-D sensor, depth imagery will be captured and can be reviewed or visualised immediately [42,47,55,68]. This potentially allows for visual assessments of data quality and decision-making surrounding the optimisation of capture approaches on-site. Furthermore, RGB-D sensors that are integrated into consumer devices, such as smartphones and tablets, are common technologies, meaning that they are familiar to the operator, and thus make it easy to move through a plot. Conversely, the reliability of data capture and the spatial configuration of cameras around the object of interest is still one of the major determinants for the overall success of SfM approaches and something that is still difficult to achieve. Therefore, even after images are captured, if there is insufficient image overlap, scene geometry cannot be calculated and it can be difficult to predict the overall quality of SfM point-clouds when capturing images in the field. Therefore, there is still ongoing research into improving the reliability of this capture procedure to ensure that the resultant point cloud is fit for extracting accurate inventory measurements [71]. Due to the combination of these factors, field technicians operating RGB-D devices potentially require a lower level of experience as opposed to SfM-CRP approaches. Although it is difficult to say how much experience may be needed, D’Urban Jackson et al. [72] suggest that continued future advancements within 3D RS technology, in the case of TLS and SFM-CRP, may mean that non-specialists may be able to learn how to operate such equipment within a day of operational training. However, the current level of expertise required to process point-cloud information still remains high.
As there is already a selection of low-cost RS solutions that may be used to acquire point-cloud information in forests, to promote the uptake and use of these sensors, there needs to be clear direction to forestry personnel surrounding both sensor selection and metric acquisition procedures. The current literature suggests that the overall performance of low-cost sensors for the estimation of biophysical stem characteristics highly depends on both the capture method and the overall structural complexity of the environment in which the sensor is being used, including its density and species and structural variability. Therefore, it is difficult to draw comparisons of sensor accuracy between technologies that have been tested in different environments. To accurately do so, and to assist in optimal sensor selection, an assessment framework that can determine sources of sensor error, and how to reduce or avoid them, would be beneficial. Such an assessment framework should be sensor-agnostic so as not to bias one specific low-cost technology over another and to accommodate for future low-cost solutions that may emerge. For example, small-profile and low-cost solid-state LiDAR units, like those designed for applications in autonomous navigation, are seeing integration into low-cost unmanned aerial vehicle (UAV) LiDAR methods used for forest measurement [17]. With the integration of an IMU and a data logger, these sensors might be deployed in a similar fashion to current PLS at a fraction of the cost. This assessment framework would be of particular benefit to RGB-D sensors, which are still relatively new and unexplored within this space when compared to SfM CRP approaches. Furthermore, as RGB-D devices automatically perform a large amount of post-processing during the capture process and, in most cases, this processing is optimised for a specific purpose or conditions, two sensors that may operate on a similar depth technology might produce vastly different results when capturing 3D forestry information because of different hardware components and SLAM algorithms. A framework that is agnostic of sensor principals may potentially assist forestry management personnel when it comes to selecting the optimal low-cost device for their inventory needs in specific stand conditions.

Future Research Directions for Low-Cost RS Technologies

Based on the aforementioned discussion points, we suggest that the following research directions should be investigated to assist in the operational adoption and application of low-cost RS technologies for biophysical forest measurements. Although these recommendations may theoretically be explored in any order, we present them in the following sequence as the outcomes from some investigations may benefit future research.
  • Stand-alone RGB-D sensors—those not combined into another device as a peripheral sensor—require the development of integration solutions to allow for their deployment within a forestry setting. Currently, integrated solutions, such as the Apple iPad, allow for their use by untrained personnel right out of the box and therefore are more likely to be used. However, there may potentially be more appropriate stand-alone RGB-D sensors available, providing improved capture solutions within forest environments. Through the integration of a power supply, processor and data storage, RGB-D sensors that offer greater control over data acquisition methods and access to raw depth images may be calibrated for, and deployed in, forestry environments. These integration systems could be designed to operate in a similar manner to handheld PLS, or may be designed as a low-cost wearable that can capture information while other inventory tasks are being conducted.
  • One of the main benefits of low-cost RS data acquisition approaches utilising RGB-D sensors, as opposed to CRP, is the speed of point-cloud registration and processing through the use of SLAM algorithms. Although SLAM algorithms have been designed specifically for low-cost RGB-D sensors, in addition to sensor-specific algorithms, these sensors’ tracking and co-registration processes are designed for use under optimal sensor capture conditions, commonly indoor environments. Through the design of SLAM algorithms optimised for use within forestry environments, the potential error introduced through misalignment and positional errors may be reduced. This is particularly important if fine vegetation features are to be accurately captured. Such algorithms should focus on feature detection algorithms that perform well in environments with homogeneous features, colours and textures, as well as potentially dim lighting.
  • Although different RGB-D sensors may operate using the same depth-sensing technology, due to differences in components that make up an RGB-D device–such as camera resolution, baseline distance and IMU accuracy–performance between different sensors can vary. This effect is further increased when considering the influence of SLAM algorithms when co-aligning depth frames, something that cannot be avoided when using some depth sensors integrated into other technologies that limit control over capture procedures. Lastly, when assessing the performance of a sensor to capture 3D information in a forestry environment, the structural complexity and composition of vegetation elements can add an additional layer of difficulty to the process. Therefore, there is a need for a standardised, sensor-agnostic assessment framework that can be used to determine the measurement accuracy of different low-cost technologies when capturing 3D information in different forestry environments. Such a framework would be used to aid in the selection of the optimal sensors for application in different levels of forest structural complexity.
  • Due to the limited range of active RGB-D sensors, and to an extent of terrestrial SfM CRP approaches and PS RGB-D sensors, there is the potential to design a multi-platform sensor approach for increased plot coverage utilising consumer-grade UAV SfM, while still operating at a low-cost. Access to DAP, for example, can provide access to inventory metrics not captured by terrestrial sensors, such a stem height, and provide complimentary information to capture metrics such as sweep and taper. Therefore, the question of how these low-cost approaches can be integrated needs to be investigated. Through the further implementation of aerial photography and satellite imagery, this full plot coverage may then potentially be scaled to inform decision-making over larger forest areas.
  • Continued exploration of low-cost technologies as they emerge. Systems such as stand-alone solid-state Puck LiDAR units, similar to those integrated into PLS devices, and available for USD 1000, may potentially be integrated with an IMU, power supply, data storage and CPU to provide solutions similar to integrated RGB-D devices but with a higher spatial resolution and an extended effective range.

6. Conclusions

The access to low-cost RS technologies has the potential to allow for the democratisation of fine-scale, 3D structural information of forests. SfM CRP is becoming an established method for deriving forest measurements using inexpensive hardware. The recent advancements in RGB-D sensors and SLAM algorithms has allowed for the exploration of alternative low-cost methods with benefits associated with timely data capture and processing, as well as low requirements for experienced technicians.
Although these technologies still have limitations compared to benchmark terrestrial sensors, recent literature suggests that low-cost sensors are capable of capturing forest measurements. The respondents to our survey—although representing a small snapshot of the industry—also identified the forest measurements investigated in the literature as being important to forestry professionals.
There are still hurdles, however, that need to be addressed if these technologies are to see widespread application, including the continued development and assessment of technologies as they become available. We believe that our research suggestions surrounding how low-cost devices can be assessed and deployed for plot-scale forest measurements will assist in promoting their widespread adoption. Furthermore, by pushing the boundaries of what is conventionally considered in inventory assessments due to the abundance of structural forest data available through RS technologies, we hope that the decisions surrounding overall forest management may potentially be better informed.

Author Contributions

Conceptualisation, J.M., L.W., K.R. and S.J.; investigation, J.M., L.W., K.R. and S.J.; writing—original draft preparation, J.M. writing—review and editing, L.W., K.R. and S.J.; visualisation, J.M.; supervision, L.W., K.R. and S.J. All authors have read and agreed to the published version of the manuscript.

Funding

This research received no external funding.

Institutional Review Board Statement

The study was conducted according to the guidelines of the Australian Code for the Responsible Conduct of Research and approved by the Institutional Ethics Committee of RMIT University on 7 December 2020.

Informed Consent Statement

Informed consent was obtained from all participants involved in the survey associated with the study.

Data Availability Statement

Not applicable.

Acknowledgments

The support of the Royal Melbourne Institute of Technology Australia through the Australian Postgraduate Award is acknowledged. The authors also acknowledge the contribution of respondents that took part in the survey as a part of this publication. Finally, we acknowledge Bryan Hally for his time editing and formatting this publication for submission.

Conflicts of Interest

The authors declare no conflict of interest.

Abbreviations

The following abbreviations are used in this manuscript:
3DThree-Dimensional
ALS    Airborne Laser Scanning
ASActive Stereo
CRPClose Range Photogrammetry
CWContinuous Wave
DAPDigital Airborne Photogrammetry
DBHDiameter at Breast Height
EMRElectromagnetic Radiation
FOVField of View
IMUInertial Measurement Unit
LiDARLight Detection and Ranging
MLSMobile Laser Scanning
MSSMultiple Scan Station
PBHPerimeter at Breast Height
PSPassive Stereo
PLSPersonal Laser Scanner
RGB-DColour and Depth
RMSERoot Mean Square Error
RSRemote Sensing
SfMStructure from Motion
SIFTScale Invariant Feature Transform
SLStructured Light
SLAMSimultaneous Localisation and Mapping
SURFSpeeded-Up Robust Features
TLSTerrestrial Laser Scanner
ToFTime of Flight
UAVUnmanned Aerial Vehicle
USDUnited States Dollar

References

  1. MacDicken, K.G. Global forest resources assessment 2015: What, why and how? For. Ecol. Manag. 2015, 352, 3–8. [Google Scholar] [CrossRef] [Green Version]
  2. Penman, J.; Gytarsky, M.; Hiraishi, T.; Krug, T.; Kruger, D.; Pipatti, R.; Buendia, L.; Miwa, K.; Ngara, T.; Tanabe, K.; et al. Good Practice Guidance for Land Use, Land-Use Change and Forestry; Institute for Global Environmental Strategies: Kanagawa, Japan, 2003. [Google Scholar]
  3. Keenan, R.J.; Reams, G.A.; Achard, F.; de Freitas, J.V.; Grainger, A.; Lindquist, E. Dynamics of global forest area: Results from the FAO Global Forest Resources Assessment 2015. For. Ecol. Manag. 2015, 352, 9–20. [Google Scholar] [CrossRef]
  4. Kangas, A.; Maltamo, M. Forest Inventory: Methodology and Applications; Springer Science & Business Media: Dordrecht, The Netherlands, 2006; Volume 10. [Google Scholar]
  5. McRoberts, R.E.; Tomppo, E.O. Remote sensing support for national forest inventories. Remote Sens. Environ. 2007, 110, 412–419. [Google Scholar] [CrossRef]
  6. Luoma, V.; Saarinen, N.; Wulder, M.A.; White, J.C.; Vastaranta, M.; Holopainen, M.; Hyyppä, J. Assessing precision in conventional field measurements of individual tree attributes. Forests 2017, 8, 38. [Google Scholar] [CrossRef] [Green Version]
  7. Kangas, A.; Heikkinen, E.; Maltamo, M. Accuracy of partially visually assessed stand characteristics: A case study of Finnish forest inventory by compartments. Can. J. For. Res. 2004, 34, 916–930. [Google Scholar]
  8. Iglhaut, J.; Cabo, C.; Puliti, S.; Piermattei, L.; O’Connor, J.; Rosette, J. Structure from motion photogrammetry in forestry: A review. Curr. For. Rep. 2019, 5, 155–168. [Google Scholar] [CrossRef] [Green Version]
  9. Liang, X.; Hyyppä, J.; Kaartinen, H.; Lehtomäki, M.; Pyörälä, J.; Pfeifer, N.; Holopainen, M.; Brolly, G.; Francesco, P.; Hackenberg, J.; et al. International benchmarking of terrestrial laser scanning approaches for forest inventories. ISPRS J. Photogramm. Remote Sens. 2018, 144, 137–179. [Google Scholar] [CrossRef]
  10. Fang, R.; Strimbu, B. Stem Measurements and Taper Modeling Using Photogrammetric Point Clouds. Remote Sens. 2017, 9, 716. [Google Scholar]
  11. Lee, J.H.; Ko, Y.; McPherson, E.G. The feasibility of remotely sensed data to estimate urban tree dimensions and biomass. Urban For. Urban Green. 2016, 16, 208–220. [Google Scholar] [CrossRef] [Green Version]
  12. Srinivasan, S.; Popescu, S.C.; Eriksson, M.; Sheridan, R.D.; Ku, N.W. Terrestrial laser scanning as an effective tool to retrieve tree level height, crown width, and stem diameter. Remote Sens. 2015, 7, 1877–1896. [Google Scholar] [CrossRef] [Green Version]
  13. Disney, M. How can we know what we don’t know? A Commentary on: Sampling forests with terrestrial laser scanning. Ann. Bot. 2021, 126, 685–688. [Google Scholar] [CrossRef]
  14. Disney, M.I.; Boni Vicari, M.; Burt, A.; Calders, K.; Lewis, S.L.; Raumonen, P.; Wilkes, P. Weighing trees with lasers: Advances, challenges and opportunities. Interface Focus 2018, 8, 20170048. [Google Scholar] [CrossRef] [Green Version]
  15. Saarinen, N.; Kankare, V.; Vastaranta, M.; Luoma, V.; Pyörälä, J.; Tanhuanpää, T.; Liang, X.; Kaartinen, H.; Kukko, A.; Jaakkola, A.; et al. Feasibility of Terrestrial laser scanning for collecting stem volume information from single trees. ISPRS J. Photogramm. Remote Sens. 2017, 123, 140–158. [Google Scholar] [CrossRef]
  16. Liang, X.; Kankare, V.; Yu, X.; Hyyppä, J.; Holopainen, M. Automated stem curve measurement using terrestrial laser scanning. IEEE Trans. Geosci. Remote Sens. 2014, 52, 1739–1748. [Google Scholar] [CrossRef]
  17. Hu, T.; Sun, X.; Su, Y.; Guan, H.; Sun, Q.; Kelly, M.; Guo, Q. Development and Performance Evaluation of a Very Low-Cost UAV-Lidar System for Forestry Applications. Remote Sens. 2021, 13, 77. [Google Scholar] [CrossRef]
  18. Donager, J.J.; Sánchez Meador, A.J.; Blackburn, R.C. Adjudicating Perspectives on Forest Structure: How Do Airborne, Terrestrial, and Mobile Lidar-Derived Estimates Compare? Remote Sens. 2021, 13, 2297. [Google Scholar] [CrossRef]
  19. LaRue, E.A.; Wagner, F.W.; Fei, S.; Atkins, J.W.; Fahey, R.T.; Gough, C.M.; Hardiman, B.S. Compatibility of aerial and terrestrial LiDAR for quantifying forest structural diversity. Remote Sens. 2020, 12, 1407. [Google Scholar] [CrossRef]
  20. Dainelli, R.; Toscano, P.; Di Gennaro, S.F.; Matese, A. Recent advances in unmanned aerial vehicle forest remote sensing—A systematic review. part I: A general framework. Forests 2021, 12, 327. [Google Scholar] [CrossRef]
  21. Surovỳ, P.; Kuželka, K. Acquisition of forest attributes for decision support at the forest enterprise level using remote-sensing techniques—A review. Forests 2019, 10, 273. [Google Scholar] [CrossRef] [Green Version]
  22. Liang, X.; Kukko, A.; Hyyppä, J.; Lehtomäki, M.; Pyörälä, J.; Yu, X.; Kaartinen, H.; Jaakkola, A.; Wang, Y. In-situ measurements from mobile platforms: An emerging approach to address the old challenges associated with forest inventories. ISPRS J. Photogramm. Remote Sens. 2018, 143, 97–107. [Google Scholar] [CrossRef]
  23. Gollob, C.; Ritter, T.; Nothdurft, A. Forest inventory with long range and high-speed personal laser scanning (PLS) and simultaneous localization and mapping (SLAM) technology. Remote Sens. 2020, 12, 1509. [Google Scholar] [CrossRef]
  24. Mikita, T.; Janata, P.; Surovỳ, P. Forest stand inventory based on combined aerial and terrestrial close-range photogrammetry. Forests 2016, 7, 165. [Google Scholar] [CrossRef] [Green Version]
  25. Goodbody, T.R.; Coops, N.C.; Marshall, P.L.; Tompalski, P.; Crawford, P. Unmanned aerial systems for precision forest inventory purposes: A review and case study. For. Chron. 2017, 93, 71–81. [Google Scholar] [CrossRef] [Green Version]
  26. Roman, L.A.; McPherson, E.G.; Scharenbroch, B.C.; Bartens, J. Identifying common practices and challenges for local urban tree monitoring programs across the United States. Arboric. Urban For. 2013, 39, 292–299. [Google Scholar] [CrossRef]
  27. Zollhöfer, M.; Stotko, P.; Görlitz, A.; Theobalt, C.; Nießner, M.; Klein, R.; Kolb, A. State of the Art on 3D Reconstruction with RGB-D Cameras. In Computer Graphics Forum; Wiley Online Library: Hoboken, NJ, USA, 2018; Volume 37, pp. 625–652. [Google Scholar]
  28. Nitoslawski, S.; Wong-Stevens, K.; Steenberg, J.; Witherspoon, K.; Nesbitt, L.; Konijnendijk van den Bosch, C. The digital forest: Mapping a decade of knowledge on technological applications for forest ecosystems. Earth’s Future 2021, 9, e2021EF002123. [Google Scholar] [CrossRef]
  29. Lowe, D.G. Distinctive image features from scale-invariant keypoints. Int. J. Comput. Vis. 2004, 60, 91–110. [Google Scholar] [CrossRef]
  30. Bay, H.; Ess, A.; Tuytelaars, T.; Van Gool, L. Speeded-up robust features (SURF). Comput. Vis. Image Underst. 2008, 110, 346–359. [Google Scholar] [CrossRef]
  31. Zhu, R.; Guo, Z.; Zhang, X. Forest 3D Reconstruction and Individual Tree Parameter Extraction Combining Close-Range Photo Enhancement and Feature Matching. Remote Sens. 2021, 13, 1633. [Google Scholar] [CrossRef]
  32. Piermattei, L.; Karel, W.; Wang, D.; Wieser, M.; Mokroš, M.; Surovỳ, P.; Koreň, M.; Tomaštík, J.; Pfeifer, N.; Hollaus, M. Terrestrial Structure from Motion Photogrammetry for Deriving Forest Inventory Data. Remote Sens. 2019, 11, 950. [Google Scholar] [CrossRef] [Green Version]
  33. Puliti, S.; Dash, J.P.; Watt, M.S.; Breidenbach, J.; Pearse, G.D. A comparison of UAV laser scanning, photogrammetry and airborne laser scanning for precision inventory of small-forest properties. For. Int. J. For. Res. 2020, 93, 150–162. [Google Scholar] [CrossRef]
  34. Guimarães, N.; Pádua, L.; Marques, P.; Silva, N.; Peres, E.; Sousa, J.J. Forestry remote sensing from unmanned aerial vehicles: A review focusing on the data, processing and potentialities. Remote Sens. 2020, 12, 1046. [Google Scholar] [CrossRef] [Green Version]
  35. Puliti, S.; rka, H.O.; Gobakken, T.; Næsset, E. Inventory of small forest areas using an unmanned aerial system. Remote Sens. 2015, 7, 9632–9654. [Google Scholar] [CrossRef] [Green Version]
  36. Wallace, L.; Bellman, C.; Hally, B.; Hernandez, J.; Jones, S.; Hillman, S. Assessing the ability of image based point clouds captured from a UAV to measure the terrain in the presence of canopy cover. Forests 2019, 10, 284. [Google Scholar] [CrossRef] [Green Version]
  37. Goodbody, T.R.; Coops, N.C.; White, J.C. Digital aerial photogrammetry for updating area-based forest inventories: A review of opportunities, challenges, and future directions. Curr. For. Rep. 2019, 5, 55–75. [Google Scholar] [CrossRef] [Green Version]
  38. Krisanski, S.; Taskhiri, M.S.; Turner, P. Enhancing methods for under-canopy unmanned aircraft system based photogrammetry in complex forests for tree diameter measurement. Remote Sens. 2020, 12, 1652. [Google Scholar] [CrossRef]
  39. Akpo, H.A.; Atindogbé, G.; Obiakara, M.C.; Adjinanoukon, A.B.; Gbedolo, M.; Lejeune, P.; Fonton, N.H. Image Data Acquisition for Estimating Individual Trees Metrics: Closer Is Better. Forests 2020, 11, 121. [Google Scholar]
  40. Forsman, M.; Börlin, N.; Holmgren, J. Estimation of tree stem attributes using terrestrial photogrammetry with a camera rig. Forests 2016, 7, 61. [Google Scholar] [CrossRef]
  41. Dandois, J.P.; Olano, M.; Ellis, E.C. Optimal altitude, overlap, and weather conditions for computer vision UAV estimates of forest structure. Remote Sens. 2015, 7, 13895–13920. [Google Scholar]
  42. Hyyppä, J.; Virtanen, J.P.; Jaakkola, A.; Yu, X.; Hyyppä, H.; Liang, X. Feasibility of Google Tango and Kinect for crowdsourcing forestry information. Forests 2018, 9, 6. [Google Scholar] [CrossRef] [Green Version]
  43. Tomaštík, J.; Saloň, Š.; Tunák, D.; Chudỳ, F.; Kardoš, M. Tango in forests—An initial experience of the use of the new Google technology in connection with forest inventory tasks. Comput. Electron. Agric. 2017, 141, 109–117. [Google Scholar] [CrossRef]
  44. Fan, Y.; Feng, Z.; Mannan, A.; Khan, T.U.; Shen, C.; Saeed, S. Estimating tree position, diameter at breast height, and tree height in real-time using a mobile phone with RGB-D SLAM. Remote Sens. 2018, 10, 1845. [Google Scholar] [CrossRef] [Green Version]
  45. Drouin, M.A.; Seoud, L. Consumer-Grade RGB-D Cameras. In 3D Imaging, Analysis and Applications; Springer: Berlin/Heidelberg, Germany, 2020; pp. 215–264. [Google Scholar]
  46. Tölgyessy, M.; Dekan, M.; Chovanec, L.; Hubinskỳ, P. Evaluation of the azure Kinect and its comparison to Kinect V1 and Kinect V2. Sensors 2021, 21, 413. [Google Scholar] [CrossRef]
  47. McGlade, J.; Wallace, L.; Hally, B.; White, A.; Reinke, K.; Jones, S. An early exploration of the use of the Microsoft Azure Kinect for estimation of urban tree Diameter at Breast Height. Remote Sens. Lett. 2020, 11, 963–972. [Google Scholar] [CrossRef]
  48. Zollhöfer, M. Commodity RGB-D sensors: Data acquisition. In RGB-D Image Analysis and Processing; Springer: Berlin/Heidelberg, Germany, 2019; pp. 3–13. [Google Scholar]
  49. Liu, Y.; Pears, N.; Rosin, P.L.; Huber, P. 3D Imaging, Analysis and Applications; Springer: Berlin/Heidelberg, Germany, 2020. [Google Scholar]
  50. Seitz, S.M.; Curless, B.; Diebel, J.; Scharstein, D.; Szeliski, R. A comparison and evaluation of multi-view stereo reconstruction algorithms. In Proceedings of the 2006 IEEE Computer Society Conference on Computer Vision and Pattern Recognition (CVPR’06), New York, NY, USA, 17–22 June 2006; Volume 1, pp. 519–528. [Google Scholar]
  51. Se, S.; Pears, N. Passive 3D imaging. In 3D Imaging, Analysis and Applications; Springer: Berlin/Heidelberg, Germany, 2012; pp. 35–94. [Google Scholar]
  52. Grunnet-Jepsen, A.; Sweetser, J.N.; Winer, P.; Takagi, A.; Woodfill, J. Projectors for Intel® RealSense™ Depth Cameras D4xx; Intel Support; Interl Corporation: Santa Clara, CA, USA, 2018. [Google Scholar]
  53. Kuan, Y.W.; Ee, N.O.; Wei, L.S. Comparative study of intel R200, Kinect v2, and primesense RGB-D sensors performance outdoors. IEEE Sens. J. 2019, 19, 8741–8750. [Google Scholar] [CrossRef]
  54. Mulverhill, C.; Coops, N.C.; Tompalski, P.; Bater, C.W.; Dick, A.R. The utility of terrestrial photogrammetry for assessment of tree volume and taper in boreal mixedwood forests. Ann. For. Sci. 2019, 76, 1–12. [Google Scholar] [CrossRef] [Green Version]
  55. Mokroš, M.; Mikita, T.; Singh, A.; Tomaštík, J.; Chudá, J.; Wężyk, P.; Kuželka, K.; Surovỳ, P.; Klimánek, M.; Zięba-Kulawik, K.; et al. Novel low-cost mobile mapping systems for forest inventories as terrestrial laser scanning alternatives. Int. J. Appl. Earth Obs. Geoinf. 2021, 104, 102512. [Google Scholar] [CrossRef]
  56. Bauwens, S.; Fayolle, A.; Gourlet-Fleury, S.; Ndjele, L.M.; Mengal, C.; Lejeune, P. Terrestrial photogrammetry: A non-destructive method for modelling irregularly shaped tropical tree trunks. Methods Ecol. Evol. 2017, 8, 460–471. [Google Scholar] [CrossRef]
  57. Akpo, H.A.; Atindogbé, G.; Obiakara, M.C.; Gbedolo, M.A.; Laly, F.G.; Lejeune, P.; Fonton, N.H. Accuracy of tree stem circumference estimation using close range photogrammetry: Does point-based stem disk thickness matter? Trees For. People 2020, 2, 100019. [Google Scholar] [CrossRef]
  58. Mokroš, M.; Vỳbošt’ok, J.; Grznárová, A.; Bošela, M.; Šebeň, V.; Merganič, J. Non-destructive monitoring of annual trunk increments by terrestrial structure from motion photogrammetry. PLoS ONE 2020, 15, e0230082. [Google Scholar] [CrossRef]
  59. Surovỳ, P.; Yoshimoto, A.; Panagiotidis, D. Accuracy of reconstruction of the tree stem surface using terrestrial close-range photogrammetry. Remote Sens. 2016, 8, 123. [Google Scholar] [CrossRef] [Green Version]
  60. Kozak, A. My last words on taper equations. For. Chron. 2004, 80, 507–515. [Google Scholar] [CrossRef] [Green Version]
  61. Berveglieri, A.; Tommaselli, A.M.; Liang, X.; Honkavaara, E. Vertical optical scanning with panoramic vision for tree trunk reconstruction. Sensors 2017, 17, 2791. [Google Scholar] [CrossRef] [PubMed] [Green Version]
  62. Mokroš, M.; Liang, X.; Surovỳ, P.; Valent, P.; Čerňava, J.; Chudỳ, F.; Tunák, D.; Saloň, Š.; Merganič, J. Evaluation of close-range photogrammetry image collection methods for estimating tree diameters. ISPRS Int. J.-Geo-Inf. 2018, 7, 93. [Google Scholar] [CrossRef] [Green Version]
  63. Liang, X.; Jaakkola, A.; Wang, Y.; Hyyppä, J.; Honkavaara, E.; Liu, J.; Kaartinen, H. The use of a hand-held camera for individual tree 3D mapping in forest sample plots. Remote Sens. 2014, 6, 6587–6603. [Google Scholar] [CrossRef] [Green Version]
  64. Liang, X.; Wang, Y.; Jaakkola, A.; Kukko, A.; Kaartinen, H.; Hyyppä, J.; Honkavaara, E.; Liu, J. Forest data collection using terrestrial image-based point clouds from a handheld camera compared to terrestrial and personal laser scanning. IEEE Trans. Geosci. Remote Sens. 2015, 53, 5117–5132. [Google Scholar] [CrossRef]
  65. Hunčaga, M.; Chudá, J.; Tomaštík, J.; Slámová, M.; Koreň, M.; Chudỳ, F. The Comparison of Stem Curve Accuracy Determined from Point Clouds Acquired by Different Terrestrial Remote Sensing Methods. Remote Sens. 2020, 12, 2739. [Google Scholar] [CrossRef]
  66. Bayati, H.; Najafi, A.; Vahidi, J.; Gholamali Jalali, S. 3D reconstruction of uneven-aged forest in single tree scale using digital camera and SfM-MVS technique. Scand. J. For. Res. 2021, 36, 210–220. [Google Scholar] [CrossRef]
  67. Marzulli, M.I.; Raumonen, P.; Greco, R.; Persia, M.; Tartarino, P. Estimating tree stem diameters and volume from smartphone photogrammetric point clouds. For. Int. J. For. Res. 2020, 93, 411–429. [Google Scholar] [CrossRef]
  68. Gollob, C.; Ritter, T.; Kraßnitzer, R.; Tockner, A.; Nothdurft, A. Measurement of Forest Inventory Parameters with Apple iPad Pro and Integrated LiDAR Technology. Remote Sens. 2021, 13, 3129. [Google Scholar] [CrossRef]
  69. Fan, Y.; Feng, Z.; Shen, C.; Khan, T.U.; Mannan, A.; Gao, X.; Chen, P.; Saeed, S. A trunk-based SLAM backend for smartphones with online SLAM in large-scale forest inventories. ISPRS J. Photogramm. Remote Sens. 2020, 162, 41–49. [Google Scholar] [CrossRef]
  70. Mokroš, M.; Vỳbošt’ok, J.; Tomaštík, J.; Grznárová, A.; Valent, P.; Slavík, M.; Merganič, J. High precision individual tree diameter and perimeter estimation from close-range photogrammetry. Forests 2018, 9, 696. [Google Scholar] [CrossRef] [Green Version]
  71. Kuželka, K.; Surovỳ, P. Mathematically optimized trajectory for terrestrial close-range photogrammetric 3D reconstruction of forest stands. ISPRS J. Photogramm. Remote Sens. 2021, 178, 259–281. [Google Scholar] [CrossRef]
  72. D’Urban Jackson, T.; Williams, G.J.; Walker-Springett, G.; Davies, A.J. Three-dimensional digital mapping of ecosystems: A new era in spatial ecology. Proc. R. Soc. B 2020, 287, 20192383. [Google Scholar] [CrossRef] [PubMed] [Green Version]
Figure 1. Forestry professionals who took part in the associated survey rated the importance associated with different forestry inventory measurements. The classifications associated with each of these metrics were either ’Critical’, ’Very Important’, ’Important’, ’Optional’ or ’Unimportant’. Not all respondents assigned an importance rating to each metric.
Forests 13 00204 g001
Figure 2. Forestry professionals who took part in the associated survey rated the difficulty associated with the capture of different forestry inventory measurements. The metrics are ordered along the y-axis based on their rated importance (Figure 1) as identified by survey respondents. The classifications associated with each of these metrics were either ’Very Difficult’, ’Difficult’, ’Neither Difficult or Easy’, ’Easy’ or ’Very Easy’. Not all respondents assigned a difficulty rating to each metric.
Forests 13 00204 g002
Figure 3. Difference in mode responses regarding the importance (a) and difficulty (b) associated with the capture for forest inventory metrics between the two identified respondent groups; commercial timber forestry professionals (n = 18) and mixed-use forestry professionals (n = 14).
Forests 13 00204 g003
Table 1. Summary table of low-cost 3D remote sensing (RS) technologies, structure from motion (SfM) and colour and depth (RGB-D), presented in Section 2. Low-cost sensor technologies denoted with an * operate using a passive sensing approach, whereas technologies denoted with ** use an active projection approach. Examples of devices that use each technology are provided.
Low-Cost Sensor TechnologyBenefitsLimitationsExample Devices
SfM Photogrammetry *Capture on digital cameras and mobile phonesComputationally intensive post-processing requiredAny suitable digital camera
Established capture and processing methodologiesRequires dense image sampling
Requires sufficient ambient light to illuminate environment being captured
Potentially inconsistent outcomes
white Time-of-Flight RGB-D **Small sensor profile and component baseline distancesShort effective range (<6 m) that can be reduced by ambient electromagnetic radiation (EMR)Apple iPad (2020)
Near-real-time scene reconstruction and visualisation with simultanious localisation and mapping (SLAM)Prone to increased sensor noise caused by ambient EMRApple iPhone 13 Pro
Integrated into mobile phones, tables and augmented reality headsetsProne to SLAM misalignment errorMicrosoft Azure Kinect
Microsoft Hololens 2
Google Tango
Passive Stereo RGB-D *Low power consumptionDepth sensing requires baseline distance between sensorsStereolabs Zed 2
Near-real-time scene reconstruction and visualisationRequires sufficient ambient light to illuminate environment being captured
Prone to SLAM misalignment error
Active Stereo RGB-D **No priori knowledge of projected EMR patternShort effective range (<3 m)Intel RealSense D445
Near-real-time scene reconstruction and visualisationAmbient EMR can reduce sensor range
Prone to SLAM misalignment error
Structured Light RGB-D **Near real-time scene reconstruction and visualisationReliant on deformation in known projected pattern of pointsMicrosoft Kinect V1
Ambient EMR can result in missing point-cloud information
Prone to SLAM misalignment error
Superseded by Active Stereo RGB-D
Publisher’s Note: MDPI stays neutral with regard to jurisdictional claims in published maps and institutional affiliations.

