Article

Maxent Modeling for Identifying the Nature Reserve of Cistanche deserticola Ma under Effects of the Host (Haloxylon Bunge) Forest and Climate Changes in Xinjiang, China

1
National Engineering Technology Research Center for Desert-Oasis Ecological Construction, Xinjiang Institute of Ecology and Geography, Chinese Academy of Sciences, Urumqi 830011, China
2
University of Chinese Academy of Sciences, Beijing 100049, China
3
State Key Laboratory of Desert and Oasis Ecology, Xinjiang Institute of Ecology and Geography, Chinese Academy of Sciences, Urumqi 830011, China
4
Taklimakan Desert Research Station, Xinjiang Institute of Ecology and Geography, Chinese Academy of Sciences, Korla 841000, China
*
Author to whom correspondence should be addressed.
Forests 2022, 13(2), 189; https://doi.org/10.3390/f13020189
Submission received: 21 November 2021 / Revised: 23 January 2022 / Accepted: 24 January 2022 / Published: 26 January 2022
(This article belongs to the Special Issue Simulation Models of the Dynamics of Forest Ecosystems)

Abstract

:
Cistanche deserticola Ma is a traditional Chinese medicinal plant exclusively parasitizing on the roots of Haloxylon ammodendron (C. A. Mey.) Bunge and H. Persicum Bunge ex Boiss and the primary cultivated crop of the desert economy. Its wild resources became scarce due to over-exploitation and poaching for economic benefits. To protect the biological diversity of the desert Haloxylon–Cistanche community forest, the optimal combination of desert ecology and economy industry, and their future survival, this paper examines the conservation areas of wild C. deserticola from the perspective of hosts’ effects and climate changes. To identify conservation areas, the potential distributions generated by MaxEnt in two strategies (AH: abiotic and hosts factors; HO: hosts factors only) compare the model’s performance, the niche range overlap, and the changing trend in climate changes. The results show the following: (1) The HO strategy is more suitable for prediction and identifying the core conservation areas in hosts and climate changes (indirectly affected by host distributions) for C. deserticola. (2) The low-suitable habitat and the medium-suitable habitat are both sensitive to the climate changes; the reduction reaches 48.2% (SSP585, 2081–2100) and 26.6%(SSP370, 2081–2100), respectively. The highly suitable habitat is always in growth, with growth reaching 27.3% (SSP585, 2081–2100). (3) Core conservation areas and agriculture and education areas are 317,315.118 km2 and 319,489.874 km2, respectively. This study developed a predictive model for Maxent under climate change scenarios by limiting host and abiotic factors and inverted the natural habitat of C. deserticola to provide scientific zoning for biodiversity conservation in desert Haloxylon–Cistanche community forests systems, providing an effective reference for decision makers.

1. Introduction

The desert ecology and economy industry (DEEI), in the context of China’s Belt and Road Initiative and targeted poverty reduction policy, is receiving more and more attention [1,2,3]. The Xinjiang Uyghur Autonomous Region, located in north-western China, is becoming the largest potential gainer because of its unique locational and climatic advantages, including China’s largest and second-largest deserts, the Taklimakan desert and the Gurbantunggut desert, respectively [4,5,6]. However, the trickiest challenge of DEEI is also from itself and the stress of ecology and economy [7,8]. Precipitation occurring much less frequently than evaporation, water shortage, soil desertification, and poor economic development are hard-to-reach peaks facing the local people and government [9,10,11].
Actually, the optimal solution comes from the natural ecosystem: the Haloxylon–Cistanche Community Forest (HCCF) comes into view.
The fundamental component of HCCF is Cistanche deserticola MA. C. deserticola, the precious Chinese traditional medicinal herb and the holoparasitic plant exclusively parasitizing the roots of Haloxylon spp., is listed as a Grade II wild plant in China [12,13]. In Chinese, C. deserticola, named “Rou Cong Rong”, is always easily confused with C. mongolica Beck and C. salsa (C. A. Mey) G. Beck. What to look out for is that the Chinese term “Rou Cong Rong” always refers to C. deserticola, which has been used as a medicinal herb in traditional Chinese medicine since ancient times [14,15,16]. It was first recorded in Shen Nong’s Chinese Materia Medica, published thousands of years ago [14,17]. For these reasons, the researchers always focus on the physicochemical and pharmacological studies of C. deserticola [14,18] and wild resource study is ignored. This is the same case in Haloxylon ammodendron (C. A. Mey.) Bunge and H. persicum Bunge ex Boiss. They are also the same essential components of HCCF because of their unique physiological and morphological properties and their ability to adapt to desert ecosystems [19]. Some research spotlighted ecologic applications instead of their wild resources because of their adaptive capacities in high-saline environments in arid zones [20,21,22,23].
Recently, some researchers have considered HCCF’s wild resource protection, especially C. deserticola. These studies use the species distribution models (SDM), particularly the maximum entropy (MaxEnt) algorithm, in wild resource studies such as identifying species distribution prediction and conservation areas [24,25,26]. The MaxEnt is used to delineate plant habitats and protected areas because it requires few sample points but has a high degree of distribution accuracy [25,27,28,29,30].
However, C. deserticola in these researches were often treated as a non-parasitic plant, and their distribution was only investigated in terms of climate and soil, and the influence of host factors was often deliberately ignored [31,32,33]. For C. deserticola as a holoparasitic plant, the host factors are most important, especially in SDM [34,35,36]. Additionally, the scarcity of wild resources is not only due to the over-exploitation and poaching in pursuit of economic benefits, but also to the over-harvesting of the decline in the wild resources of its hosts, H. ammodendron and H. persicum [33,37,38]. In particular, the wild resources of H. ammodendron, which are more widely distributed and have a better rate of wild parasitism of C. deserticola, have declined sharply [19]. H. ammodendron is often called “Suo Chai” in China and is used as firewood by local herdsmen.
To protect C. deserticola wild resources after economic development, we need to consider, in particular, the impact of the parasitic plant hosts on them; how C. deserticola wild resources will develop in the future under the influence of global climate change, and how to combine the protection of C. deserticola wild resources with the development of the local economy, to make better use of the wild resources and to develop them rationally, these are the main issues we need to address in the whole process of the delimitation and identification of conservation areas. The study will illuminate the contradictions and contrasts between the artificial cultivation industry and the conservation of wild resources, as well as how to leverage the conservation of wild resources of C. deserticola to ensure the local economy’s sustainable development.

2. Materials and Methods

2.1. Study Area

Our study focused on the Xinjiang Uygur Autonomous Region, which is located between 73°20′41′′ E to 96°25′ E longitude and 34°15′ N to 49°10′45′′ N latitude in north-western China with a total area of 1,664,900 km2 (Figure 1). Moreover, the area is approximately one-sixth of the size of China. Additionally, the annual total sunshine duration and total solar radiation range are the highest in China [39]. Moreover, in Xinjiang, the average annual precipitation is only 147 mm; however, the average annual evaporation reaches an astonishing 1512 mm [40,41]. This arid climate poses a significant challenge to the growth of plants and the development of the economy.

2.2. Occurrence Data

To compile comprehensive data on the occurrences of all C. deserticola and their host, Haloxylon spp., we used a combination of field survey data (collected under current conditions) and data from herbaria historically collected with precise coordinates, such as those from the Chinese Virtual Herbarium (www.cvh.ac.cn, last accessed on 20 November 2021) and the Global Biodiversity Information Facility (www.gbif.org, last accessed on 20 November 2021), totaling 209 occurrences of the three species.
Why were historical data combined with data from current expeditions? The primary reason for this is that current wild resources do not adequately cover the range of C. deserticola and their hosts over the last 50–100 years. When discussing the conservation of C. deserticola wild resources, we must include areas where the natural environment is suitable, but the wild resources have been drastically reduced due to human activity [42]. In other words, it is inaccurate to consider only the loci that exist in the current situation of severed wild resource availability. Therefore, it is critical and necessary to collect data on extinct species to determine which areas are suitable for their growth without regard for the effects of human activity.

2.3. Environmental Data

We used the WorldClim 2.1 database (www.worldclim.org, last accessed on 20 November 2021) with a spatial resolution of 2.5 arcminutes for both historical and future climate data (including 19 bioclimatic variables in each scenario). Additionally, we used the mean of the BCC-CSM2-MR, CanESM5, CNRM-CM6-1, and MIROC6 future climate simulations to avoid some climate uncertainty from a single climate model. Elevation data were retrieved from the same website, the WorldClim version 2.1 database, for both current and future climatic environments. Additionally, considering the topographical and soil variables in the role of shaping plant species distributions, we downloaded the related data, including aspect, slope, soil water content (at 100 cm and 200 cm depth), soil sand content (at 100 cm and 200 cm depth), soil organic carbon content (at 100 cm and 200 cm depth), and soil texture class (at 100 cm and 200 cm depth) from NASA and OpenLandMap and processed by Google Earth Engine. Additionally, these topographical and soil variables were considered unchanging factors in future scenarios. We primarily used the functions in the “raster” and “rasterVis” packages to process these environmental data files in R [43,44].

2.4. Distribution Modeling

Before the variables selection, we used the ENMTools to clean and screen the occurrence data of each species, which aims to match data accuracy between the resolution of occurrence and that of environmental factors [45,46].
The selection of variables was driven by species data, the majority of which came from the VarSel function in the package “SDMtune” in R [47], using 10,000 randomly selected points throughout the study area, as well as environmental data on the locations of these points. Additionally, we used Spearman’s coefficient analysis to eliminate environmental variables with a Spearman’s coefficient greater than 0.7 and graded the remaining environmental variables according to model importance, once again eliminating the less important environmental variables (the correlation matrix in Appendix A). The remaining environmental variables (Table 1) were ranked according to their model importance. The less-important environmental variables were also eliminated, allowing the variables we chose to closely fit the model and the actual data.
For the selection of the species distribution model algorithms, we used the Maxent algorithm [48]. It employs machine-learning techniques to simulate species’ overall distribution based on their presence, environmental data, and some background points, which is particularly useful when there are few data on species distribution. Still, it has high predictive reliability, making this method widely used to study species distribution and the delineation of protected areas [49,50,51,52]. However, the Maxent algorithm cannot be used exactly according to the default parameter settings, which have been shown to over-fit the data in many studies [28]. Thus, to solve such problems, we mainly use some functions in the package “kuenm” in R [53]. By supplying information about species distribution and environmental data, this program can examine parameter selection based on (1) statistical significance, (2) predictive power, and (3) model complexity to increase the model’s dependability and performance. This function is accomplished by developing a large number of candidate models and picking the one that is most appropriate [26,53].
After developing the method of distribution prediction and the ideal choice of parameters, it is extremely difficult to consider the host factors in the distribution model of C. deserticola. To solve this problem, we proceeded with the following steps (based on the current climate and using the same way for the future climate): (1) generating the host models and distribution maps by their abiotic variables, respectively; (2) generating the parasitic models by the abiotic variables and the host distribution maps (as biotic variables).
Based on the experience of previous studies, we tried to utilize two strategies to compare (1) the influence of the abiotic factors and the host factors on C. deserticola (AH), (2) the effect of hosts only on C. deserticola (HO). The distinction between the two strategies is that AH considers the host factor as several variables affecting C. deserticola distribution prediction. In contrast, HO views the host factor as the only variable affecting C. deserticola distribution prediction. In comparison, the HO method appears to be more consistent with the natural growth and developmental patterns of C. deserticola, which, as an utterly parasitic plant, obtains all its nutrients from its host. Thus, regardless of the discrepancies between the two methodologies, the primary point of convergence is that they both considered the host component, contrary to earlier distribution studies of C. deserticola, which ignored the host factor [27].
To better build and assess species distribution models, we utilized the data split function in package “kuenm” to split the occurrence data of each species into training data (75%) and test data (25%) to better evaluate the final model. We employed the AUC (area under the curve) statistic to evaluate the model, which is widely used and recognized by most researchers [54]. Moreover, the effect of different models is graded according to the value of AUC; model performance was classified as excellent (1–0.9), good (0.9–0.8), fair (0.8–0.7), poor (0.7–0.6), failing (0.6–0.5), and the AUC values closer to 1 indicated the better the performance of the model [55]. All current models’ AUC values are greater than 0.9 for distribution prediction, which is within the confidence interval for climate forecast (0.75–0.95) and accurate yield predictions [56].
We also employed the “Measuring Range Overlap” function of the “ENMTools”, which allows for the simultaneous evaluation of all sorts of distributions to better portray the AH and HO methods and reflect the distribution of hosts. This function is based on a widely used age-range correlation study [57]. The overlap has also been used in numerous studies on ecological niches to assess the geographical characteristics, competition, and interactions between the distributions of different species, where the threshold value used in the application of the overlap function is critical for the impact of the assessment results; thus, when judging the threshold value, we used the response curves generated alongside the distribution model (primarily, the threshold value is determined by assessing the abnormality of the response curves, mainly of the two host plants) that accompany the distribution model and are thus employed as a proxy for evaluation [57,58,59,60,61,62].

2.5. Assessing the Conservation Areas

We have primarily used two principles in the delineation and identification of conservation areas: (1) the classification of the fitness class of the distribution of C. deserticola wild resources under current environmental conditions; (2) the change in habitat class of areas under future climate change conditions.
Habitat levels are classified using the Jenks natural breaks classification method, which looks for natural patterns in the data rather than artificial and rigid grouping [63]. Jenks natural breaks classification classifies habitats into four categories: (1) inappropriate habitat (IH); (2) low-suitable habitat (LSH); (3) medium-suitable habitat (MSH); (4) highly suitable habitat (HSH). To ensure that the future classification of habitat classes is consistent with the current distribution and allows for comparison, we applied the current grouping strategy of each model to the future distribution model so that the groupings were consistent and the grouping error was low, to minimize the climate change uncertainty.
Using the current habitat as a criterion, habitat changes are classified into three broad categories based on the difference between the habitat in various climatic conditions and the current habitat: (1) areas that have remained constant in habitat class over time; (2) areas that have decreased in habitat class over time; and (3) areas that have increased in habitat class over time.
Based on current habitat classes, a statistical approach was used to determine trends in the rate of change in area for various habitat classes under various climatic scenarios. By utilizing trends rather than simply increasing or decreasing areas to classify conservation areas, natural patterns of habitat change can be better understood to benefit human activities.

3. Results

3.1. Current Distribution

3.1.1. Abiotic and Host Factors

Under the effects of hosts and current climate factors (Table 1; Figure 2), the total area of HSH is 89,098.579 km2. It mainly occurs in northern Xinjiang, the central and southern Gurbentunggut desert, the central region of Irtysh River, and the northern foothills of the Tian Shan Mountains. The MSH is a total of 133,722.574 km2, and is concentrated in the periphery of HSH, such as the upstream of Irtysh River, northern Gurbentunggut desert, and northern foothills of Karakoram Range. Additionally, the LSH is 208,660.229 km2, and it is mainly in the southern foothills of the Tian Shan Mountains.

3.1.2. Host Factors Only

In the effect of host factors only (Table 1; Figure 3), the HSH concentrated in the Gurbentunggut desert is a total of 319,489.874 km2, and from the periphery of the Gurbentunggut desert to the southern foothills of the Altai Mountains and the upstream of Tarim River with the main oasis in Southern Xinjiang, the MSH is about 230,856.128 km2; the LSH is 86,458.990 km2 and is predominant in the south-western Taklimakan desert and the periphery of the Tian Shan Mountains.

3.2. Future Distribution

In all the climatic scenarios (Figure 4), the distributions of C. deserticola (with two strategies) do not make a huge difference. The HSH is slowly expanding, and the expansion of LSH comes with the same trend in AH. Additionally, the habitat in HO illustrates that the MSH is expanding south.
Moreover, we have conducted a statistical analysis of how the area of each habitat changes in response to future climate change impacts (Figure 5). The HSH area tends to increase under either strategy. In the HO strategy, the area of HSH has consistently increased in response to all climatic scenarios: the maximum growth ratio (MGR) in SSP126 is 13.9% (2081–2100); in SSP245, the maximum growth ratio is 19.4% (2081–2100); the maximum growth ratio reaches 23.1% (2081–2100) in SSP370; and 27.3% (2081–2100) is the maximum growth ratio in SSP585. The extension of HSH mainly comes from the level-up of MSH and LSH. Thus, the changes of MSH and LSH should be considered.
In SSP126, the LSH shows a tendency to increase firstly and then decrease suddenly, with a slow increase afterward. The MGR reaches 24.2% in 2021–2040, and the maximum reduction ratio (MRR) is 5.9%. The MSH shows a decreasing trend, with the MRR reaching 7.7% in 2041–2060. In SSP245, LSH decreases over time, and the MRR is 33.1% in 2081–2100; the MSH shows the same trend with an MRR at 17.6% in 2081–2100; in SSP370 and SSP585, the trends of LSH and MSH are the same as in SSP245. The MRR of LSH in SSP370 is 43.6% in 2081–2100, and in SSP585 2081–2100, the MRR is 48.2%. The MRR of MSH in SSP370 reaches 26.6% in 2081–2100, and in SSP585, it reaches 23.3% in 2081–2100.

3.3. The Result of Evaluation and Conservation Identifying

The results of the AUC assessment show that all models assessed as excellent (Table 2).
In order to better evaluate the differences between the models from multiple perspectives in an integrated manner, we therefore analyzed the response curves (Figure 6) as well as the Niche range overlay (Table 3).
We compared the distribution of the parasitic plants with the distribution of the host plants to demonstrate the influence of host plant factors on the predicted results (Figure 7). We found the HO strategy takes into account the effects of host distribution more comprehensively.
We have taken into account the actual distribution of the host plant on the basis of the AUC values and the HO strategy adequately reflects the impact of host distribution. We therefore used the HO strategy as a basis for delineating the C. deserticola nature reserve and based the delineation of the reserve and functional areas on changes in habitat area under future climate (Figure 8). The AH/HO means the strategy of abiotic and host factors or host factors only.

4. Discussion

4.1. The Better Model

Numerous researchers have attempted to predict the distribution of parasitic plants by incorporating host factors [63,64]. However, these studies have primarily focused on semi-parasitic plants or animals associated with specific food sources, and they have primarily considered the AH strategy [33,36,64]. Few distribution predictions for holoparasitic plants explicitly consider host factors as the sole qualifier, such as the HO strategy.
In terms of model evaluation, the models of C. deserticola under both strategies all achieved an AUC greater than 0.9 (Table 2), which is considered excellent [55]. Additionally, the AUC for the AH strategy was slightly higher than for the HO strategy. Contrary to the AH strategy, C. deserticola is found in the southern part of Xinjiang in the actual survey. This investigation is more consistent with the HO strategy.
In the Maxent, the presence of data inputs and the selection of variables can have a significant effect on the final model’s prediction results [65]. Additionally, some studies on the importance of MaxEnt algorithm variables have discovered that when all of the given environmental factors (biotic and abiotic) are included in the model, the importance of each environmental factor is underestimated [66,67]. In other words, the MaxEnt algorithm can illustrate the effects of all variables we provided [68]. Especially when we removed the less-important variables in pre-processing. Thus (Table 1), in the AH strategy, the effects of host factors would not have the same importance as that in the HO strategy. However, for the holoparasitic plant, all of its nutrient sources are obtained from the hosts [69,70]. As a result, the hosts’ distributions deserve to be elevated in importance as a proxy for biological conditions. As a result (Figure 6), we examined the host distribution’s response curves under both strategy models to identify differences between them.
By comparing the response curves for the major host plant, H. ammondendron, we can see that when the response curve of 0.65 is used as the threshold, the two curves do not indicate the same range of thresholds, and the trends between the two strategies are different. To further compare the two strategic models’ responses to host distributions, the effect of hosts distributions on the niche range overlap was quantified. The specific point of difference in the response curve of H. ammondendron, 0.65, was used as the analysis threshold value. As shown in the table (Table 3), the HO strategy is better than the AH strategy for hosts’ responses. This means that the HO strategy can better respond to the effect of the two host distributions on the distribution of parasitic plants at a threshold of 0.65.
The final predicted distribution map shows that AH is more concentrated in northern Xinjiang, while HO is distributed throughout the province (Figure 7). According to relevant studies on variable importance, it is hypothesized that the importance of host factors in AH is comparable to that of other abiotic factors and does not take precedence, i.e., the role of hosts is diminished in the AH strategy [66,71]. In HO, the effect of the hosts can be more clearly demonstrated because no other abiotic factors are present and only the host factors are used as variables.
Thus, when the actual response of the hosts’ factors is compared in the holoparasitic distribution study to both AH and HO strategies, the HO strategy is more responsive to the role of host distributions and more relevant to the actual distribution of C. deserticola. Although we still have a long way to go in terms of model assessment accuracy. As a result, in future research, we will employ additional statistical tools, particularly those frequently used in species distribution models, to verify the accuracy of the strategies we have developed [72,73,74]. For instance, increasing the number of model evaluation metrics such as Kappa, Boyce, AUC-PR, and others, and increasing the number of prediction algorithms such as random forests, etc. [75,76,77,78]. These are all areas in which our future research will need to improve over time.

4.2. The Conservation Areas of C. deserticola

Because Highly suitable habitat in most previous designations of protected areas for plant resources have decreased due to climate change, it is possible to designate protected areas based on currently suitable areas [79]. However, our study discovered that the variation in the area was not identical for the various habitat classes, even though they were all located in the same climatic scenario (Figure 5). We have found that HSH has maintained a growth trend in all of the HO strategies (the maximum growth ratio is 27.3% in SSP585 2081-2100). This means that the HSH has consistently increased its habitat area compared to its current area during climate change. And such a pattern also presents itself in comparison to the AH strategy. This trend seems to be revealed in this study and be explained by future temperature and climate change characteristics in the Xinjiang region. For desert plants, the abundance of water resources during the peak growth period is directly related to growth conditions [80]. All SSP scenarios precipitation has increased to varying degrees compared to the present [81]. The HSH area, responds best to C. deserticola and is most suitable for its survival, so an increase in precipitation will undoubtedly increase the area of the HSH.
However, when we shifted our focus to LSH and MSH, we found that the effect of precipitation did not seem to explain well the reduction in low and medium suitable habitat (the maximum reduction ratio of LSH is 48.2% in SSP585 2081-2100 and that of MSH is 26.6% in SSP370 2081-2100). We then similarly began to focus on the effects of temperature. In our survey of the cultivated industry, we found that moisture was important for the growth of C. deserticola. And when the temperature rises, the plant’s demand for water increases [82]. This effect is much greater for MSH and LSH than for HSH.
Of course, as there are few studies on the physiology of C. deserticola, we can only make a few possible guesses. In the MSH and LSH regions, where soil, topographic and climatic conditions are not optimal, changes in temperature, precipitation and other climatic changes do not cause its growth to develop in a favourable direction. This has led to a trend towards a reduction in its current suitable area. The MSH and LSH, which are more sensitive to the environment, should then be the main conservation areas for the future changes in the climate of each habitat.
Thus, when identifying the conservation areas, the climate-sensitive zones should be given primary consideration (LSH and MSH). Given that the sensitivity of LSH and MSH is broadly similar in scenarios, the conservation areas in different scenarios can maintain essentially similar results. Therefore, the combination of LSH and MSH is identified as the core conservation in all scenarios because of its sensitivity.

5. Conclusions

Our study focuses on the influence of host factors on the distribution of parasitic plants under different strategies (AH and HO). The following conclusions can be drawn from our study:
  • By incorporating model predictions and actual parasitic conditions, the spatial distribution of C. deserticola with the HO strategy is more realistic and accurate than AH. The HO strategy outperformed the AH strategy in terms of the effect on host distribution. It can better reflect the actual parasitic situation.
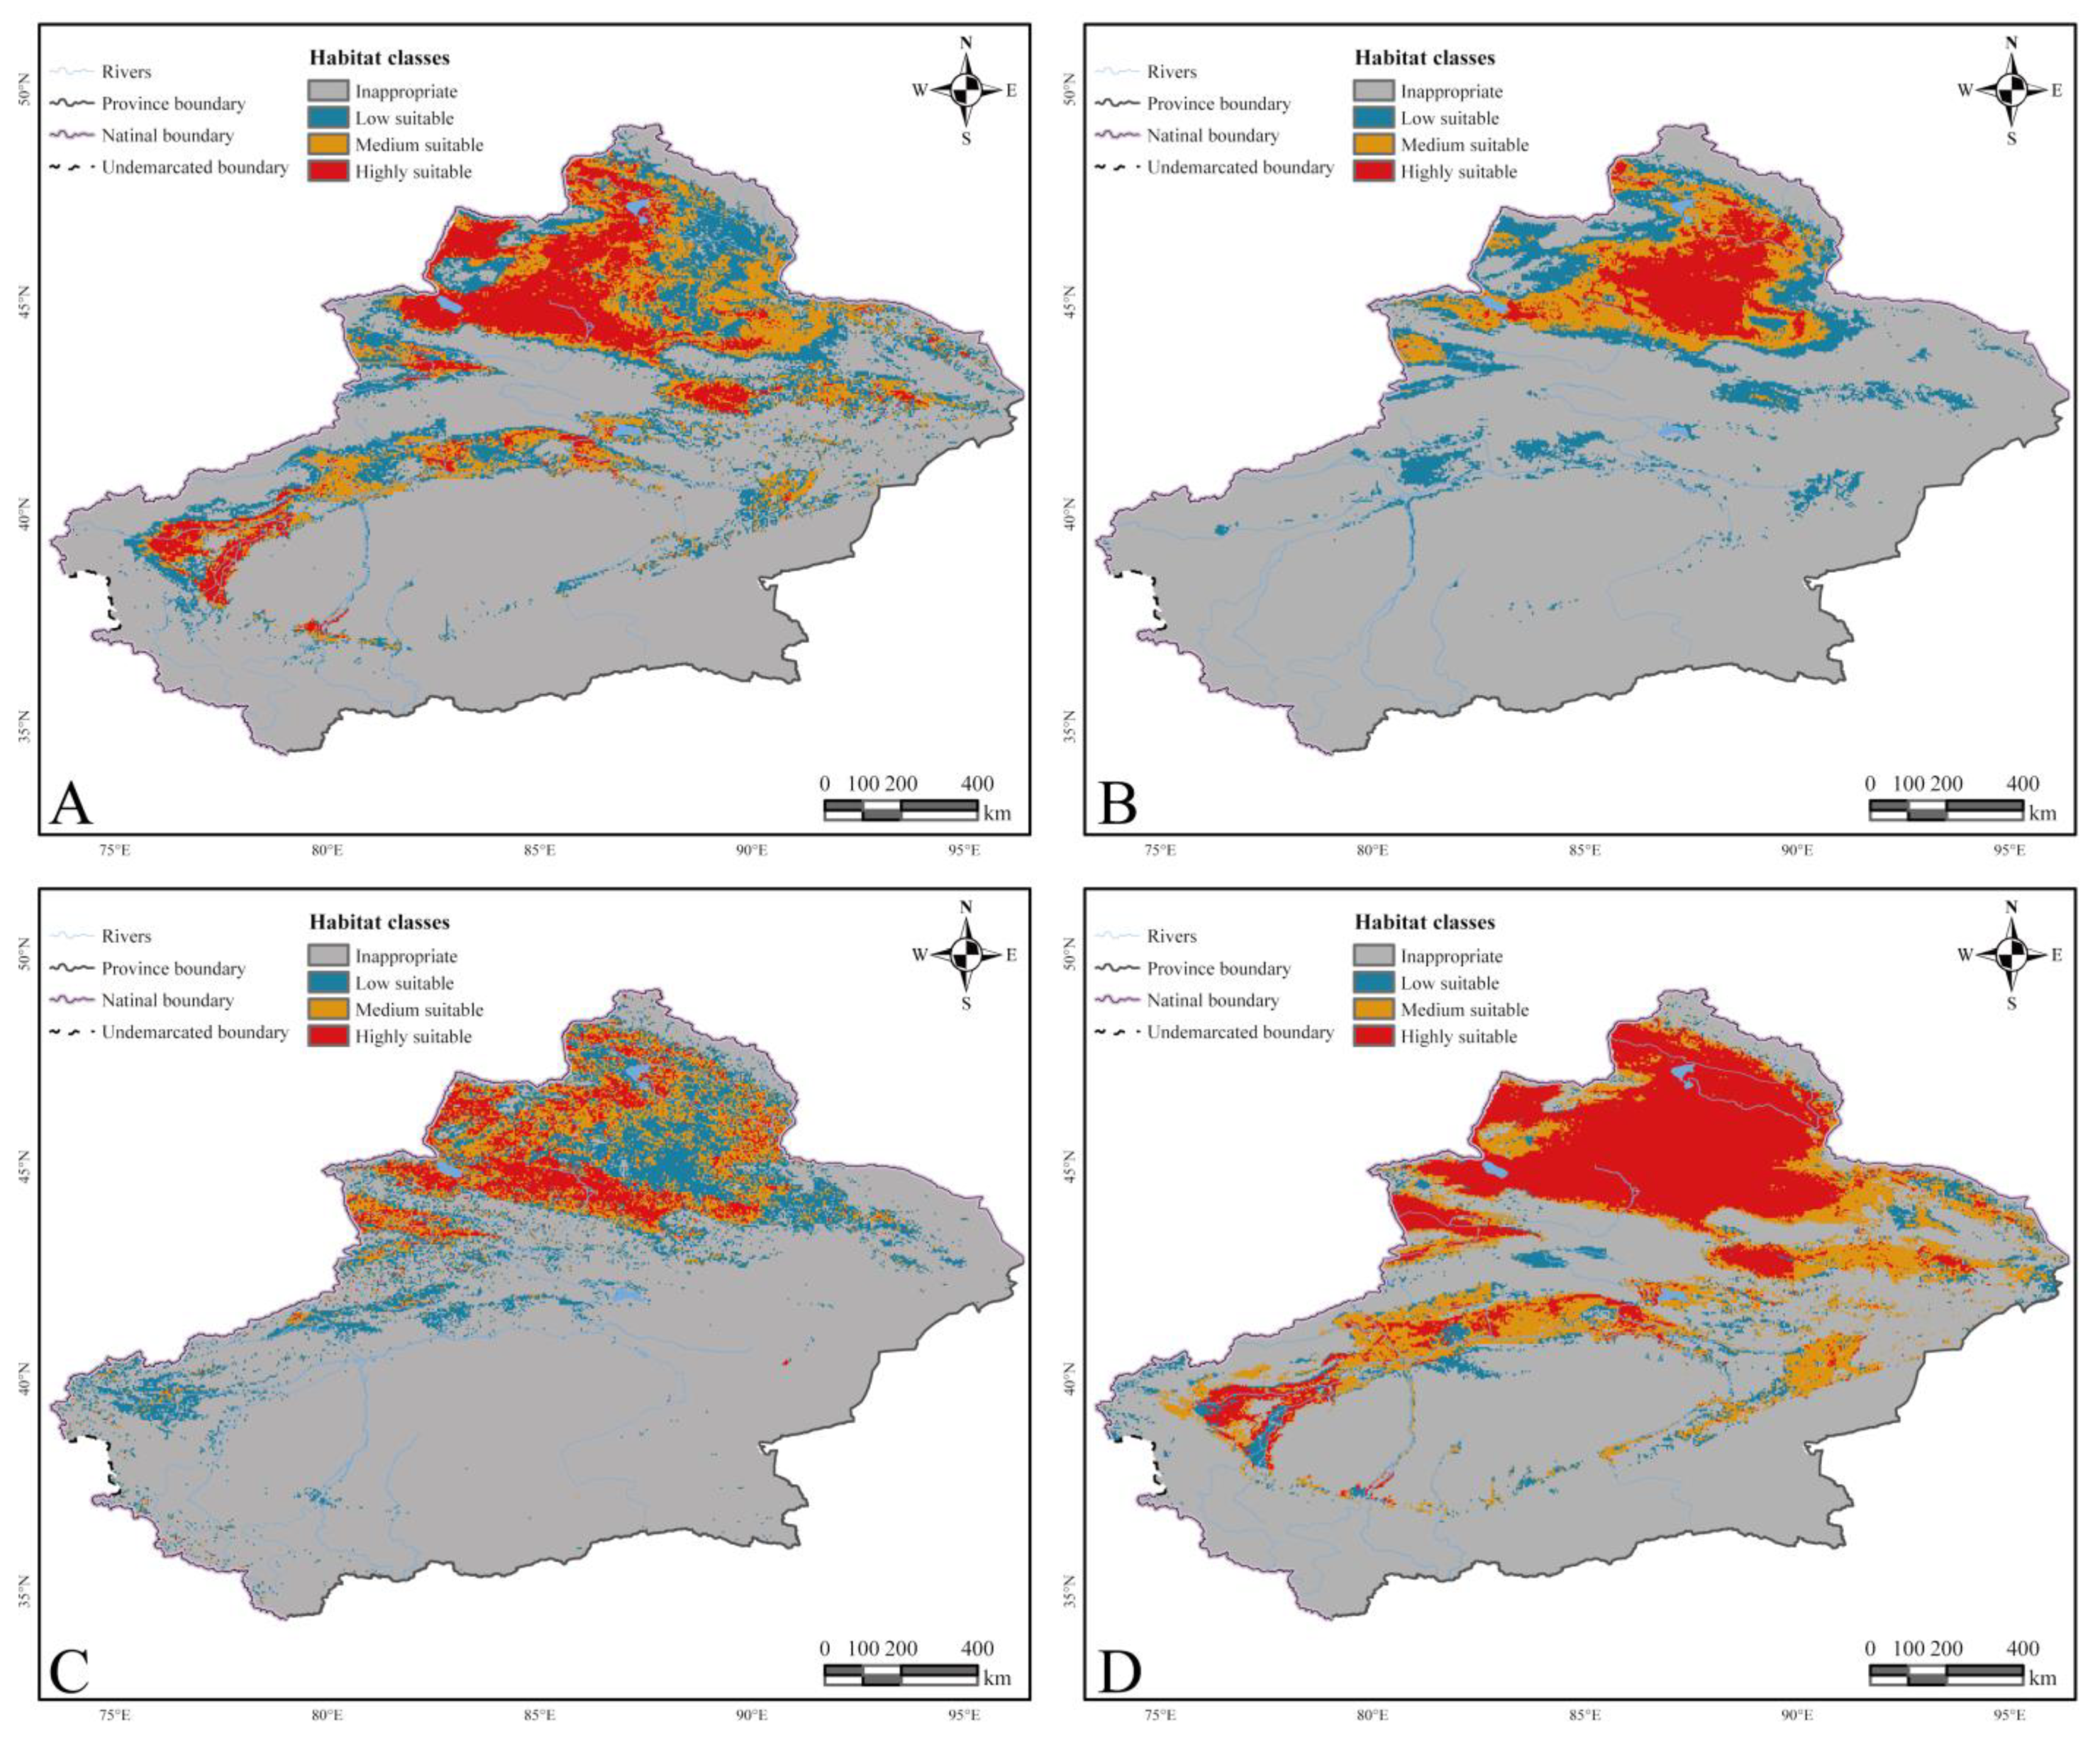
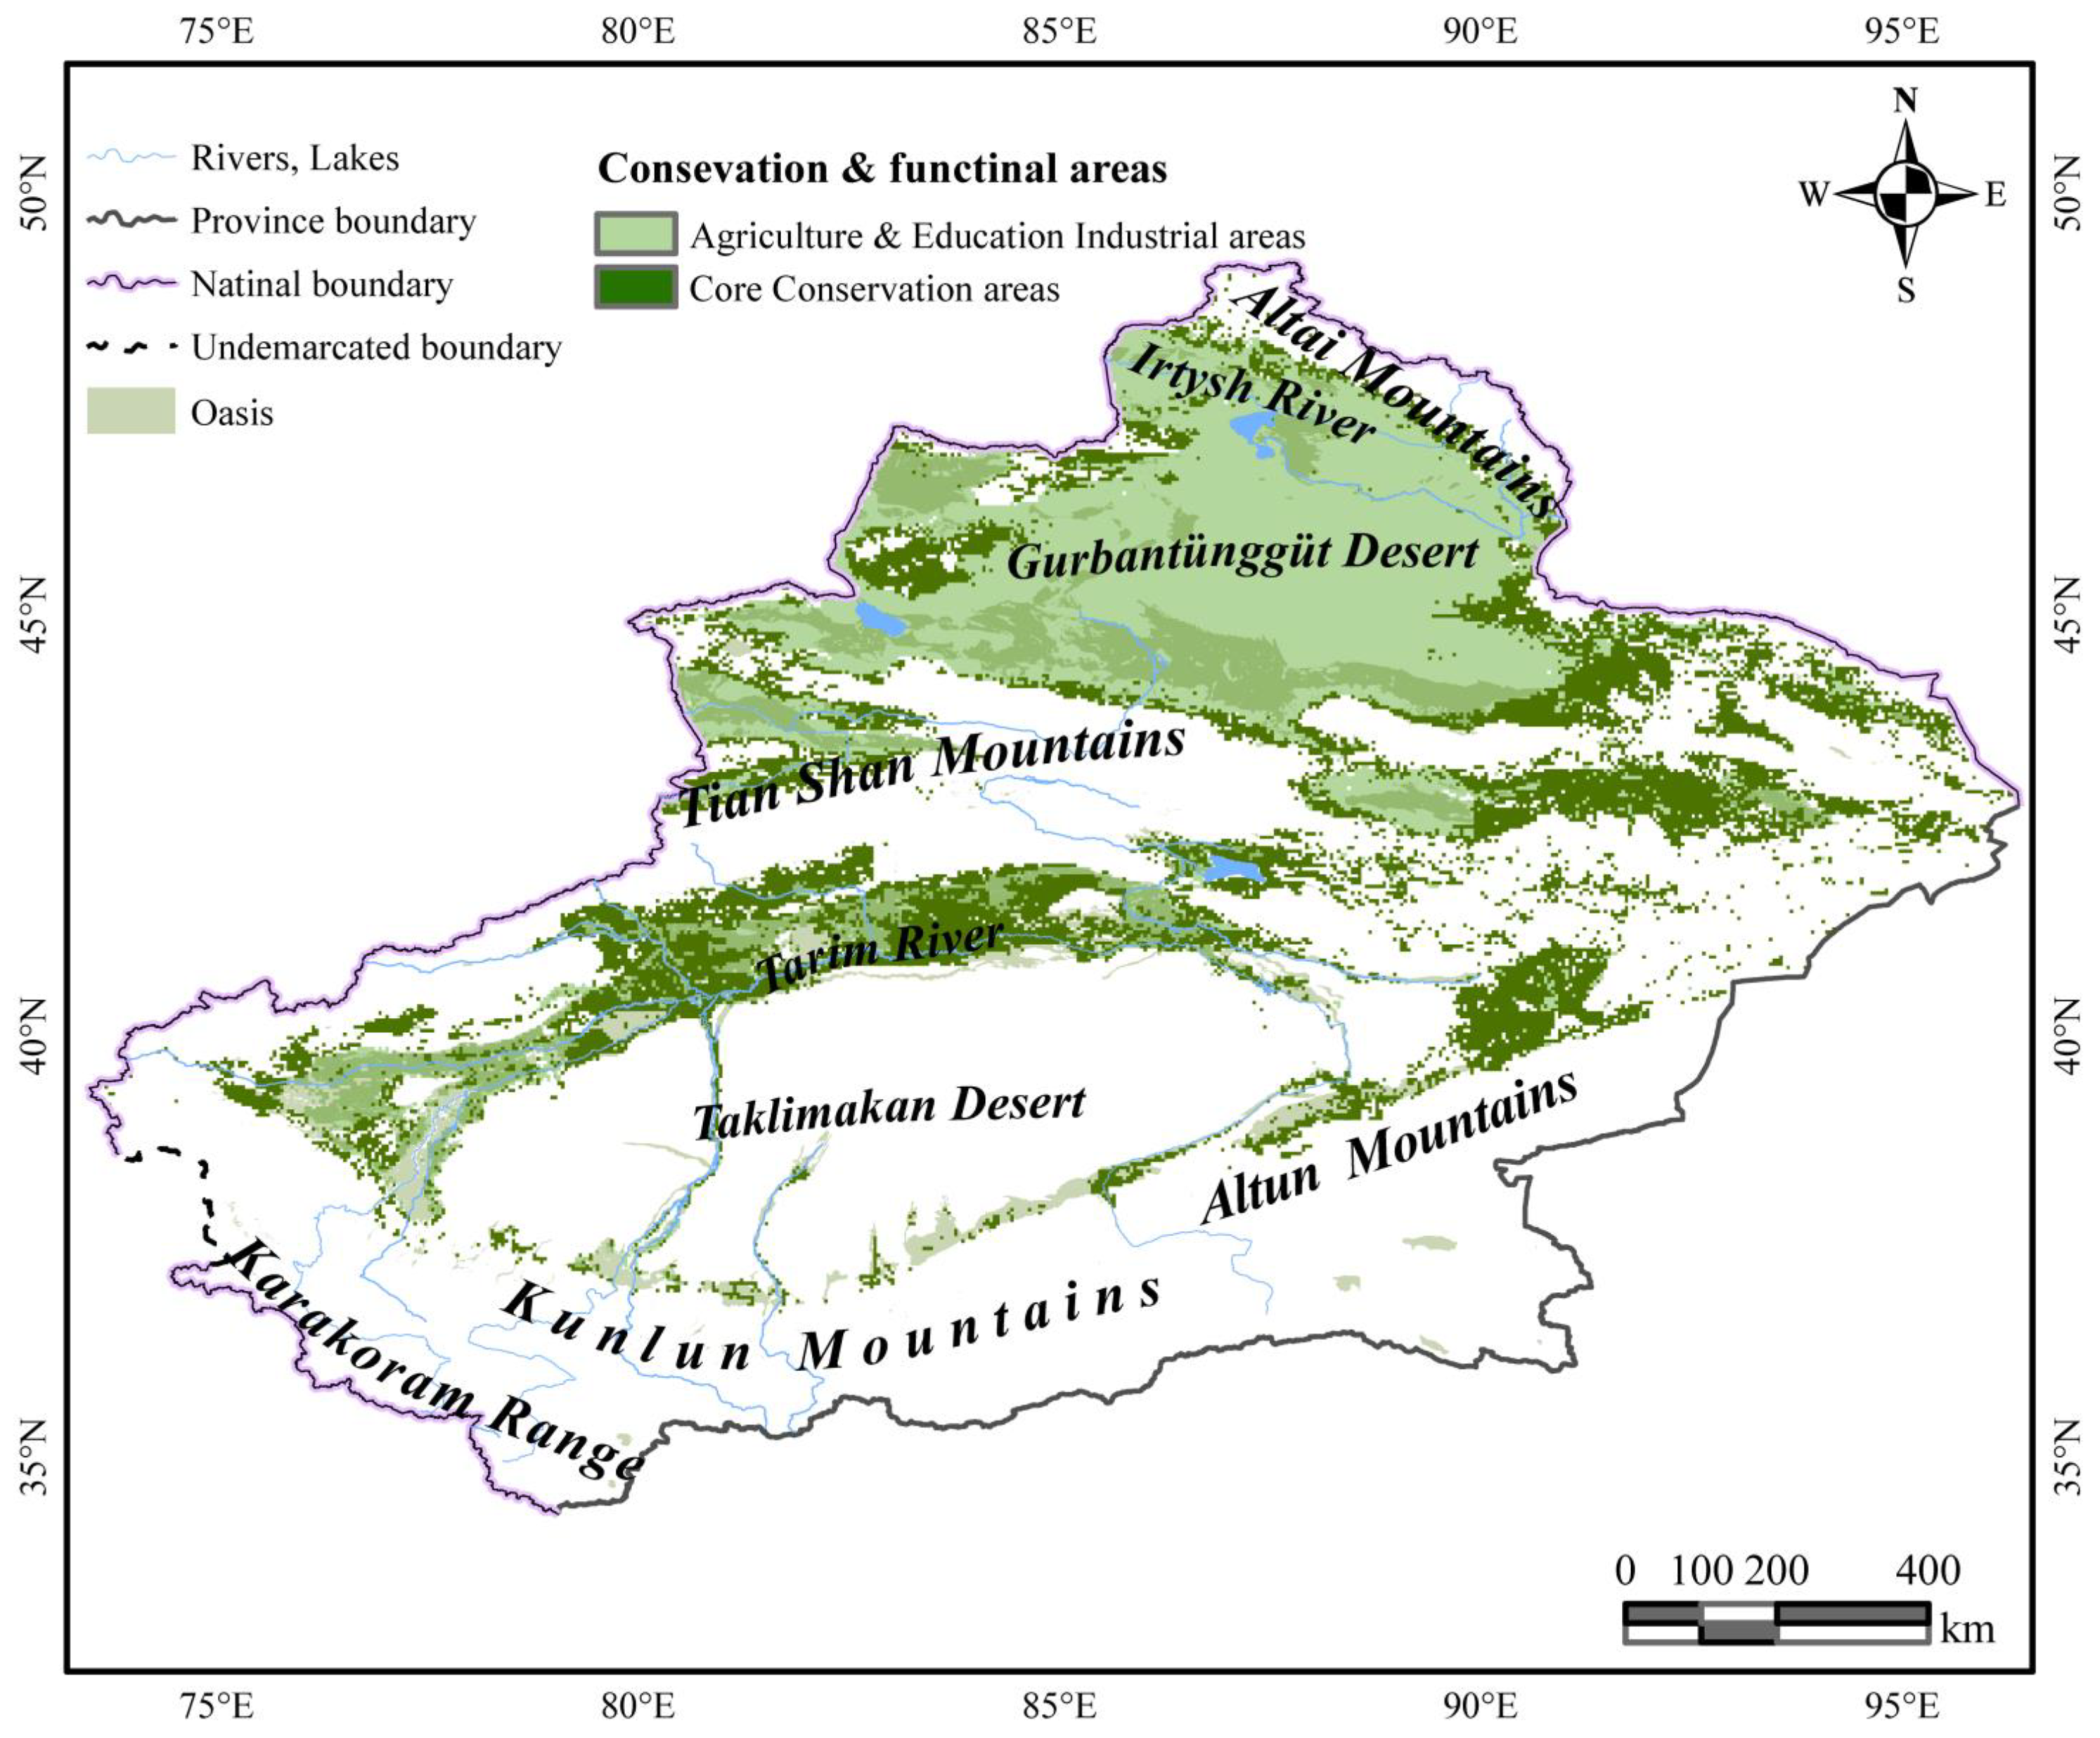
  • Under various climate scenarios, the HSH is constantly increasing, reaching a maximum growth ratio of 27.3%; the LSH is more sensitive and is primarily decreasing, reaching a maximum reduction ratio of 48.2%; and the MSH has the same sensitivity as LSH, reaching a maximum reduction ratio of 26.6%. As a result, while designating the protected areas, the influence of the combination of LSH and MSH was prioritized in all climate scenarios. Additionally, given the economic development and biodiversity protection (Figure 8), the HSH is defined as agriculture and education industrial areas, aiming to promote the development of cultivated C. deserticola industry and curb the loss of biodiversity in cultivated HCCF by receiving inspiration from the natural host–parasite relationship (HCCF). The core conservation area in SSP126, SSP245, SSP370, and SSP585 is 317,315.118 km2. The HSH, which is always growing, is used as agricultural and educational industrial areas. The industrial zones cover a total area of 319,489.874 km2.

Author Contributions

Conceptualization, J.F., M.S., C.L., B.L. and S.L.; methodology, M.S., J.F. and L.W.; software, M.S. and J.F.; validation, M.S., J.F. and B.L.; formal analysis, J.F., L.W. and B.L.; investigation, J.F., B.L. and C.L.; resources, J.F., S.L. and B.L.; data curation, J.F., M.S. and B.L.; writing—original draft preparation, M.S.; writing—review and editing, J.F., L.W., B.L., C.L. and S.L.; visualization, M.S. and J.F.; supervision, J.F., C.L., B.L. and S.L.; project administration, J.F.; funding acquisition, J.F. All authors have read and agreed to the published version of the manuscript.

Funding

This research was funded by the Key Research and Development Program of Xinjiang Uygur Autonomous Region (grant number 2021B03002-4), supported by the Strategic Priority Research Program of the Chinese Academy of Sciences (Grant NO. XDA2003020201), and the K.C.Wong Education Foundation.

Institutional Review Board Statement

Not applicable.

Informed Consent Statement

Not applicable.

Data Availability Statement

The data presented in this study are available on request from the corresponding author.

Acknowledgments

Thanks are given to Rainer Ferdinand Wunderlich (in www.researchgate.net, last accessed on 20 November 2021) for solving M.S.’s questions regarding the MaxEnt R package.

Conflicts of Interest

The authors declare no conflict of interest.

Appendix A

Figure A1. The figure of the correlation matrix of all variables.
Forests 13 00189 g0a1

References

  1. Zhou, Y.; Guo, Y.; Liu, Y.; Wu, W.; Li, Y. Targeted poverty alleviation and land policy innovation: Some practice and policy implications from China. Land Use Policy 2018, 74, 53–65. [Google Scholar] [CrossRef]
  2. Wang, Y.; Wang, L.; Wu, H.; Zhu, Y.; Shi, X. Targeted poverty reduction under new structure: A perspective from mental health of older adults in rural China. China Agric. Econ. Rev. 2019, 11, 555–566. [Google Scholar] [CrossRef]
  3. Ge, Y.; Hu, S.; Ren, Z.; Jia, Y.; Wang, J.; Liu, M.; Zhang, D.; Zhao, W.; Luo, Y.; Fu, Y.; et al. Mapping annual land use changes in China’s poverty-stricken areas from 2013 to 2018. Remote Sens. Environ. 2019, 232, 111285. [Google Scholar] [CrossRef]
  4. Zhou, P.; Wang, Z.; Zhang, J.; Yang, Z.; Li, X. Study on the hydrochemical characteristics of groundwater along the Taklimakan Desert Highway. Environ. Earth Sci. 2016, 75, 1378. [Google Scholar] [CrossRef]
  5. Yan, W.; Qi, Y.; Yingxia, G. Current Situation and Challenges of Health Poverty Alleviation of Provinces along the Silk Road: Survey Findings in Shaanxi, Gansu and Xinjiang. Mod. China Stud. 2019, 26, 84–96. [Google Scholar]
  6. Yang, P.; Xia, J.; Zhang, Y.; Zhan, C.; Cai, W.; Zhang, S.; Wang, W. Quantitative study on characteristics of hydrological drought in arid area of Northwest China under changing environment. J. Hydrol. 2021, 597, 126343. [Google Scholar] [CrossRef]
  7. He, T.; Wang, C.; Wang, Z.; He, X.; Liu, H.; Zhang, J. Assessing the agricultural water savings–economy–ecological environment system in an arid area of northwest china using a water rights transaction model. Water 2021, 13, 1233. [Google Scholar] [CrossRef]
  8. Li, Y.; Lu, R.; Li, W.; Xie, Z.; Song, Y. Concentrations and size distributions of viable bioaerosols under various weather conditions in a typical semi-arid city of Northwest China. J. Aerosol. Sci. 2017, 106, 83–92. [Google Scholar] [CrossRef]
  9. Jia, Y.; Liu, Y.; Zhang, S. Evaluation of Agricultural Ecosystem Service Value in Arid and Semiarid Regions of Northwest China Based on the Equivalent Factor Method. Environ. Process. 2021, 8, 713–727. [Google Scholar] [CrossRef]
  10. Liu, S.; Huang, G. Rural Construction and Ecological Environment Optimization in Northwest China Based on Sustainability. IOP Conf. Ser. Earth Environ. Sci. 2020, 514, 32056. [Google Scholar] [CrossRef]
  11. Zhang, G.; Shen, D.; Ming, B.; Xie, R.; Jin, X.; Liu, C.; Hou, P.; Xue, J.; Chen, J.; Zhang, W.; et al. Using irrigation intervals to optimize water-use efficiency and maize yield in Xinjiang, northwest China. Crop J. 2019, 7, 322–334. [Google Scholar] [CrossRef]
  12. Wang, T.; Zhang, X.; Xie, W. Cistanche deserticola Y. C. Ma, ‘desert Ginseng’: A review. Am. J. Chin. Med. 2012, 40, 1123–1141. [Google Scholar] [CrossRef] [PubMed]
  13. Announcement of National Forestry and Grassland Administration and Ministry of Agriculture and Rural Affairs (List of National Key Protected Wild Plants in China. Available online: http://www.forestry.gov.cn/main/5461/20210908/162515850572900.html (accessed on 20 November 2021).
  14. Jiang, Y.; Tu, P.F. Analysis of chemical constituents in Cistanche species. J. Chromatogr. A 2009, 1216, 1970–1979. [Google Scholar] [CrossRef] [PubMed]
  15. Xiong, Q.B.; Kadota, S.; Tani, T.; Namba, T. Antioxidative effects of phenylethanoids from Cistanche deserticola. Biol. Pharm. Bull. 1996, 19, 1580–1585. [Google Scholar] [CrossRef] [PubMed] [Green Version]
  16. Wong, C.C.; Li, H.B.; Cheng, K.W.; Chen, F. A systematic survey of antioxidant activity of 30 Chinese medicinal plants using the ferric reducing antioxidant power assay. Food Chem. 2006, 97, 705–711. [Google Scholar] [CrossRef]
  17. Yue, H.; Zeng, H.; Ding, K. A review of isolation methods, structure features and bioactivities of polysaccharides from Dendrobium species. Chin. J. Nat. Med. 2020, 18, 1–27. [Google Scholar] [CrossRef]
  18. Dong, W.; Xu, C.; Li, D.; Jin, X.; Li, R.; Lu, Q.; Suo, Z. Comparative analysis of the complete chloroplast genome sequences in psammophytic Haloxylon species (Amaranthaceae). PeerJ 2016, 4, e2699. [Google Scholar] [CrossRef] [Green Version]
  19. Li, J.; Chang, H.; Liu, T.; Zhang, C. The potential geographical distribution of Haloxylon across Central Asia under climate change in the 21st century. Agric. For. Meteorol. 2019, 275, 243–254. [Google Scholar] [CrossRef]
  20. Song, J.; Feng, G.; Tian, C.; Zhang, F. Strategies for adaptation of Suaeda physophora, Haloxylon ammodendron and Haloxylon persicum to a saline environment during seed-germination stage. Ann. Bot. 2005, 96, 399–405. [Google Scholar] [CrossRef] [Green Version]
  21. Yang, G.; Liu, S.; Yan, K.; Tian, L.; Li, P.; Li, X.; He, X. Effect of Drip Irrigation with Brackish Water on the Soil Chemical Properties for a Typical Desert Plant (Haloxylon Ammodendron) in the Manas River Basin. Irrig. Drain. 2020, 69, 460–471. [Google Scholar] [CrossRef]
  22. Ebrahimi, M.; Mohammadi, F.; Fakhireh, A.; Bameri, A. Effects of Haloxylon spp. of Different Age Classes on Vegetation Cover and Soil Properties on an Arid Desert Steppe in Iran. Pedosphere 2019, 29, 619–631. [Google Scholar] [CrossRef]
  23. Khosravi Mashizi, A.; Sharafatmandrad, M. Assessing the effects of shrubs on ecosystem functions in arid sand dune ecosystems. Arid Land Res. Manag. 2020, 34, 171–187. [Google Scholar] [CrossRef]
  24. Di Marco, M.; Venter, O.; Possingham, H.P.; Watson, J.E.M. Changes in human footprint drive changes in species extinction risk. Nat. Commun. 2018, 9, 4621. [Google Scholar] [CrossRef] [PubMed]
  25. Sun, J.; Qiu, H.; Guo, J.; Xu, X.; Wu, D.; Zhong, L.; Jiang, B.; Jiao, J.; Yuan, W.; Huang, Y. Modeling the potential distribution of Zelkova schneideriana under different human activity intensities and climate change patterns in China. Glob. Ecol. Conserv. 2020, 21, e00840. [Google Scholar] [CrossRef]
  26. Galante, P.J.; Alade, B.; Muscarella, R.; Jansa, S.A.; Goodman, S.M.; Anderson, R.P. The challenge of modeling niches and distributions for data-poor species: A comprehensive approach to model complexity. Ecography 2018, 41, 726–736. [Google Scholar] [CrossRef] [Green Version]
  27. Gherghel, I.; Brischoux, F.; Papeş, M. Using biotic interactions in broad-scale estimates of species’ distributions. J. Biogeogr. 2018, 45, 2216–2225. [Google Scholar] [CrossRef]
  28. Moreno-Amat, E.; Mateo, R.G.; Nieto-Lugilde, D.; Morueta-Holme, N.; Svenning, J.C.; García-Amorena, I. Impact of model complexity on cross-temporal transferability in Maxent species distribution models: An assessment using paleobotanical data. Ecol. Modell. 2015, 312, 308–317. [Google Scholar] [CrossRef]
  29. Wiese, D.; Escalante, A.A.; Murphy, H.; Henry, K.A.; Gutierrez-Velez, V.H. Integrating environmental and neighborhood factors in MaxEnt modeling to predict species distributions: A case study of Aedes albopictus in southeastern Pennsylvania. PLoS ONE 2019, 14, e0223821. [Google Scholar] [CrossRef] [Green Version]
  30. Mandakh, U.; Battseren, M.; Ganbat, D.; Ayanga, T.; Adiya, Z.; Borjigidai, A.; Long, C. Folk nomenclature of plants in Cistanche deserticola-associated community in South Gobi, Mongolia. Plant Divers. 2020, 42, 434–442. [Google Scholar] [CrossRef]
  31. Song, Y.; Zeng, K.; Jiang, Y.; Tu, P. Cistanches Herba, from an endangered species to a big brand of Chinese medicine. Med. Res. Rev. 2021, 41, 1539–1577. [Google Scholar] [CrossRef]
  32. Sun, X.; Pei, J.; Lin, Y.L.; Li, B.L.; Zhang, L.; Ahmad, B.; Huang, L.F. Revealing the Impact of the Environment on Cistanche salsa: From Global Ecological Regionalization to Soil Microbial Community Characteristics. J. Agric. Food Chem. 2020, 68, 8720–8731. [Google Scholar] [CrossRef] [PubMed]
  33. Da Cunha, H.F.; Ferreira, É.D.; Tessarolo, G.; Nabout, J.C. Host plant distributions and climate interact to affect the predicted geographic distribution of a Neotropical termite. Biotropica 2018, 50, 625–632. [Google Scholar] [CrossRef]
  34. Dibong, S.; Taffouo, D.V.; Boussim, J.I.; Akoa, A. Effects of host specificity in parasitic Loranthaceae for sodium and potassium distribution in coastal region of Cameroon. Int. J. Bot. 2012, 8, 159–164. [Google Scholar] [CrossRef] [Green Version]
  35. Sayad, E.; Boshkar, E.; Gholami, S. Different role of host and habitat features in determining spatial distribution of mistletoe infection. For. Ecol. Manage. 2017, 384, 323–330. [Google Scholar] [CrossRef]
  36. Hu, L.; Wang, J.; Yang, C.; Islam, F.; Bouwmeester, H.J.; Muños, S.; Zhou, W. The effect of virulence and resistance mechanisms on the interactions between parasitic plants and their hosts. Int. J. Mol. Sci. 2020, 21, 9013. [Google Scholar] [CrossRef] [PubMed]
  37. Smith, J.D.; Mescher, M.C.; De Moraes, C.M. Implications of bioactive solute transfer from hosts to parasitic plants. Curr. Opin. Plant Biol. 2013, 16, 464–472. [Google Scholar] [CrossRef]
  38. Wang, X.M.; Yang, D.Y.; Tian, Y.Z.; Tu, P.F.; Sun, Q.S.; Li, X.B. Genetic relationship between parasitized and non-parasitized Haloxylon ammodendron in the Alxa Desert. J. Syst. Evol. 2009, 47, 255–262. [Google Scholar] [CrossRef]
  39. Li, N.; Lin, H.; Wang, T.; Li, Y.; Liu, Y.; Chen, X.; Hu, X. Impact of climate change on cotton growth and yields in Xinjiang, China. Field Crops Res. 2020, 247, 107590. [Google Scholar] [CrossRef]
  40. Li, Q.; Chen, Y.; Shen, Y.; Li, X.; Xu, J. Spatial and temporal trends of climate change in Xinjiang, China. J. Geogr. Sci. 2011, 21, 1007–1018. [Google Scholar] [CrossRef]
  41. Li, Y.; Sun, C. Impacts of the superimposed climate trends on droughts over 1961–2013 in Xinjiang, China. Theor. Appl. Climatol. 2017, 129, 977–994. [Google Scholar] [CrossRef]
  42. Heatwole, H.; Grech, A.; Marsh, H. Paleoclimatology, Paleogeography, and the Evolution and Distribution of Sea Kraits (Serpentes; Elapidae; Laticauda). Herpetol. Monogr. 2017, 31, 1–17. [Google Scholar] [CrossRef] [Green Version]
  43. Hijmans, R.J. raster: Geographic Data Analysis and Modeling. 2021. Available online: https://cran.r-project.org/web/packages/raster/index.html (accessed on 24 January 2022).
  44. Perpiñán, O.; Hijmans, R. rasterVis. 2021. Available online: https://cran.r-project.org/web/packages/rasterVis/index.html (accessed on 24 January 2022).
  45. Warren, D.L.; Glor, R.E.; Turelli, M. ENMTools: A toolbox for comparative studies of environmental niche models. Ecography 2010, 33, 607–611. [Google Scholar] [CrossRef]
  46. Warren, D.L.; Matzke, N.J.; Cardillo, M.; Baumgartner, J.B.; Beaumont, L.J.; Turelli, M.; Glor, R.E.; Huron, N.A.; Simões, M.; Iglesias, T.L.; et al. ENMTools 1.0: An R package for comparative ecological biogeography. Ecography 2021, 44, 504–511. [Google Scholar] [CrossRef]
  47. Vignali, S.; Barras, A.G.; Arlettaz, R.; Braunisch, V. SDMtune: An R package to tune and evaluate species distribution models. Ecol. Evol. 2020, 10, 11488–11506. [Google Scholar] [CrossRef] [PubMed]
  48. Phillips, S.J.; Anderson, R.P.; Schapire, R.E. Maximum entropy modeling of species geographic distributions. Ecol. Modell. 2006, 190, 231–259. [Google Scholar] [CrossRef] [Green Version]
  49. Phillips, S.J.; Anderson, R.P.; Dudík, M.; Schapire, R.E.; Blair, M.E. Opening the black box: An open-source release of Maxent. Ecography 2017, 40, 887–893. [Google Scholar] [CrossRef]
  50. Radosavljevic, A.; Anderson, R.P. Making better Maxent models of species distributions: Complexity, overfitting and evaluation. J. Biogeogr. 2014, 41, 629–643. [Google Scholar] [CrossRef]
  51. Elith, J.H.; Graham, C.P.; Anderson, R.; Dudík, M.; Ferrier, S.; Guisan, A.J.; Hijmans, R.; Huettmann, F.R.; Leathwick, J.; Lehmann, A.; et al. Novel methods improve prediction of species’ distributions from occurrence data. Ecography 2006, 29, 129–151. [Google Scholar] [CrossRef] [Green Version]
  52. Merow, C.; Smith, M.J.; Silander, J.A. A practical guide to MaxEnt for modeling species’ distributions: What it does, and why inputs and settings matter. Ecography 2013, 36, 1058–1069. [Google Scholar] [CrossRef]
  53. Cobos, M.E.; Townsend Peterson, A.; Barve, N.; Osorio-Olvera, L. kuenm: An R package for detailed development of ecological niche models using Maxent. PeerJ 2019, 7, e6281. [Google Scholar] [CrossRef] [Green Version]
  54. Fielding, A.H.; Bell, J.F. A review of methods for the assessment of prediction errors in conservation presence/absence models. Environ. Conserv. 1997, 24, 38–49. [Google Scholar] [CrossRef]
  55. Araujo, M.; Pearson, R.; Thuiller, W.; Erhard, M. Validation of species-climate impact models under climate change. Glob. Chang. Biol. 2005, 11, 1504–1513. [Google Scholar] [CrossRef] [Green Version]
  56. Swets, J. Measuring the accuracy of diagnostic systems. Science 1988, 240, 1285–1293. [Google Scholar] [CrossRef] [PubMed] [Green Version]
  57. Fitzpatrick, B.M.; Turelli, M. The Geography of Mammalian Speciation: Mixed Signals from Phylogenies and Range Maps. Evolution 2006, 60, 601–615. [Google Scholar] [CrossRef]
  58. Lira-Noriega, A.; Peterson, A.T. Range-wide ecological niche comparisons of parasite, hosts and dispersers in a vector-borne plant parasite system. J. Biogeogr. 2014, 41, 1664–1673. [Google Scholar] [CrossRef]
  59. Li, Q.; Grossenbacher, D.L.; Angert, A.L. The effect of range overlap on ecological niche divergence depends on spatial scale in monkeyflowers. Evolution 2018, 72, 2100–2113. [Google Scholar] [CrossRef]
  60. Pastore, A.I.; Barabás, G.; Bimler, M.D.; Mayfield, M.M.; Miller, T.E. The evolution of niche overlap and competitive differences. Nat. Ecol. Evol. 2021, 5, 330–337. [Google Scholar] [CrossRef]
  61. Kornis, M.S.; Bunnell, D.B.; Swanson, H.K.; Bronte, C.R. Spatiotemporal patterns in trophic niche overlap among five salmonines in Lake Michigan, USA. Can. J. Fish. Aquat. Sci. 2020, 77, 1059–1075. [Google Scholar] [CrossRef]
  62. Chen, J.; Yang, S.; Li, H.; Zhang, B.; Lv, J. Research on geographical environment unit division based on the method of natural breaks (Jenks). In Proceedings of the ISPRS/IGU/ICA Joint Workshop on Borderlands Modelling and Understanding for Global Sustainability 2013, Beijing, China, 5–6 December 2013; Volume 40, pp. 47–50. [Google Scholar]
  63. Smith, J.D.; Woldemariam, M.G.; Mescher, M.C.; Jander, G.; de Moraes, C.M. Glucosinolates from host plants influence growth of the parasitic plant Cuscuta gronovii and its susceptibilityto aphid feeding. Plant Physiol. 2016, 172, 181–197. [Google Scholar] [CrossRef] [Green Version]
  64. Rowntree, J.K.; Craig, H. The contrasting roles of host species diversity and parasite population genetic diversity in the infection dynamics of a keystone parasitic plant. J. Ecol. 2019, 107, 23–33. [Google Scholar] [CrossRef]
  65. Warren, D.L.; Seifert, S.N. Ecological niche modeling in Maxent: The importance of model complexity and the performance of model selection criteria. Ecol. Appl. 2011, 21, 335–342. [Google Scholar] [CrossRef] [PubMed] [Green Version]
  66. Smith, A.B.; Santos, M.J. Testing the ability of species distribution models to infer variable importance. Ecography 2020, 43, 1801–1813. [Google Scholar] [CrossRef]
  67. Bradie, J.; Leung, B. A quantitative synthesis of the importance of variables used in MaxEnt species distribution models. J. Biogeogr. 2017, 44, 1344–1361. [Google Scholar] [CrossRef]
  68. Zhu, G.; Qiao, H. Effect of the Maxent model’s complexity on the prediction of species potential distributions. Biodivers. Sci. 2016, 24, 1189–1196. [Google Scholar] [CrossRef] [Green Version]
  69. Westwood, J.H.; Yoder, J.I.; Timko, M.P.; dePamphilis, C.W. The evolution of parasitism in plants. Trends Plant Sci. 2010, 15, 227–235. [Google Scholar] [CrossRef]
  70. Wisz, M.S.; Pottier, J.; Kissling, W.D.; Pellissier, L.; Lenoir, J.; Damgaard, C.F.; Dormann, C.F.; Forchhammer, M.C.; Grytnes, J.A.; Guisan, A.; et al. The role of biotic interactions in shaping distributions and realised assemblages of species: Implications for species distribution modelling. Biol. Rev. 2013, 88, 15–30. [Google Scholar] [CrossRef] [Green Version]
  71. Searcy, C.A.; Bradley Shaffer, H. Do ecological niche models accurately identify climatic determinants of species ranges? Am. Nat. 2016, 187, 423–435. [Google Scholar] [CrossRef] [Green Version]
  72. Konowalik, K.; Nosol, A. Evaluation metrics and validation of presence-only species distribution models based on distributional maps with varying coverage. Sci. Rep. 2021, 11, 1482. [Google Scholar] [CrossRef]
  73. Hirzel, A.H.; Le Lay, G.; Helfer, V.; Randin, C.; Guisan, A. Evaluating the ability of habitat suitability models to predict species presences. Ecol. Modell. 2006, 199, 142–152. [Google Scholar] [CrossRef]
  74. Somodi, I.; Lepesi, N.; Botta-Dukát, Z. Prevalence dependence in model goodness measures with special emphasis on true skill statistics. Ecol. Evol. 2017, 7, 863–872. [Google Scholar] [CrossRef] [Green Version]
  75. Sofaer, H.R.; Hoeting, J.A.; Jarnevich, C.S. The area under the precision-recall curve as a performance metric for rare binary events. Methods Ecol. Evol. 2019, 10, 565–577. [Google Scholar] [CrossRef]
  76. Liu, C.; White, M.; Newell, G. Measuring and comparing the accuracy of species distribution models with presence–absence data. Ecography 2011, 34, 232–243. [Google Scholar] [CrossRef]
  77. Araújo, M.B.; Anderson, R.P.; Barbosa, A.M.; Beale, C.M.; Dormann, C.F.; Early, R.; Garcia, R.A.; Guisan, A.; Maiorano, L.; Naimi, B. Standards for distribution models in biodiversity assessments. Sci. Adv. 2019, 5, eaat4858. [Google Scholar] [CrossRef] [PubMed] [Green Version]
  78. Valavi, R.; Guillera-Arroita, G.; Lahoz-Monfort, J.J.; Elith, J. Predictive performance of presence-only species distribution models: A benchmark study with reproducible code. Ecol Monogr. 2021, 1, e01486. [Google Scholar] [CrossRef]
  79. Ma, M.X.; Zhang, H.; Gao, J.X.; Ju, C.; Wang, Y.; Liu, D. Different methods comparison of delineating the ecological protection red line for biodiversity conservation. Acta Ecol. Sin. 2019, 39, 6959–6965. [Google Scholar]
  80. Wang, X.; Jiang, J.; Wang, Y.; Luo, W.; Song, C.; Chen, J. Responses of ephemeral plant germination and growth to water and heat conditions in the southern part of Gurbantunggut Desert. Chinese Sci. Bull. 2006, 51, 110–116. [Google Scholar] [CrossRef]
  81. Qin, J.; Su, B.; Tao, H.; Wang, Y.; Huang, J.; Jiang, T. Projection of temperature and precipitation under SSPs-RCPs Scenarios over northwest China. Front. Earth Sci. 2021, 15, 23–37. [Google Scholar] [CrossRef]
  82. Yue, P.; Cui, X.; Wu, W.; Gong, Y.; Li, K.; Misselbrook, T.; Liu, X. Are annual nitrous oxide fluxes sensitive to warming and increasing precipitation in the Gurbantunggut Desert? L. Degrad. Dev. 2021, 32, 1213–1223. [Google Scholar] [CrossRef]
Figure 1. The study area: (A) Xinjiang, as the natural growing area of Cistanche deserticola Ma located in China; (B) the main rivers, mountains, deserts, and oasis in Xinjiang; (C) the photos of C. deserticola: (C1) the wild C. deserticola; (C2) the cultivated C. deserticola; (C3) the cultivated industry of C. deserticola.
Forests 13 00189 g001
Figure 2. The habitat of AH (abiotic and host factors in C. deserticola distribution) in Xinjiang. And the suitable habitats are mainly in the north of region.
Forests 13 00189 g002
Figure 3. The habitat of HO (host factors only in C. deserticola distribution) in Xinjiang. And the highly suitable habitat is mainly in the northern region, and the medium and low suitable habitats are mainly in the southern region and around the Taklimakan desert.
Forests 13 00189 g003
Figure 4. The distributions of C. deserticola in climate scenarios. The AH/HO means the strategy of abiotic and host factors or host factors only. And the number 126/245/370/585 means the Shared Socio-economic Pathways.
Forests 13 00189 g004
Figure 5. The changing rate of area in each habitat and climate scenario, rate = (selected–current)/current. (A) The changing rate of habitats areas in AH (abiotic and host factors) strategy; and (B) the changing rate of habitats areas in HO (host factors only) strategy. And the positive value represents an increase in area, the negative value represents a decrease in area compared to the current.
Forests 13 00189 g005
Figure 6. The response curves of hosts in two strategies ((A1): the response curve of Haloxylon. ammondendron (C. A. Mey.) Bunge in AH strategy; (A2): the response curve of H. persicum Bunge ex Boiss in AH strategy; (B1): the response curve of H. ammondendron in HO strategy; (B2): the response curve of H. persicum in HO strategy). The AH/HO means the strategy of abiotic and host factors or host factors only.
Forests 13 00189 g006
Figure 7. The current predicted distributions of C. deserticola and its hosts. (A) The current distribution of H. ammodendron; (B) the current distribution of H. persicum; (C) the current distribution of C. deserticola with AH; (D) the current distribution of C. deserticola with HO.
Forests 13 00189 g007
Figure 8. The conservation and functional areas based on the changing trend of HO (host factors only) strategy in climatic changes. The low and medium suitable habitats are identified as core conservation areas because of their sensitivity, and the highly suitable habitats are identified as agriculture and education industrial areas because of their adaptability.
Forests 13 00189 g008
Table 1. The remaining environmental variables of each species.
CategoryBioclimatic VariablesInformation
Cistanche deserticola MaBio07Temperature annual range
Bio19Precipitation of coldest quarter
aspectAspect
slopeSlope
Water_b100Soil water content at 100 cm depth
Organic_b200Soil organic carbon at 200 cm depth
Texture_b100Soil texture class at 100 cm depth
Texture_b200Soil texture class at 200 cm depth
Haloxylon ammodendron (C. A. Mey.) BungeBio06Min Temperature of coldest month
Bio15Precipitation seasonality
aspectAspect
slopeSlope
elevationElevation
Water_b100Soil water content at 100 cm depth
Organic_b100Soil organic carbon at 100 cm depth
Texture_b100Soil texture class at 100 cm depth
Texture_b200Soil texture class at 200 cm depth
H. persicum Bunge ex BoissBio07Temperature annual range
Bio13Precipitation of wettest month
Bio17Precipitation of driest quarter
aspectAspect
slopeSlope
Sand_b200Soil sand content at 200 cm depth
Organic_b200Soil organic carbon at 200 cm depth
Texture_b100Soil texture class at 100 cm depth
Texture_b200Soil texture class at 200 cm depth
Table 2. The evaluation of models by the AUC.
CategoryAUCEvaluation
H. ammodendron0.920Excellent (>0.9)
H. persicum0.960Excellent (>0.9)
C. deserticola (AH)0.951Excellent (>0.9)
C. deserticola (HO)0.922Excellent (>0.9)
Table 3. The niche range overlap values of hosts and two strategies; threshold value is 0.65.
CategoryH. ammodendronH. persicumAHHO
H. ammodendron1
H. persicum0.02161
AH0.5400.0341
HO0.8760.2910.7981
Publisher’s Note: MDPI stays neutral with regard to jurisdictional claims in published maps and institutional affiliations.

