
Hydraulic Function Analysis of Conifer Xylem Based on a Model Incorporating Tracheids, Bordered Pits, and Cross-Field Pits

Abstract
:1. Introduction
2. Materials and Methods
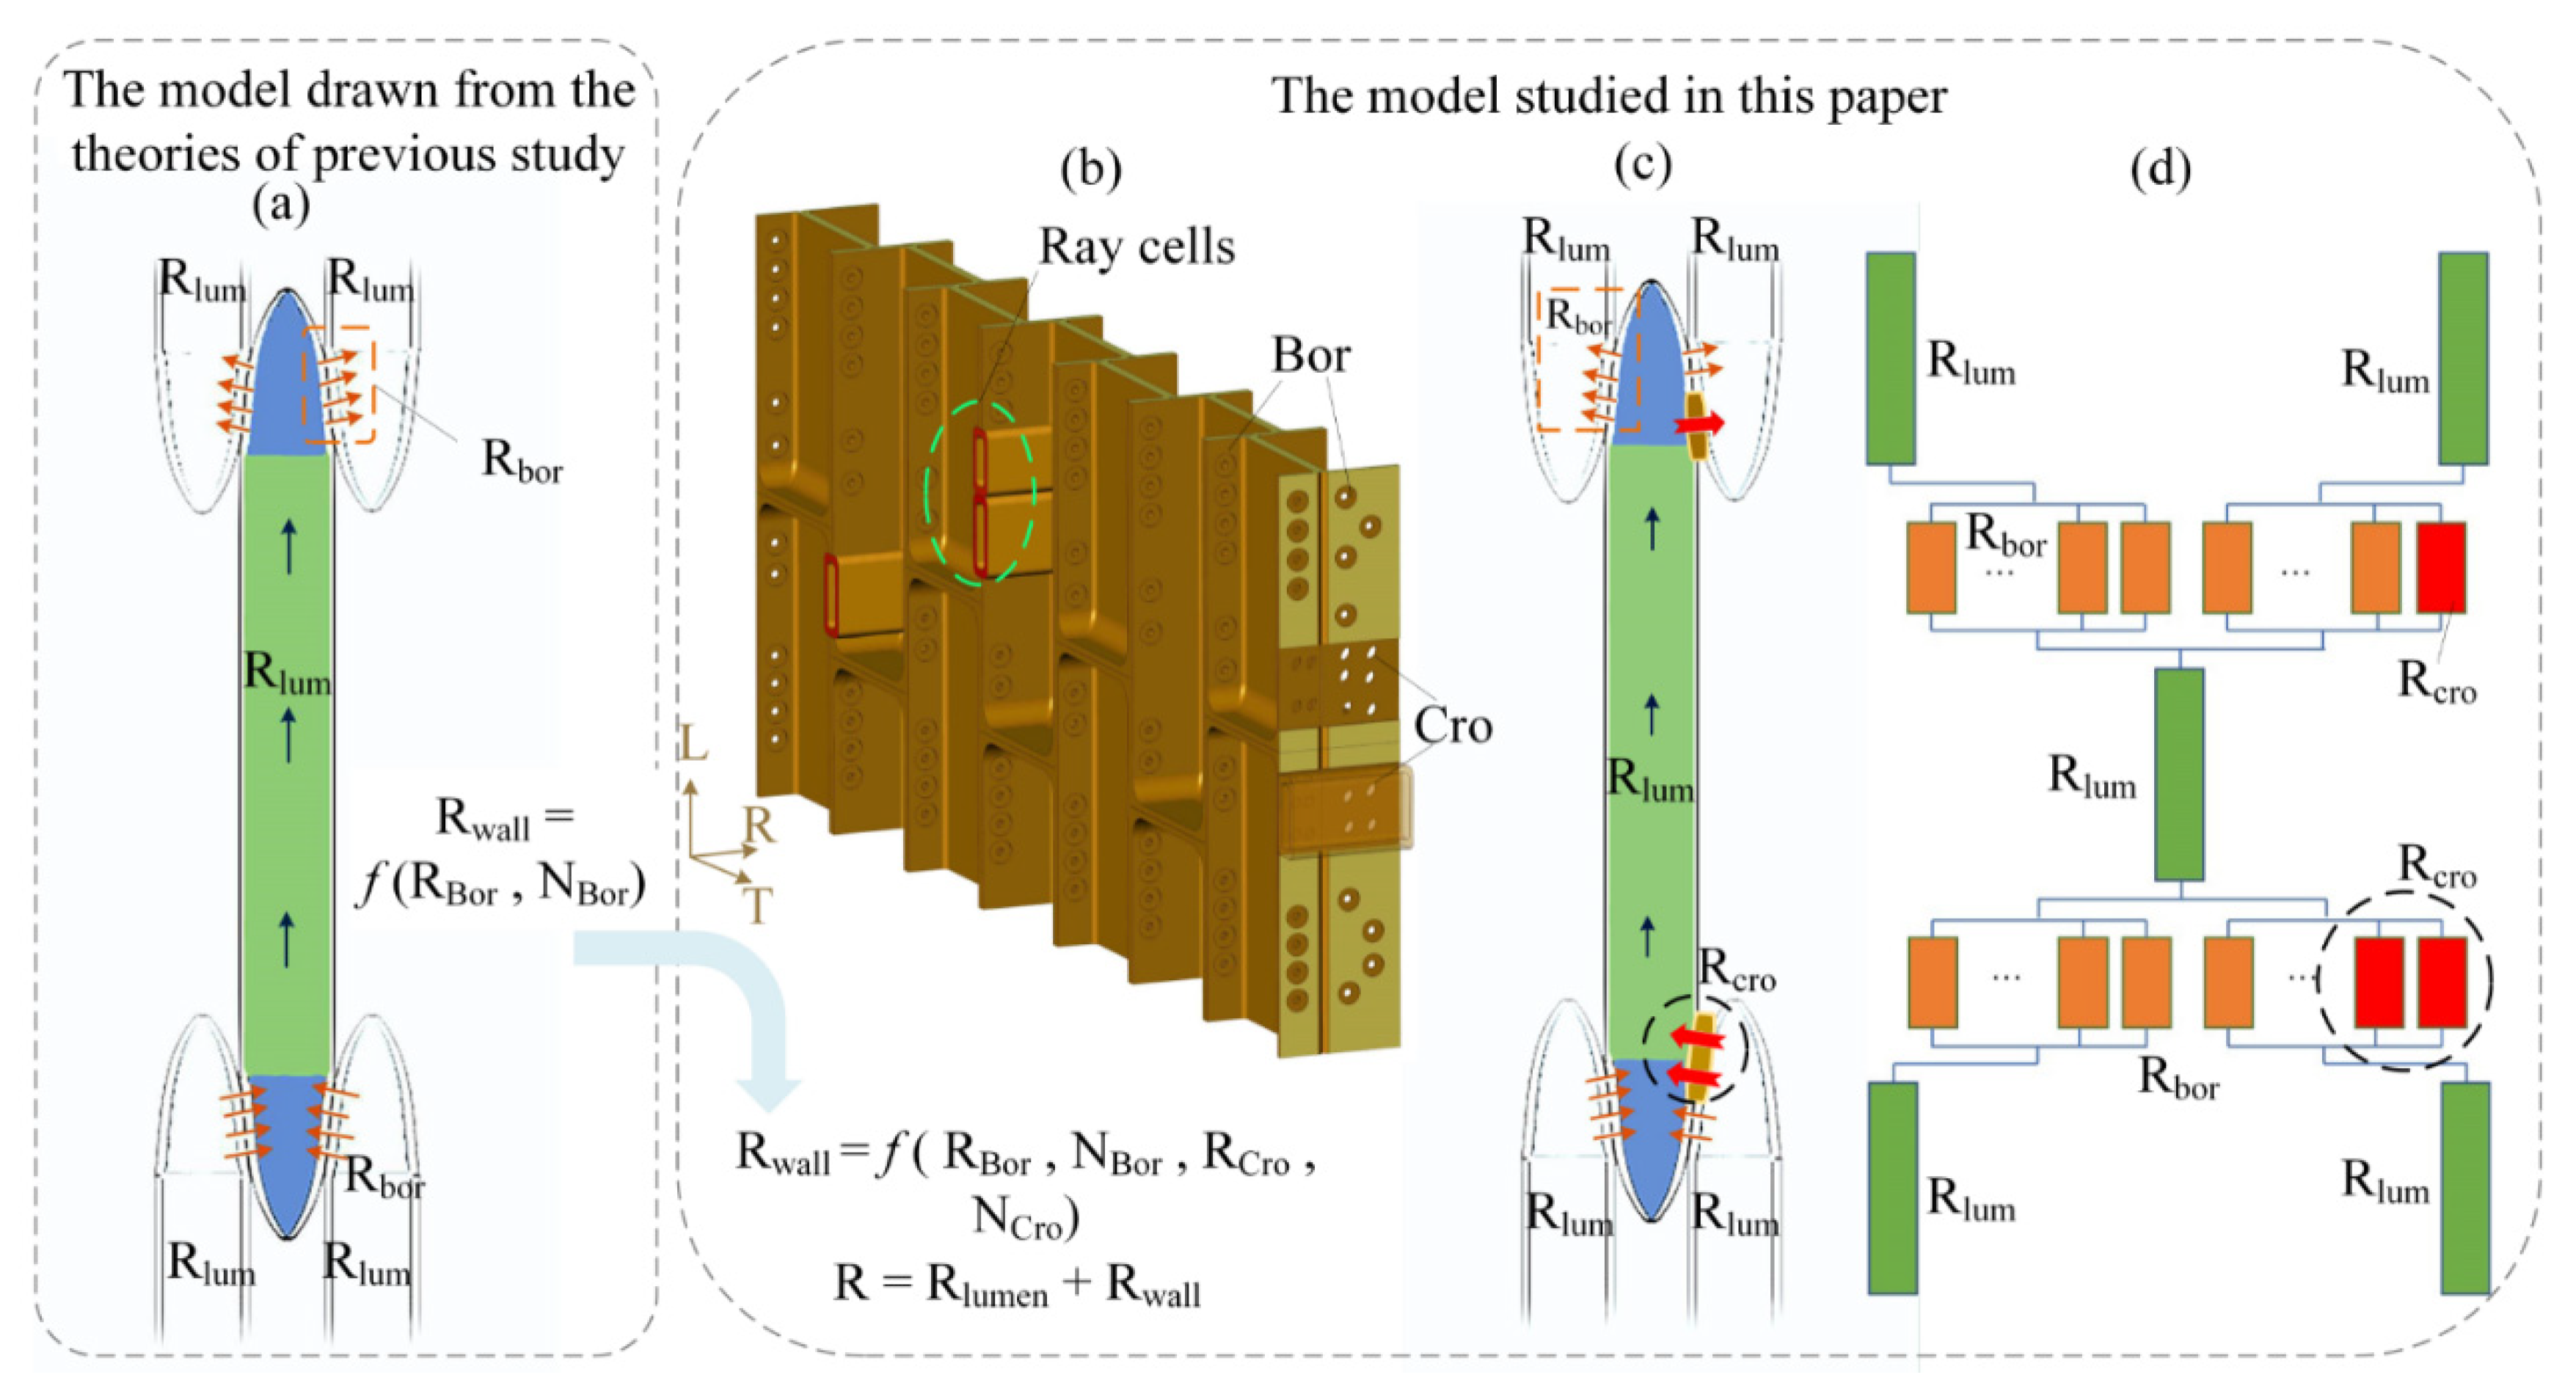
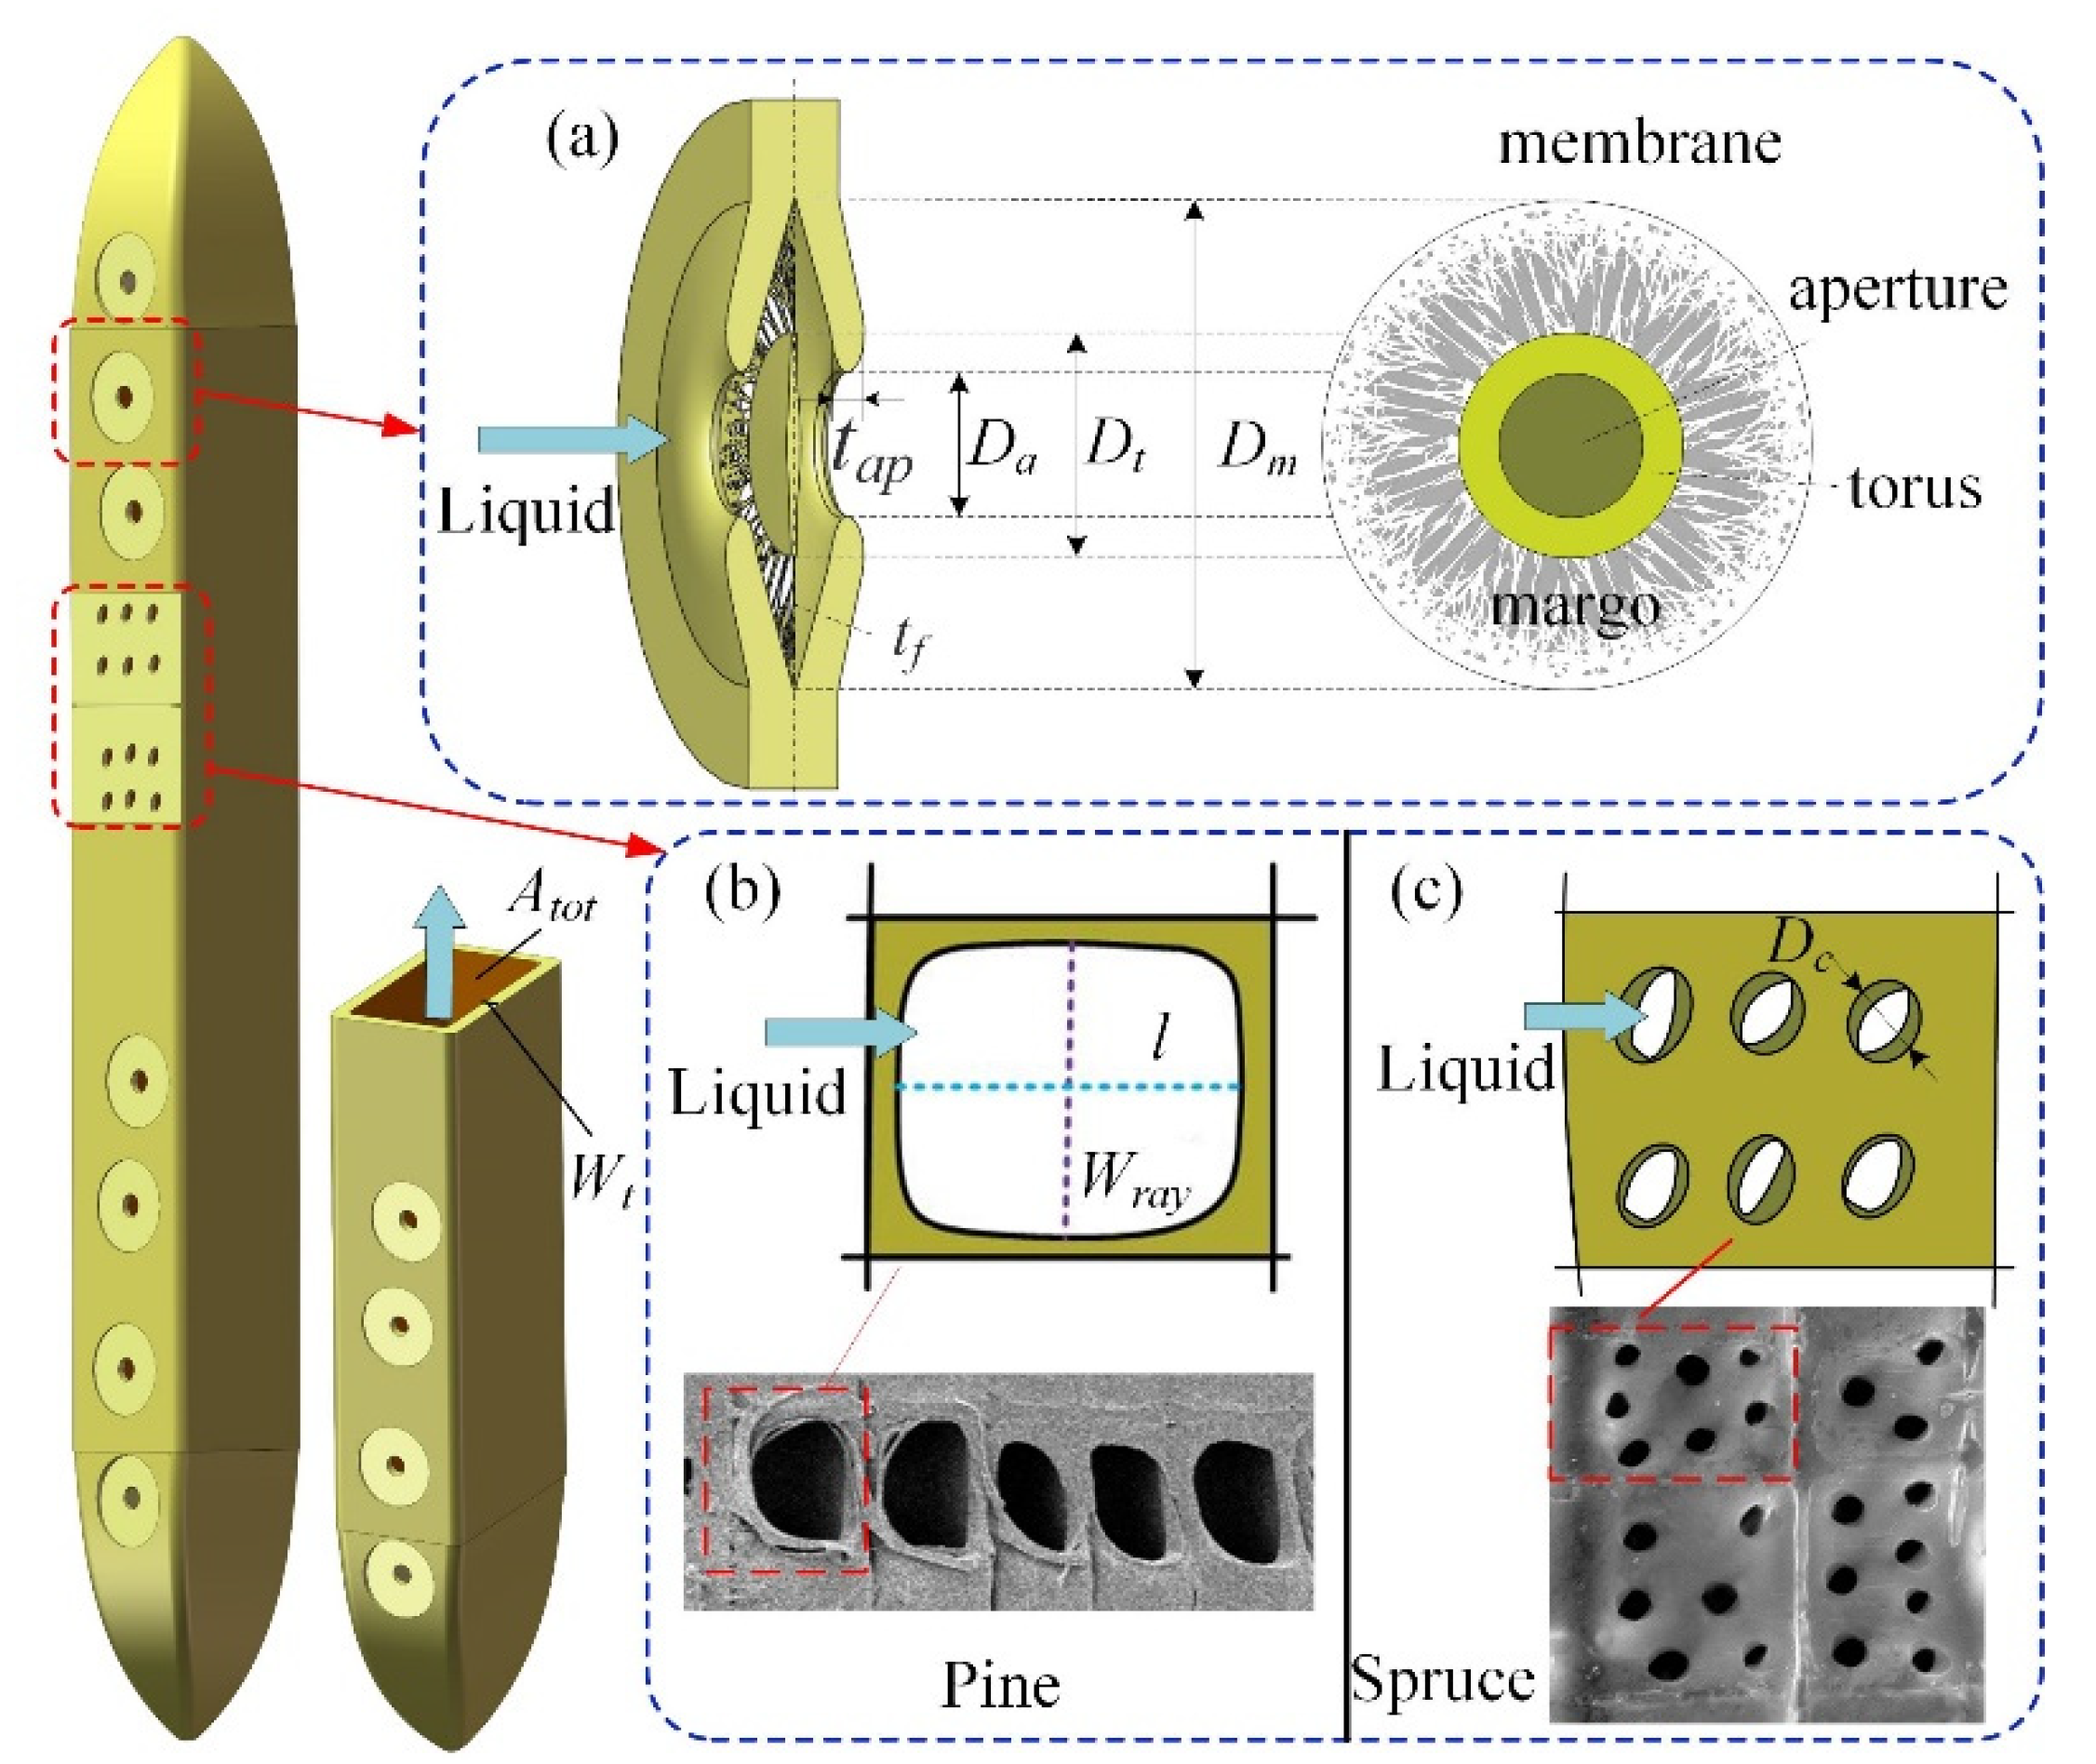
2.1. Theoretical Approach
2.2. Material
3. Results
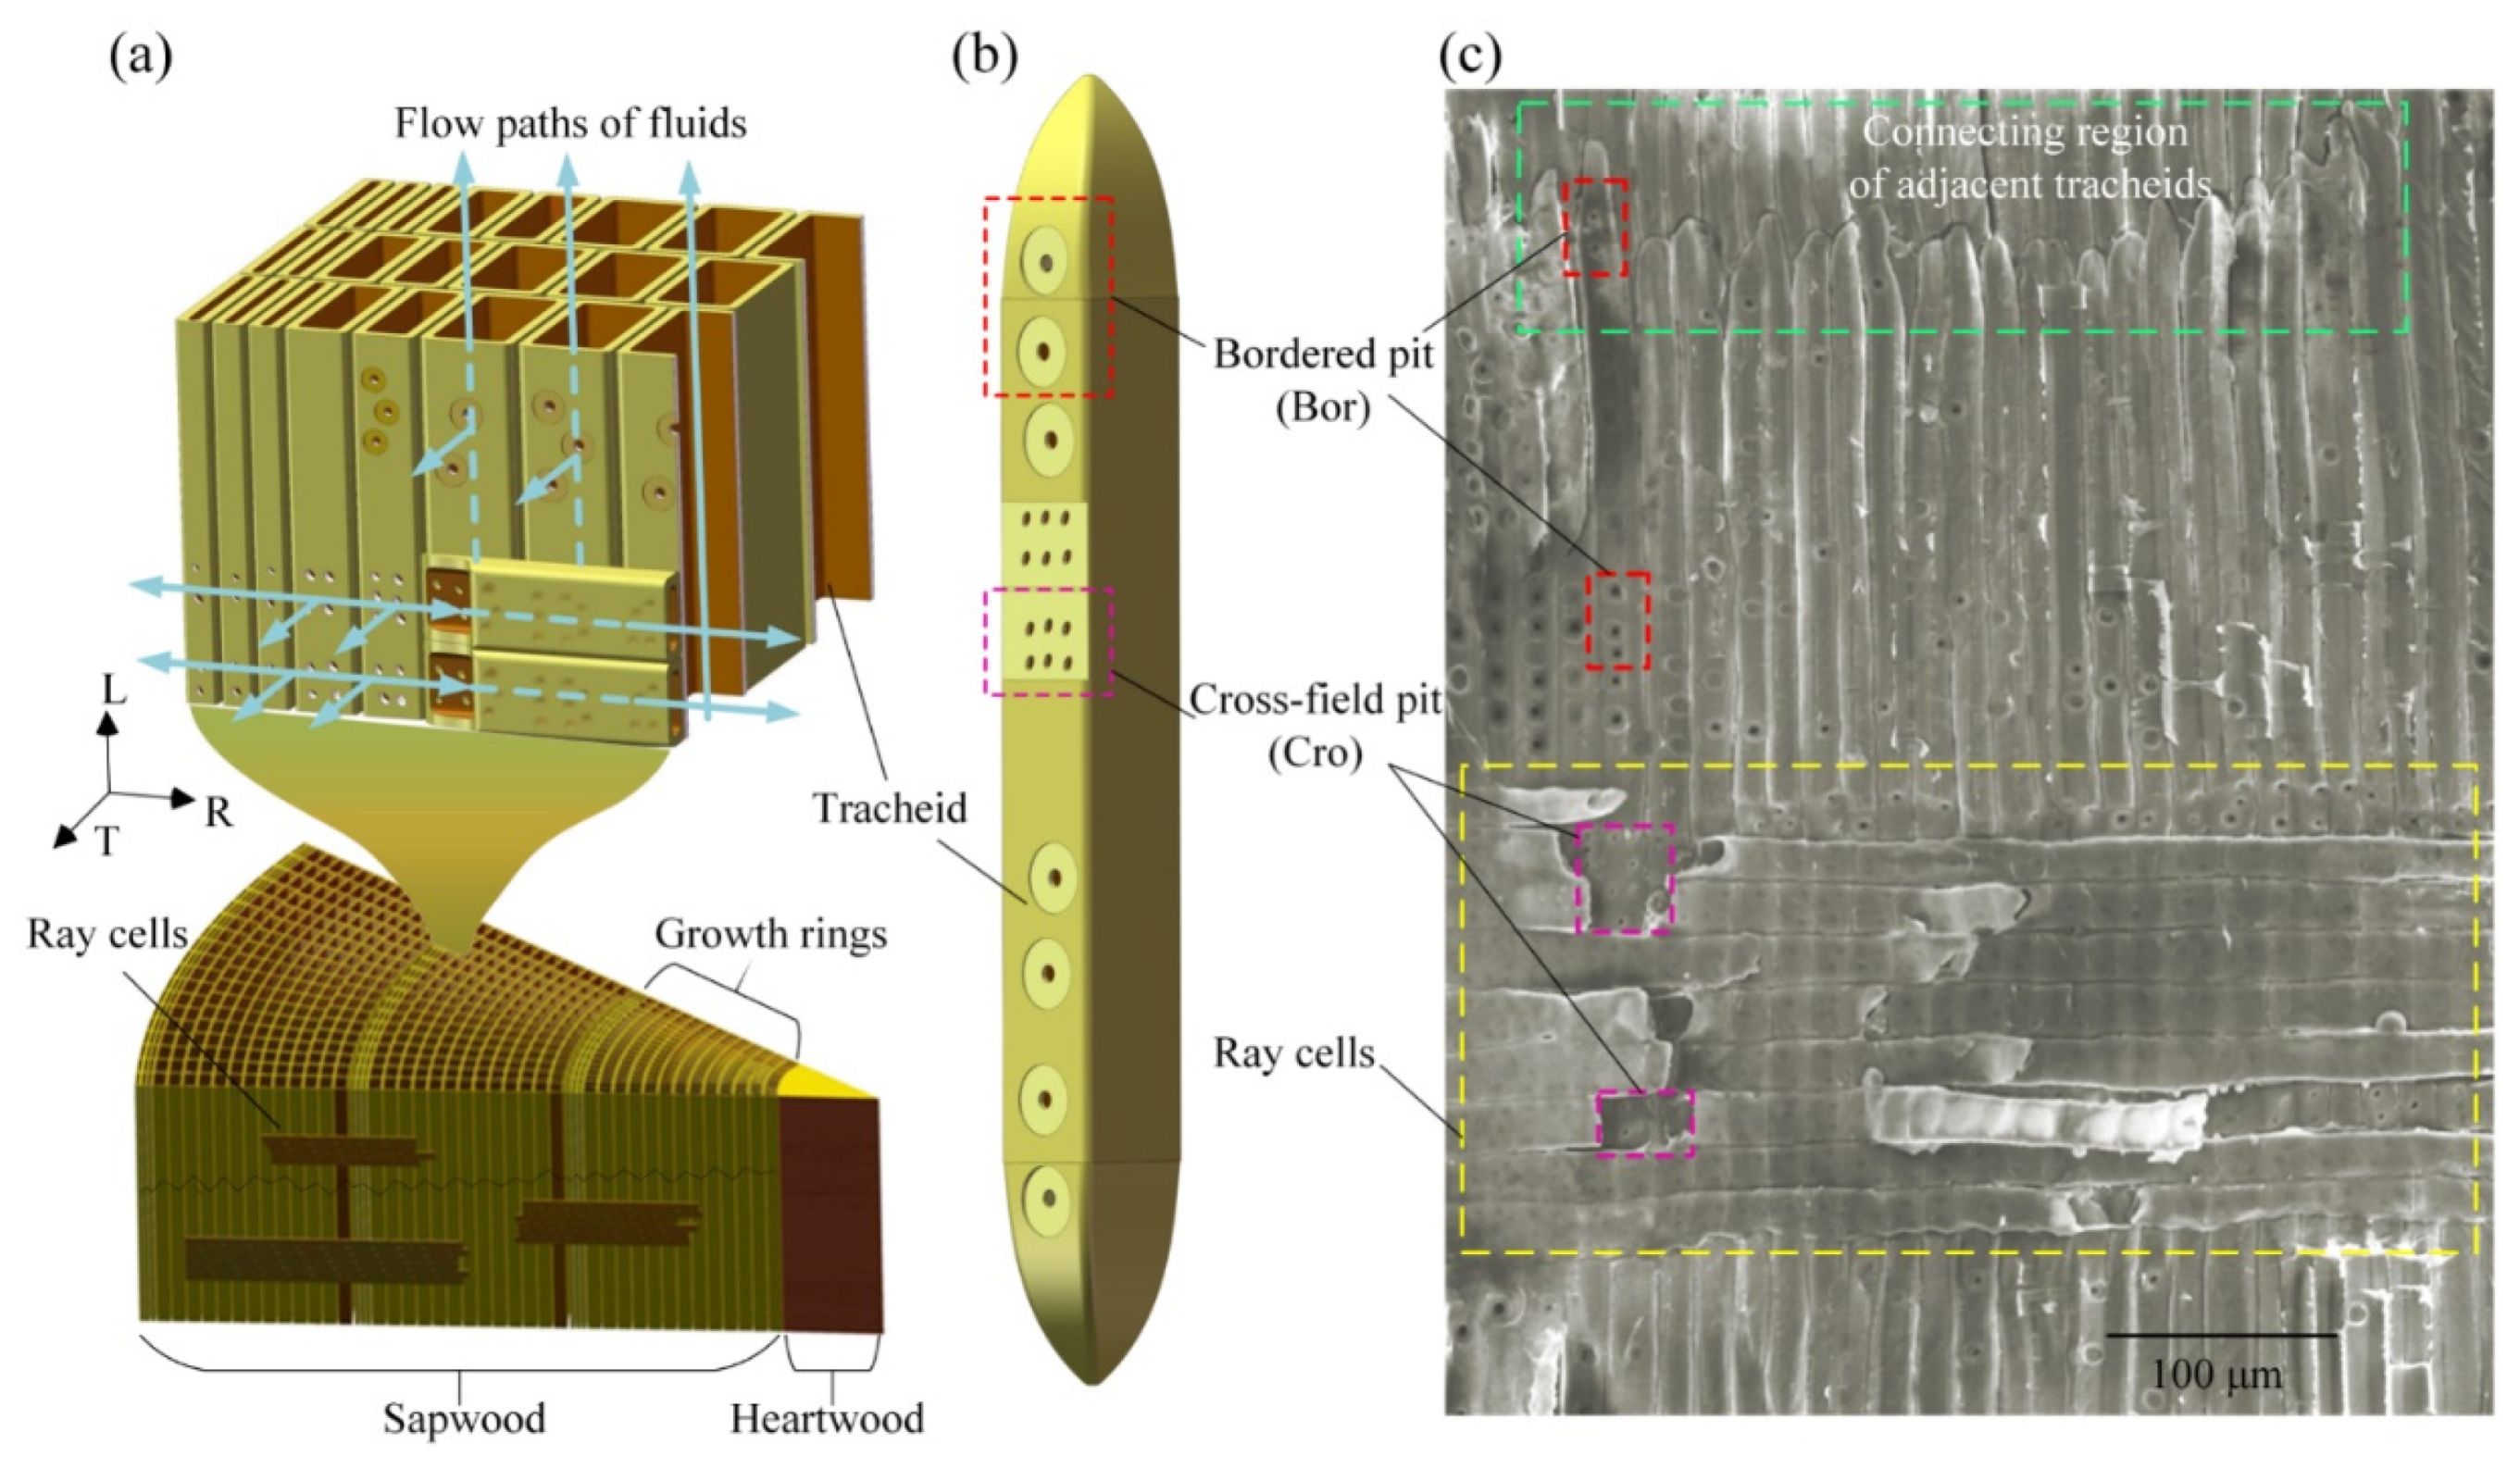
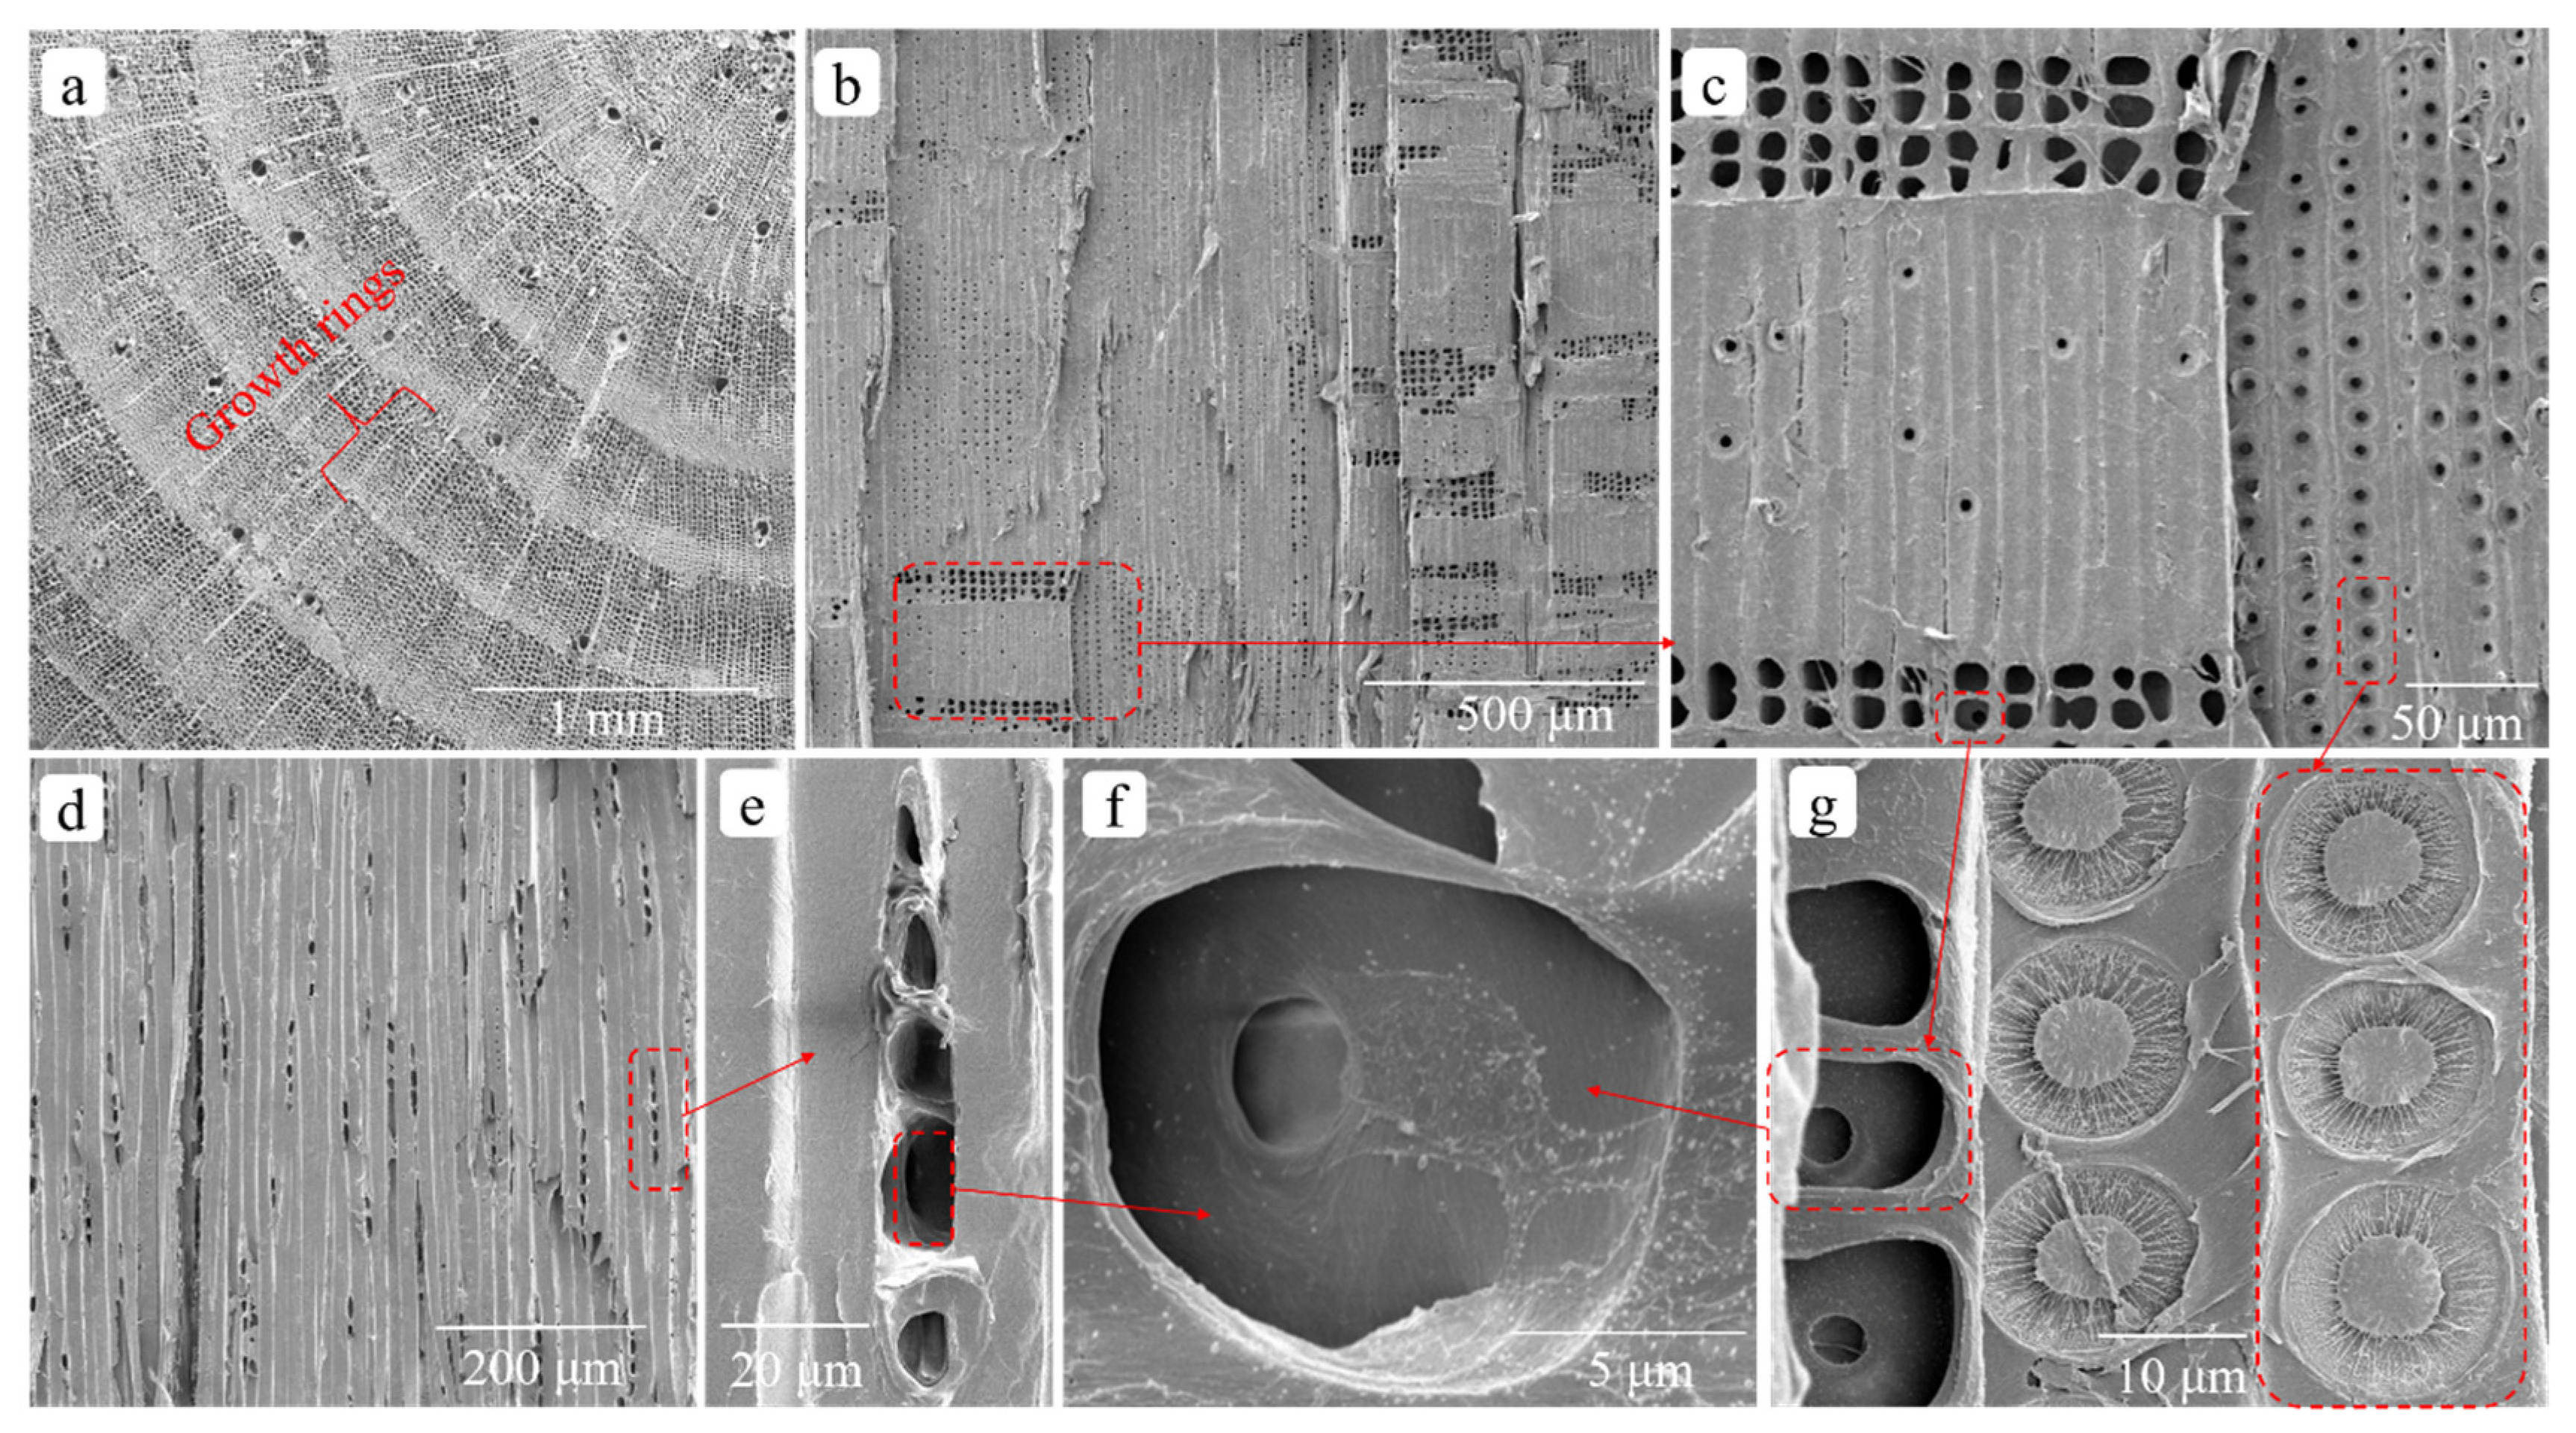
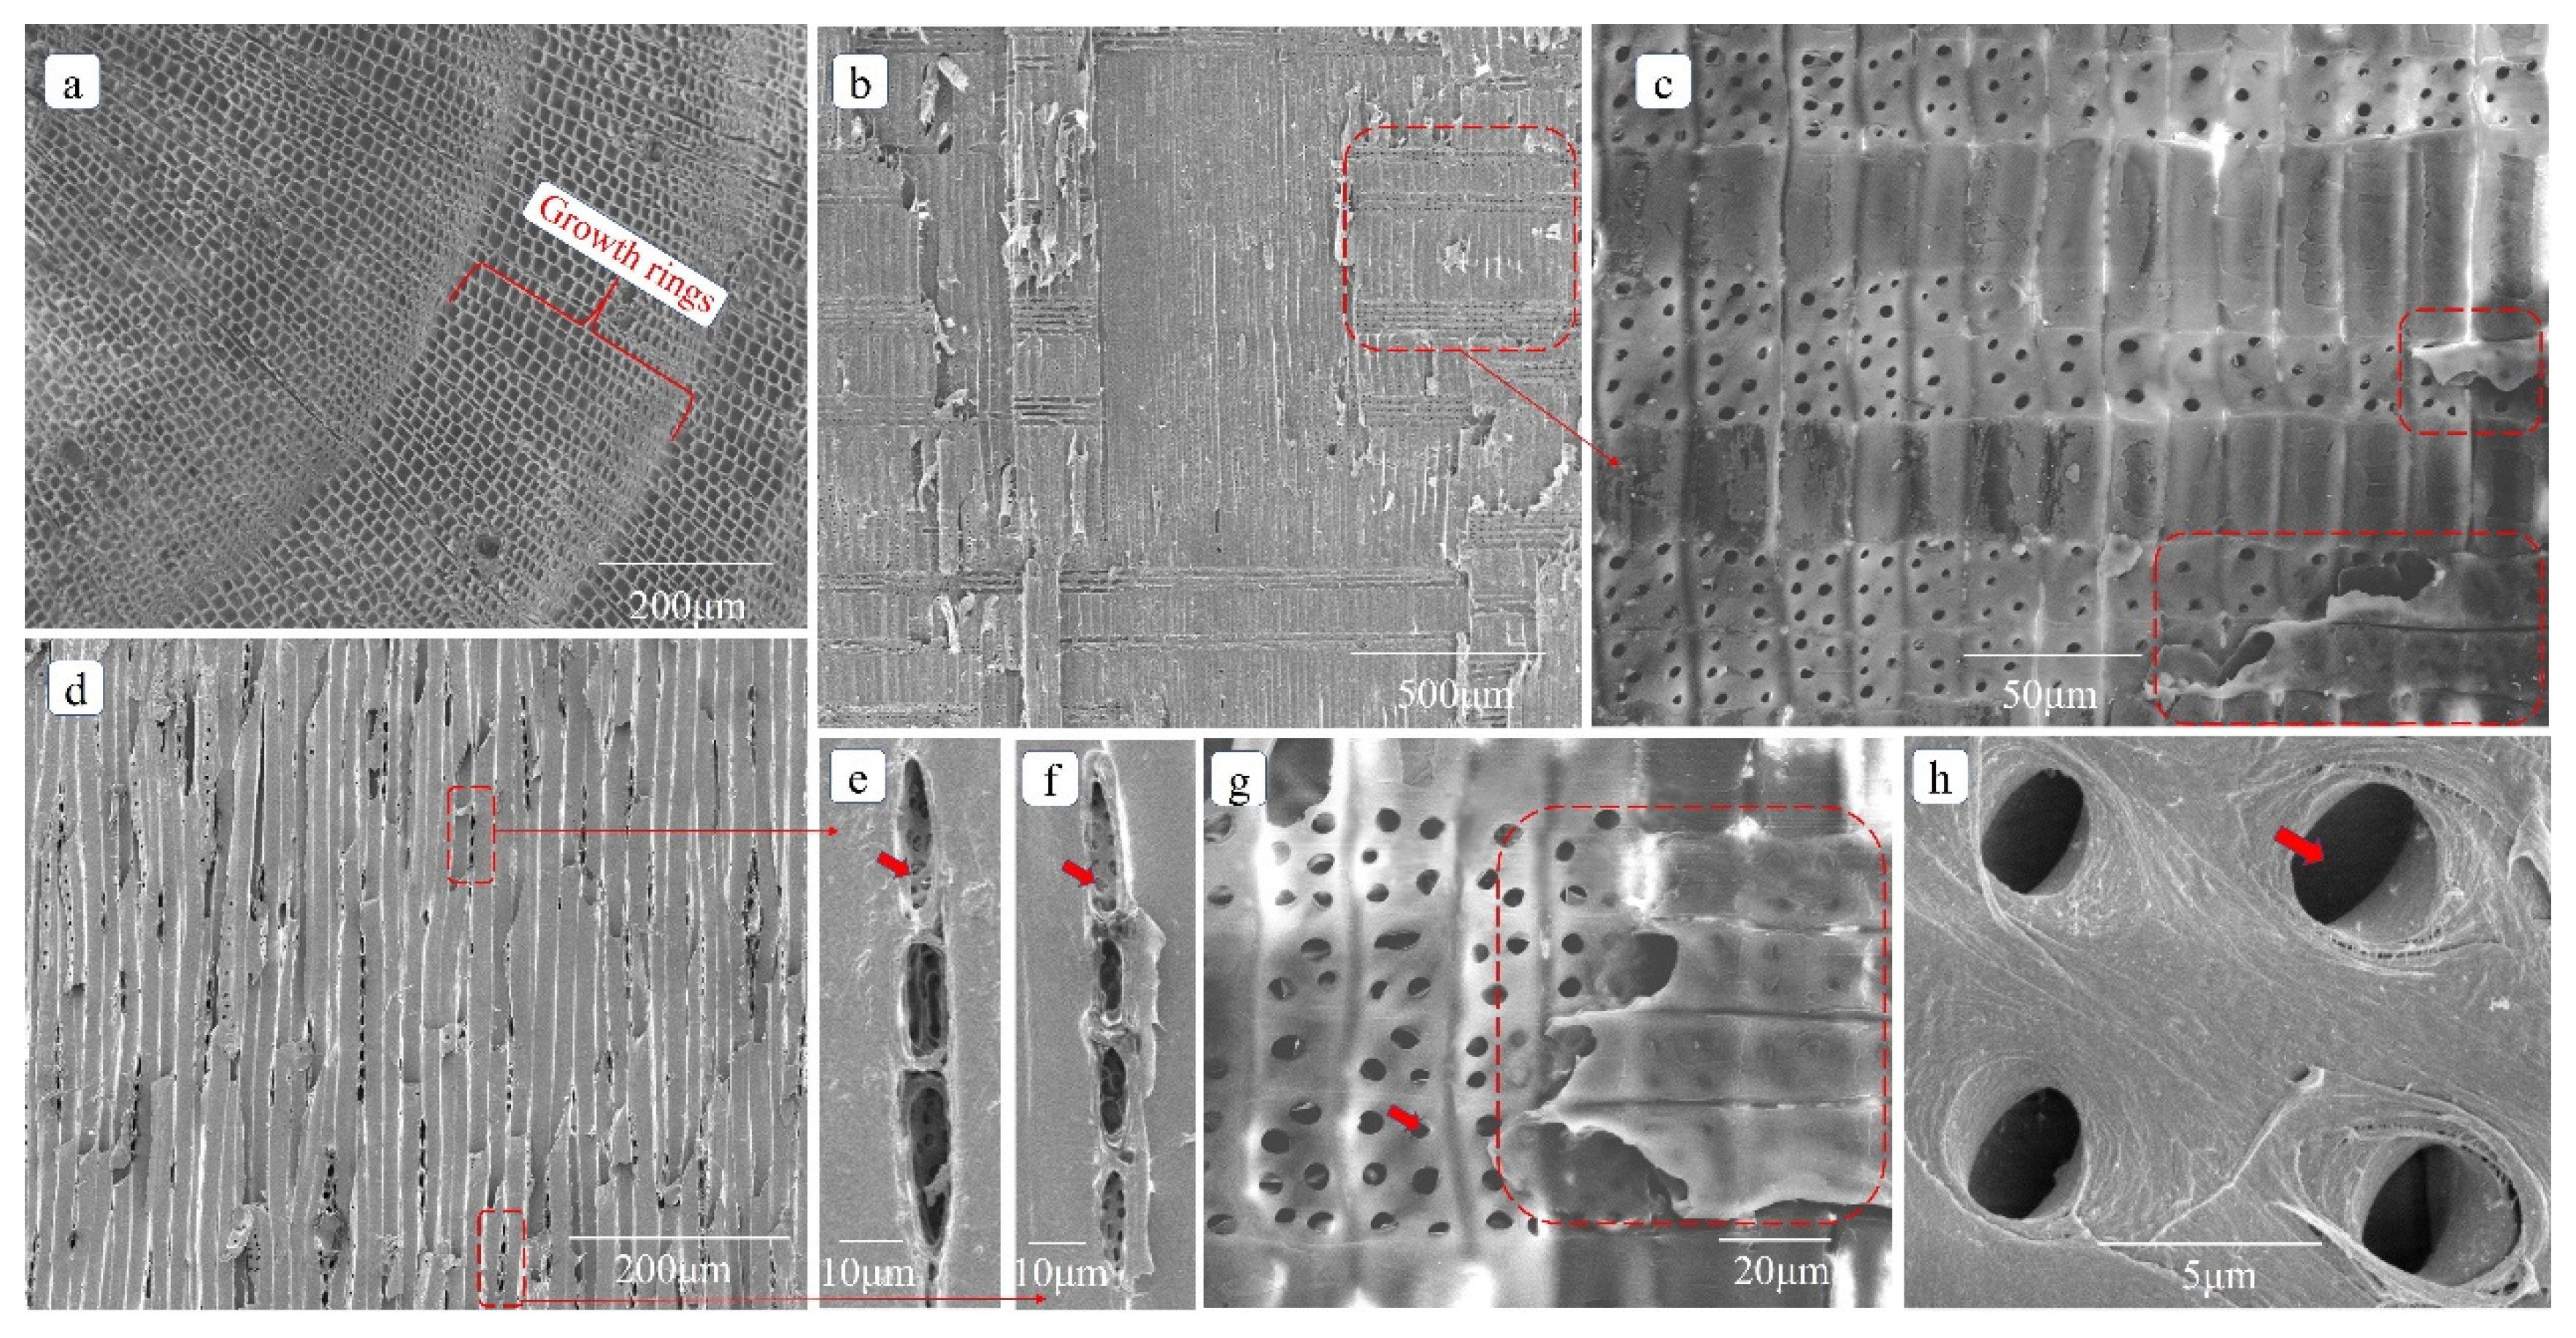
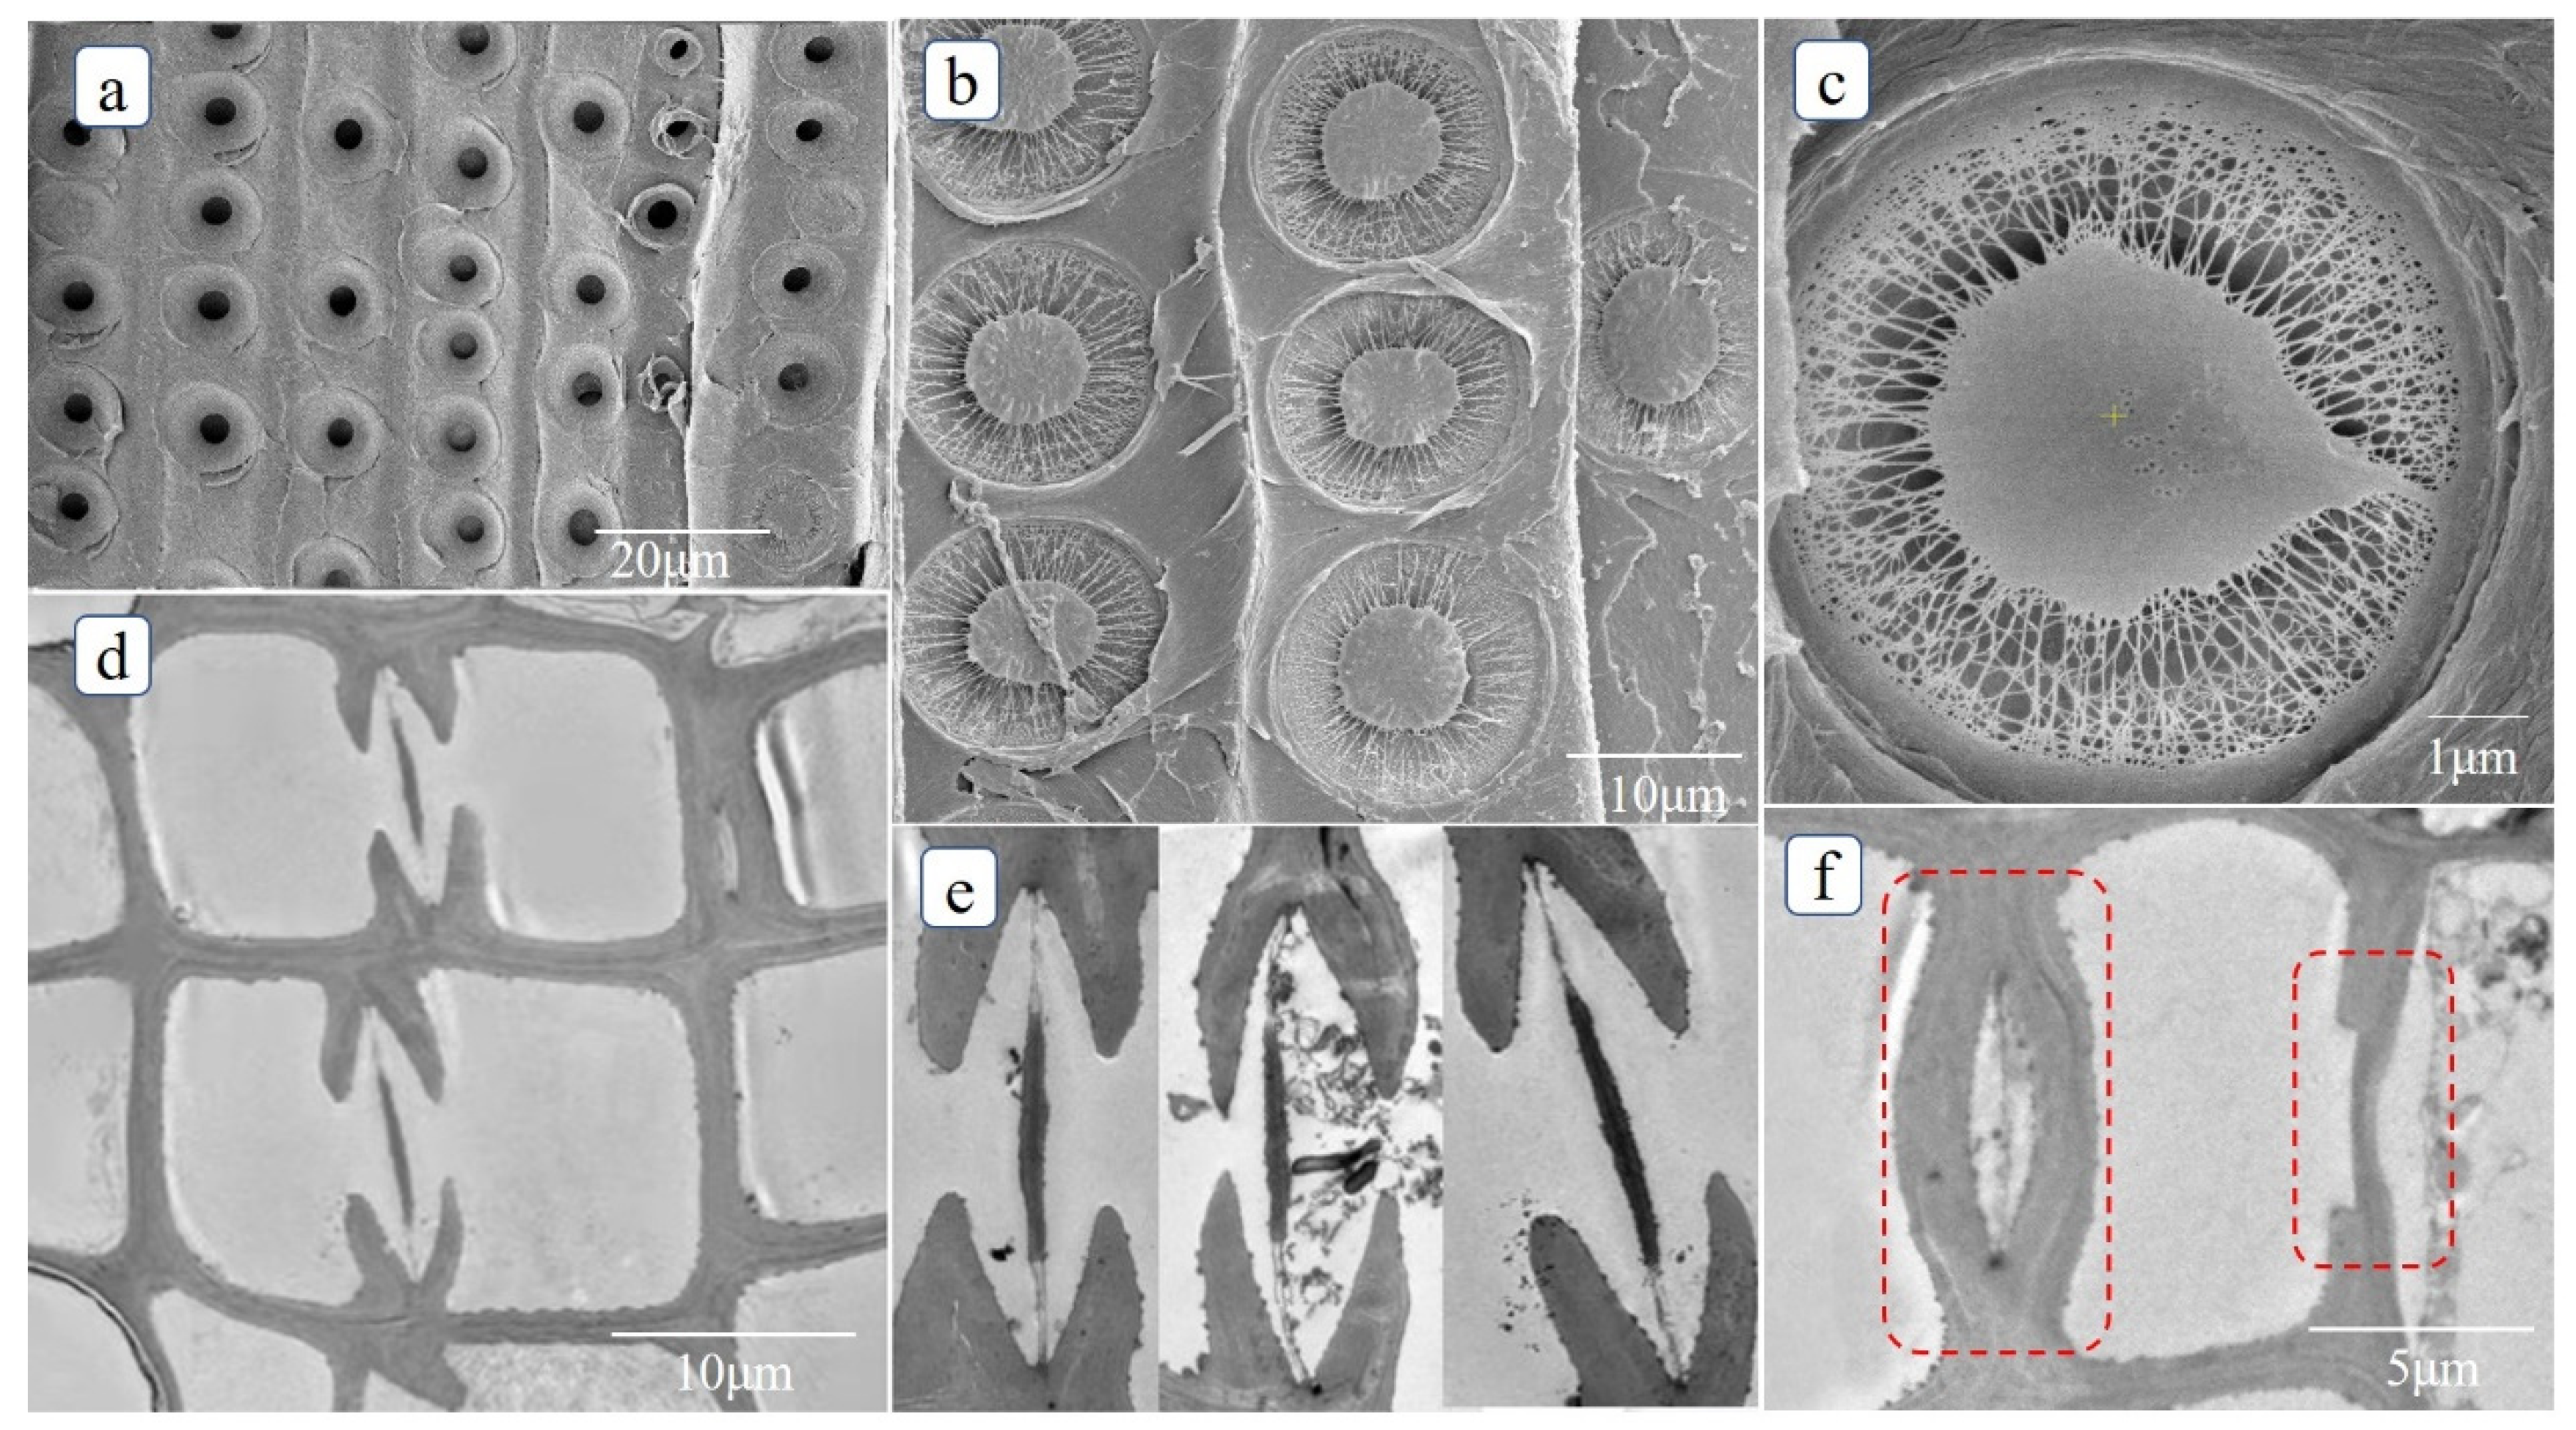
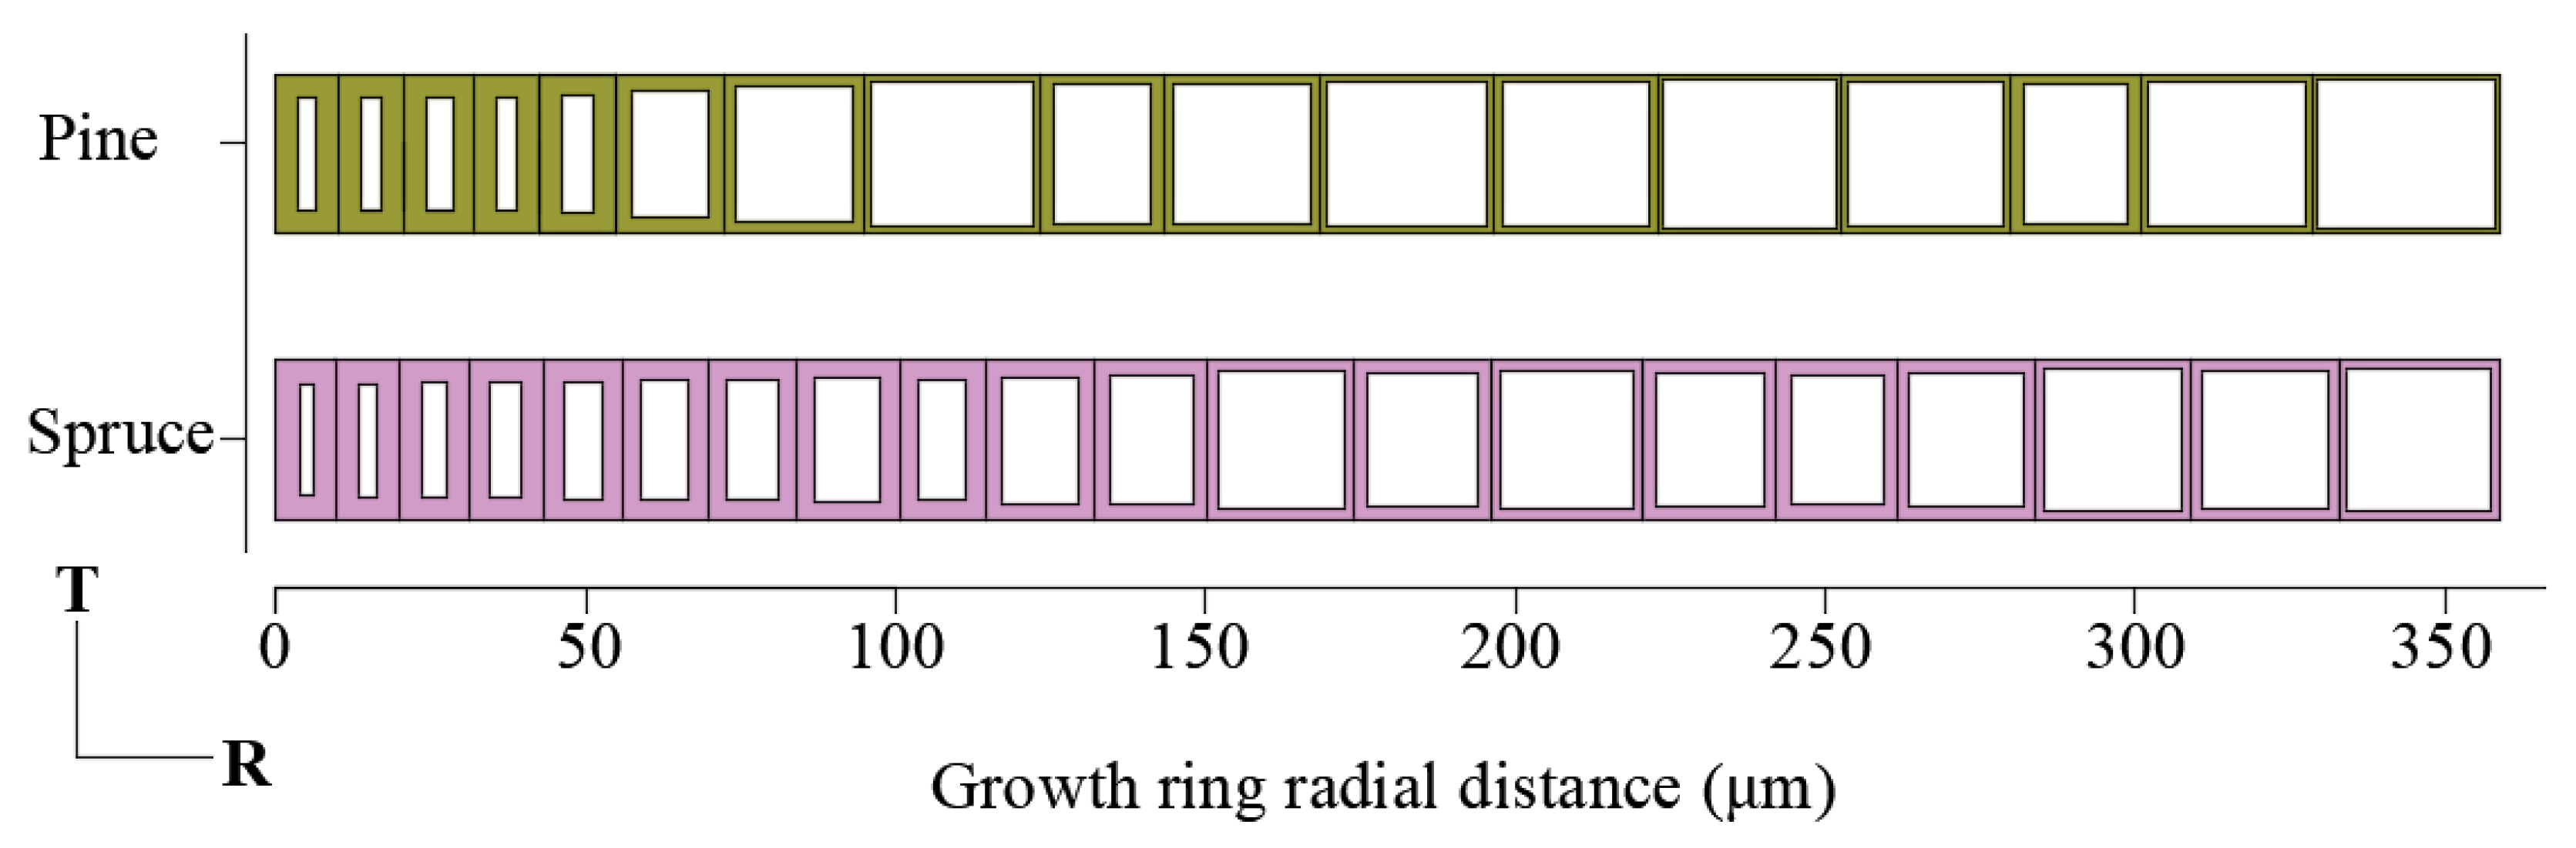
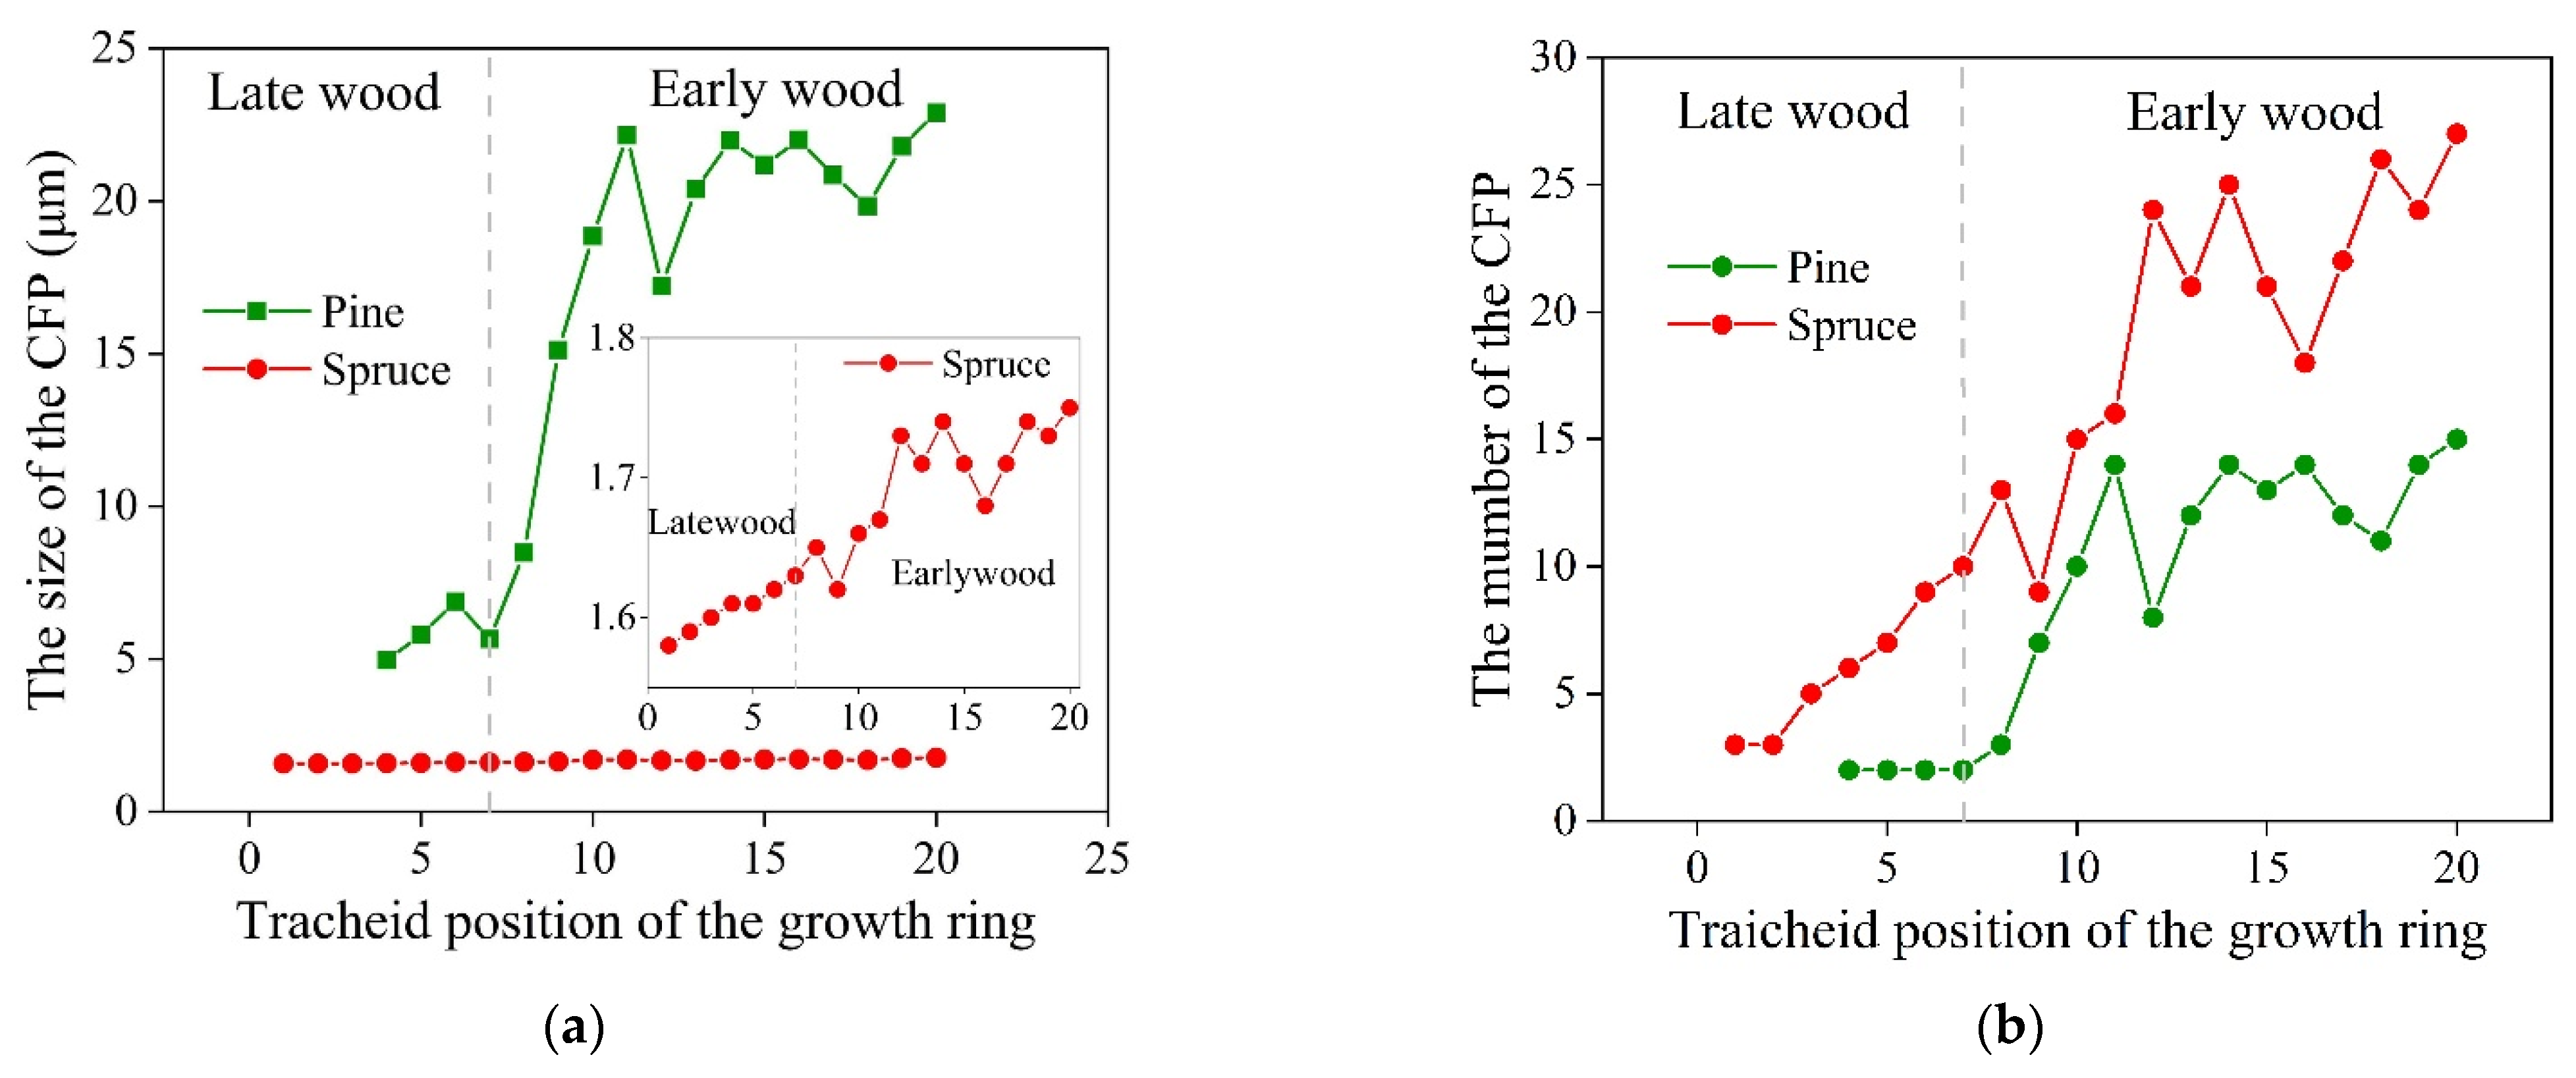
3.1. Xylem Anatomy of Pinus sylvestris L. var. mongholica Litv. and Picea koraiensis Nakai
3.2. Parameters Used in the Model and Range of Measured Values
3.3. Input Data and Model Output
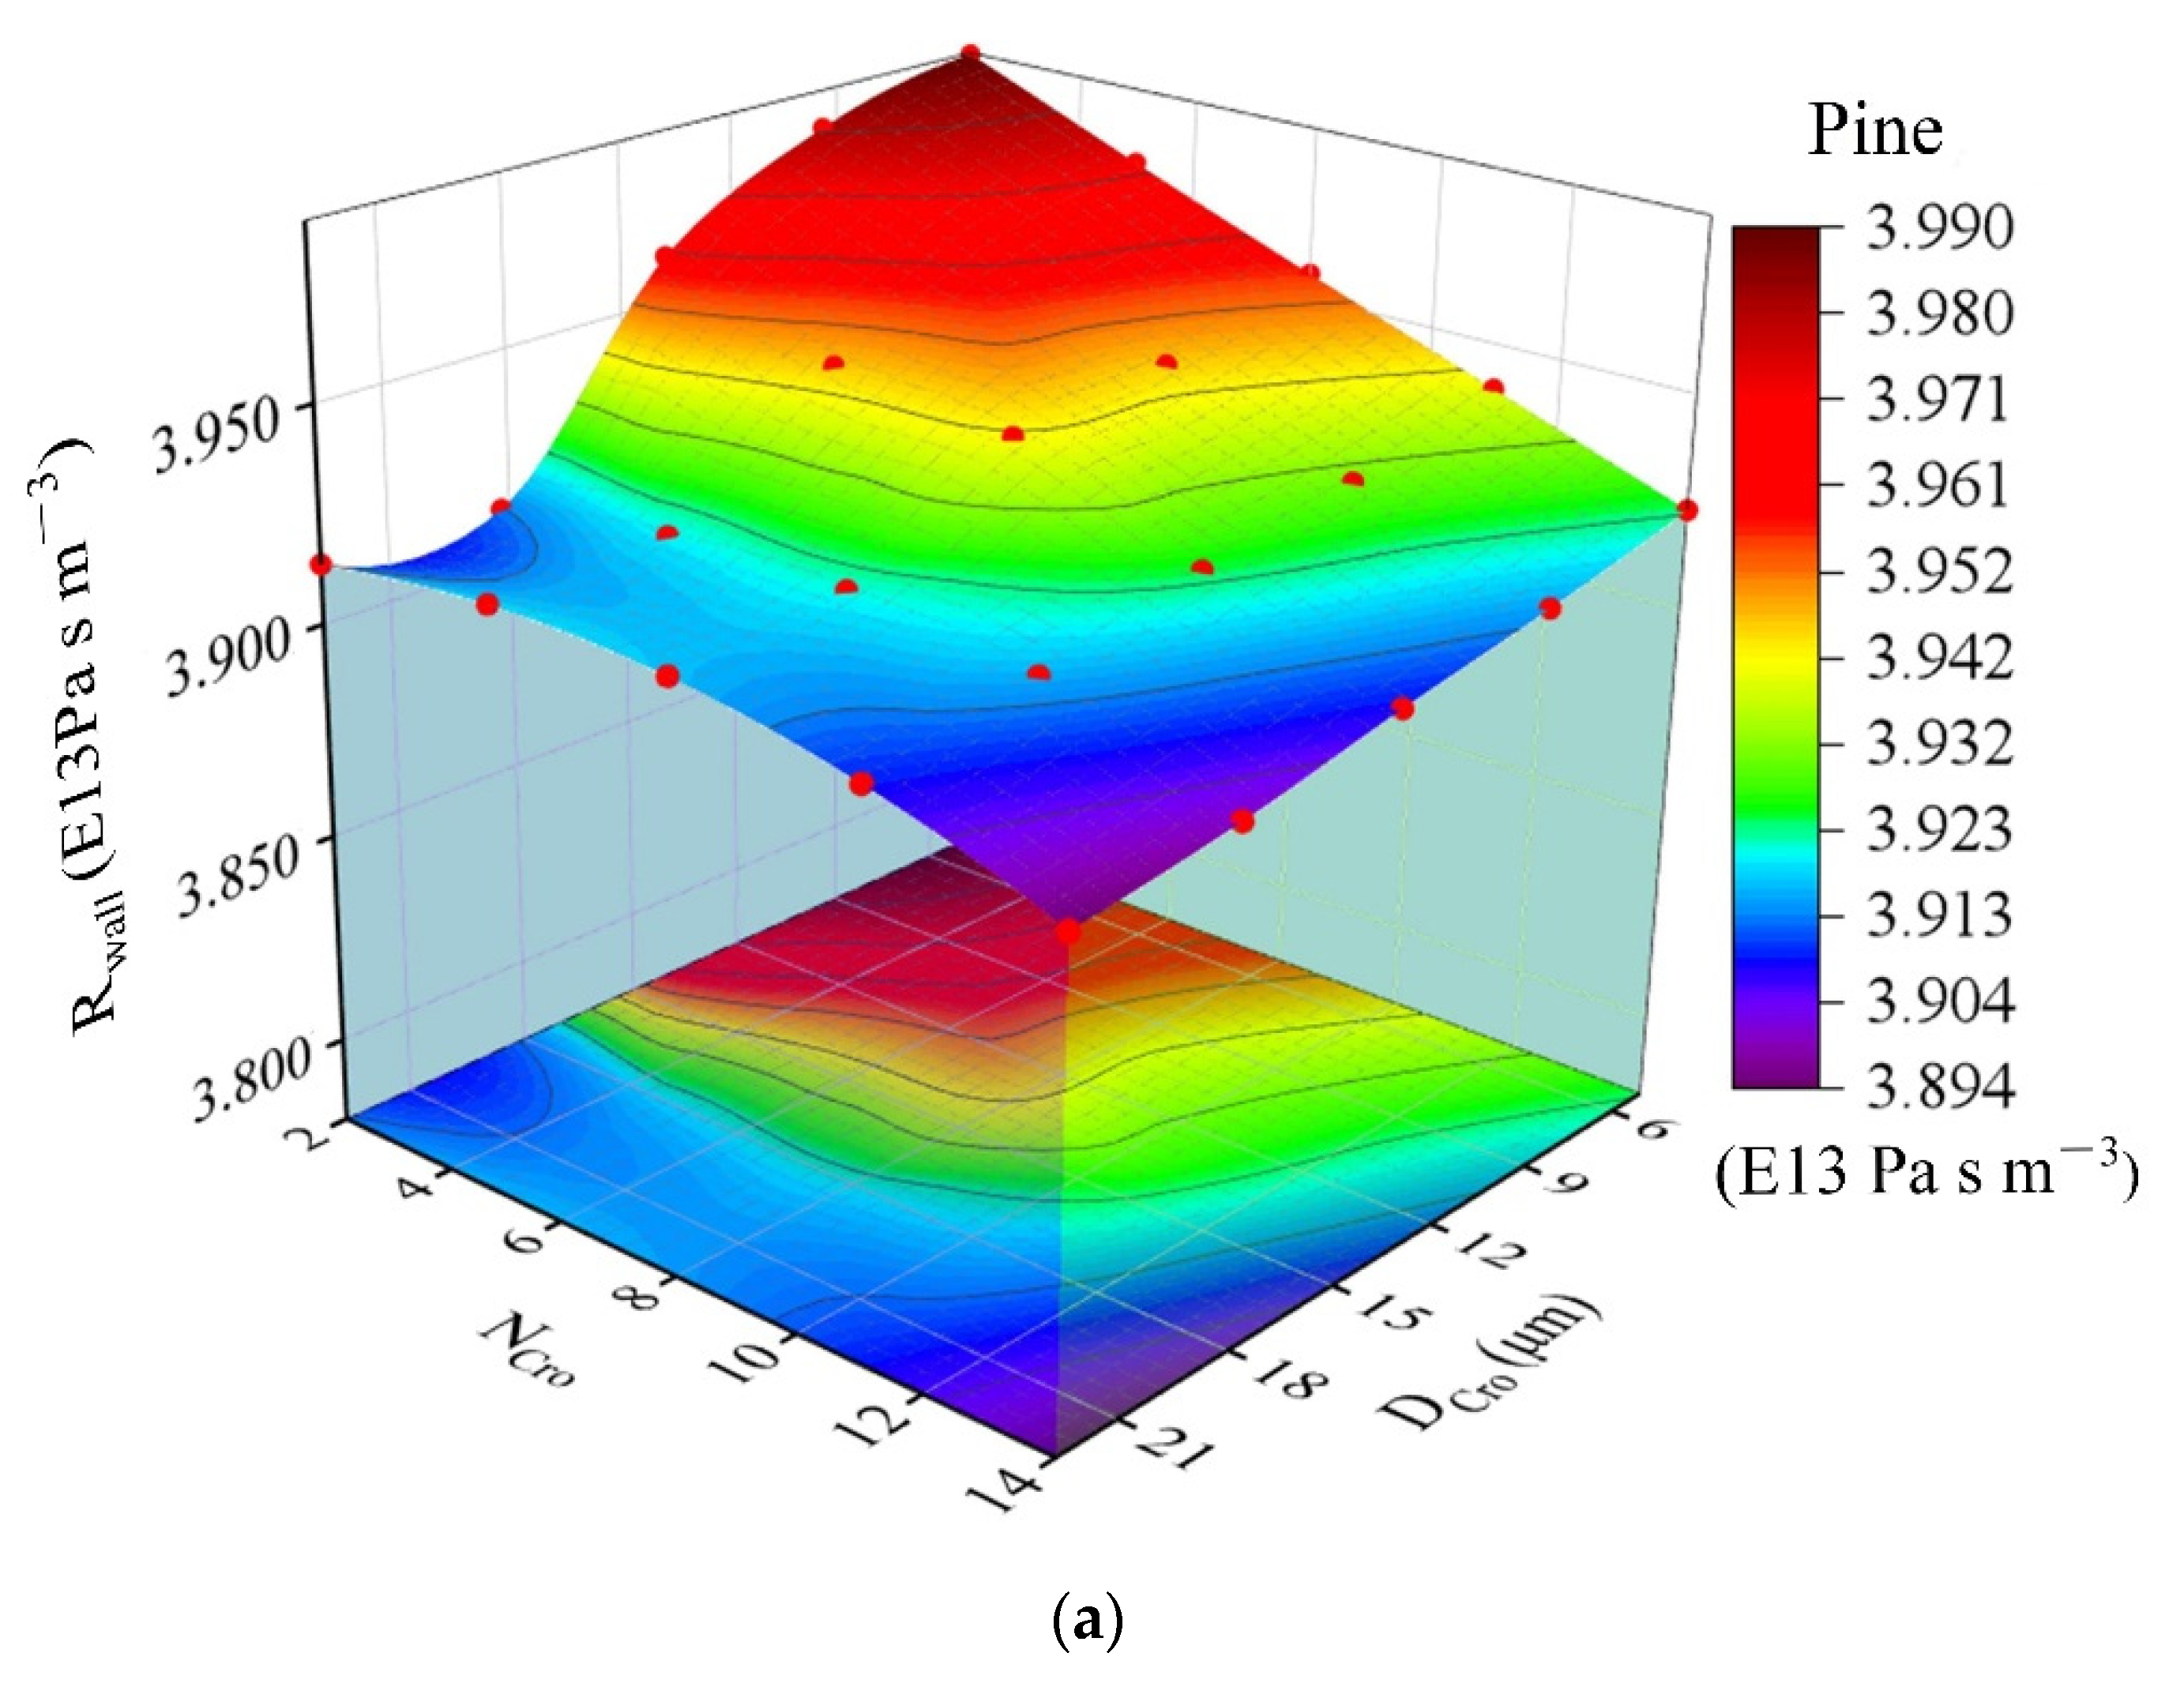
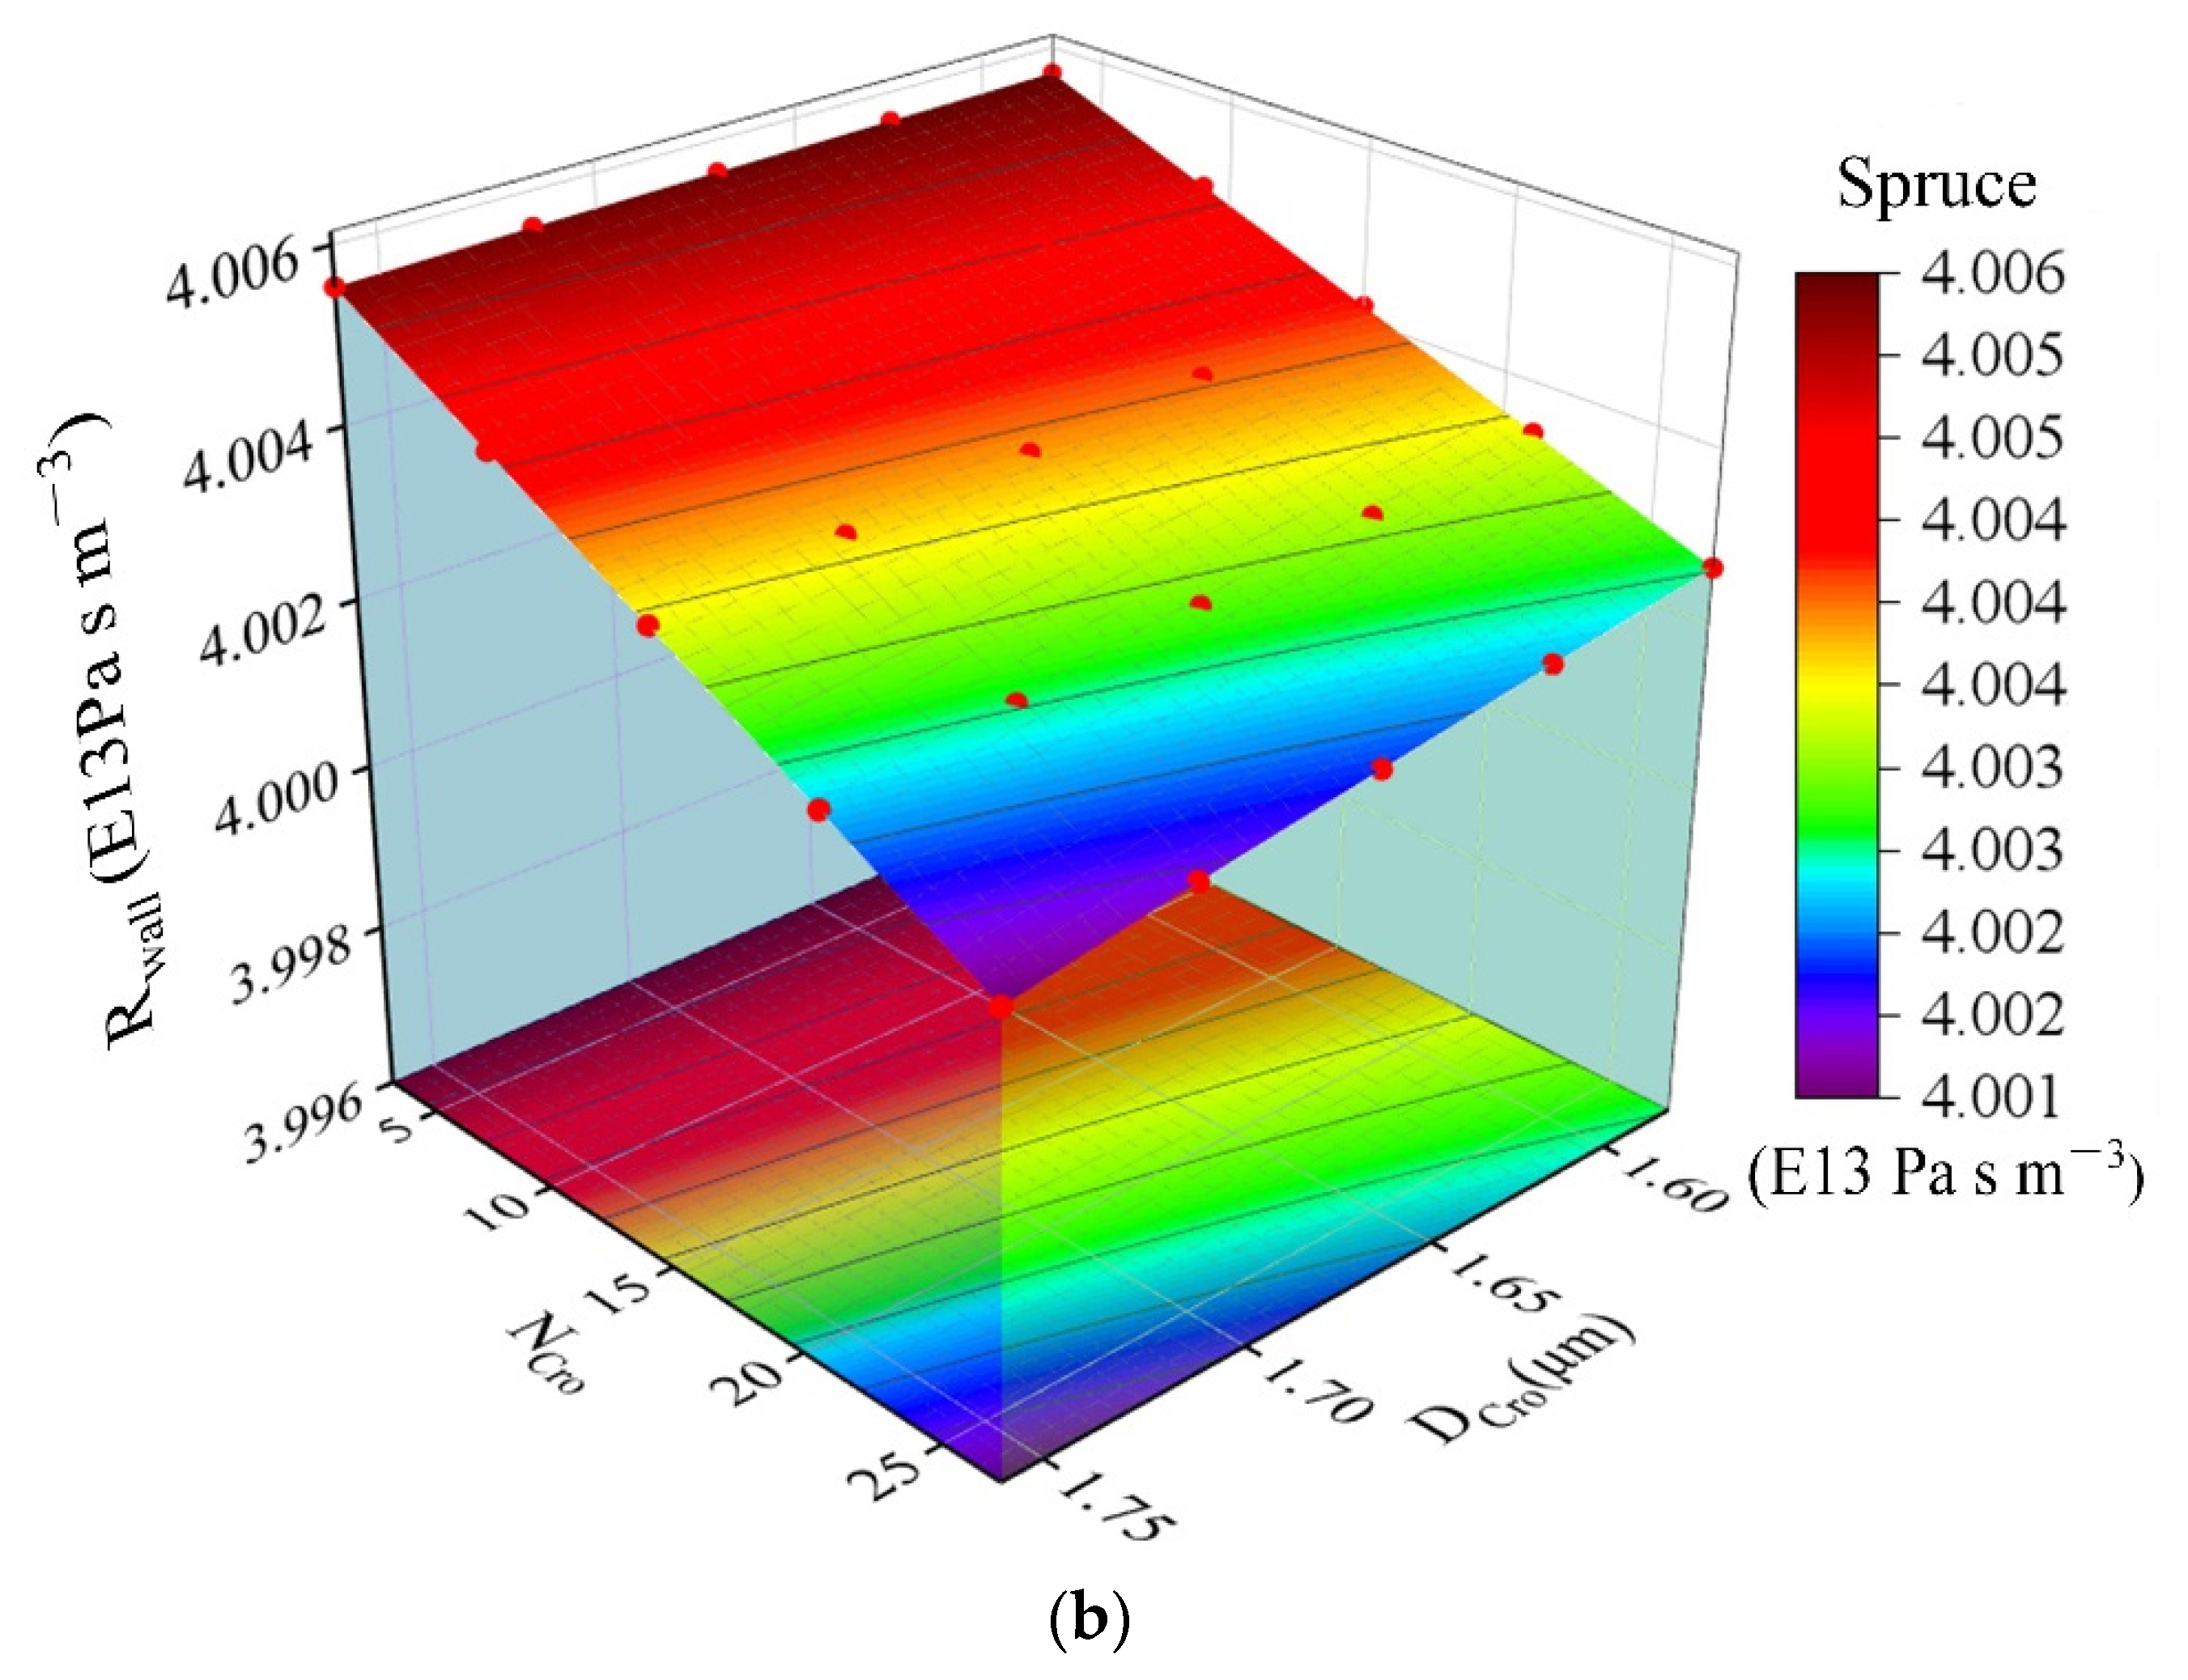
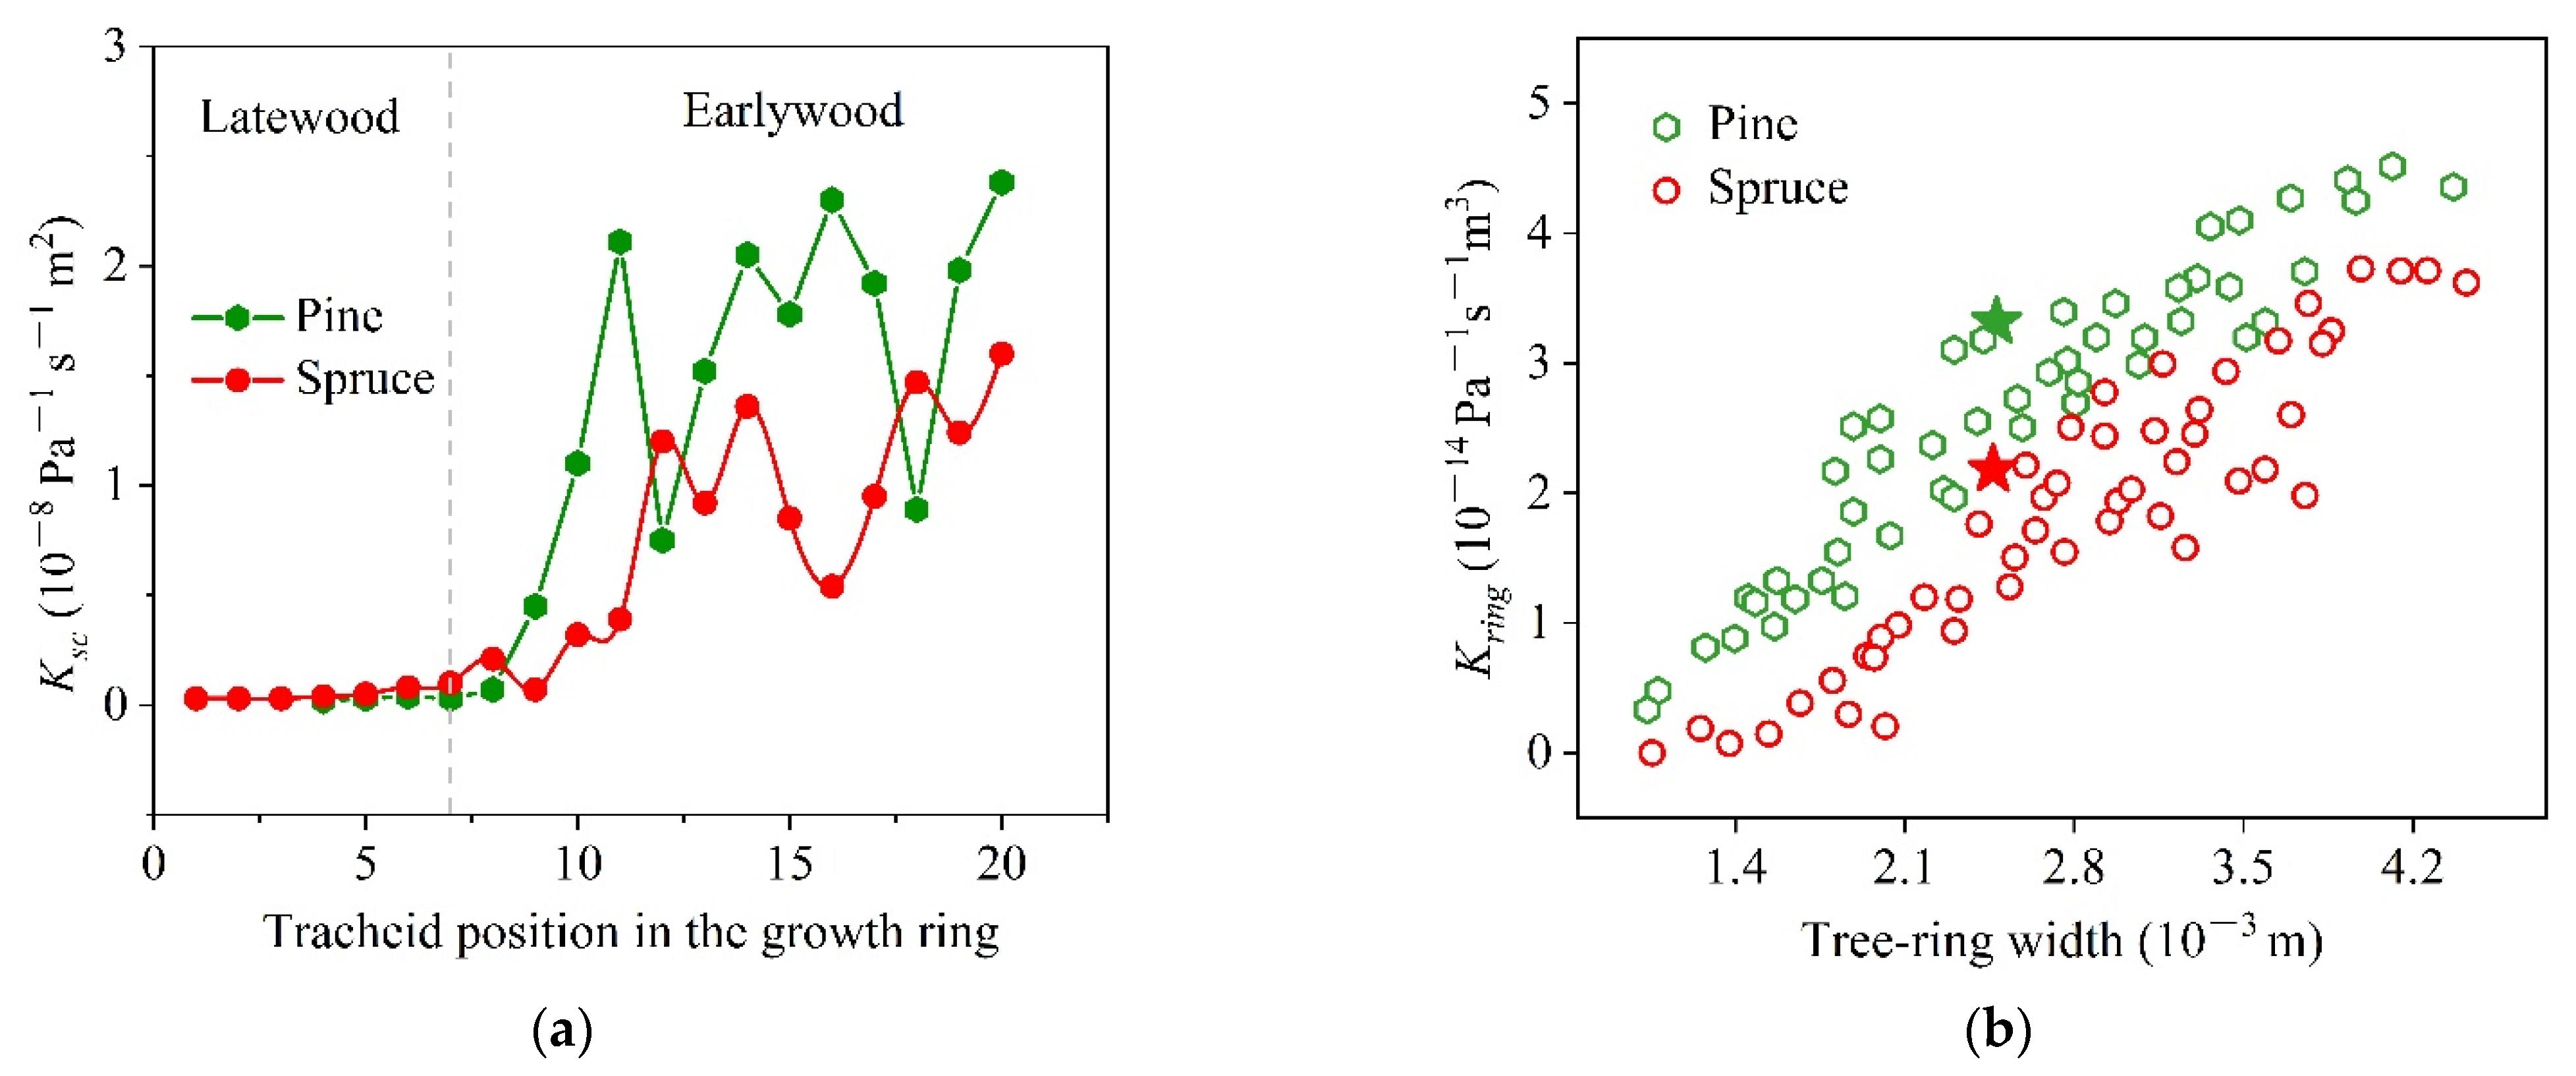
3.4. Application of the New Tissue Model to the Pine and the Spruce
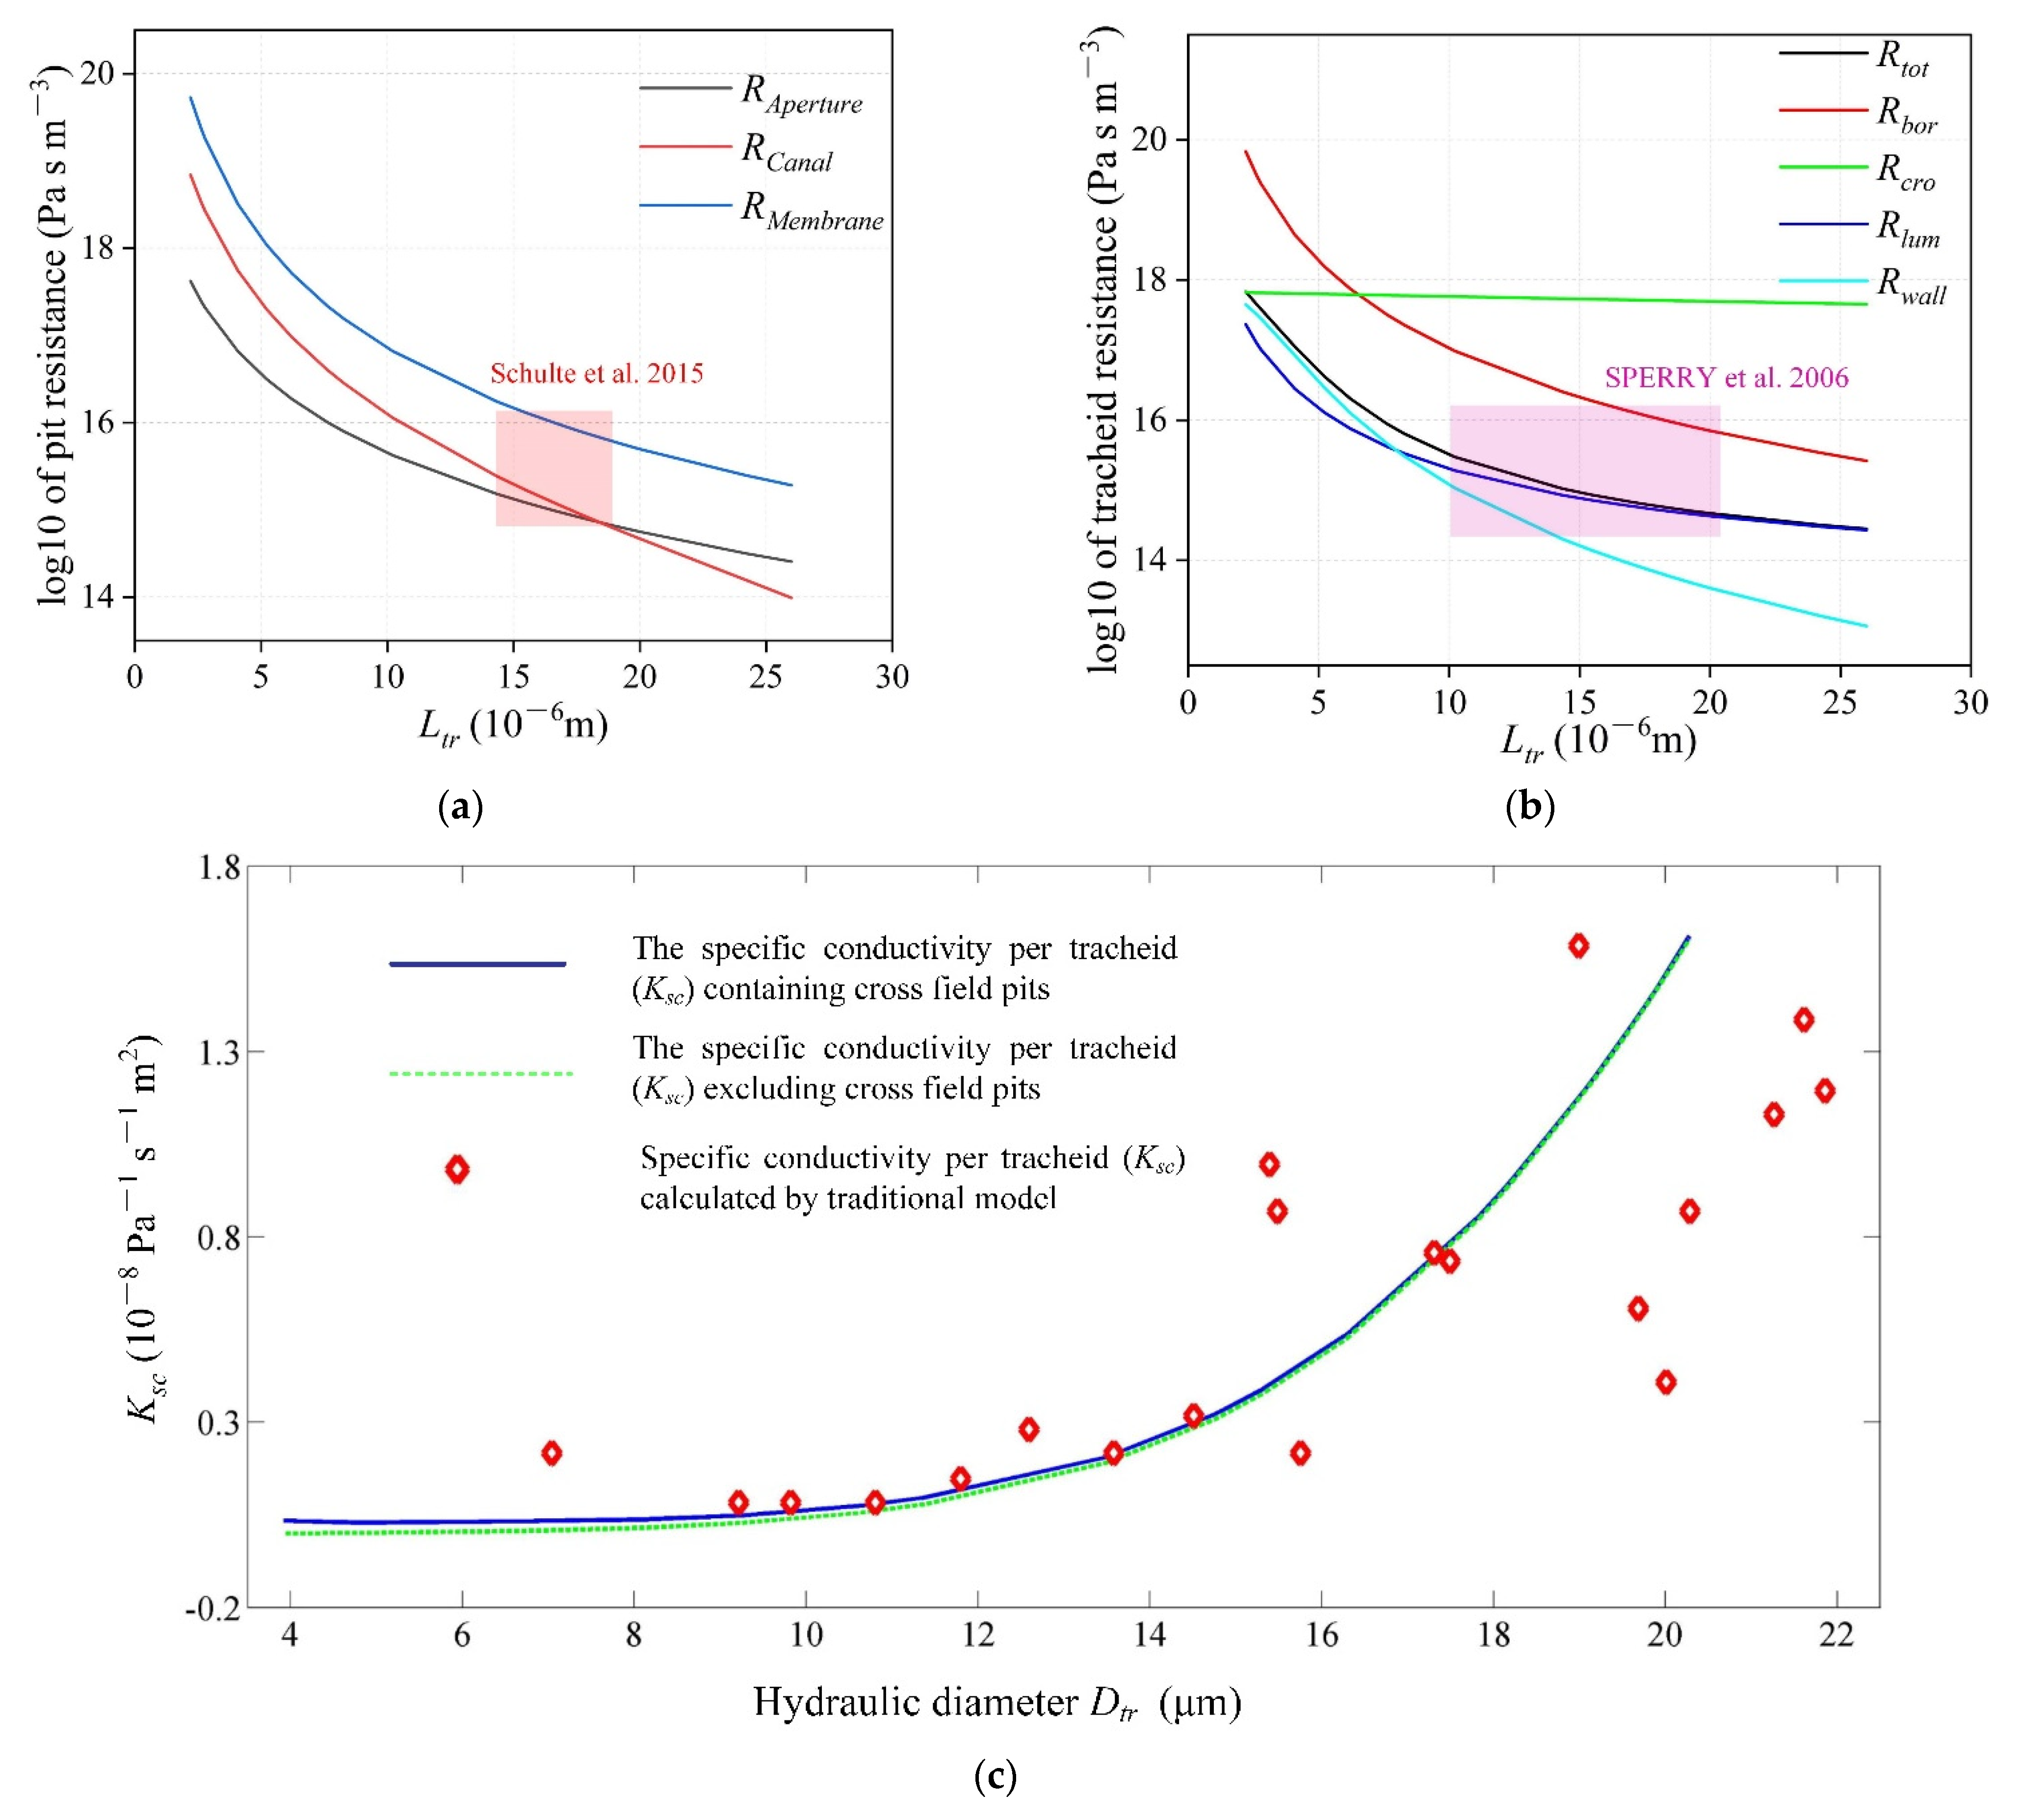
3.5. Validation
4. Discussion
5. Conclusions
Author Contributions
Funding
Institutional Review Board Statement
Informed Consent Statement
Data Availability Statement
Acknowledgments
Conflicts of Interest
References
- Williams, C.B.; Anfodillo, T.; Crivellaro, A.; Lazzarin, M.; Dawson, T.E.; Koch, G.W. Axial variation of xylem conduits in the Earth’s tallest trees. Trees-Struct. Funct. 2019, 33, 1299–1311. [Google Scholar] [CrossRef]
- Kim, J.S.; Awano, T.; Yoshinaga, A.; Takabe, K. Temporal and spatial diversities of the immunolabeling of mannan and xylan polysaccharides in differentiating earlywood ray cells and pits of Cryptomeria japonica. Planta 2011, 233, 109–122. [Google Scholar] [CrossRef]
- Barnard, D.M.; Lachenbruch, B.; Mcculloh, K.A.; Kitin, P.; Meinzer, F.C. Do ray cells provide a pathway for radial water movement in the stems of conifer trees? Am. J. Bot. 2013, 100, 322–331. [Google Scholar] [CrossRef] [Green Version]
- Fang, W.; Wu, Y. Tissue Ratio of Conifer Wood. J. Northeast For. Univ. 2007, 35, 12–14. [Google Scholar]
- Hajek, P.; Kurjak, D.; von Wühlisch, G.; Delzon, S.; Schuldt, B. Intraspecific variation in wood anatomical, hydraulic, and foliar traits in ten European beech provenances differing in growth yield. Front. Plant Sci. 2016, 7, 791. [Google Scholar] [CrossRef] [Green Version]
- Zimmer, K.; Treu, A.; McCulloh, K.A. Anatomical differences in the structural elements of fluid passage of Scots pine sapwood with contrasting treatability. Wood Sci. Technol. 2014, 48, 435–447. [Google Scholar] [CrossRef]
- Usta, I.; Hale, M.D. Radial permeability of sitka spruce as affected by wood structure—Permeability of cross-field pits in uniseriate rays. IAWA J. Int. Assoc. Wood Anat. 2003, 24, 197–204. [Google Scholar] [CrossRef]
- Tarmian, A.; Azadfallah, M.; Gholamiyan, H.; Shahverdi, M. Inter-Tracheid and Cross-Field Pitting in Compression Wood and Opposite Wood of Norway Spruce (Picea abies L.). Notulae Sci. Biol. 2011, 3, 145–151. [Google Scholar] [CrossRef] [Green Version]
- Morris, H.; Plavcova, L.; Cvecko, P.; Fichtler, E.; Gillingham, M.A.F.; Martínez-Cabrera, H.I.; McGlinn, D.J.; Wheeler, E.; Zheng, J.; Zieminska, K.; et al. A global analysis of parenchyma tissue fractions in secondary xylem of seed plants. New Phytol. 2016, 209, 1553–1565. [Google Scholar] [CrossRef]
- Siau, J.F. Wood: Influence of Moisture on Physical Properties; Department of Wood Science and Forest Products, Virginia Polytechnic Institute: State University, VA, USA, 1995. [Google Scholar]
- Zhao, Y.; Bao, F. Theoretical analysis on the relationship between fluid longitudinal permeability and structure of conifer wood. For. Sci. 1998, 34, 90–97. [Google Scholar]
- Martínez-Vilalta, J.; Mencuccini, M.; Álvarez, X.; Camacho, J.; Loepfe, L.; Piñol, J. Spatial distribution and packing of xylem conduits. Am. J. Bot. 2012, 99, 1189–1196. [Google Scholar] [CrossRef] [Green Version]
- Pittermann, J.; Limm, E.; Rico, C.; Christman, M.A. Structure–function constraints of tracheid based xylem. A comparison of conifers and ferns. New Phytol. 2011, 192, 449–461. [Google Scholar] [CrossRef]
- Sperry, J.S.; Hacke, U.G. Analysis of circular bordered pit function I. Angiosperm vessels with homogenous pit membranes. Am. J. Bot. 2004, 91, 369–385. [Google Scholar] [CrossRef] [Green Version]
- Lancashire, J.R.; Ennos, A.R. Modelling the hydrodynamic resistance of bordered pits. J. Exp. Bot. 2002, 373, 1485–1493. [Google Scholar] [CrossRef]
- Hacke, U.G.; Sperry, J.S.; Pittermann, J. Analysis of circular bordered pit function. II. Gymnosperm tracheids with torus-margo pit membranes. Am. J. Bot. 2004, 91, 386–400. [Google Scholar] [CrossRef] [Green Version]
- Hacke, U.G.; Sperry, J.S.; Wheeler, J.K.; Castro, L. Scaling of angiosperm xylem structure with safety and efficiency. Tree Physiol. 2006, 26, 689–701. [Google Scholar] [CrossRef]
- Wilson, J.P.; Knoll, A.H.; Holbrook, N.M.; Marshall, C.R. Modeling fluid flow in Medullosa, an anatomically unusual Carboniferous seed plant. Paleobiology 2008, 34, 472–493. [Google Scholar] [CrossRef]
- Sperry, J.S.; Hacke, U.G.; Pittermann, J. Size and function in conifer tracheids and angiosperm vessels. Am. J. Bot. 2006, 93, 1490–1500. [Google Scholar] [CrossRef] [Green Version]
- Tanrattana, M.; Barczi, J.F.; Decombeix, A.L.; Meyer-Berthaud, B.; Wilson, J. A new approach for modelling water transport in fossil plants. IAWA J. 2019, 40, 466–487. [Google Scholar] [CrossRef]
- Venturas, M.D.; Sperry, J.S.; Hacke, U.G. Plant xylem hydraulics: What we understand, current research, and future challenges. J. Integr. Plant Biol. 2017, 59, 356–389. [Google Scholar] [CrossRef] [Green Version]
- Sviderskaya, I.V.; Vaganov, E.A.; Fonti, M.V.; Fonti, P. Isometric scaling to model water transport in conifer tree rings across time and environments. J. Exp. Bot. 2021, 6, 2672–2685. [Google Scholar] [CrossRef]
- Lazzarin, M.; Crivellaro, A.; Williams, C.B.; Dawson, T.E.; Mozzi, G.; Anfodillo, T. Tracheid and pit anatomy vary in tandem in a tall sequoiadendron giganteum tree. IAWA J. 2016, 37, 172–185. [Google Scholar] [CrossRef] [Green Version]
- Pittermann, J.; Choat, B.; Jansen, S.; Stuart, S.A.; Lynn, L.; Dawson, T.E. The relationships between xylem safety and hydraulic efficiency in the Cupressaceae: The evolution of pit membrane form and function. Plant Physiol. 2010, 153, 1919–1931. [Google Scholar] [CrossRef] [Green Version]
- Blokhina, O.; Laitinen, T.; Hatakeyama, Y.; Delhomme, N.; Paasela, T.; Zhao, L.; Street, N.R.; Wada, H.; Kärkönen, A.; Fagerstedt, K. Ray parenchymal cells contribute to lignification of tracheids in developing xylem of Norway spruce. Plant Physiol. 2019, 181, 1552–1572. [Google Scholar] [CrossRef] [Green Version]
- Kitin, P.; Fujii, T.; Abe, H.; Takata, K. Anatomical features that facilitate radial flow across growth rings and from xylem to cambium in Cryptomeria japonica. Ann. Bot. 2009, 103, 1145–1157. [Google Scholar] [CrossRef] [Green Version]
- Pfautsch, S.; Hölttä, T.; Mencuccini, M. Hydraulic functioning of tree stems—Fusing ray anatomy, radial transfer and capacitance. Tree Physiol. 2015, 35, 706–722. [Google Scholar] [CrossRef] [Green Version]
- Bonetti, S.; Breitenstein, D.; Fatichi, S.; Domec, J.; Or, D. Persistent decay of fresh xylem hydraulic conductivity varies with pressure gradient and marks plant responses to injury. Plant Cell Environ. 2021, 44, 371–386. [Google Scholar] [CrossRef]
- Hacke, U.G.; Sperry, J.S. Functional and ecological xylem anatomy. Perspect. Plant Ecol. Evol. Syst. 2013, 4, 97–115. [Google Scholar] [CrossRef] [Green Version]
- Sperry J., S.; Hacke U., G.; Wheeler, J.K. Comparative analysis of end wall resistivity in xylem conduits. Plant Cell Environ. 2005, 28, 456–465. [Google Scholar] [CrossRef]
- Schulte, P.J.; Hacke, U.G. Solid mechanics of the torus-margo in conifer inter-tracheid bordered pits. New Phytol. 2020, 229, 1431–1439. [Google Scholar] [CrossRef]
- Schulte, P.J.; Gibson, A.C. Hydraulic conductance and tracheid anatomy in six species of extant seed plants. Can. J. Bot. Rev. Can. Bot. 1988, 66, 1073–1079. [Google Scholar] [CrossRef]
- Qu, W.; Yang, C.; Ma, Y.; Yu, W.; Qin, G.; Jin, Y. Analysis of the Structure and Hydraulic Function of Bordered Pits Using the Lattice Boltzman Method. Forests 2021, 12, 526. [Google Scholar] [CrossRef]
- Schoonmaker, A.L.; Hacke, U.G.; Landhäusser, S.M.; Lieffers, V.J.; Tyree, M.T. Hydraulic acclimation to shading in boreal conifers of varying shade tolerance. Plant Cell Environ. 2010, 33, 382–393. [Google Scholar] [CrossRef]
- Brodersen, C.; Jansen, S.; Choat, B.; Rico, C.; Pittermann, J. Cavitation resistance in seedless vascular plants: The structure and function of interconduit pit membranes. Plant Physiol. 2014, 165, 895–904. [Google Scholar] [CrossRef] [Green Version]
- Domec, J.C.; Lachenbruch, B.; Meinzer, F.C. Bordered pit structure and function determine spatial patterns of air-seeding thresholds in xylem of Douglas-fir (Pseudotsuga menziesii; Pinaceae) trees. Am. J. Bot. 2006, 93, 1588–1600. [Google Scholar] [CrossRef]
- Schulte, P.J. Computational fluid dynamics models of conifer bordered pits show how pit structure affects flow. New Phytol. 2011, 193, 721–729. [Google Scholar] [CrossRef]
- Schulte, P.J.; Hacke, U.G.; Schoonmaker, A.L. Pit membrane structure is highly variable and accounts for a major resistance to water flow through tracheid pits in stems and roots of two boreal conifer species. New Phytol. 2015, 208, 102–113. [Google Scholar] [CrossRef]
- Bouche, P.S.; Larter, M.; Domec, J.C.; Burlett, R.; Gasson, P.; Jansen, S.; Delzon, S. A broad survey of hydraulic and mechanical safety in the xylem of conifers. J. Exp. Bot. 2014, 65, 4419–4431. [Google Scholar] [CrossRef] [Green Version]
- Choat, B.; Cobb, A.R.; Jansen, S. Structure and function of bordered pits: New discoveries and impacts on whole-plant hydraulic function. New Phytol. 2008, 177, 608–626. [Google Scholar] [CrossRef]
- Eskola, R.; Hämäläinen, J.; Leppänen, T. Finite element modeling of the effect of crossfield pits on the cell wall stress behavior. Nord. Pulp Pap. Res. J. 2012, 27, 647–652. [Google Scholar] [CrossRef]
- Kim, D.H.; Kim, S.H.; Jo, J.I.; Kim, J.H.; Purusatama, B.D.; Lee, S.H.; Kim, N.H. Ray properties in the stems of Dahurian larch (Larix gmelinii) and Japanese larch (Larix kaempferi). IAWA J. 2020, 42, 134–142. [Google Scholar] [CrossRef]
- Cochard, H.; Badel, E.; Herbette, S.; Delzon, S.; Choat, B.; Jansen, S. Methods for measuring plant vulnerability to cavitation: A critical review. J. Exp. Bot. 2013, 64, 4779–4791. [Google Scholar] [CrossRef] [PubMed] [Green Version]


| Feature Range (Min-Max) | The Pine (Pinus sylvestris L. var. mongholica Litv.) | The Spruce (Picea koraiensis Nakai) | ||||
|---|---|---|---|---|---|---|
| Earlywood | Latewood | Earlywood | Latewood | |||
| Tracheids | Ltr | Lumen radial diameter (μm) | 2.5–20 | 15–30 | 2–11 | 12.5–25 |
| H | Tracheid length (mm) | 2.2–3.3 | 2.6–3.5 | |||
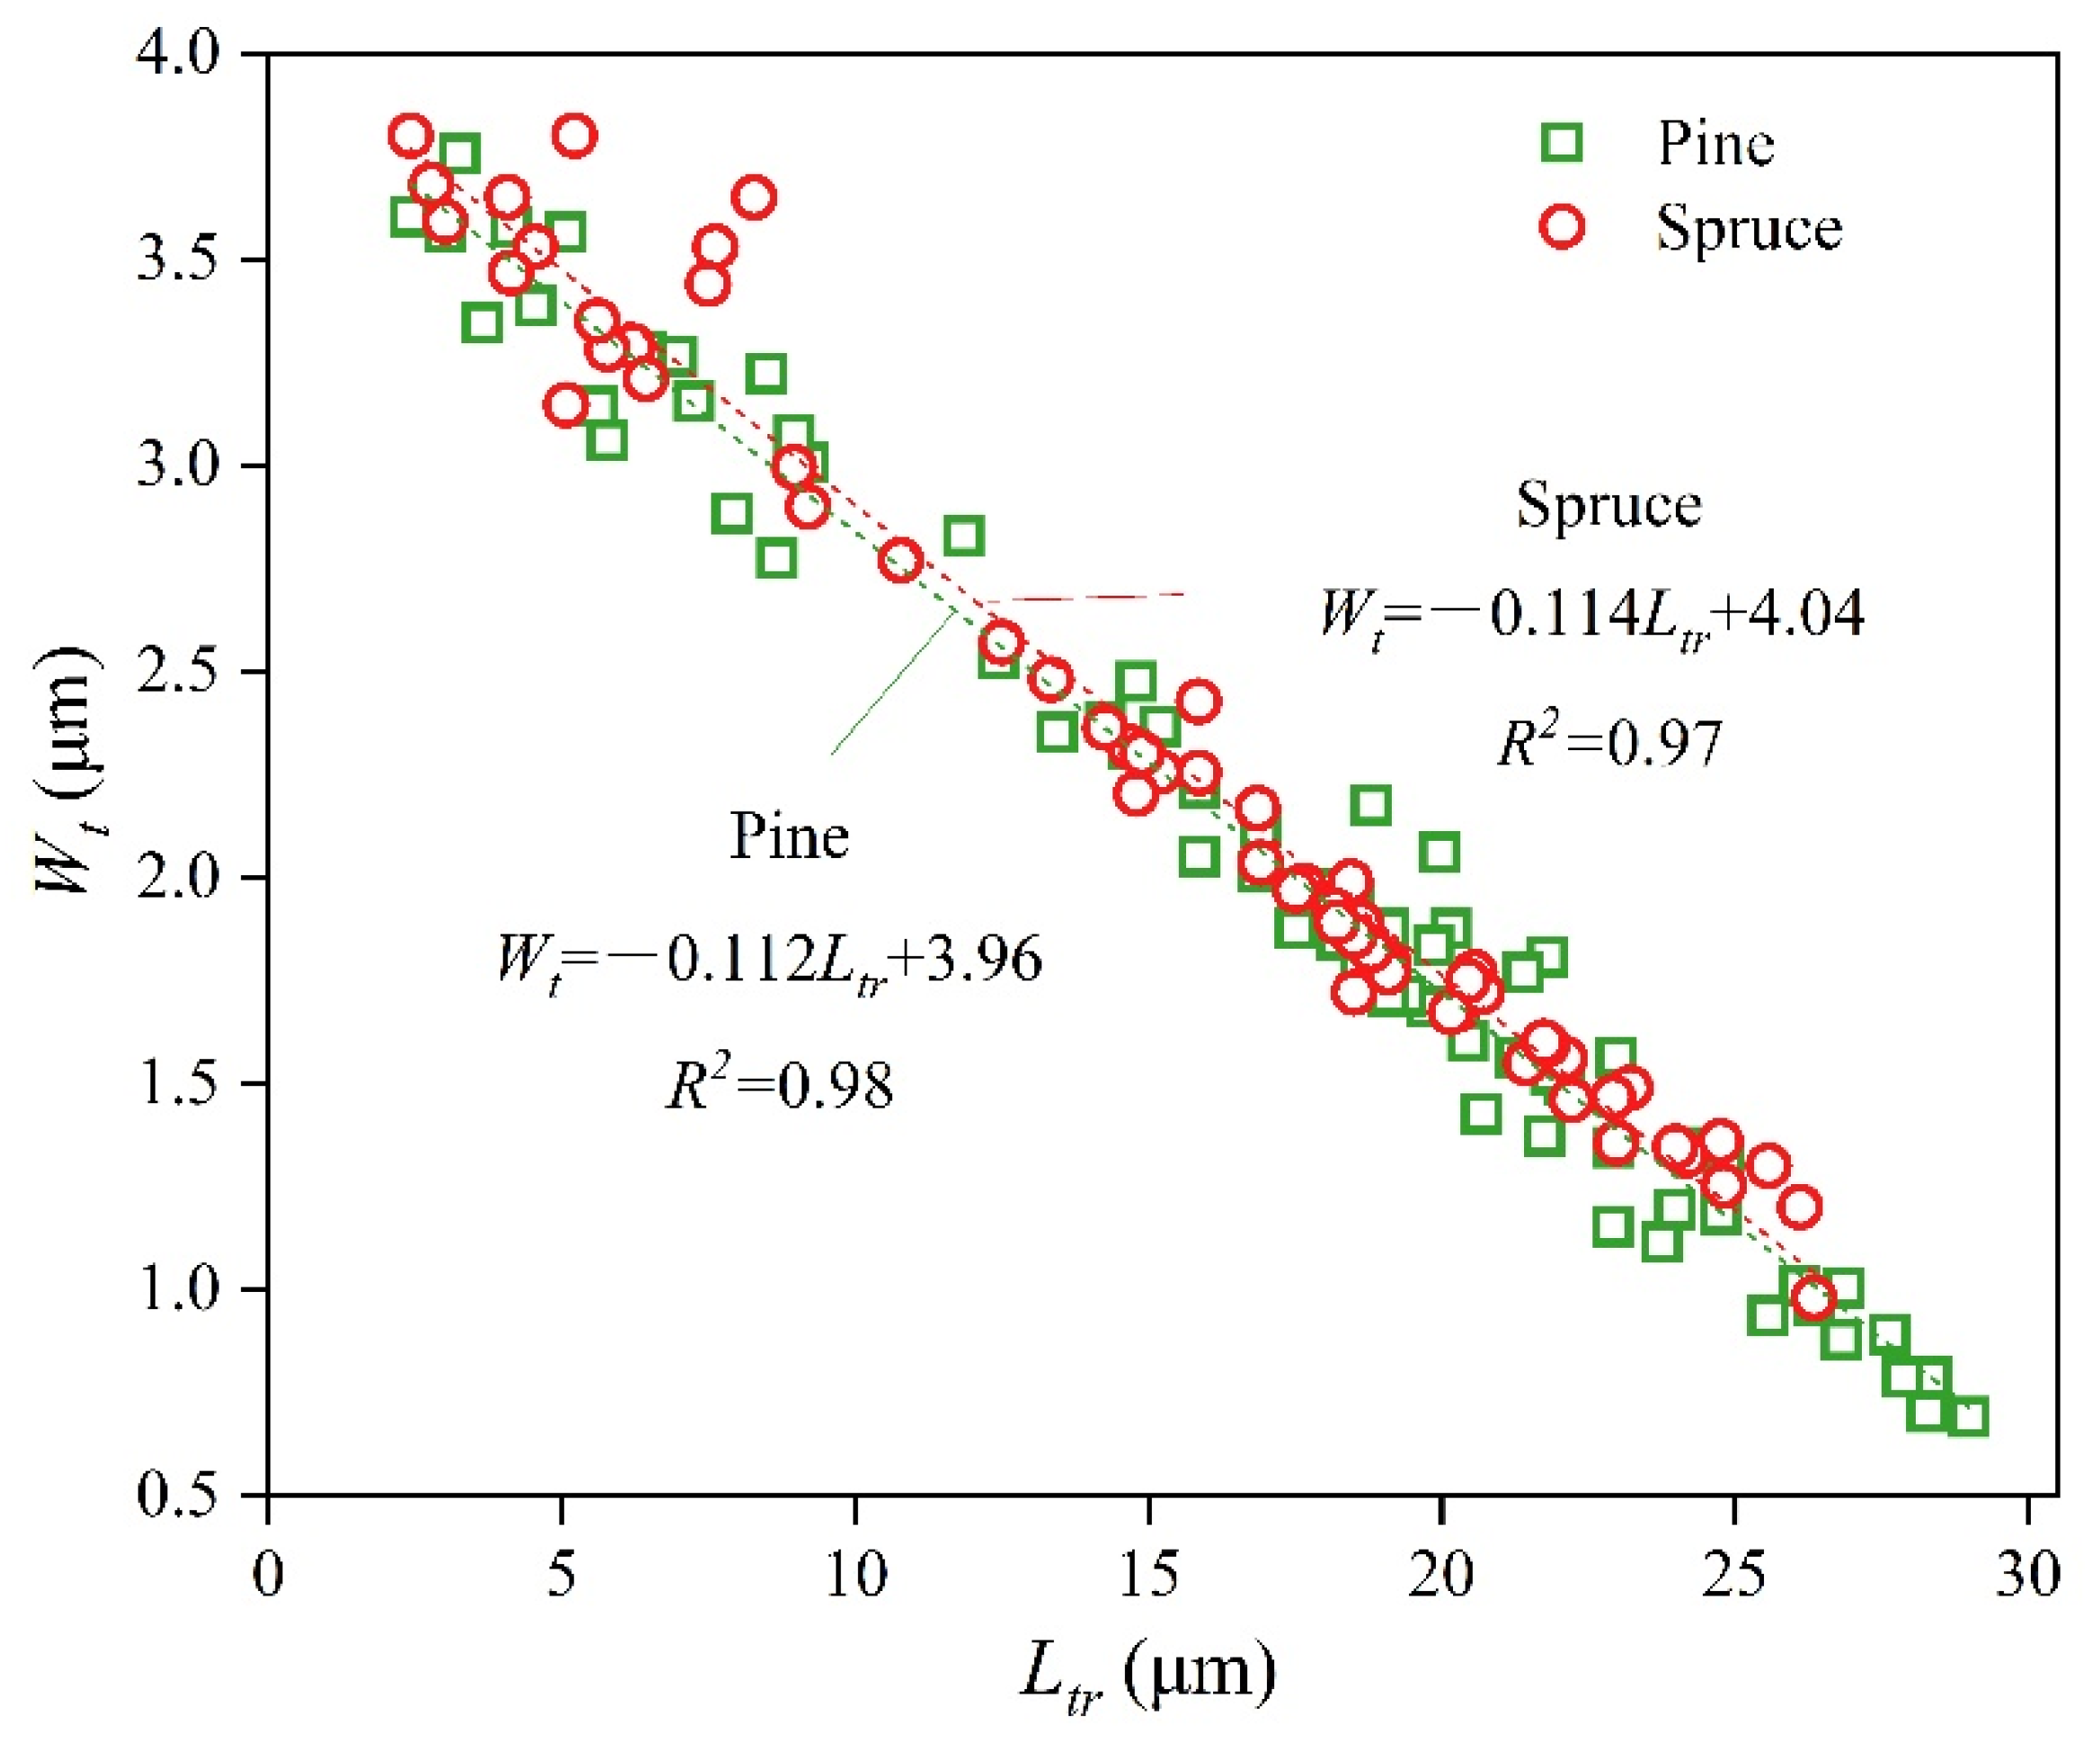
| Wt | Wall thickness (μm) | Wt = −80/7 × Ltr + 4 (Figure 7) | ||||
| 0.7–4.0 | 1.3–4.5 | |||||
| Bordered Pit | Dm | Membrane diameter (μm) | 0.70 Ltr (±0.07) [24,29] | |||
| Dp | Pore size(nm) | Dpo = 0.00303 Dm (±2.5) [36] | ||||
| Da | Diameter of pit aperture (μm) | Da = 0.25 Dm [24,36] | ||||
| Dt | Torus diameter (μm) | 0.50Dm(±0.11) [37,38,39] | ||||
| tap | Aperture thickness (μm) | Equals Wt | ||||
| Npo | Number of pores in pit membrane | Formula (10) | ||||
| 90–1085 | 60–1050 | |||||
| α | Bordered pit density | 6.5 × 10⁸ m−2 [14,22,40] | ||||
| NBor | Number of bordered pit per tracheid | Formula (7) | ||||
| Cross-field pits and rays | Wray | Height (μm) | 15.2–21.5 | 14.5–20.9 | ||
| tray | Aperture thickness of cross-field pits (μm) | The canal length of cross-field pit (ray thickness, approximately Wt) | ||||
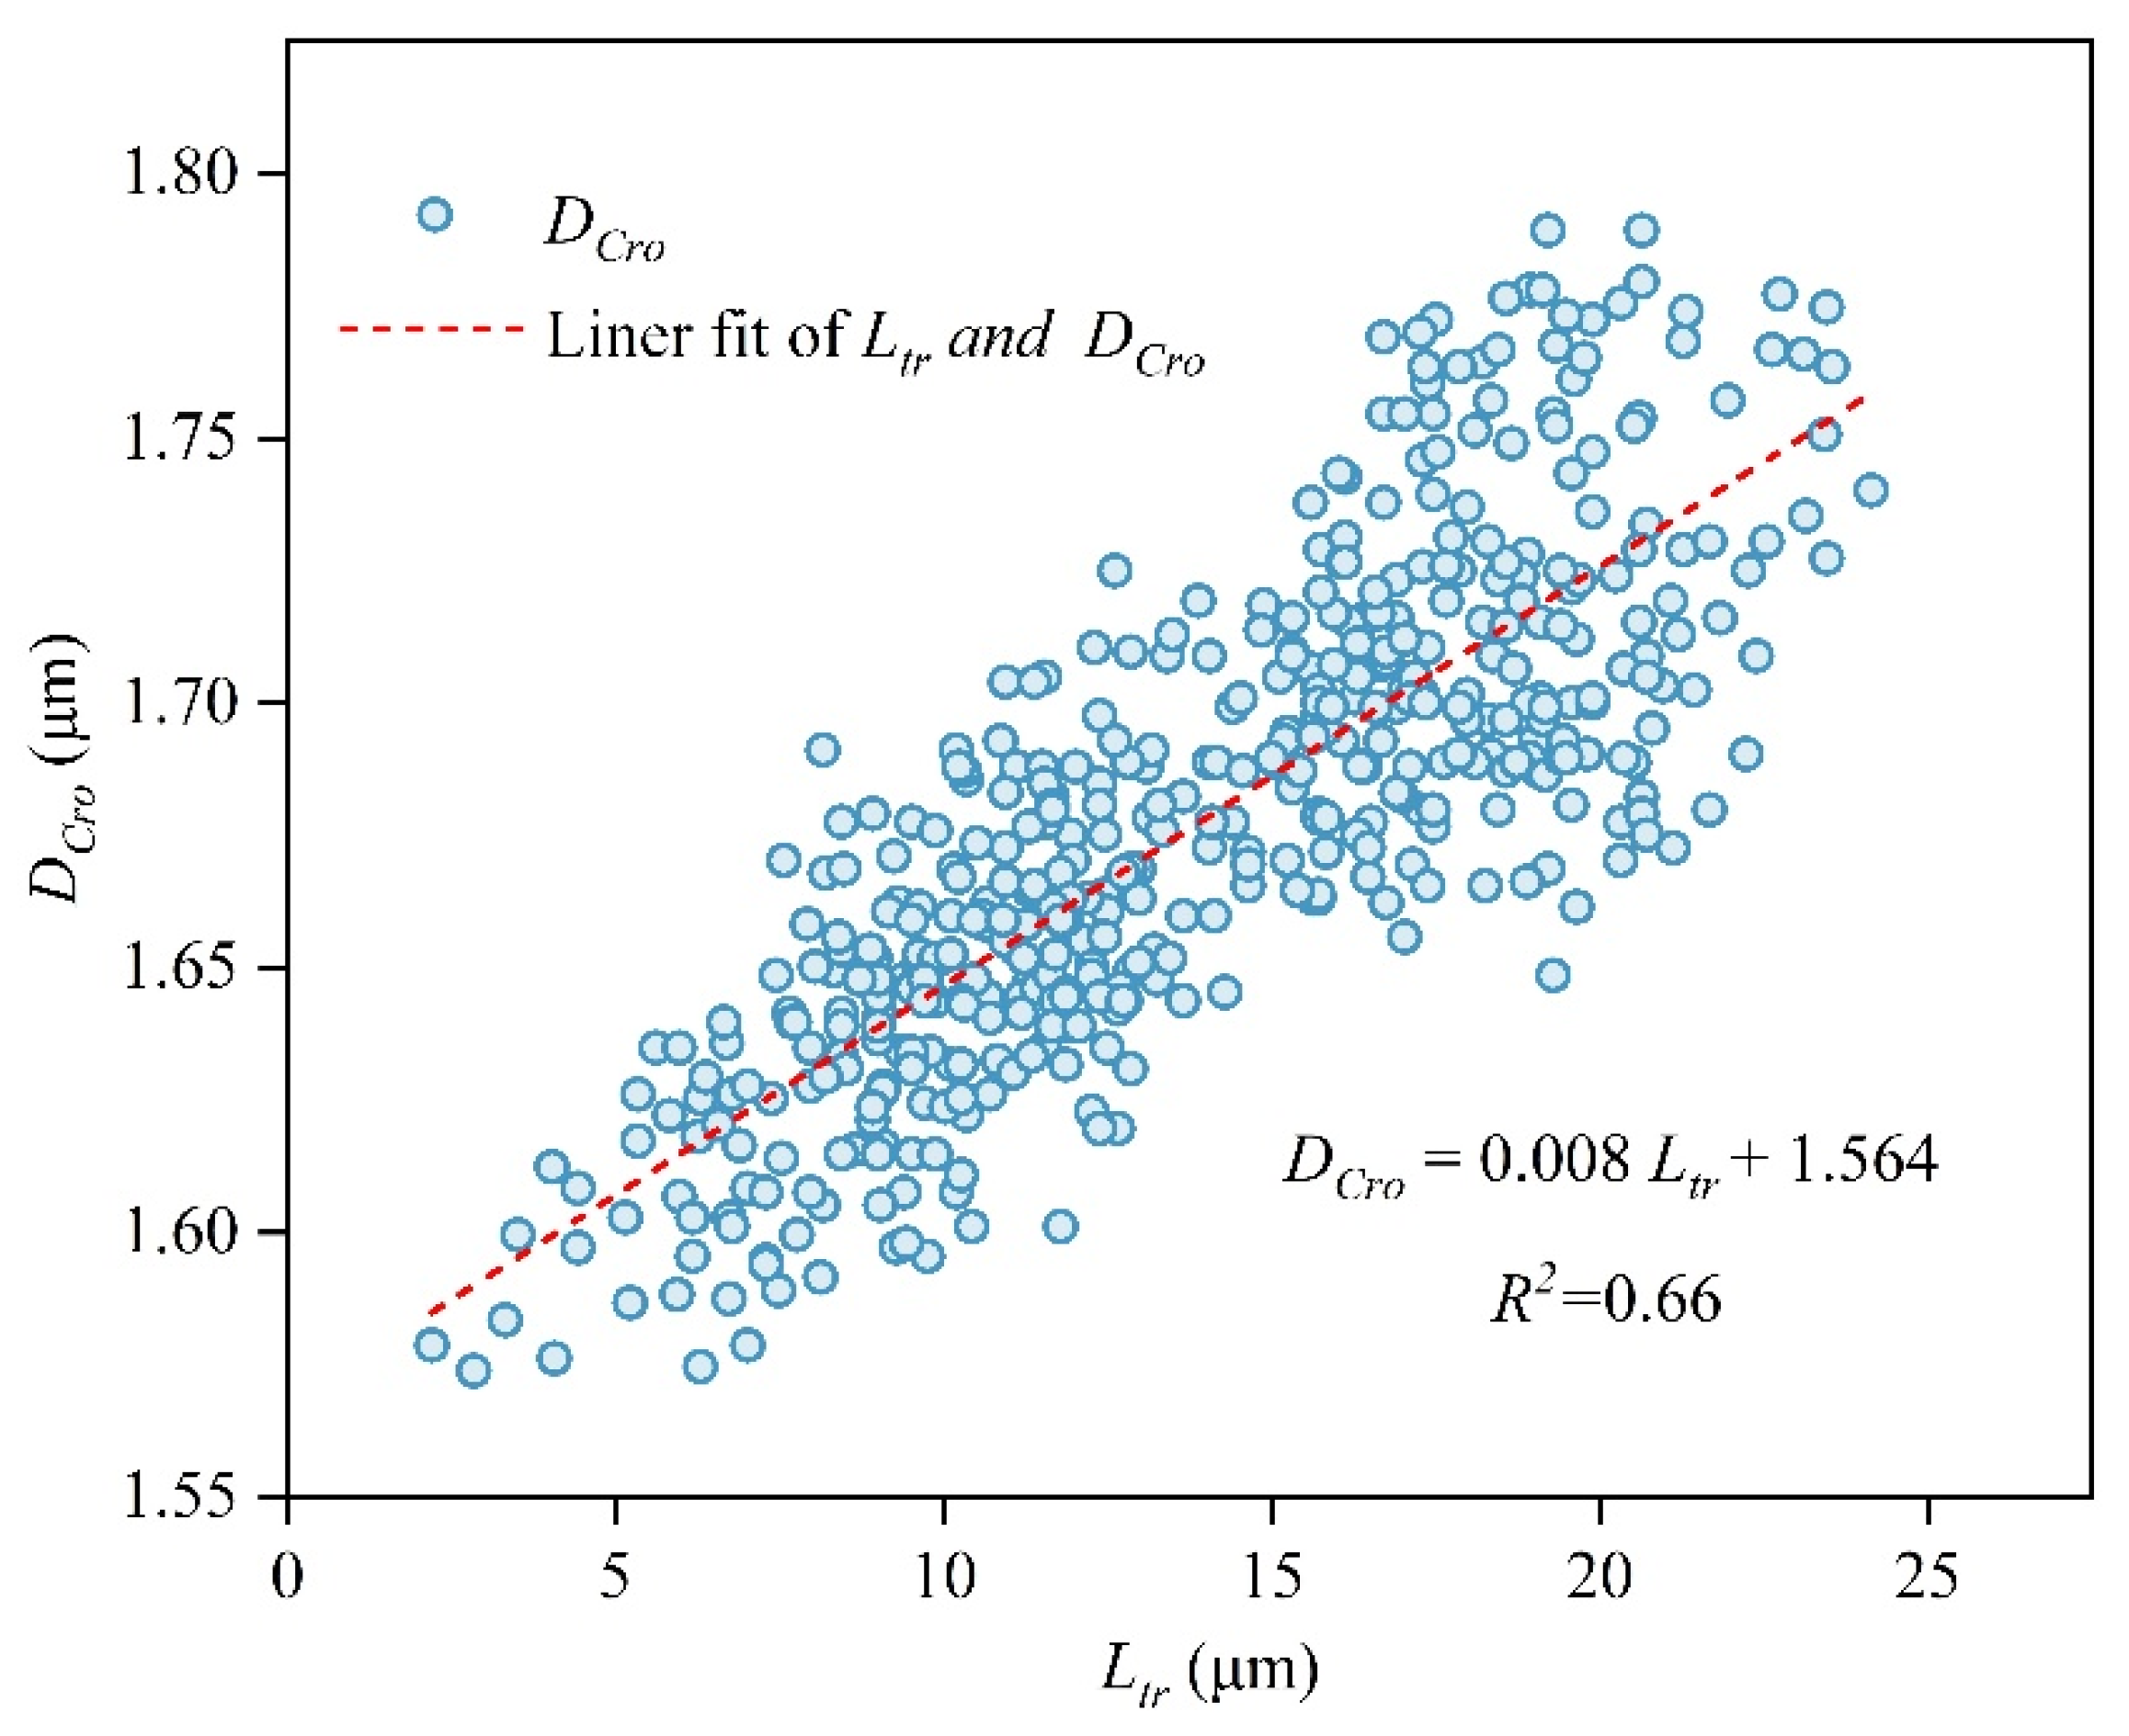
| DCro | The diameter of cross-field pits (μm) | Formula (13) 2.5–23.5 | DCro = 0.008 Ltr + 1.564 (Figure 8) 1.55–1.8 | |||
| β | The density of cross-field pits (m−2) | 1.96 × 10⁸ m−2 | 4.368 × 10⁸ m−2 | |||
| NCro | Number of cross-field pits per tracheid | Formula (8) | ||||
| 2–15 | 3–30 | |||||
| Location | Tracheid Characteristics | Pit Characteristics | Hydraulic Resistance | Hydraulic Conductances | ||||||||||
|---|---|---|---|---|---|---|---|---|---|---|---|---|---|---|
| EW/ LW | Ltr (μm) | Wt (μm) | Nbor | Ncro | Dm (μm) | Da (μm) | Dt (μm) | DCro (μm) | Rwall (1014 Pa s m−3) | Rlum (1014 Pa s m−3) | R (1014 Pa s m−3) | K (10−15 Pa−1 s−1 m3) | Ksc (10−8 Pa−1 s−1 m2) | |
| Pine (Pinus sylvestris L. var. mongholica Litv.) | ||||||||||||||
| 1 | LW | 2.85 | 3.67 | 5 | 2 | 2.00 | 0.50 | 0.77 | 4.96 | 5559.79 | 939.93 | 6499.72 | 0.00 | 0.02 |
| 2 | LW | 3.42 | 3.61 | 6 | 2 | 2.39 | 0.60 | 1.14 | 5.80 | 3328.35 | 504.92 | 3833.28 | 0.00 | 0.03 |
| 3 | LW | 4.2 | 3.52 | 7 | 2 | 2.94 | 0.74 | 0.97 | 6.88 | 1838.52 | 256.13 | 2094.66 | 0.00 | 0.04 |
| 4 | LW | 3.32 | 3.62 | 6 | 2 | 2.32 | 0.58 | 1.43 | 5.65 | 3620.46 | 558.02 | 4178.47 | 0.00 | 0.03 |
| 5 | EW | 5.46 | 3.38 | 10 | 3 | 3.82 | 0.96 | 1.83 | 8.48 | 609.77 | 111.84 | 721.61 | 0.01 | 0.07 |
| 6 | EW | 12.55 | 2.57 | 22 | 7 | 8.79 | 2.20 | 2.18 | 15.12 | 23.53 | 11.52 | 35.05 | 0.29 | 0.45 |
| 7 | EW | 18.69 | 1.86 | 33 | 10 | 13.08 | 3.27 | 2.67 | 18.84 | 4.41 | 4.87 | 9.29 | 1.08 | 1.10 |
| 8 | EW | 26.54 | 0.97 | 47 | 14 | 18.58 | 4.64 | 2.90 | 22.15 | 0.94 | 2.60 | 3.54 | 2.82 | 2.11 |
| 9 | EW | 15.73 | 2.20 | 28 | 8 | 11.01 | 2.75 | 3.77 | 17.21 | 9.40 | 6.94 | 16.34 | 0.61 | 0.75 |
| 10 | EW | 21.97 | 1.49 | 39 | 12 | 15.38 | 3.84 | 2.63 | 20.38 | 2.17 | 3.59 | 5.76 | 1.74 | 1.52 |
| 11 | EW | 26.06 | 1.02 | 46 | 14 | 18.24 | 4.56 | 4.38 | 21.98 | 1.02 | 2.68 | 3.70 | 2.70 | 2.05 |
| 12 | EW | 23.92 | 1.27 | 42 | 13 | 16.74 | 4.19 | 4.67 | 21.18 | 1.49 | 3.10 | 4.58 | 2.18 | 1.78 |
| 13 | EW | 28.15 | 0.78 | 49 | 14 | 19.71 | 4.93 | 7.10 | 22.69 | 0.73 | 2.37 | 3.10 | 3.23 | 2.30 |
| 14 | EW | 25.1 | 1.13 | 44 | 12 | 17.57 | 4.39 | 6.36 | 21.63 | 1.22 | 2.85 | 4.07 | 2.46 | 1.92 |
| 15 | EW | 16.74 | 2.09 | 29 | 11 | 11.72 | 2.93 | 7.50 | 17.80 | 6.72 | 6.09 | 12.81 | 0.78 | 0.89 |
| 16 | EW | 25.54 | 1.08 | 45 | 14 | 17.88 | 4.47 | 6.18 | 21.79 | 1.11 | 2.77 | 3.88 | 2.58 | 1.98 |
| 17 | EW | 28.78 | 0.71 | 51 | 15 | 20.15 | 5.04 | 5.21 | 22.89 | 0.66 | 2.29 | 2.95 | 3.39 | 2.38 |
| Spruce (Picea koraiensis Nakai) | ||||||||||||||
| 1 | LW | 2.20 | 3.75 | 4 | 3 | 1.54 | 0.39 | 0.77 | 1.58 | 4324.79 | 2332.20 | 6656.99 | 0.00 | 0.03 |
| 2 | LW | 2.78 | 3.68 | 5 | 3 | 1.95 | 0.49 | 0.97 | 1.59 | 4150.08 | 1024.36 | 5174.44 | 0.00 | 0.03 |
| 3 | LW | 4.08 | 3.53 | 7 | 5 | 2.86 | 0.71 | 1.43 | 1.60 | 2110.08 | 281.45 | 2391.53 | 0.00 | 0.03 |
| 4 | LW | 5.22 | 3.40 | 9 | 6 | 3.65 | 0.91 | 1.83 | 1.61 | 1287.05 | 128.47 | 1415.52 | 0.01 | 0.04 |
| 5 | LW | 6.22 | 3.29 | 11 | 7 | 4.35 | 1.09 | 2.18 | 1.61 | 764.71 | 75.44 | 840.15 | 0.01 | 0.05 |
| 6 | LW | 7.62 | 3.13 | 13 | 9 | 5.33 | 1.33 | 2.67 | 1.62 | 351.42 | 41.93 | 393.35 | 0.03 | 0.08 |
| 7 | LW | 8.28 | 3.05 | 15 | 10 | 5.80 | 1.45 | 2.90 | 1.63 | 247.35 | 33.30 | 280.65 | 0.04 | 0.10 |
| 8 | EW | 10.78 | 2.77 | 19 | 13 | 7.55 | 1.89 | 3.77 | 1.65 | 75.51 | 16.67 | 92.18 | 0.11 | 0.21 |
| 9 | EW | 7.50 | 3.14 | 13 | 9 | 5.25 | 1.31 | 2.63 | 1.62 | 373.02 | 43.85 | 416.87 | 0.02 | 0.07 |
| 10 | EW | 12.5 | 2.57 | 22 | 15 | 8.75 | 2.19 | 4.38 | 1.66 | 37.56 | 11.63 | 49.19 | 0.20 | 0.32 |
| 11 | EW | 13.34 | 2.48 | 23 | 16 | 9.34 | 2.33 | 4.67 | 1.67 | 27.54 | 10.00 | 37.54 | 0.27 | 0.39 |
| 12 | EW | 20.28 | 1.68 | 36 | 24 | 14.20 | 3.55 | 7.10 | 1.73 | 3.71 | 4.17 | 7.88 | 1.27 | 1.20 |
| 13 | EW | 18.18 | 1.92 | 32 | 21 | 12.73 | 3.18 | 6.36 | 1.71 | 6.26 | 5.15 | 11.40 | 0.88 | 0.92 |
| 14 | EW | 21.44 | 1.55 | 38 | 25 | 15.01 | 3.75 | 7.50 | 1.74 | 2.85 | 3.76 | 6.61 | 1.51 | 1.36 |
| 15 | EW | 17.65 | 1.98 | 31 | 21 | 12.36 | 3.09 | 6.18 | 1.71 | 7.20 | 5.46 | 12.67 | 0.79 | 0.85 |
| 16 | EW | 14.89 | 2.30 | 26 | 18 | 10.42 | 2.61 | 5.21 | 1.68 | 16.27 | 7.81 | 24.08 | 0.42 | 0.54 |
| 17 | EW | 18.44 | 1.89 | 32 | 22 | 12.91 | 3.23 | 6.45 | 1.71 | 5.84 | 5.00 | 10.85 | 0.92 | 0.95 |
| 18 | EW | 22.22 | 1.46 | 39 | 26 | 15.55 | 3.89 | 7.78 | 1.74 | 2.41 | 3.52 | 5.93 | 1.69 | 1.47 |
| 19 | EW | 20.56 | 1.65 | 36 | 24 | 14.39 | 3.60 | 7.20 | 1.73 | 3.48 | 4.06 | 7.54 | 1.33 | 1.24 |
| 20 | EW | 23.22 | 1.35 | 41 | 27 | 16.25 | 4.06 | 8.13 | 1.75 | 1.95 | 3.26 | 5.21 | 1.92 | 1.60 |
Publisher’s Note: MDPI stays neutral with regard to jurisdictional claims in published maps and institutional affiliations. |
© 2022 by the authors. Licensee MDPI, Basel, Switzerland. This article is an open access article distributed under the terms and conditions of the Creative Commons Attribution (CC BY) license (https://creativecommons.org/licenses/by/4.0/).
Share and Cite
Qu, W.; Yang, C.; Zhang, J.; Ma, Y.; Tian, X.; Zhao, S.; Yu, W. Hydraulic Function Analysis of Conifer Xylem Based on a Model Incorporating Tracheids, Bordered Pits, and Cross-Field Pits. Forests 2022, 13, 171. https://doi.org/10.3390/f13020171
Qu W, Yang C, Zhang J, Ma Y, Tian X, Zhao S, Yu W. Hydraulic Function Analysis of Conifer Xylem Based on a Model Incorporating Tracheids, Bordered Pits, and Cross-Field Pits. Forests. 2022; 13(2):171. https://doi.org/10.3390/f13020171
Chicago/Turabian StyleQu, Wen, Chunmei Yang, Jiawei Zhang, Yan Ma, Xinchi Tian, Shuai Zhao, and Wenji Yu. 2022. "Hydraulic Function Analysis of Conifer Xylem Based on a Model Incorporating Tracheids, Bordered Pits, and Cross-Field Pits" Forests 13, no. 2: 171. https://doi.org/10.3390/f13020171