Article

Relationship between Photosynthetic Characteristics, Anatomical Structure, and Physiological Indexes of Two Halophytes in Different Habitats

1
College of Ecology and Environment, Xinjiang University, Urumqi 830046, China
2
Key Laboratory of Oasis Ecology of Education Ministry, Xinjiang University, Urumqi 830046, China
3
Xinjiang Jinghe Observation and Research Station of Temperate Desert Ecosystem, Ministry of Education, Jinghe 833300, China
*
Author to whom correspondence should be addressed.
Forests 2022, 13(12), 2189; https://doi.org/10.3390/f13122189
Submission received: 19 November 2022 / Revised: 13 December 2022 / Accepted: 17 December 2022 / Published: 19 December 2022
(This article belongs to the Section Forest Ecophysiology and Biology)

Abstract

:
Drought and salinity are considered to be the major limiting factors for plant growth in desert areas. Halophytes can maintain their growth in extreme salt environments. However, few studies have linked the photosynthetic characteristics of halophytes with their anatomical structures and leaf water potential to jointly explain the effects of drought and salt on leaf internal water use efficiency (WUEi). For this reason, two different halophytes, Nitraria sibirica and Alhagi sparsifolia, were selected to analyze the leaf physiological traits in response to different water and salt gradients. The analysis further revealed the influence of soil water and salt content and anatomical characteristics on plant photosynthesis. The results showed that the leaf water potential, morphology, anatomical parameters, and photosynthetic parameters of the two plants in different habitats showed significant species-specific physiological responses. The value of WUEi of N. sibirica was negatively correlated with net photosynthetic rate (Pn), stomatal conductance (Gs), tightness of palisade tissue (CTR), and soil factors, while the WUEi of A. sparsifolia was positively correlated with Pn, Gs, and CTR. The indirect effects of soil salinity and soil moisture on WUEi were also found to be species-specific. This study will help to improve the understanding of the ecological adaptability of plants to water and salt stress and provide a theoretical basis for clarifying the drought tolerance and salt tolerance adaptation strategies of halophytes in arid areas.

1. Introduction

The relationship between plants and the environment has always been the core issue of ecological research [1]. Plants respond to environmental changes by adjusting their external morphology and internal physiological characteristics, which is reflected in the differences of plant traits, such as leaves, roots, and seeds [2]. Compared with stems or roots, the leaves of plants are more susceptible to environmental stress, and their sensitivity and plasticity to environmental changes are higher than other organs [3]. The importance of leaf traits (such as leaf area, photosynthetic characteristics, leaf water potential, and anatomical structure) to plant growth and survival has been demonstrated. Previous studies have focused more on exploring the response strategies of plants to the environment from the aspects of leaf functional traits, but less on the responses of plants to the environment from the aspects of leaf anatomical structure and photosynthetic physiology, especially how to respond to the combined effects of drought and salt stress [4,5].
Drought and salt stress are the main abiotic stress factors that restrict the growth of desert plants. In order to adapt to environment, over an extended period desert plants have developed a series of defense mechanisms against drought and salt stress [4,6]. Under drought and salt stress, plants adjust leaf water status through morphological, anatomical, and physiological adaptation [7]. Photosynthetic capacity is a comprehensive reflection of plant growth and physiological conditions under stress. Drought and salt stress initially lead to stomatal limitations in photosynthesis because plants quickly sense higher osmotic pressures [8]. Drought usually reduces the photosynthetic rate by inhibiting leaf expansion and stomatal closure; similar to drought stress, salt stress can disrupt water homeostasis in plant tissues by inducing osmotic pressure [9,10].
To identify the potential relationship between leaf photosynthetic capacity and other easily measured quantitative parameters, many studies had been conducted, such as the relationship between leaf chlorophyll content, specific leaf area, leaf nitrogen content, and photosynthesis [7,11,12], but there were few studies on the relationship between photosynthesis and anatomical parameters. As the main organ for the photosynthesis of plants, the anatomical structure of leaves changes adaptively with the environment. In different growth environments, there are great differences in the anatomical structure of leaves between species and within species [13,14]. Leaf water potential is another important physiological index to judge plant resistance, which is closely related to photosynthetic factors such as net photosynthetic rate. Therefore, the study of leaf anatomical structure and leaf water potential is of great significance to explore the photosynthetic physiological characteristics of plants.
In arid and semi-arid areas, shrubs play an important role in preventing soil erosion, improving groundwater, and maintaining ecological balance throughout the ecosystem [15]. Nitraria sibirica of Zygophyllaceae and Alhagi sparsifolia of Leguminosae are common desert halophytes; the former is a euhalophyte and the latter is a pseudohalophyte [16]. The physiological mechanisms of salt tolerance and drought tolerance in these two plants have always been the focus of researchers’ attention, and related studies have involved seed germination, seedling growth, photosynthetic characteristics, and physiological metabolism [17,18,19]. Unfortunately, as the main construction species, N. sibirica and A. sparsifolia have degraded due to the increasingly harsh ecological environment in desert areas. Therefore, it is important to study the responses of these two plants to soil water and salt. Generally, halophytes have a strong adaptability to saline environments. However, it is unclear whether the morphological structure, anatomical characteristics, and physiological characteristics change in different soil water and salt gradients. The study of this issue in this study can provide a theoretical basis for clarifying the drought tolerance and salt tolerance adaptation strategies of halophytes.
In this study, we selected the Ebinur Lake Wetland National Nature Reserve in Xinjiang, China, as the target area. The effects of soil water and salt content, anatomical characteristics, and other leaf physiological characteristics on plant photosynthesis were revealed by comparing the adaptability of leaf physiological and anatomical parameters of two plants to different habitats. Specifically, the following scientific issues were discussed: (1) whether the leaf physiological characteristics changed along the soil water salt gradient, and whether this change was species-specific; (2) whether leaf morphology, anatomical parameters, and water potential can help explain the differences of photosynthetic capacity among species, and how strong their relationship with photosynthetic characteristics is; (3) the influence of soil water and salt factors on photosynthesis were revealed. The purpose of this study is to enrich the understanding of desert plant stress adaptation strategies from the perspective of plant leaf anatomical characteristics and photosynthetic physiological characteristics, and to provide a theoretical basis for effective restoration and protection of degraded vegetation in desert areas.

2. Materials and Methods

2.1. Research Sites

The study area is located on the north bank of the Aqikesu River in Ebinur Lake Wetland National Nature Reserve (82°36′–83°50′ N, 44°30′–45°09′ E), administratively belonging to Jinghe county, Xinjiang Uygur Autonomous Region, China (Figure 1A). The region is located in the central part of Eurasia, surrounded by mountains in the west, north, and south. The climate is dry and precipitation is scarce, which is a typical temperate continental climate, and the annual mean temperature ranges from 6.6 to 7.8 °C [20]. The mean annual precipitation is <100 mm, but the potential annual evaporation is >1600 mm [21]. As a result, precipitation is rare in the region, and groundwater is the main source of water for local plants and desert ecosystems [22].
The Aqikesu River is located on the east side of the Ebinur Lake Wetland National Nature Reserve and is one of the water sources of the Ebinur Lake. The distribution of soil water and salt in the north of the riverbank shows some differences, specifically, with the increase in the distance from the riverbank, the soil water content and total salt content gradually decrease. The soil types in the north of the river are mainly clay, silt, and sand, and the plant community is mainly composed of xerophytic and super xerophytic small trees, shrubs, semi-shrubs, and herbs [23]. Therefore, the area north of the vertical Aqikesu River covers the main community types and soil structures in this area, which makes is a good representative location for the study of desert plant adaptation.

2.2. Experimental Design

Through a comprehensive survey of plant distribution, we found that the study area was mainly dominated by shrubs. Shrubs played a vital role in maintaining the whole ecosystem in the study area, such as elevating groundwater and maintaining ecological balance. N. sibirica (Figure 1C) and A. sparsifolia (Figure 1D) were the main dominant species, and they were distributed from near to the riverbank to far from the riverbank, with a wide distribution range, so these two typical halophytes were selected to compare the differences of leaf physiological parameters under different soil water salt habitats. Following previous research [21], in early July 2021, three plots were set at 1200 m intervals from near to far in the riparian forest vertical to the north of the Aqikesu River, with a size of 100 m × 100 m in each plot. These plots were respectively named HWHS (high water and high salt), MWMS (medium water and medium salt), and LWLS (low water and low salt) (Figure 1B). Three 30 m × 30 m small sample squares were set along the diagonal in each plot (Figure 1E), ensuring that N. sibirica and A. sparsifolia were distributed in each small sample square. GPS was used to record the longitude, latitude, and altitude information of the three plots (Table 1).

2.3. Sample Collection

Nine well-growing and similar growth plants of N. sibirica and A. sparsifolia were marked in each small square (Figure 1E), and the distance between each plant was required to be greater than 5 m. The upper, middle, and lower leaves of the marked plants were collected and mixed for the determination of leaf physiological properties. A total of 27 leaf samples were collected. The soil samples were collected under the crown of each marked plant, with a depth of 0~30 cm. Before the collection, the dead branches and leaves on the surface were brushed away. After the collection, the soil samples were used for the determination of soil physical and chemical properties.

2.4. Measurement Index

2.4.1. Determination of Soil Indexes

The soil moisture content (SWC) was determined by the drying–weighing method. The pH value of soil was measured by pH meter and the salt content of soil (SSC) was measured by electrical conductivity method [24]. The average value of each index was taken after repeated measurement 3 times.

2.4.2. Determination of Photosynthetic Parameters

An Li-6400XT portable photosynthesis system (Li-COR Inc., Lincoln, NE, USA) was used to measure the photosynthetic gas exchange parameters. The leaves on the middle and upper branches of marked plants were selected for measurement at 10:00–11:30 local time, and the time interval between each sample site was no more than 10 min. The measurement parameters mainly included physiological indicators, such as net photosynthetic rate (Pn, μmol·CO2·m−2·s−1), transpiration rate (Tr, mmol·H2O·m−2·s−1), stomatal conductance (Gs, mol·H2O·m−2·s−1), and intercellular CO2 concentration (Ci, μmol·CO2·mol−1). Because the leaves of N. sibirica and A. sparsifolia were small, after the experiment, we referred to Guo et al. [25] to obtain the corrected leaf photosynthetic parameters. The intrinsic water use efficiency (WUEi, μmol·CO2 mmol−1 H2O) was calculated using the following formulas:
WUEi = Pn/Gs
where Pn is the net photosynthetic rate and Gs is the stomatal conductance.

2.4.3. Determination of Leaf Morphology and Anatomical Structure

One healthy and mature leaf from the top, middle, and bottom of each marked plant was collected and immediately placed into the configured FAA fixed solution (70% ethanol 90 mL + formaldehyde 5 mL + acetic acid 5 mL). The air was extracted in a bottle with a syringe and taken back to the laboratory. The improved conventional paraffin section method was used to complete dehydration, transparency, embedding, and other production processes [26]. The prepared paraffin sections were observed under a fluorescence inverted microscope, and the thickness of the leaf (LT, mm), upper epidermis (TU, μm), lower epidermis (TL, μm), palisade tissue (TP, μm), and sponge tissue (TS, μm) of the leaves were measured. The palisade tissue and spongy tissue ratio (P/S = TP/TS), tightness of palisade tissue (CTR = TP/LT), and looseness of palisade tissue (SR = TS/LT) were calculated. Each index was repeated six times and averaged. Leaf area (LA, cm2) and LT samples were collected in accordance with the anatomical parameters. The LA was measured by taking photos with a digital camera and was then calculated using Photoshop software. A vernier caliper was used to measure the thickness of the front, middle, and end of the blade, respectively, and the average value of the three was taken as LT.

2.4.4. Determination of Leaf Water Potential

The measurement time of leaf water potential (ψmd) was the same as that of photosynthetic gas exchange. One leaf from the top, middle, and bottom of each marked plant was collected, placed into a sealed plastic bag, and brought back to the laboratory. Taken with a WP4C water potential meter, the measurement range was −300–0 MPa, and the measurement accuracy was ± 0.05 MPa. To ensure the accuracy of the measurement results, the instrument was kept in a horizontal state and kept away from air conditioning, heating, outdoors, and other places that may have caused rapid temperature changes.

2.4.5. Determination of Relative Chlorophyll Content in Leaves

The relative chlorophyll content (SPAD) was measured at the same time as the photosynthetic gas exchange of the leaves. One leaf from the top, middle, and bottom of each marked plant was measured with a SPAD-502 chlorophyll meter (Konica, Japan). During the measurement, the veins were avoided as much as possible, and the average value was determined at three points in the middle of the main veins on both sides of each leaf.

2.5. Statistical Analyses

Before statistical analysis of the data, the Shapiro–Wilk test and Levene test were used to test the normality and homogeneity of variance of the data, respectively, and logarithmic transformation was performed for the non-normally distributed data. K-mean cluster analysis was carried out for soil water content and salt content, and the optimal K value was determined by R package “facto extra”. One-way ANOVA was used to study whether the difference of leaf physiological characters in different habitats and between the two plants reached a significant level. The least significant difference (LSD) method was used for multiple comparisons. The significance level was uniformly set to 0.05. The response of leaf water use efficiency to soil environmental factors and leaf anatomical structure parameters was studied by principal component analysis (PCA). Path analysis was used to study the effect of soil water and salt content on plant photosynthetic characteristics. All statistical analyses were performed using R V. 4.1.2 software.

3. Results

3.1. The Variation Characteristics of Soil Environmental Factors in Different Habitats

It can be seen from Table 2 that, from near to far from the riverbank (from HWHS sample plot to LWLS sample plot), soil water content and soil salt content gradually decreased, and there was significant difference among the three plots (p < 0.05). K-mean clustering divides the soil moisture and salt content of the three sample plots into three gradients (Figure S1). According to the climate conditions and soil environment of the Ebinur Lake basin, the three sample plots can be divided into three soil moisture and salt environments: high water and high salt (HWHS), medium water and salt (MWMS), and low water and low salt (LWLS). Soil pH decreased gradually, and there was a significant difference between the HWHS plot and the other two plots (p < 0.05).

3.2. The SPAD and Water Potential of Leaves in Different Habitats

With the decrease in soil water and salt content, the SPAD of A. sparsifolia changed significantly (p < 0.05) and showed an increasing trend, while the SPAD of N. sibirica was the highest in MWMS soil, and the SPAD value had a significant difference only in LWLS soil (p < 0.05) (Figure 2A). In general, the water potential of the two plants was significantly different (p < 0.0001), and the water potential of A. sparsifolia was significantly greater than that of N. sibirica. The two plants showed a consistent trend with the variation of water–salt gradient, and the water potential values of the two plants under LWLS sample were the highest (Figure 2B).

3.3. Leaf Morphology and Anatomical Characteristics in Different Habitats

Through the analysis of the morphological parameters of the two plants, it was found that with the decrease in soil water and salt content, the leaf area of N. sibirica increased, while that of A. sparsifolia decreased. There was a significant difference between the leaf area under the LWLS gradient and the other two water and salt gradients (p < 0.05) (Figure 3A). The leaf thickness of the two plants was the maximum under the MWMS gradient and the minimum under the HWHS gradient, and there were also significant differences in leaf thickness between the two plants (p < 0.05) (Figure 3B).
Anatomical results are shown in Figure S2. The TU, TL, and TP of N. sibirica were significantly different from the other two gradients under the MWMS gradient (p < 0.05) (Figure 3C–E). Under the LWLS gradient, the TU and TS of the leaves were significantly different from the other two gradients (p < 0.05) (Figure 3C,F). In addition, the TL, TP, and TS of N. sibirica were higher than those of A. sparsifolia under the three water–salt gradients. The P/S decreased with the increase in salinity gradient, and the SR was opposite to P/S. The P/S and CTR of N. sibirica were the highest under MWMS gradient and showed significant differences to the other two gradients (Figure 3G–I).

3.4. Changes of Photosynthetic Parameters of Two Species in Different Habitats

The Pn value of N. sibirica under the LWLS plot was the lowest, and there was a significant difference between it and the other two sample plots (p < 0.05) (Table S1). On the contrary, the Pn value of A. sparsifolia under the LWLS sample was the highest (Figure 4). The variation of Gs and Pn of two plants under the LWLS plot was consistent. With the increase in soil water and salt content, the Tr of N. sibirica showed an increasing trend, while the Tr of A. sparsifolia showed no obvious change trend. It is worth noting that the Ci of N. sibirica was greater than that of A. sparsifolia, especially in the LWLS plot. The WUEi of the two species in HWHS soil was the lowest, indicating that the high water and high salt habitat significantly reduced WUEi.

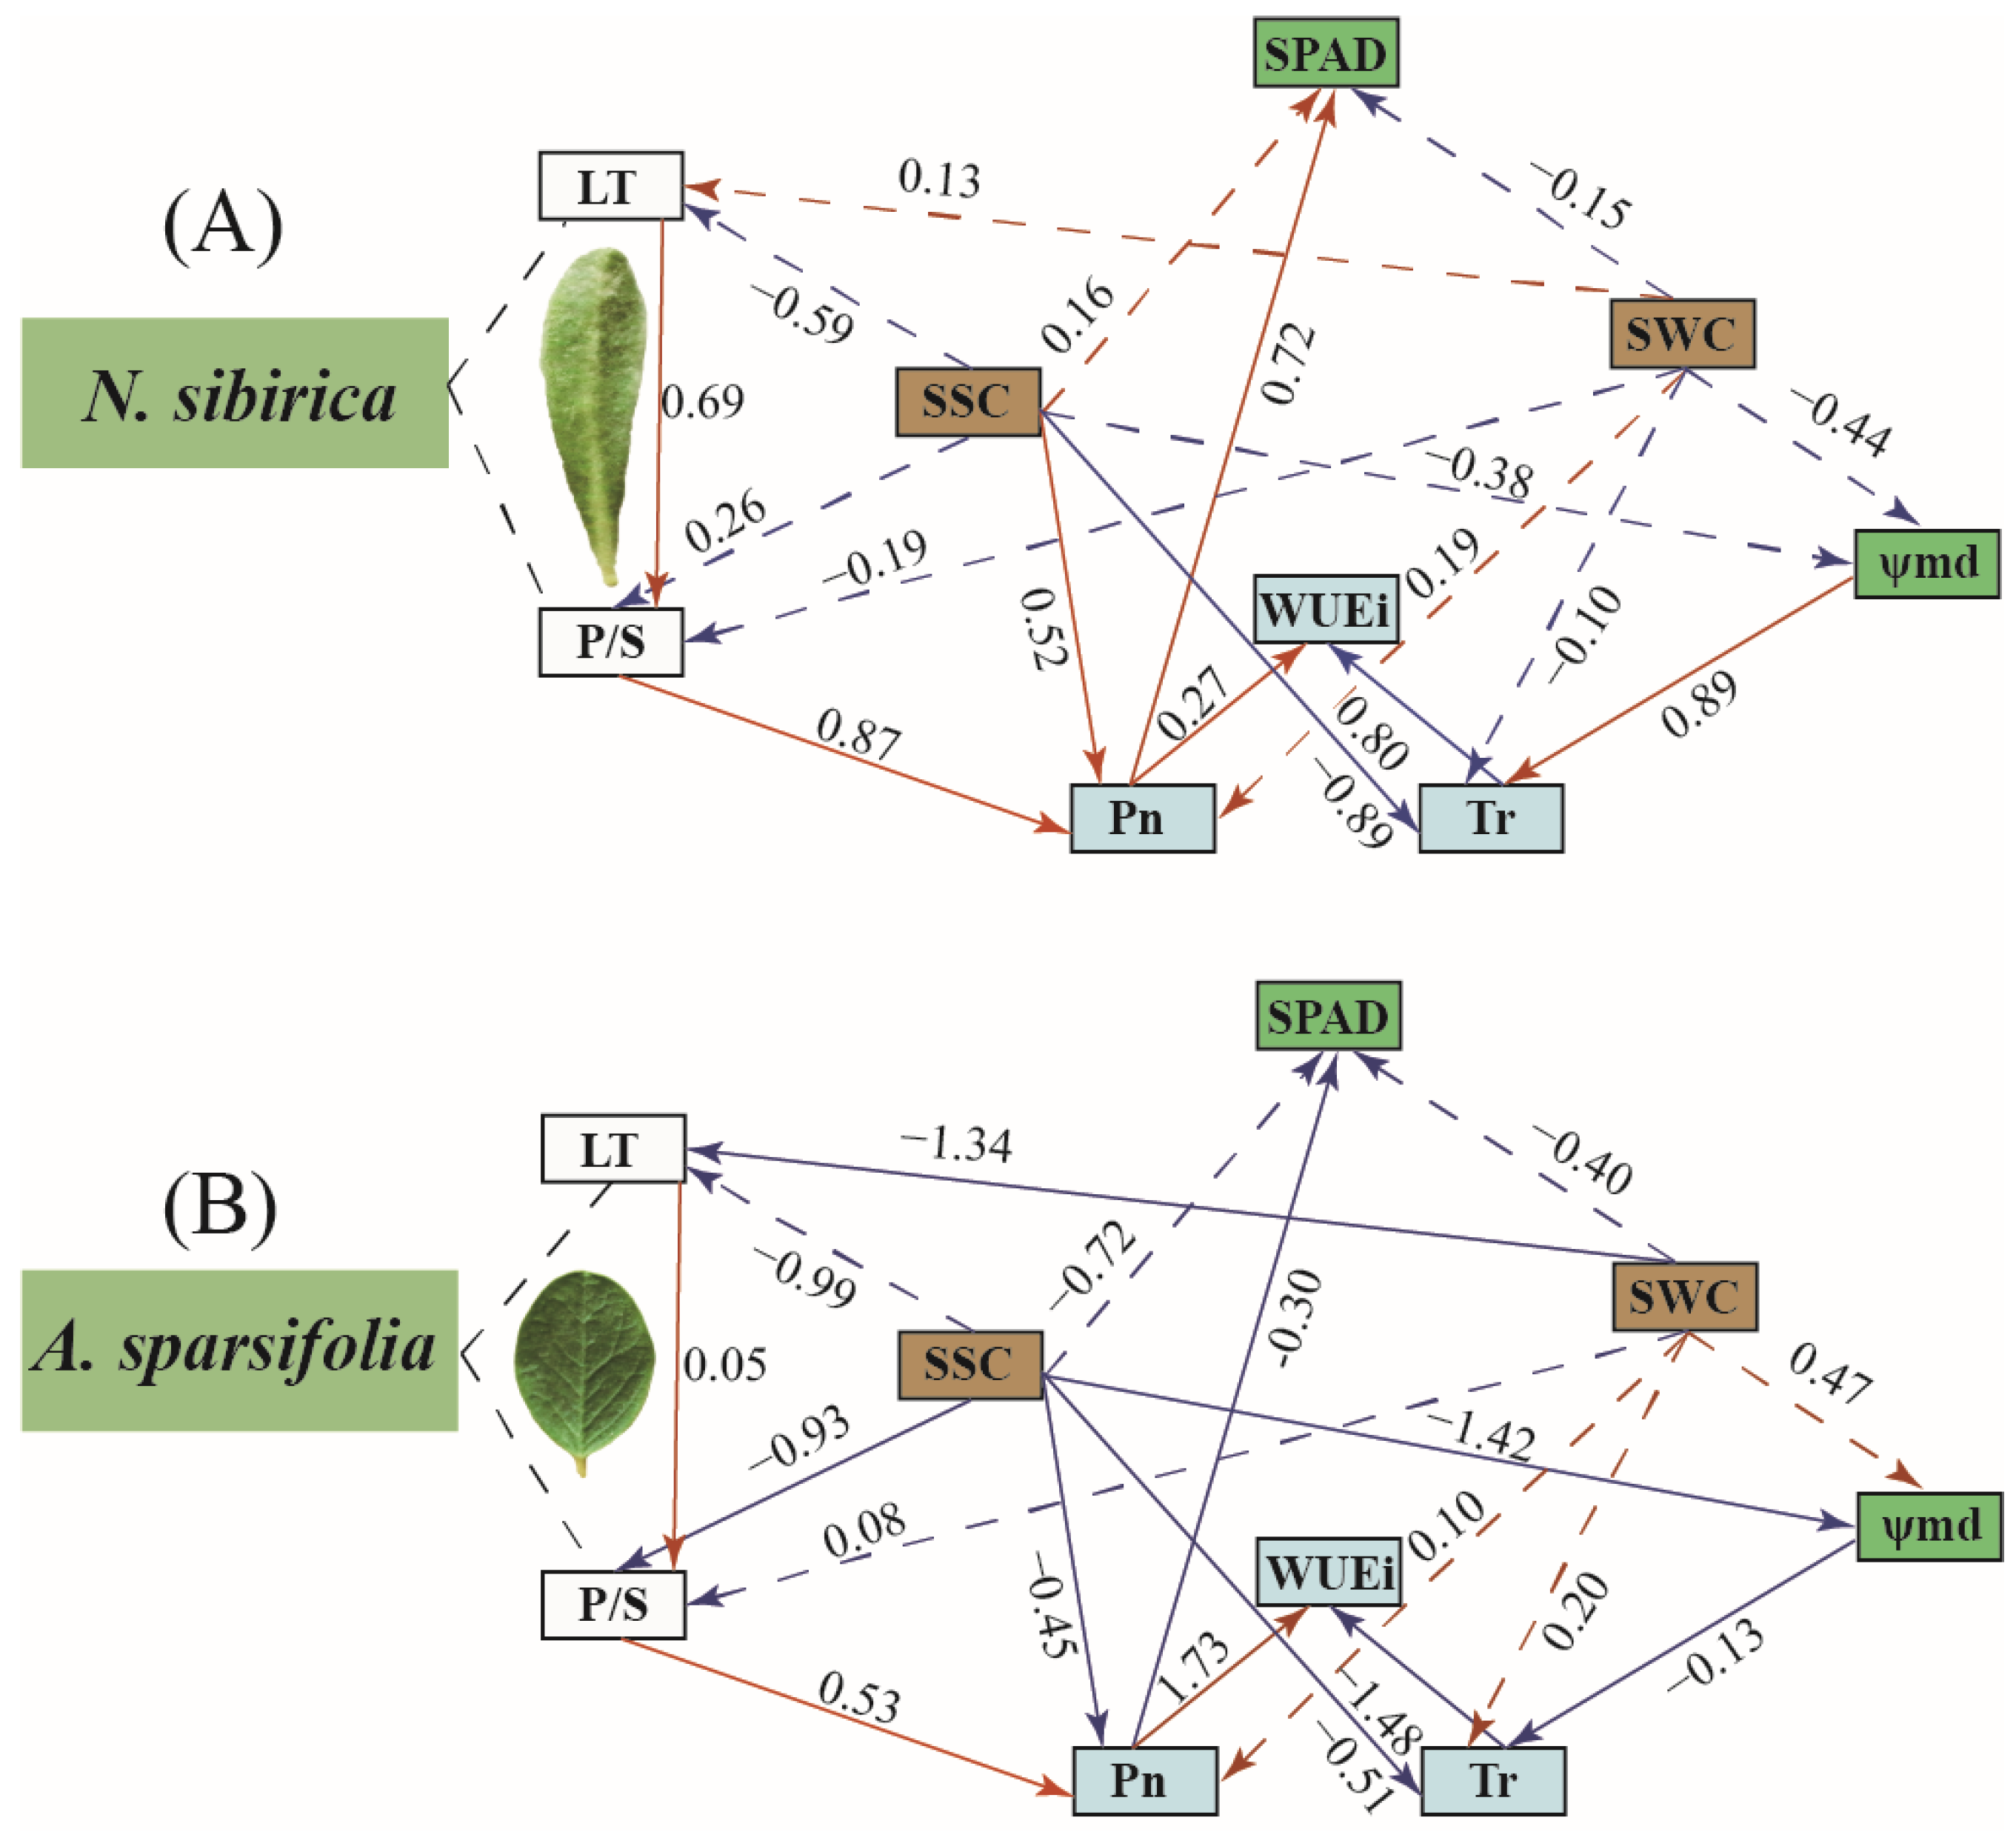
3.5. Driving Factors of WUEi in the Leaves of Two Plants in Different Habitats

The PCA of N. sibirica in three water–salt gradients showed that PC1 explained 47.7% of the total variation. WUEi was negatively correlated with Pn, Gs, CTR, SPAD, TP, and soil factors, and positively correlated with Tr, ψmd, LA, TS, Ci, and SR. The order of contribution of all variables to the first principal component was WUEi > Tr > LA > SSC > pH > ψmd > SWC > Pn > TL (Figure 5A). The PCA of A. sparsifolia showed that PC1 explained 57.2% of the total variation. WUEi was positively correlated with Pn, Gs, Tr, CTR, SPAD, ψmd, TP, P/S, and TL, and negatively correlated with LA, TS, Ci, SR, and soil factors. The contribution of each variable to the first principal component was sorted as follows: SSC > Ci > pH > SWC > P/S > ψmd > SPAD > WUEi > Pn (Figure 5B). On the second principal component axis, the differences between the MWMS gradient and the other two gradients were well distinguished.
The effects of various factors on the WUEi of plants were not single, but were combined (Figure 6). The indirect effects of soil salt and soil water on the WUEi were species-specific, among which, the indirect path coefficient of soil salt on the WUEi of N. sibirica through net photosynthetic rate was greater than that of A. sparsifolia, while the indirect path coefficient of soil water on the WUEi of N. sibirica through net photosynthetic rate was less than that of A. sparsifolia. The LT and P/S of the two plants significantly promoted the internal water use efficiency (p < 0.05). The indirect effect of soil moisture content on WUEi by ψmd was also species-specific.

4. Discussion

4.1. Species-Specific Adaptations of Leaf Morphology and Anatomy

Species-specific physiological adaptations are often related to the environmental conditions in which they grow. The annual rainfall in the Ebinur Lake Nature Reserve is basically the same. In the area close to the river, there is relatively more makeup water from the river; therefore, the soil moisture content is high. At the same time, under conditions of high evaporation, water transports the salt from the deep layer of the soil to the surface layer, thus accumulating more salt on the surface layer of the soil, resulting in a change sequence of soil water and salt on the regional scale in the Ebinur Lake Nature Reserve [23]. Owing to long-term growth in this environment, the LA of N. sibirica decreased with the increase in soil water and salt content, while the LA of A. sparsifolia increased (Figure 3A), which was the result of the comprehensive response of the two plants to the changes of ecological environment on the water–salt gradient, indicating that there were differences in adaptability between the two plants. The leaves of xerophytes are generally small and erect, and most of them are equiplanar [27]. Comprehensive analysis showed that thinner and smaller leaves were the adaptation of N. sibirica to high water and high water–salt habitats, while thinner and larger leaves were the adaptation of A. sparsifolia to high water–salt habitats. The higher water content in the soil may promote leaf growth and increase the LA of the salt-excluding plant A. sparsifolia.
The anatomical characteristics of plants are usually related to the specific environmental conditions in which they grow. The internal anatomical structure of leaves can reflect the influence of environmental factors on plants and the adaptation of plants to the environment, which is the adaptive response of plants to special habitats [28]. The value of P/S can reflect the drought-resistant ability of plants, and the higher the value, the stronger the drought-resistant ability of plants [29]. In this study, the P/S of A. sparsifolia was significantly higher than that of N. sibirica (p < 0.01), indicating that A. sparsifolia had a stronger drought-resistance ability. More and more researchers also believe that this change in anatomical structure is species-specific. Generally, the lower the SR of leaves, the stronger its ability to adapt to drought adversity [14]. Our results showed that the SR of A. sparsifolia was less than that of N. sibirica, which further verified that A. sparsifolia had stronger drought resistance ability. The CTR of both plants was the highest in MWMS habitats, indicating that the decrease in soil water and the increase in soil salt would lead to the decrease in leaf structure density of A. sparsifolia and N. sibirica. Leaf CTR reflects the development degree of spongy tissue inside leaves and can induce leaf spongy tissue degradation in soil with high salt content [30]. However, the CTR of the two plants in this study was inconsistent with the previous research results of the desert plant Lycium ruthenicum in the high water and high salt habitats [31], which may be due to the special physiological adaptation mechanism of halophytes to the high salt environments.

4.2. Effects of Soil Water and Salt Environment on Plant Photosynthesis

Photosynthesis is the most basic life activity of plants and one of the most sensitive physiological processes to environmental stress [32]. The Pn can reflect the ability of plants to photo-contract and synthesize organic matter. For N. sibirica, soil water deficits lead to a decrease in the SPAD and Pn. At this time, by reducing stomatal conductance, N. sibirica can effectively control transpiration loss, which is conducive to maintaining water balance in the body. The photosynthetic rate of N. sibirica in high salt and medium salt soils was significantly higher than in low salt habitats. Ramin et al. [33] used NaCl to stress halophytes, which also showed that an appropriate salt concentration can promote the enhancement of Pn, further indicating that N. sibirica is a relatively saline alkali-tolerant plant. Previous studies have shown that different plant populations have good adaptability to their respective environments and have formed different photosynthetic physiological adaptation characteristics. For example, by studying the stomatal characteristics of A. sparsifolia on the edge of an oasis in the southern edge of the Taklimakan Desert under natural conditions, it was found that A. sparsifolia have low photosynthesis and low transpiration [34], which is consistent with our research results. In this study, the Pn and Tr of A. sparsifolia were generally lower than those of N. sibirica (Figure 4). Principal component analysis showed that soil water content in this study had a great influence on the photosynthesis of the two plants (Figure 5). The reason for this is that, in arid and water-scarce areas, plants cannot efficiently absorb and use water and barely survive. Under different soil water conditions, plants need to maintain high water use efficiency to adapt to the arid and water-scarce environment in desert areas.
Gs is an important physiological indicator that reflects stomatal movement and the ability of plants to conduct CO2 and water vapor. Plants control water vapor exchange with the outside world by adjusting stomatal openings, thus adjusting the net photosynthetic rate and transpiration rate to adapt to different environmental conditions [35]. This study showed that N. sibirica had a stronger stomatal regulation than A. sparsifolia. Many studies have been conducted on the correlation between Gs and Pn, and many results have shown that Pn increases with an increase in Gs, which shows a non-linear relationship, as Pn was affected by both stomatal and non-stomatal limiting factors [36]. In this study, except that the change trend of Pn and Gs of A. sparsifolia under the MWMS gradient was inconsistent, the change rule of Pn and Gs under the other two gradients was consistent with previous studies, and PCA further showed that they were positively correlated.
The WUEi on the leaf scale reflects the water use efficiency of plants. According to previous research results, the WUEi of different plants was different, and the WUEi of the same plant in different habitats also varies with the external environment [37,38]. WUEi can directly reflect the regulation of stomata by showing the relationship between carbon and water, and it has the characteristics of small short-term variability [39]. Therefore, these two indicators were selected when analyzing the change characteristics of water use efficiency. In this study area, WUEi under the gradient of LWLS habitats was higher than that in HWHS habitats, indicating that leaves would strive to improve their own WUEi to maximize resource utilization under the condition of insufficient available water supply [40].

4.3. Correlation between Photosynthetic Characteristics and Other Traits

The mesophyll is a part of leaf photosynthesis, and the change in its tissue structure directly affects photosynthesis. In order to adapt to drought, mesophyll palisade tissue is developed and spongy tissue is relatively reduced, which could improve photosynthetic efficiency and water use efficiency [41]. The mesophyll tissue has an optimal P/S in a certain environment; when the P/S is relatively larger to a certain extent, the Pn of plants is larger [42]. In this study, the P/S of N. sibirica under MWMS and the P/S of A. sparsifolia under the LWLS gradient were the largest, and its corresponding Pn were also the highest. The TP of N. sibirica under the HWHS gradient was the largest. Consistent with our research results, an increase in TP under high salt conditions has also been reported in other halophytes, such as Atriplex oblongifolia [43]. Under the LWLS gradient, the TP of N. sibirica was the lowest, the palisade tissue was degraded, and the corresponding Pn value was also the lowest. This is because there are a large number of chloroplasts on the palisade cells that make up the palisade tissue, and they are the main parts of the plant used for photosynthesis. Therefore, the more developed the palisade tissue, the higher the photosynthetic efficiency of the plant [27].
Some studies on photosynthesis have found that when plants are under drought stress, the water conservation strategy of closing stomata is usually adopted to reduce water loss. However, to ensure photosynthesis, stomata must be opened, so WUEi can be regarded as a functional trait that represents the trade-off between water conservation and photosynthesis [44]. In this study, the correlation between WUEi and Pn was different between the two plants (Figure 5). Qaderi et al. [45] showed that WUEi increased and Pn decreased during the process of drought stress. In this study, the two plants were in natural habitats and were jointly affected by soil water and salt content. Therefore, the relationship between WUEi and Pn was not fully explained only by soil water content changes, and the synergistic effect of water and salt must be considered.

5. Conclusions

Understanding the physiological mechanism of desert plants in saline habitats could provide a theoretical basis for the conservation of plant diversity in salinized desert ecosystems. Our study showed that the two plants had species-specific physiological adaptations to different soil water and salt environments, and A. sparsifolia had a stronger drought resistance. The net photosynthetic rate was positively correlated with SPAD, P/S, and CTR. Soil water content had a great effect on the photosynthesis of the two species, but N. sibirica and A. sparsifolia could maintain a higher water use efficiency to adapt to the arid and water-scarce environment in desert areas. This study quantified the responses of plant physiological traits and their relationship with changes in soil water and salt factors, which will help screen out plants that are more suitable for cultivation under different environmental stressors.

Supplementary Materials

The following supporting information can be downloaded at: https://www.mdpi.com/article/10.3390/f13122189/s1, Figure S1: K-means clustering results of soil water and salt of N. sibirica and A. sparsifolia crown; Figure S2: The leaf slice dissected structure of N. sibirica and A. sparsifolia under different plots; Table S1: Photosynthetic gas exchange parameters of N.sibirica and A.sparsifolia under different water and salt plots.

Author Contributions

Writing—original draft preparation, Y.C.; conceived and designed the experiments, performed the experiments and analyzed the data, Y.C.; writing—editing and supervision, G.L. We are grateful to Y.F. and Z.L. for their help in sample collection. All authors have read and agreed to the published version of the manuscript.

Funding

This work was funded by the Xinjiang Uygur Autonomous Region Graduate Research and Innovation Project (XJ2022G018) and Xinjiang Uygur Autonomous Region Innovation Environment Construction Special Project & Science and Technology Innovation Base Construction Project (PT2107).

Institutional Review Board Statement

Not applicable.

Informed Consent Statement

Not applicable.

Data Availability Statement

Not applicable.

Conflicts of Interest

The authors declare no conflict of interest.

References

  1. Huang, R.; Tian, Q.; Zhang, Y.; Wu, Y.; Li, Z.; Tang, Z.; Zhou, A. Response of Leaf Functional Traits of Landscape Plants to Urban Green Space Environment in Lanzhou, China. Forests 2022, 13, 682. [Google Scholar] [CrossRef]
  2. Díaz, S.; Cabido, M. Vive La Différence: Plant Functional Diversity Matters to Ecosystem Processes. Trends Ecol. Evol. 2001, 16, 646–655. [Google Scholar] [CrossRef]
  3. Fortunel, C.; Fine, P.V.A.; Baraloto, C. Leaf, Stem and Root Tissue Strategies across 758 Neotropical Tree Species. Funct. Ecol. 2012, 26, 1153–1161. [Google Scholar] [CrossRef]
  4. Liu, Y.; Li, P.; Xu, G.C.; Xiao, L.; Ren, Z.P.; Li, Z.B. Growth, Morphological, and Physiological Responses to Drought Stress in Bothriochloa ischaemum. Front. Plant Sci. 2017, 8, 230. [Google Scholar] [CrossRef] [Green Version]
  5. Lawrence, E.H.; Springer, C.J.; Helliker, B.R.; Poethig, R.S. MicroRNA156-mediated Changes in Leaf Composition Lead to Altered Photosynthetic Traits during Vegetative Phase Change. New Phytol. 2021, 231, 1008–1022. [Google Scholar] [CrossRef]
  6. Nagano, A.J.; Kawagoe, T.; Sugisaka, J.; Honjo, M.N.; Iwayama, K.; Kudoh, H. Annual Transcriptome Dynamics in Natural Environments Reveals Plant Seasonal Adaptation. Nat. Plants 2019, 5, 74–83. [Google Scholar] [CrossRef]
  7. Guerfel, M.; Baccouri, O.; Boujnah, D.; Chaïbi, W.; Zarrouk, M. Impacts of Water Stress on Gas Exchange, Water Relations, Chlorophyll Content and Leaf Structure in the Two Main Tunisian Olive (Olea europaea L.) Cultivars. Sci. Hortic. 2009, 119, 257–263. [Google Scholar] [CrossRef]
  8. He, W.; Yan, K.; Zhang, Y.; Bian, L.; Mei, H.; Han, G. Contrasting Photosynthesis, Photoinhibition and Oxidative Damage in Honeysuckle (Lonicera japonica Thunb.) under Iso-Osmotic Salt and Drought Stresses. Environ. Exp. Bot. 2021, 182, 104313. [Google Scholar] [CrossRef]
  9. Zhu, J.-K. Abiotic Stress Signaling and Responses in Plants. Cell 2016, 167, 313–324. [Google Scholar] [CrossRef] [Green Version]
  10. van Zelm, E.; Zhang, Y.; Testerink, C. Salt Tolerance Mechanisms of Plants. Annu. Rev. Plant Biol. 2020, 71, 403–433. [Google Scholar] [CrossRef]
  11. Walcroft, A.; Le Roux, X.; Diaz-Espejo, A.; Dones, N.; Sinoquet, H. Effects of Crown Development on Leaf Irradiance, Leaf Morphology and Photosynthetic Capacity in a Peach Tree. Tree Physiol. 2002, 22, 929–938. [Google Scholar] [CrossRef] [PubMed] [Green Version]
  12. Meir, P.; Levy, P.E.; Grace, J.; Jarvis, P.G. Photosynthetic Parameters from Two Contrasting Woody Vegetation Types in West Africa. Plant Ecol. 2007, 192, 277–287. [Google Scholar] [CrossRef]
  13. Tholen, D.; Boom, C.; Zhu, X.-G. Opinion: Prospects for Improving Photosynthesis by Altering Leaf Anatomy. Plant Sci. 2012, 197, 92–101. [Google Scholar] [CrossRef] [PubMed]
  14. Wright, I.J.; Reich, P.B.; Westoby, M.; Ackerly, D.D.; Baruch, Z.; Bongers, F.; Cavender-Bares, J.; Chapin, T.; Cornelissen, J.H.C.; Diemer, M.; et al. The Worldwide Leaf Economics Spectrum. Nature 2004, 428, 821–827. [Google Scholar] [CrossRef]
  15. Yuan, Y.; Fu, D.P.; Lv, G.H. Inter-specific relations of the dominant plants of the wetland vegetation in the Erbin Lake wetland in Xinjiang Uygur Autonomous Region. Wetl. Sci. 2008, 6, 486–491. [Google Scholar]
  16. Xi, J.B.; Zhang, F.S.; Mao, D.R.; Tian, C.Y.; Dong, Z.C.; Wang, K.F. Species Diversity and Distribution of Halophytic Vegetation in Xinjiang. Sci. Silvae Sin. 2006, 10, 6–12. [Google Scholar]
  17. Tang, X.; Zhang, H.; Shabala, S.; Li, H.; Yang, X.; Zhang, H. Tissue Tolerance Mechanisms Conferring Salinity Tolerance in a Halophytic Perennial Species Nitraria sibirica Pall. Tree Physiol. 2021, 41, 1264–1277. [Google Scholar] [CrossRef]
  18. Zhang, H.; Zhao, Y.; Zhu, J.-K. Thriving under Stress: How Plants Balance Growth and the Stress Response. Dev. Cell 2020, 55, 529–543. [Google Scholar] [CrossRef]
  19. Traditional Uses, Chemistry, Pharmacology, Toxicology and Quality Control of Alhagi sparsifolia Shap: A Review. Available online: https://pubmed.ncbi.nlm.nih.gov/34721046/ (accessed on 18 November 2022).
  20. He, X.; Lv, G.; Qin, L.; Chang, S.; Yang, M.; Yang, J.; Yang, X. Effects of Simulated Nitrogen Deposition on Soil Respiration in a Populus euphratica Community in the Ebinur Lake Area, a Desert Ecosystem of Northwestern China. PLoS ONE 2015, 10, e0137827. [Google Scholar] [CrossRef] [Green Version]
  21. Gong, Y.; Lv, G.; Guo, Z.; Chen, Y.; Cao, J. Influence of Aridity and Salinity on Plant Nutrients Scales up from Species to Community Level in a Desert Ecosystem. Sci. Rep. 2017, 7, 6811. [Google Scholar] [CrossRef] [Green Version]
  22. Yang, X.-D.; Zhang, X.-N.; Lv, G.-H.; Ali, A. Linking Populus euphratica Hydraulic Redistribution to Diversity Assembly in the Arid Desert Zone of Xinjiang, China. PLoS ONE 2014, 9, e109071. [Google Scholar] [CrossRef] [Green Version]
  23. Zhang, X.N.; Lv, G.H.; Yang, X.D.; Qin, L.; He, X.M.; Liu, H.Q. Responses of desert plant diversity, community and interspecific association to soil salinity gradient. Acta Ecol. Sin. 2013, 33, 5714–5722. [Google Scholar] [CrossRef]
  24. Bao, S.D. Soil and AgrIcultural Chemistry Analysis, 3rd ed.; China Agriculture Press: Beijing, China, 2000. [Google Scholar]
  25. Guo, Z.C.; Zeng, F.J.; Liu, P.; Li, C.J.; Zhang, B. Photosynthesis and water metabolism of Alhagi sparsifolia Shap. in different geographical populations. Arid. Zone Res. 2016, 33, 371–378. [Google Scholar]
  26. Olaranont, Y.; Stewart, A.B.; Traiperm, P. Effects of Crude Oil on Plant Growth and Leaf Anatomical Structures in a Common Coastal Plant. Int. J. Phytoremediat. 2021, 23, 162–170. [Google Scholar] [CrossRef] [PubMed]
  27. Dong, J.F.; Li, C.H.; Liu, G.H.; Zhou, S.Q.; Su, Y.L.T. Analysis of drought resistance by leaf anatomical structure of six species of sandy willows. J. Desert Res. 2009, 29, 480–484. [Google Scholar]
  28. Landi, S.; Capasso, G.; Esposito, S. Different G6PDH Isoforms Show Specific Roles in Acclimation to Cold Stress at Various Growth Stages of Barley (Hordeum vulgare) and Arabidopsis thaliana. Plant Physiol. Biochem. 2021, 169, 190–202. [Google Scholar] [CrossRef]
  29. Liang, W.B.; Zhao, L.J.; Li, J.X.; Xiao, L. Leaves comparative anatomy of Styrax in Hunan. Plant Res. 2014, 34, 148–158. [Google Scholar]
  30. Shiyab, S.M.; Shatnawi, M.A.; Shibli, R.A.; Al Smeirat, N.G.; Ayad, J.; Akash, M.W. Growth, Nutrient Acquisition, And Physiological Responses Of Hydroponic Grown Tomato To Sodium Chloride Salt Induced Stress. J. Plant Nutr. 2013, 36, 665–676. [Google Scholar] [CrossRef]
  31. Ni, Q.; Ma, Y.J.; Yang, W.P.; Yang, Y.Y. Effect of NaCl treatment on the anatomy of Lycium ruthenicum leaves. Pratacult. Sci. 2019, 36, 1803–1810. [Google Scholar]
  32. Ramachandra, R.A.; Viswanatha, C.K.; Munusamy, V. Drought-Induced Responses of Photosynthesis and Antioxidant Metabolism in Higher Plants. J. Plant Physiol. 2004, 161, 1189–1202. [Google Scholar]
  33. Ramin, A.A. Effects of Salinity and Temperature on Germination Seedling Establishment of Sweet Basil (Ocimum basilicum L.). J. Herbs Spices Med. Plants 2006, 11, 81–90. [Google Scholar] [CrossRef]
  34. Deng, X.; Li, X.M.; Zhang, X.M.; Ye, W.H. A study of the gas exchange characteristics of four desert plants. Chin. J. Plant Ecol. 2002, 26, 605–612. [Google Scholar]
  35. Hernandez-Santana, V.; Fernández, J.; Rodriguez-Dominguez, C.; Romero, R.; Diaz-Espejo, A. The Dynamics of Radial Sap Flux Density Reflects Changes in Stomatal Conductance in Response to Soil and Air Water Deficit. Agric. For. Meteorol. 2016, 218–219, 92–101. [Google Scholar] [CrossRef] [Green Version]
  36. Gao, G.L.; Feng, Q.; Zhang, X.Y.; Si, J.H.; Yu, T.F. An overview of stomatal and non-stomatal limitations to photosynthesis of plants. Arid. Zone Res. 2018, 35, 929–937. [Google Scholar] [CrossRef]
  37. Medlyn, B.E.; De Kauwe, M.G.; Lin, Y.-S.; Knauer, J.; Duursma, R.A.; Williams, C.A.; Arneth, A.; Clement, R.; Isaac, P.; Limousin, J.-M.; et al. How Do Leaf and Ecosystem Measures of Water-Use Efficiency Compare? New Phytol. 2017, 216, 758–770. [Google Scholar] [CrossRef] [Green Version]
  38. Jian, S.; Wan, S.; Piao, S.; Hui, D.; Hovenden, M.J.; Ciais, P.; Liu, Y.; Liu, Y.; Zhong, M.; Zheng, M. Elevated CO2 Does Not Stimulate Carbon Sink in a Semi-arid Grassland. Ecol. Lett. 2019, 22, 458–468. [Google Scholar] [CrossRef]
  39. Battipaglia, G.; Saurer, M.; Cherubini, P.; Calfapietra, C.; Mccarthy, H.R.; Norby, R.J.; Cotrufo, M.F. Elevated CO2 Increases Tree-level Intrinsic Water Use Efficiency: Insights from Carbon and Oxygen Isotope Analyses in Tree Rings across Three Forest FACE Sites. New Phytol. 2013, 197, 544–554. [Google Scholar] [CrossRef] [Green Version]
  40. Duan, B.B.; Zhao, C.Z.; Xu, T.; Zheng, H.L.; Feng, W.; Han, L. Correlation analysis between vein density and stomatal traits of Robinia pseudoacacia in different aspects of Beishan Mountain in Lanzhou. Chin. J. Plant Ecol. 2016, 40, 1289–1297. [Google Scholar]
  41. Chartzoulakis, K.; Patakas, A.; Kofidis, G.; Bosabalidis, A.; Nastou, A. Water Stress Affects Leaf Anatomy, Gas Exchange, Water Relations and Growth of Two Avocado Cultivars. Sci. Hortic. 2002, 95, 39–50. [Google Scholar] [CrossRef]
  42. Fei, X.; Guo, W.; Xu, W.; Wei, Y.; Wang, R. Leaf Morphology Correlates with Water and Light Availability: What Consequences for Simple and Compound Leaves? Prog. Nat. Sci. 2009, 19, 1789–1798. [Google Scholar] [CrossRef]
  43. Nobel, L. Salinity Effects on Leaf Anatomy. Plant Physiol. 1979, 63, 700–703. [Google Scholar] [CrossRef]
  44. Jarvis, P.G.; Mcnaughton, K.G. Stomatal Control of Transpiration: Scaling Up from Leaf to Region. Adv. Ecol. Res. 1986, 15, 1–49. [Google Scholar] [CrossRef]
  45. Qaderi, M.M.; Reid, D.M.; Yeung, E.C. Morphological and Physiological Responses of Canola (Brassica napus) Siliquas and Seeds to UVB and CO2 under Controlled Environment Conditions. Environ. Exp. Bot. 2007, 60, 428–437. [Google Scholar] [CrossRef]
Figure 1. The study area and plots. (A) Location map of the Xinjiang Uygur Autonomous Region; (B) Location of the study area; (C) Leaves of the N. sibirica; (D) Leaves of the A. sparsifolia; (E) The two plants selected for each plot.
Forests 13 02189 g001
Figure 2. Changes in SPAD and water potential of leaves. (A) The changes of SPAD of N. sibirica and A. sparsifolia; (B) The changes of water potential of N. sibirica and A. sparsifolia. The error bars show the standard deviations of the means. Different lowercase letters (a, b, c) above the error bars indicate the same index of N. sibirica under different plots (p ≤ 0.05). Different capital letters (A, B, C) above the error bars indicate the same index of A. sparsifolia under different plots (p ≤ 0.05). *, *** indicate that F values were significant between N. sibirica and A. sparsifolia at p ≤ 0.05, 0.001, respectively.
Forests 13 02189 g002
Figure 3. Changes in LA, LT, TU, TL, TP, TS, P/S, CTR, and SR of N. sibirica and A. sparsifolia under different plots. (A) Changes in LA (leaf area) of two plants; (B) Changes in LT (thickness of leaf) of two plants; (C) Changes in TU (thickness of upper epidermis) of two plants; (D) Changes in TL (thickness of lower epidermis) of two plants; (E) Changes in TP (thickness of palisade tissue) of two plants; (F) Changes in TS (thickness of sponge tissue) of two plants; (G) Changes in P/S (the palisade tissue and spongy tissue ratio) of two plants; (H) Changes in CTR (the tightness of palisade tissue) of two plants; (I) Changes in SR (the looseness of palisade tissue) of two plants. Different lowercase letters (a, b, c) above the error bars indicate the same index of N. sibirica under different plots (p ≤ 0.05). Different capital letters (A, B, C) above the error bars indicate the same index of A. sparsifolia under different plots (p ≤ 0.05). *, **, ***, indicate that F values were significant at p ≤ 0.05, 0.01, 0.001, respectively.
Forests 13 02189 g003
Figure 4. Changes in net photosynthetic rate (Pn, (A,E)), stomatal conductance (Gs, (B,F)), transpiration rate (Tr, (C,G)), intercellular CO2 concentration (Ci, (D,H)), and WUEi (I,J) of N. sibirica and A. sparsifolia under different plots. Different capital letters (A, B) above the error bars indicate the WUEi of A. sparsifolia and N. sibirica under different plots.
Forests 13 02189 g004
Figure 5. Biplot of principal components analysis (PCA) for the photosynthetic characteristics and soil and leaf physiological traits for two species of (A) N. sibirica and (B) A. sparsifolia. The positions of the squares and arrows indicate the composite principal component score of each treatment and trait, respectively.
Forests 13 02189 g005
Figure 6. Path coefficients of photosynthesis and other factors. (A) Path coefficients of N. sibirica; (B) Path coefficients of A. sparsifolia. The dotted line indicates that the path coefficient is not significant, the solid line indicates that the path coefficient is significant, the red line indicates that the path coefficient is positive, and the blue line indicates that the path coefficient is negative.
Forests 13 02189 g006
Table 1. Detailed information about the location of the three plots.
PlotLongitudeLatitudeAltitude (m)
HWHS83°33′45″44°37′11″260.94
MWMS83°33′57″44°38′35″245.45
LWLS83°34′00″44°39′37″242.80
Table 2. The soil environmental factors in three plots.
PlotSWC (%)SSC (g/kg)pH
HWHS11.80 ± 3.44 A11.63 ± 1.82 A8.26 ± 0.26 A
MWMS3.04 ± 1.27 B4.46 ± 0.22 B7.94 ± 0.06 B
LWLS1.42 ± 0.65 C3.00 ± 0.13 C7.87 ± 0.06 B
Note: SWC, soil water content; SSC, soil salinity content. Different capital letters (A, B, C) indicate significant differences at the 0.05 (p < 0.05) level among different plots.
Publisher’s Note: MDPI stays neutral with regard to jurisdictional claims in published maps and institutional affiliations.

