
Novel Yield Model of Pinus patula Schltdl. & Cham. Growth near the Ecological Limit in Northwestern Peruvian Andes
 , , ,
, , ,
Abstract
:1. Introduction
2. Materials and Methods
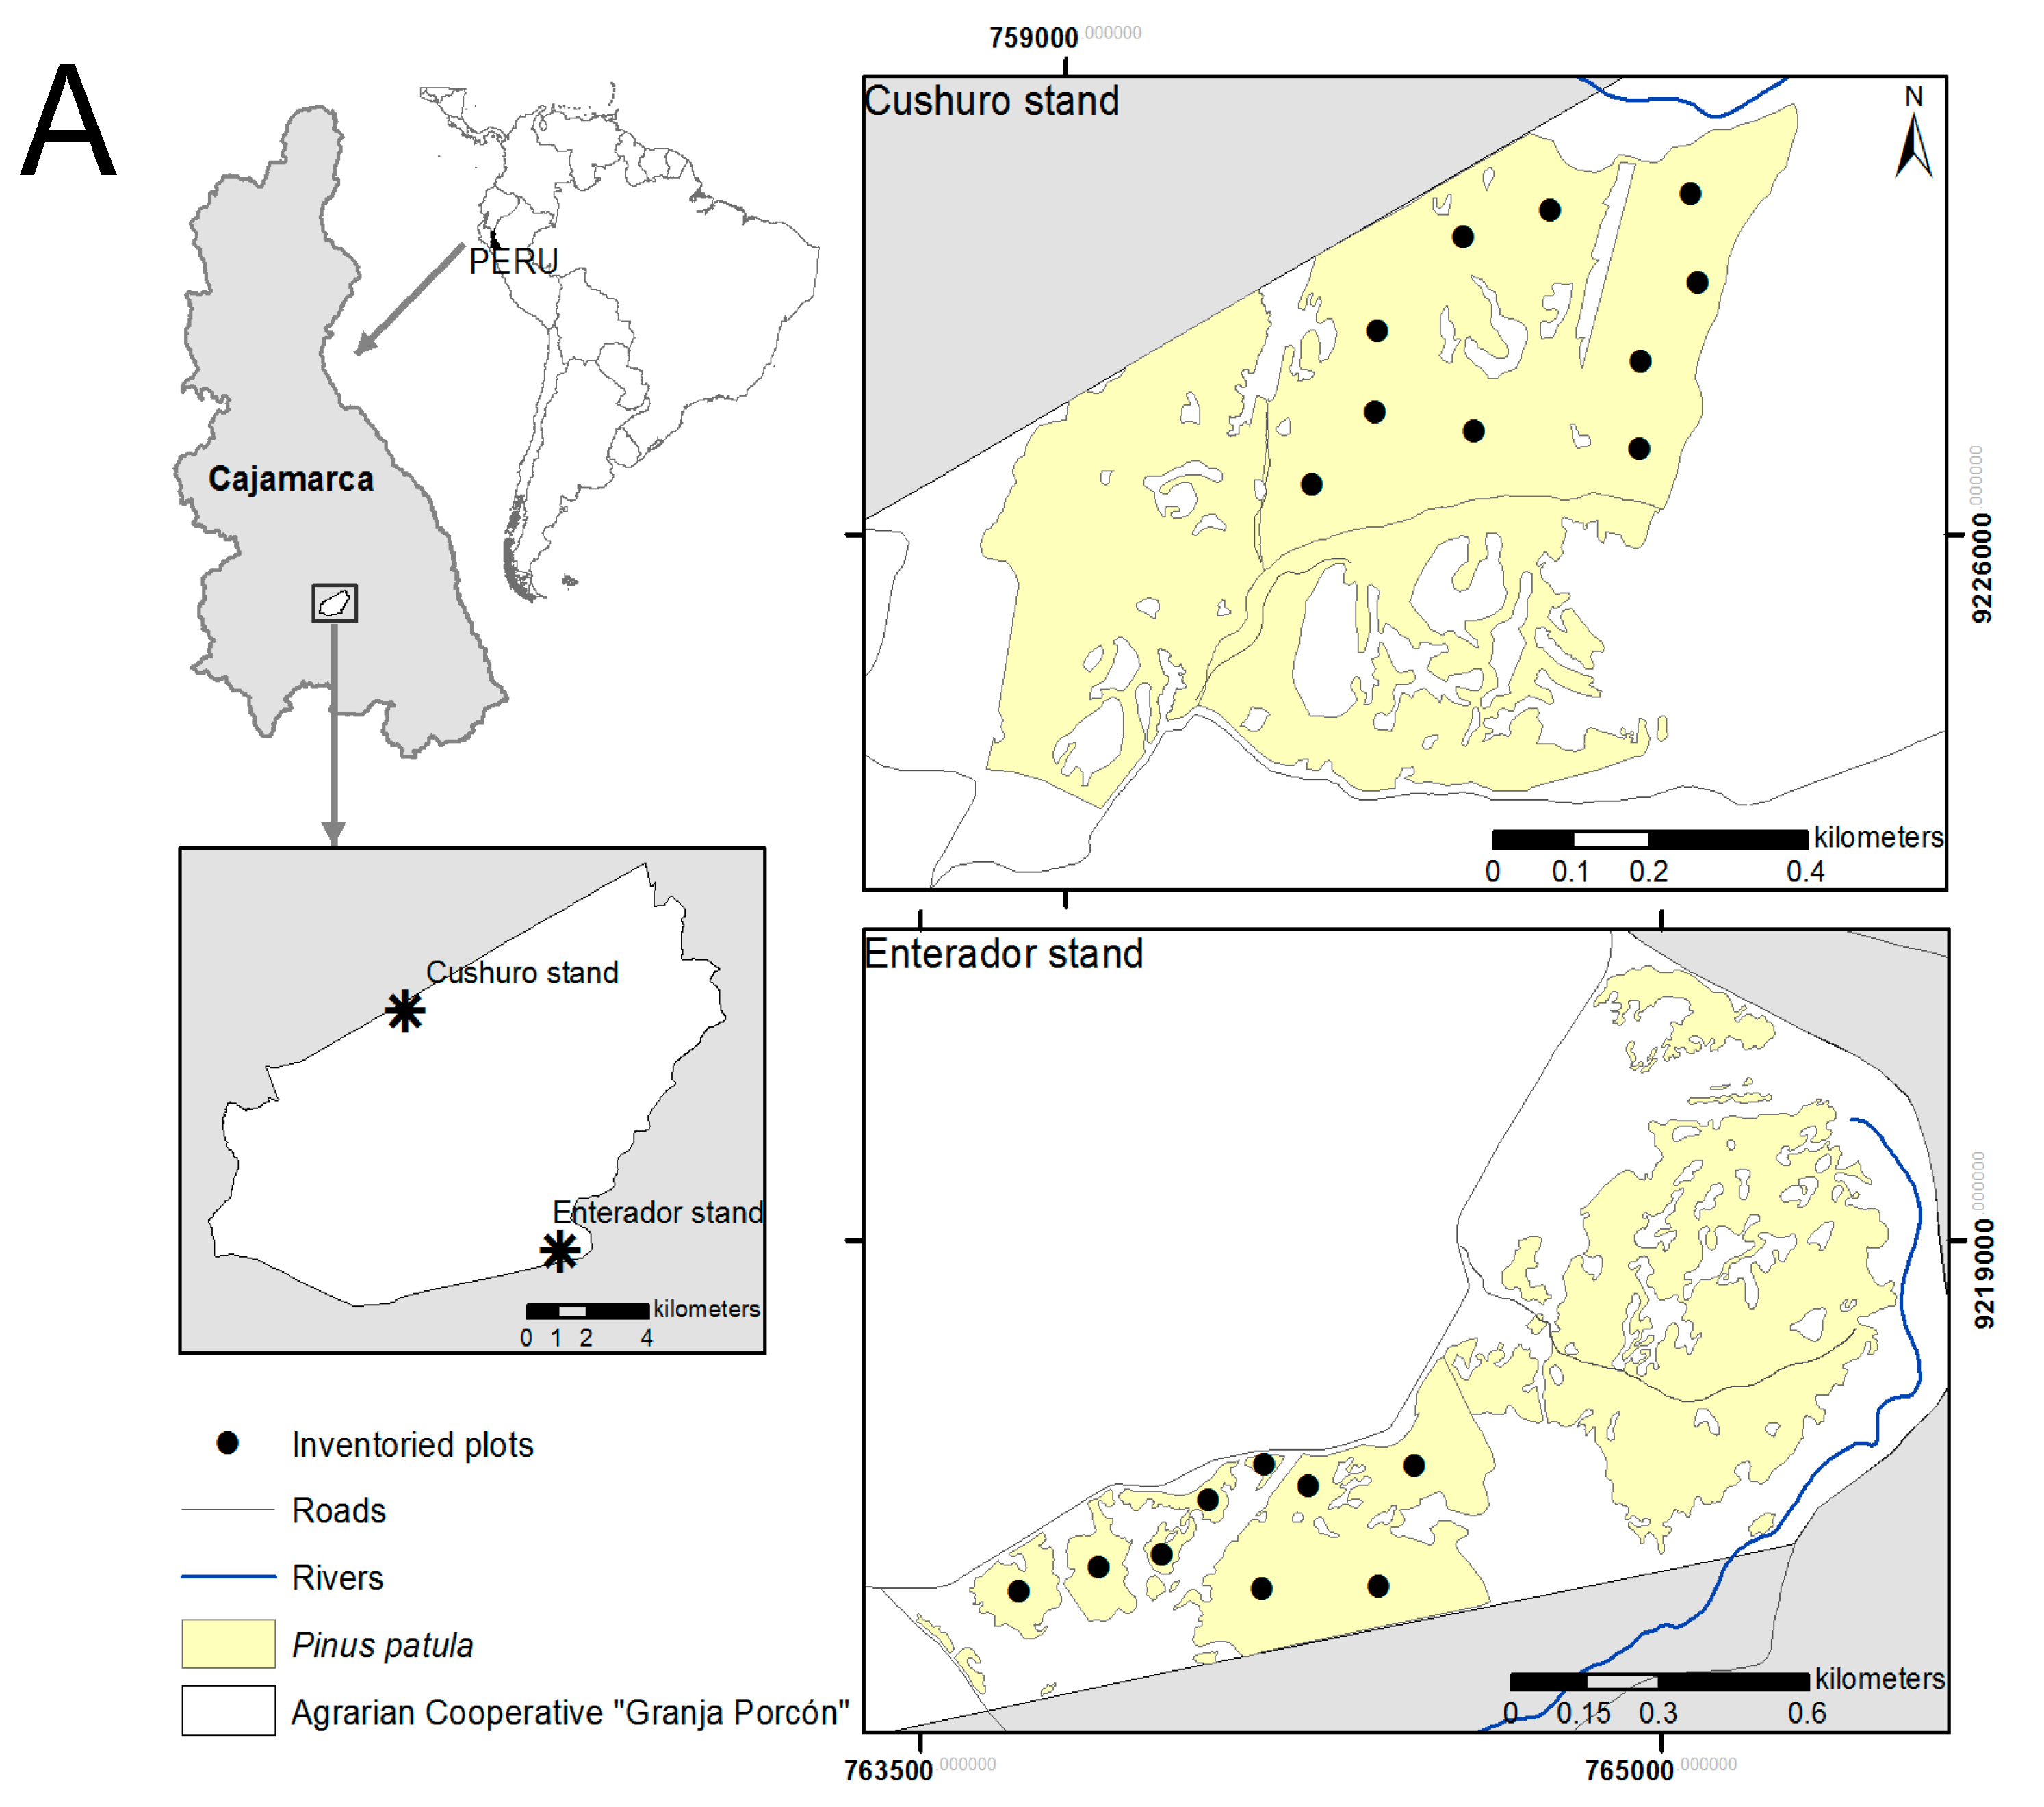
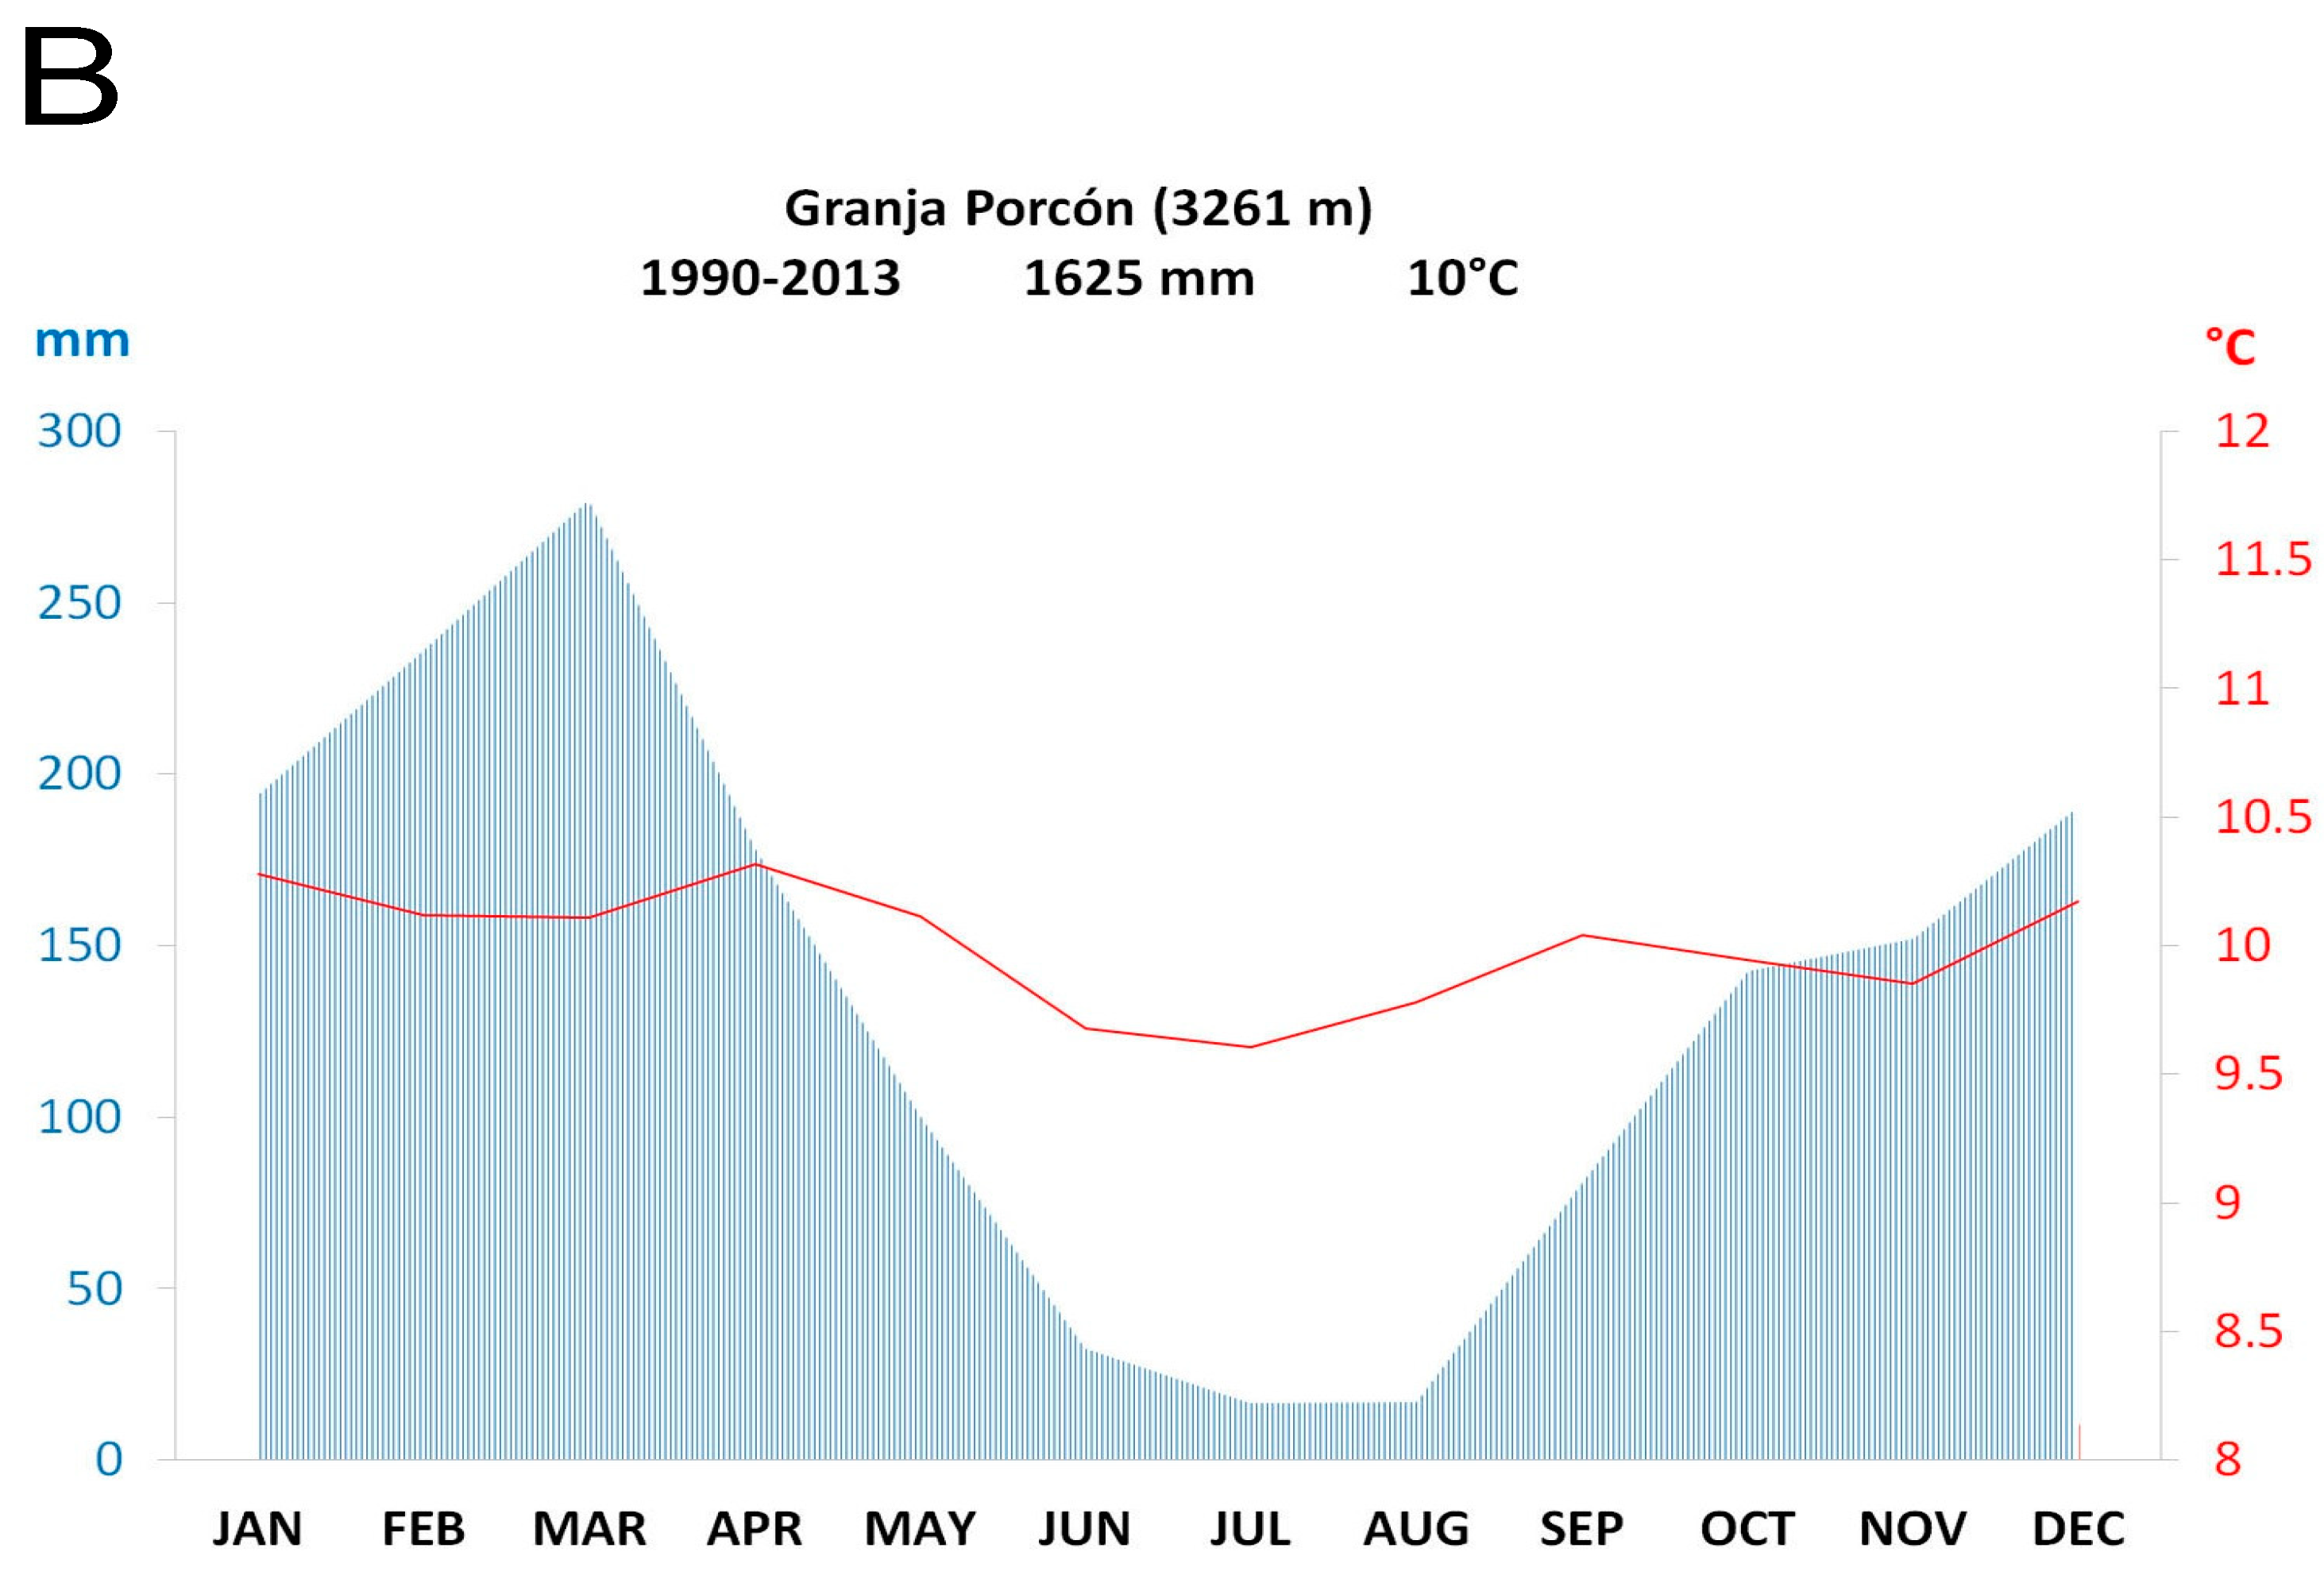
2.1. Study Area and Experimental Design
2.2. Wood Sample Collection and Preparation
2.3. Stem Analysis
2.4. Stand Analysis
2.5. Wood Production Simulation
3. Results
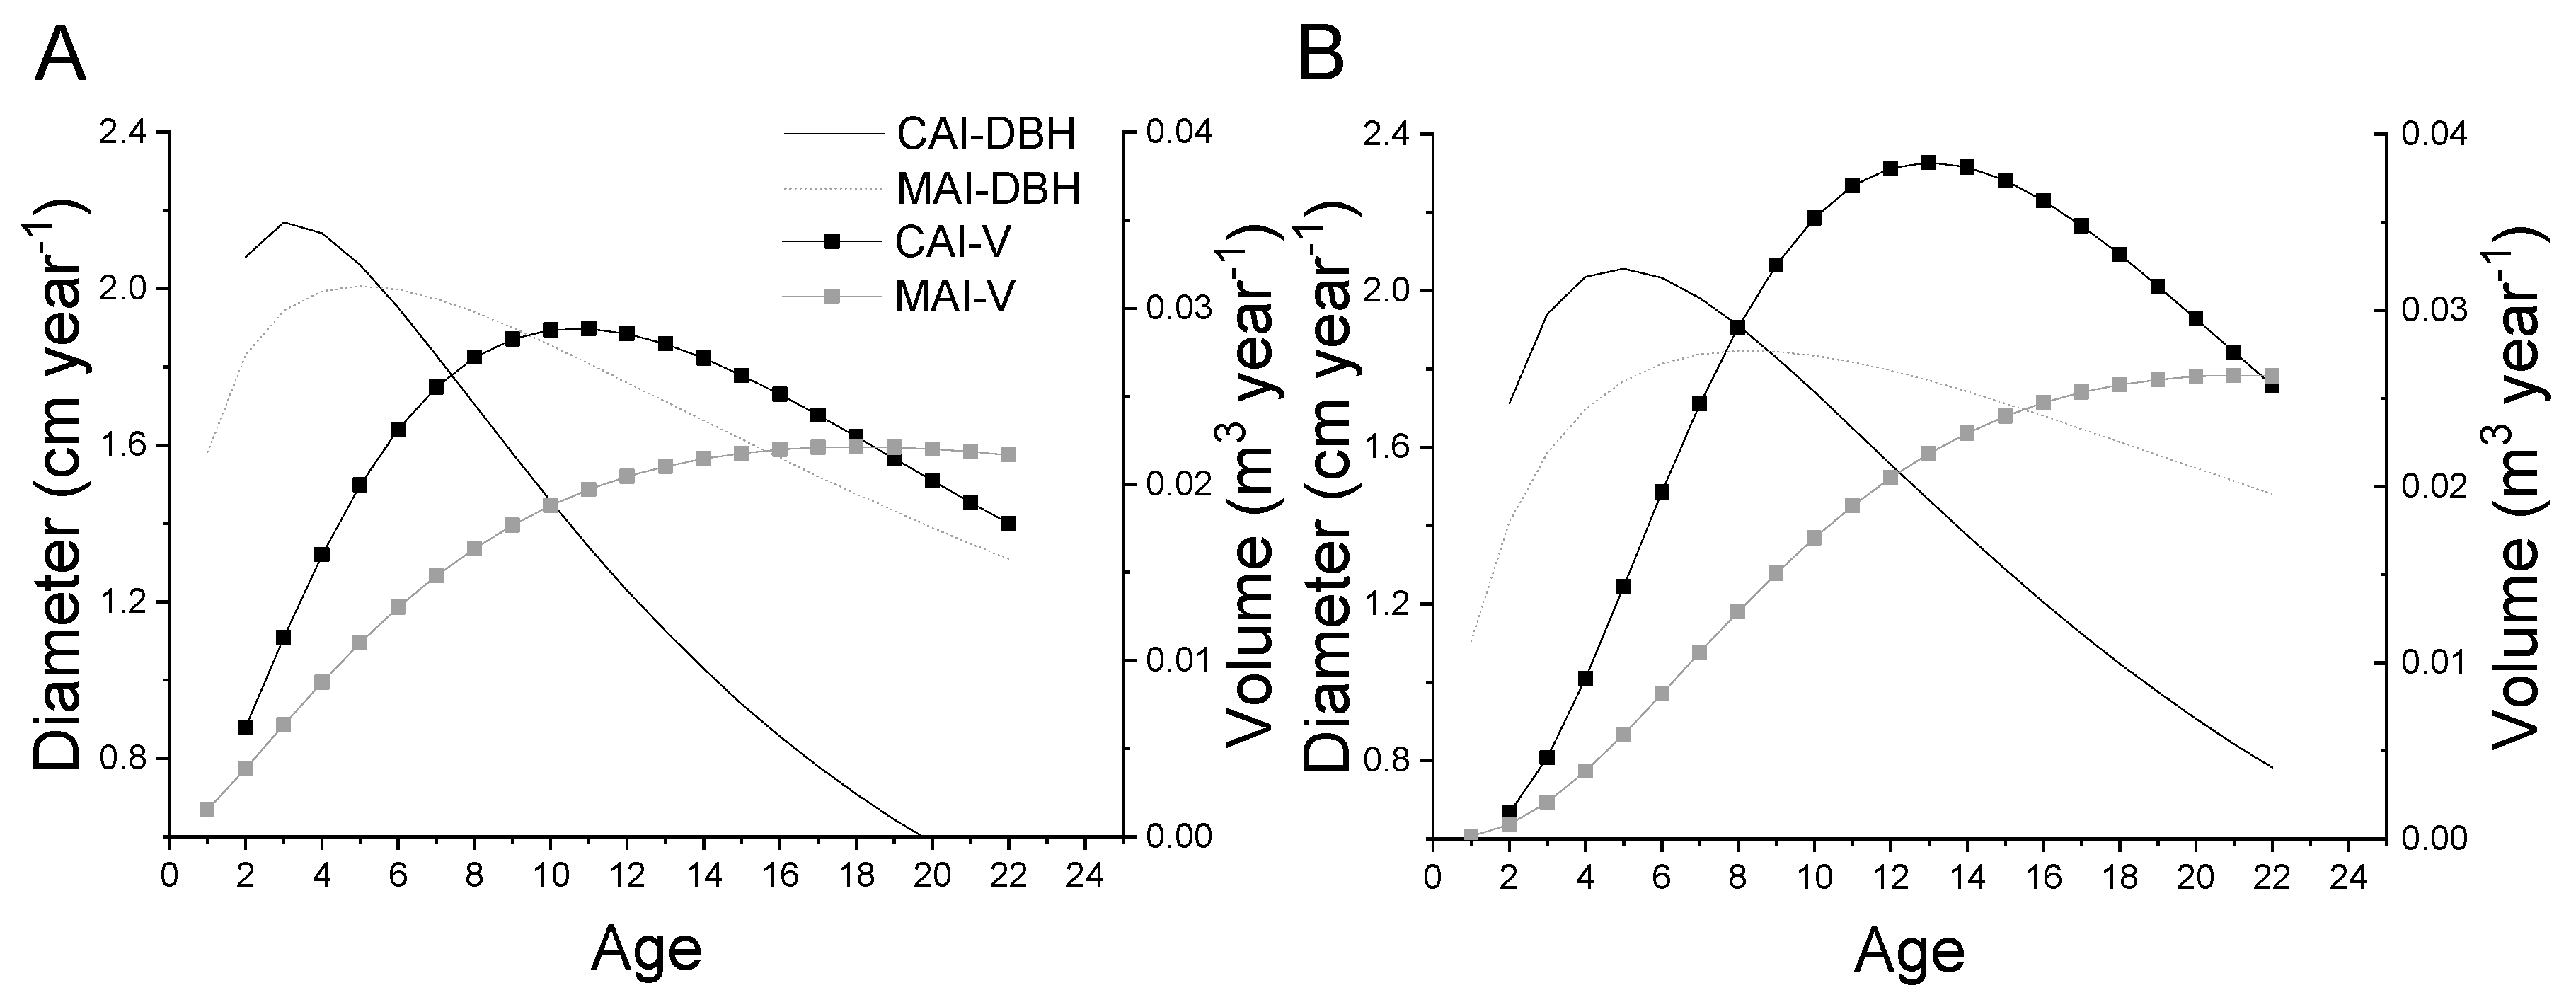
3.1. Stem Growth
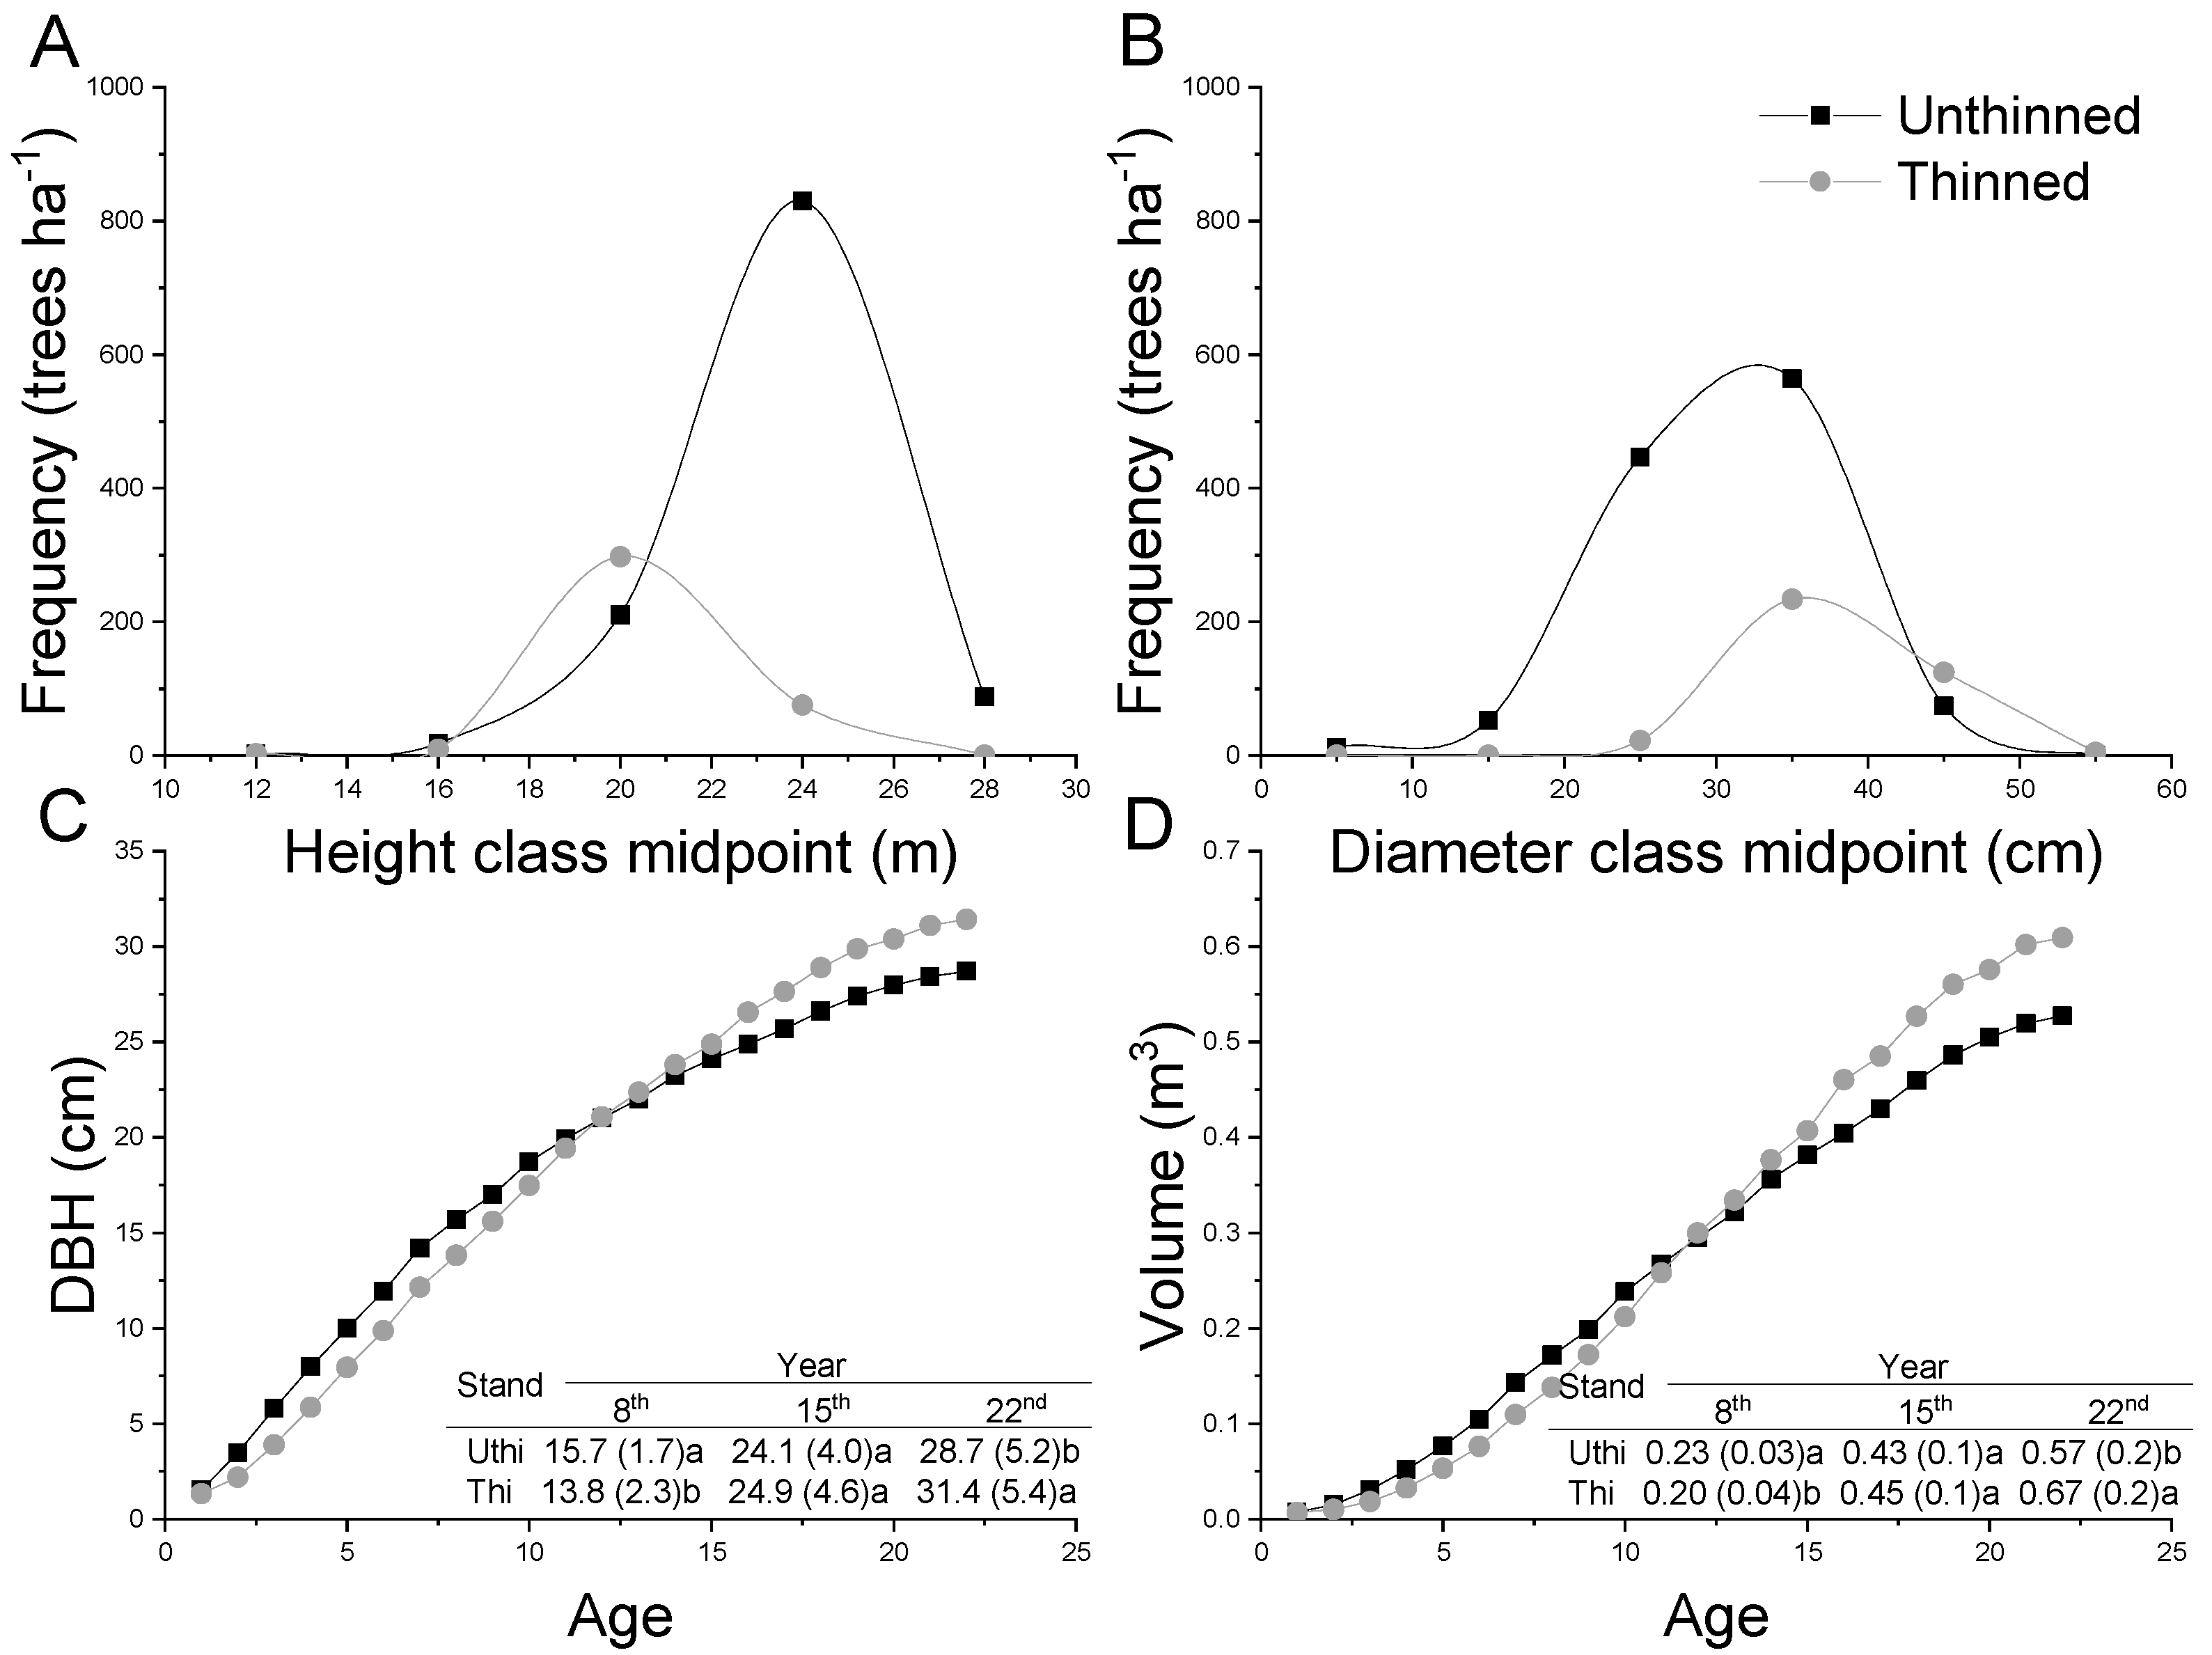
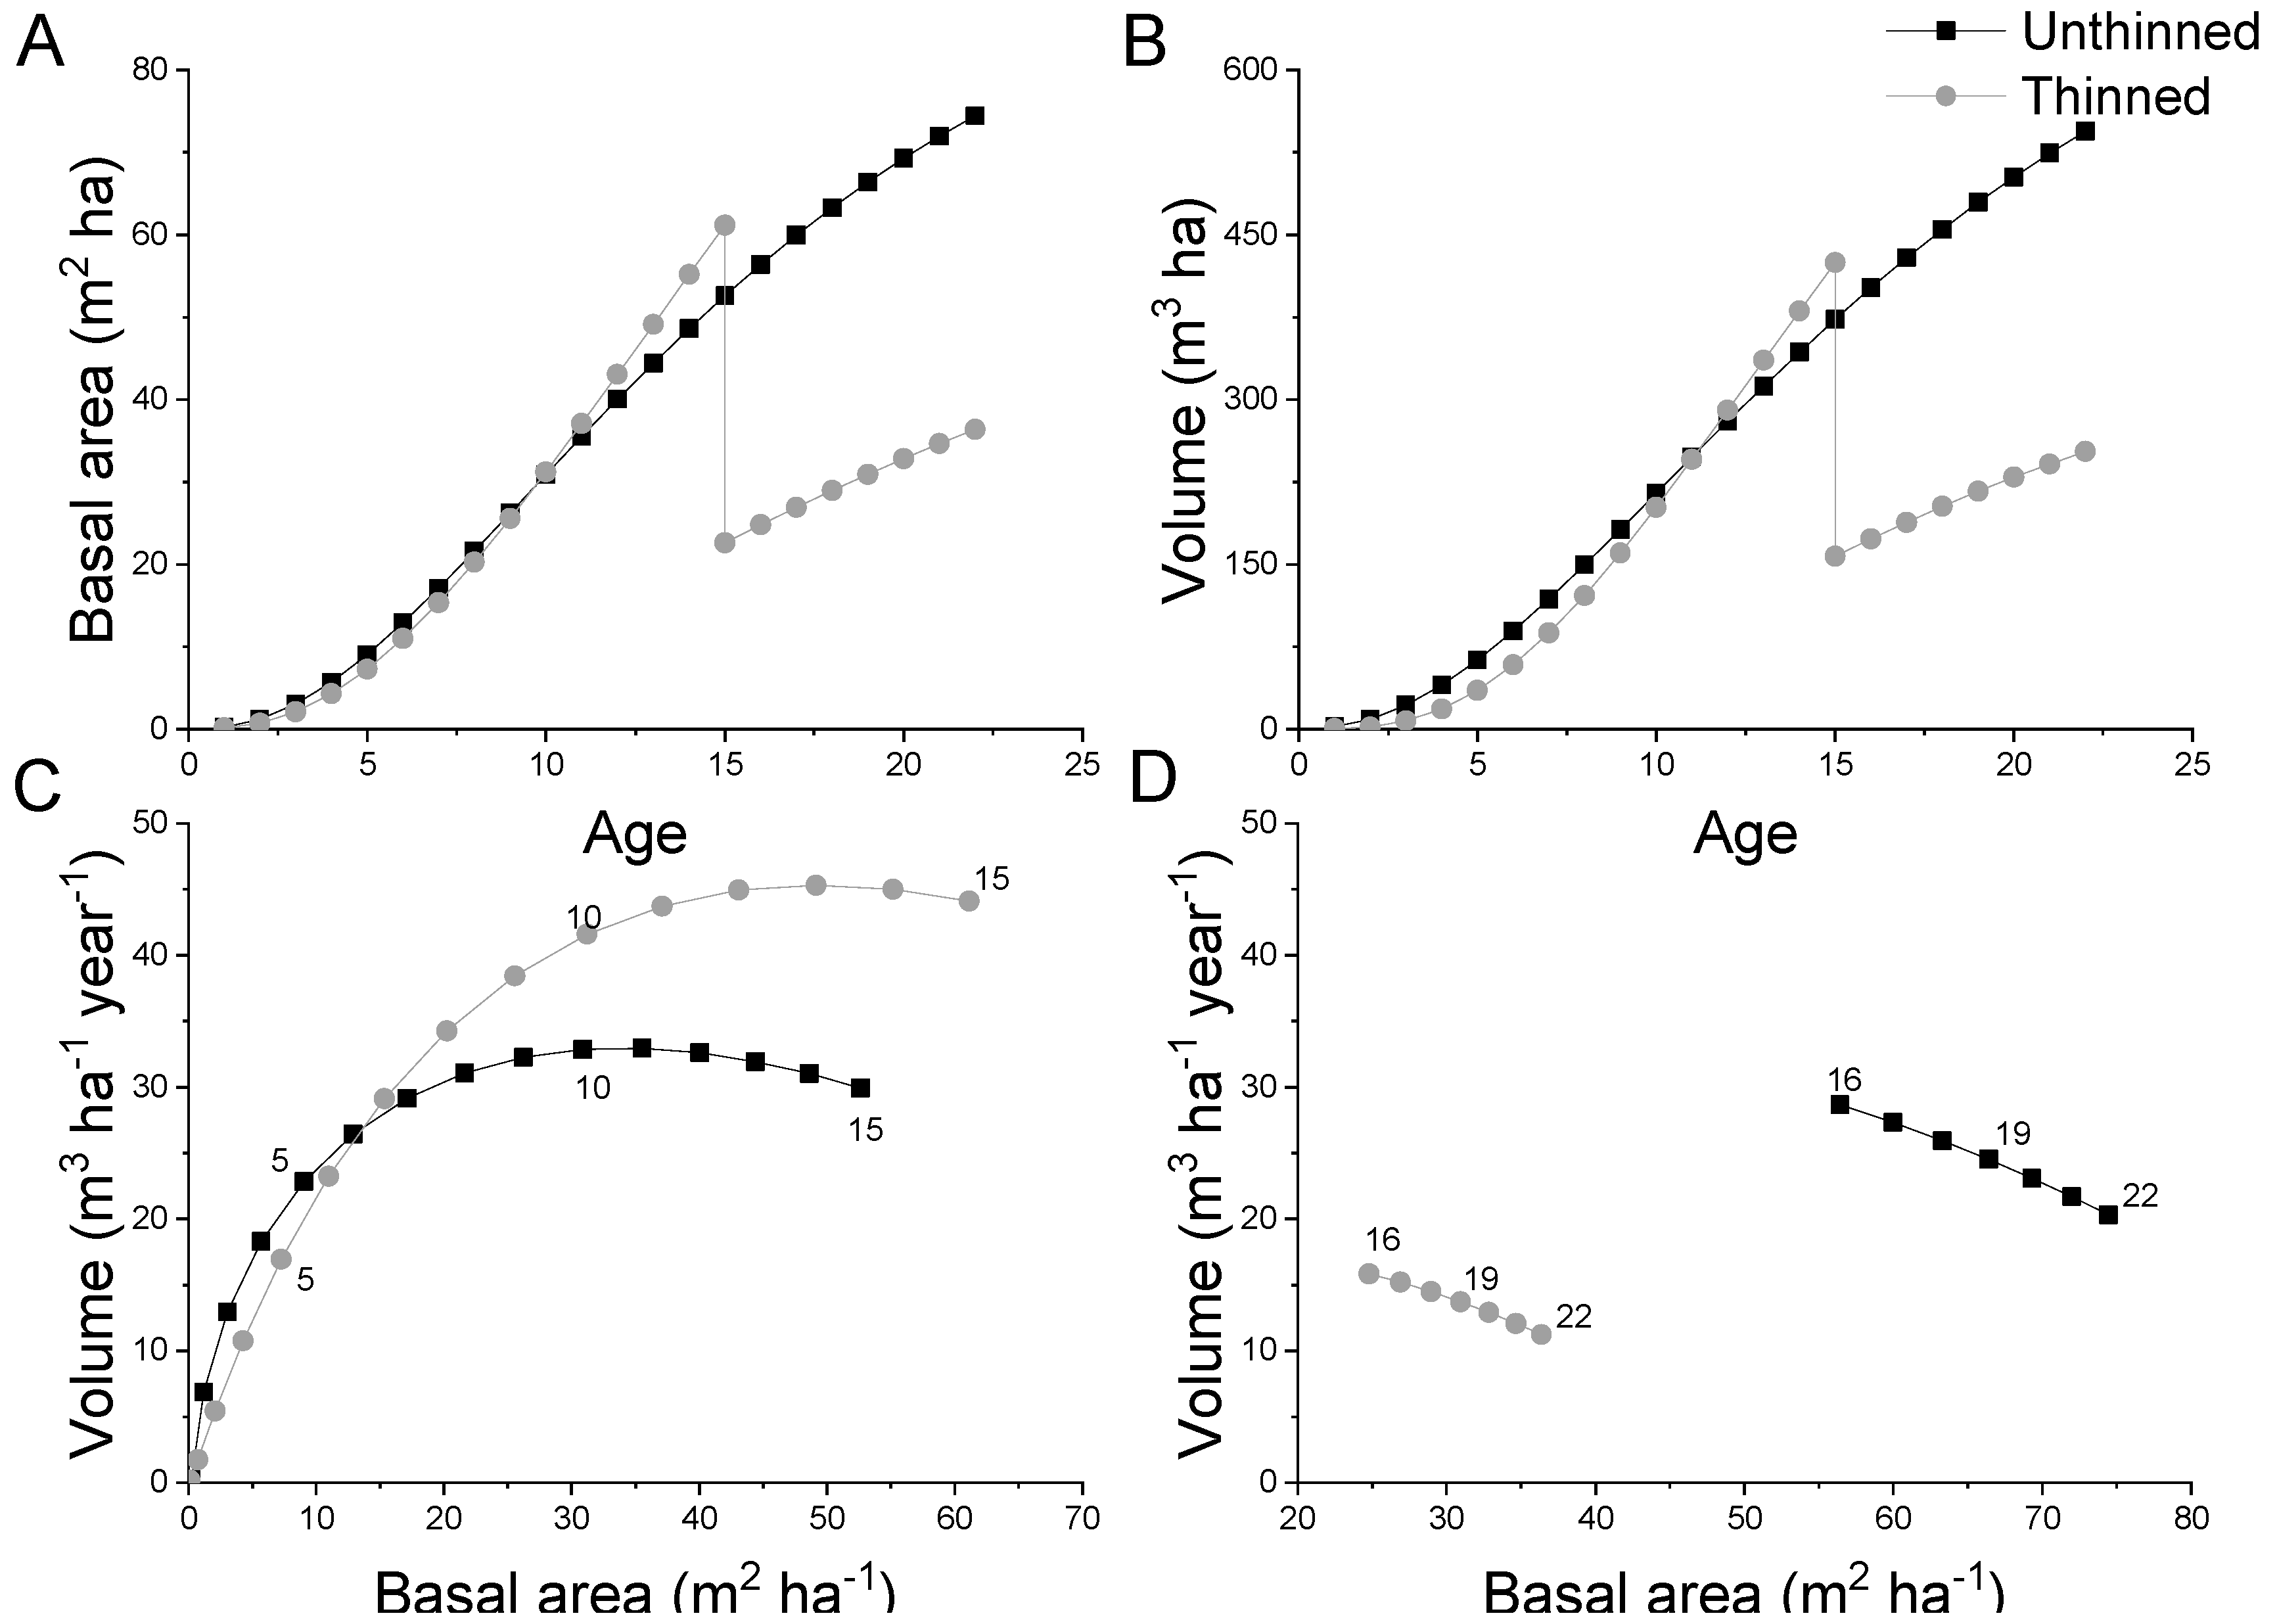
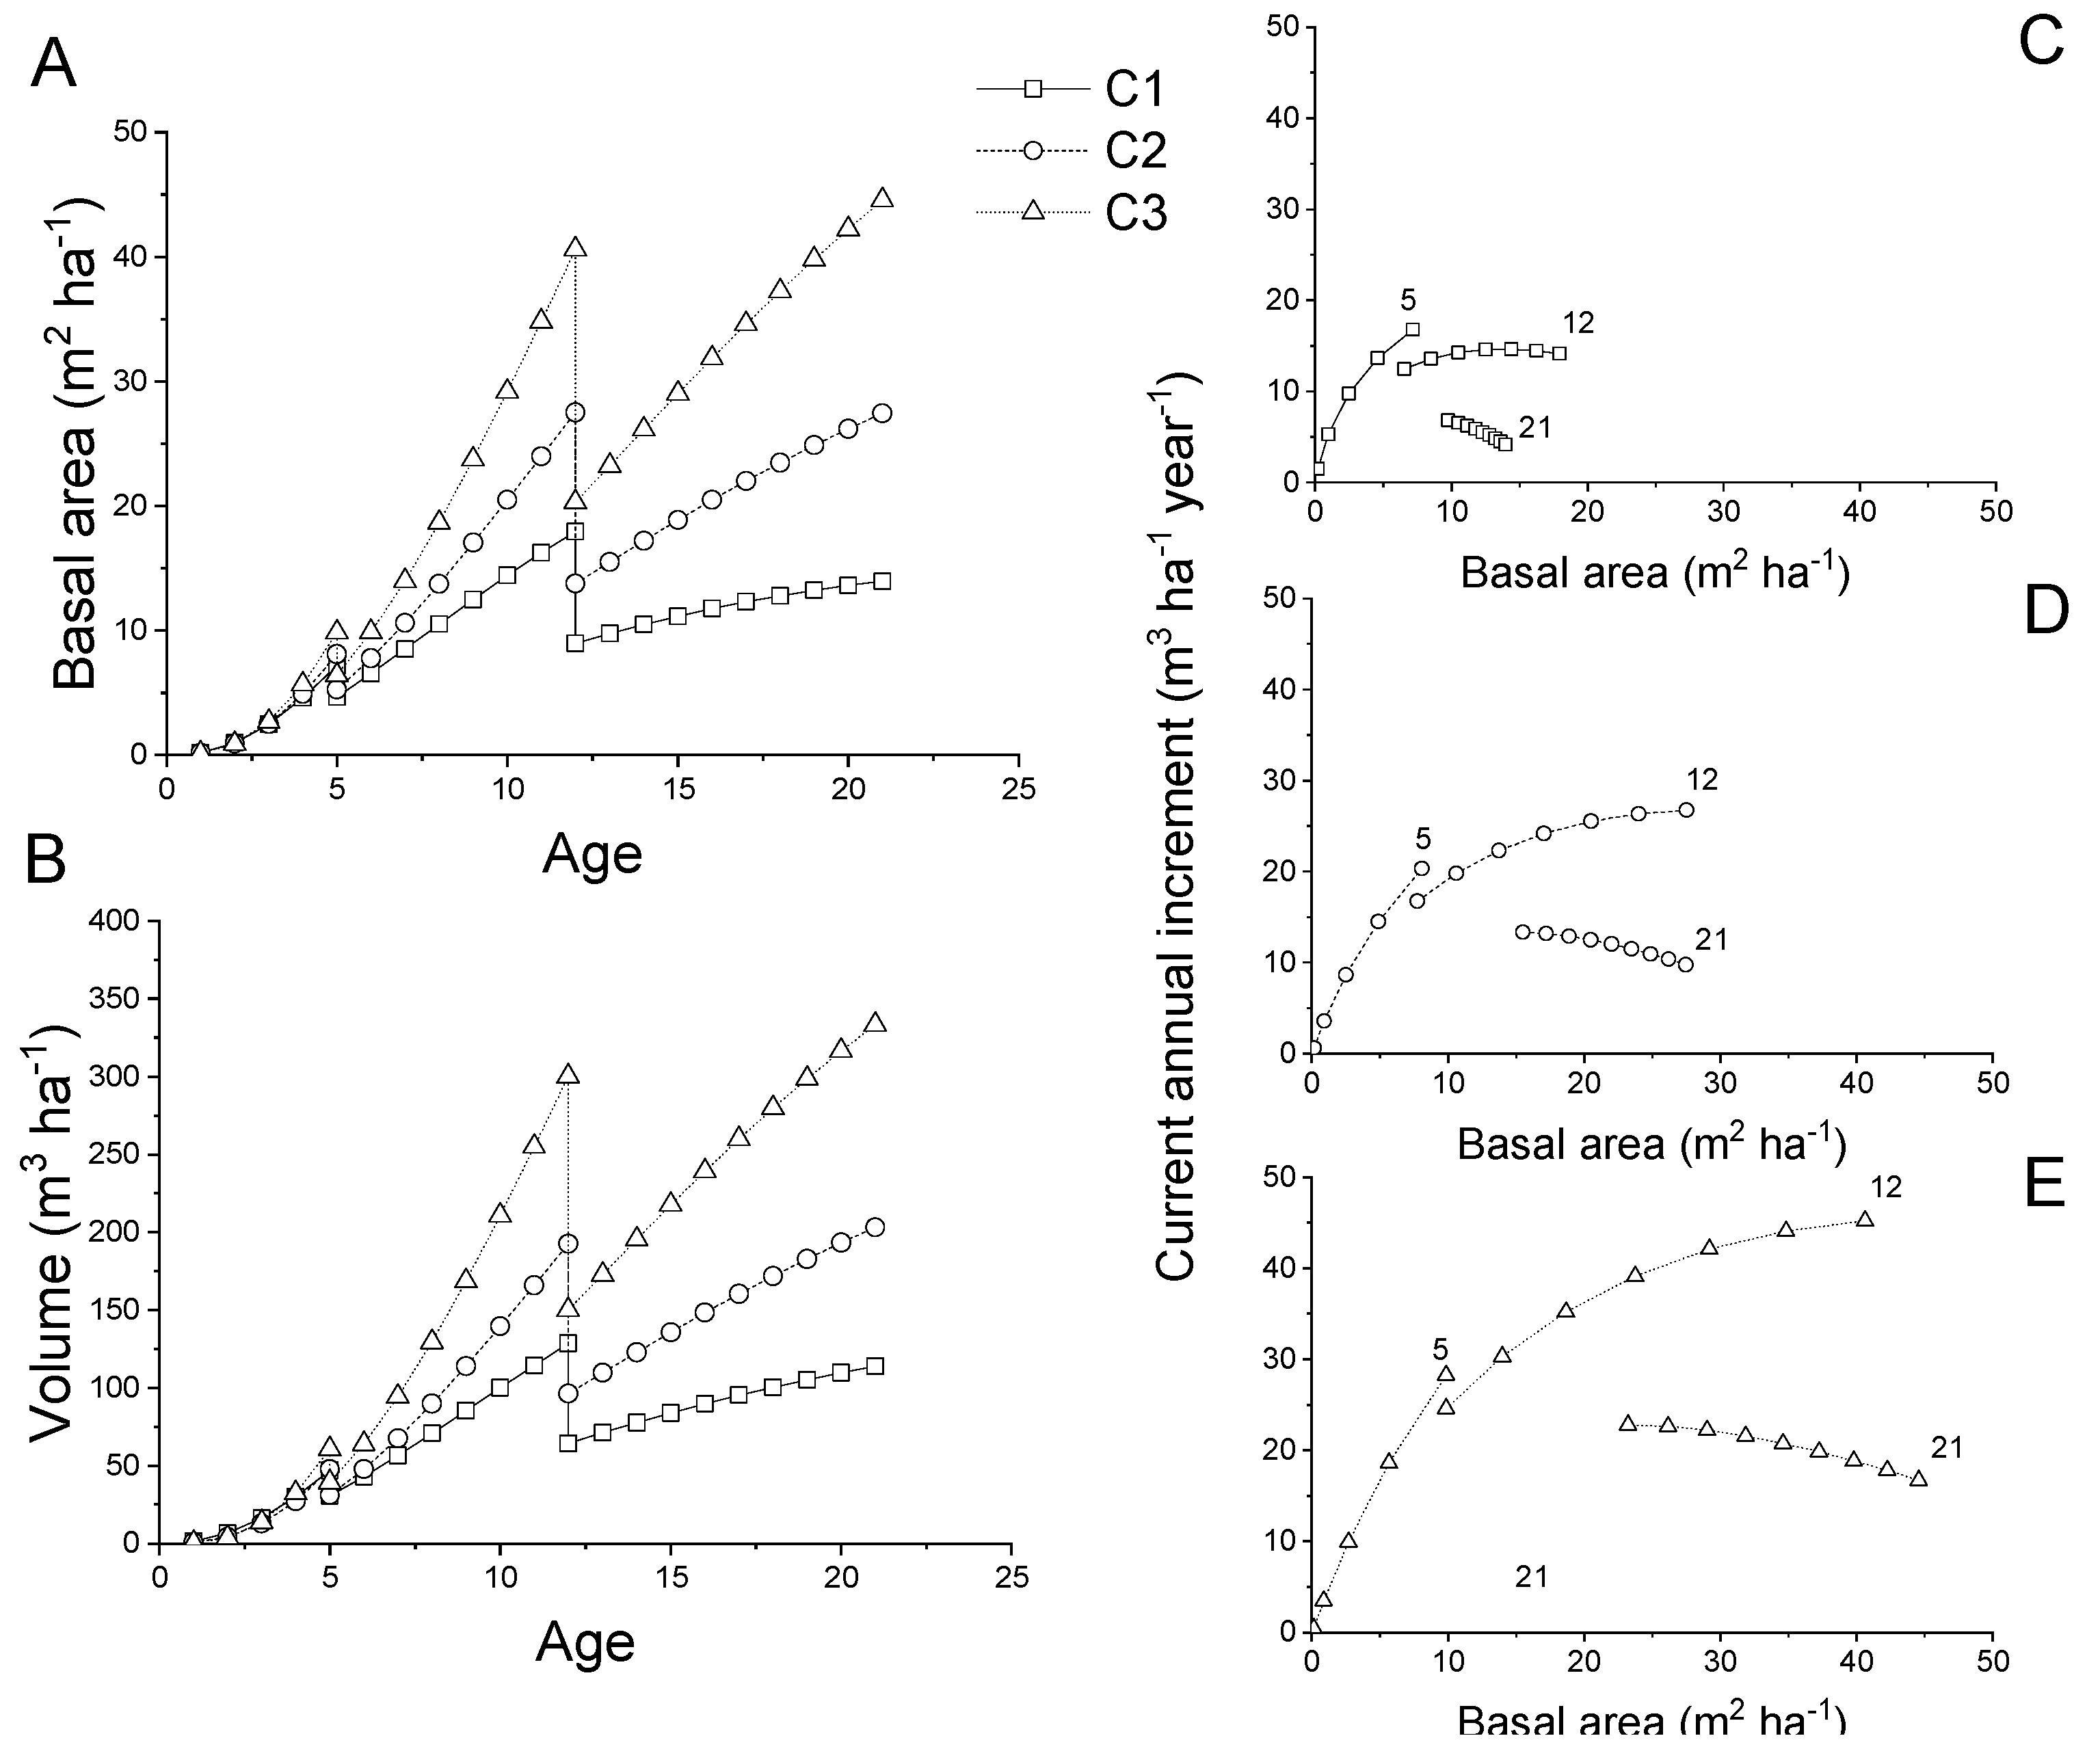
3.2. Stand Growth
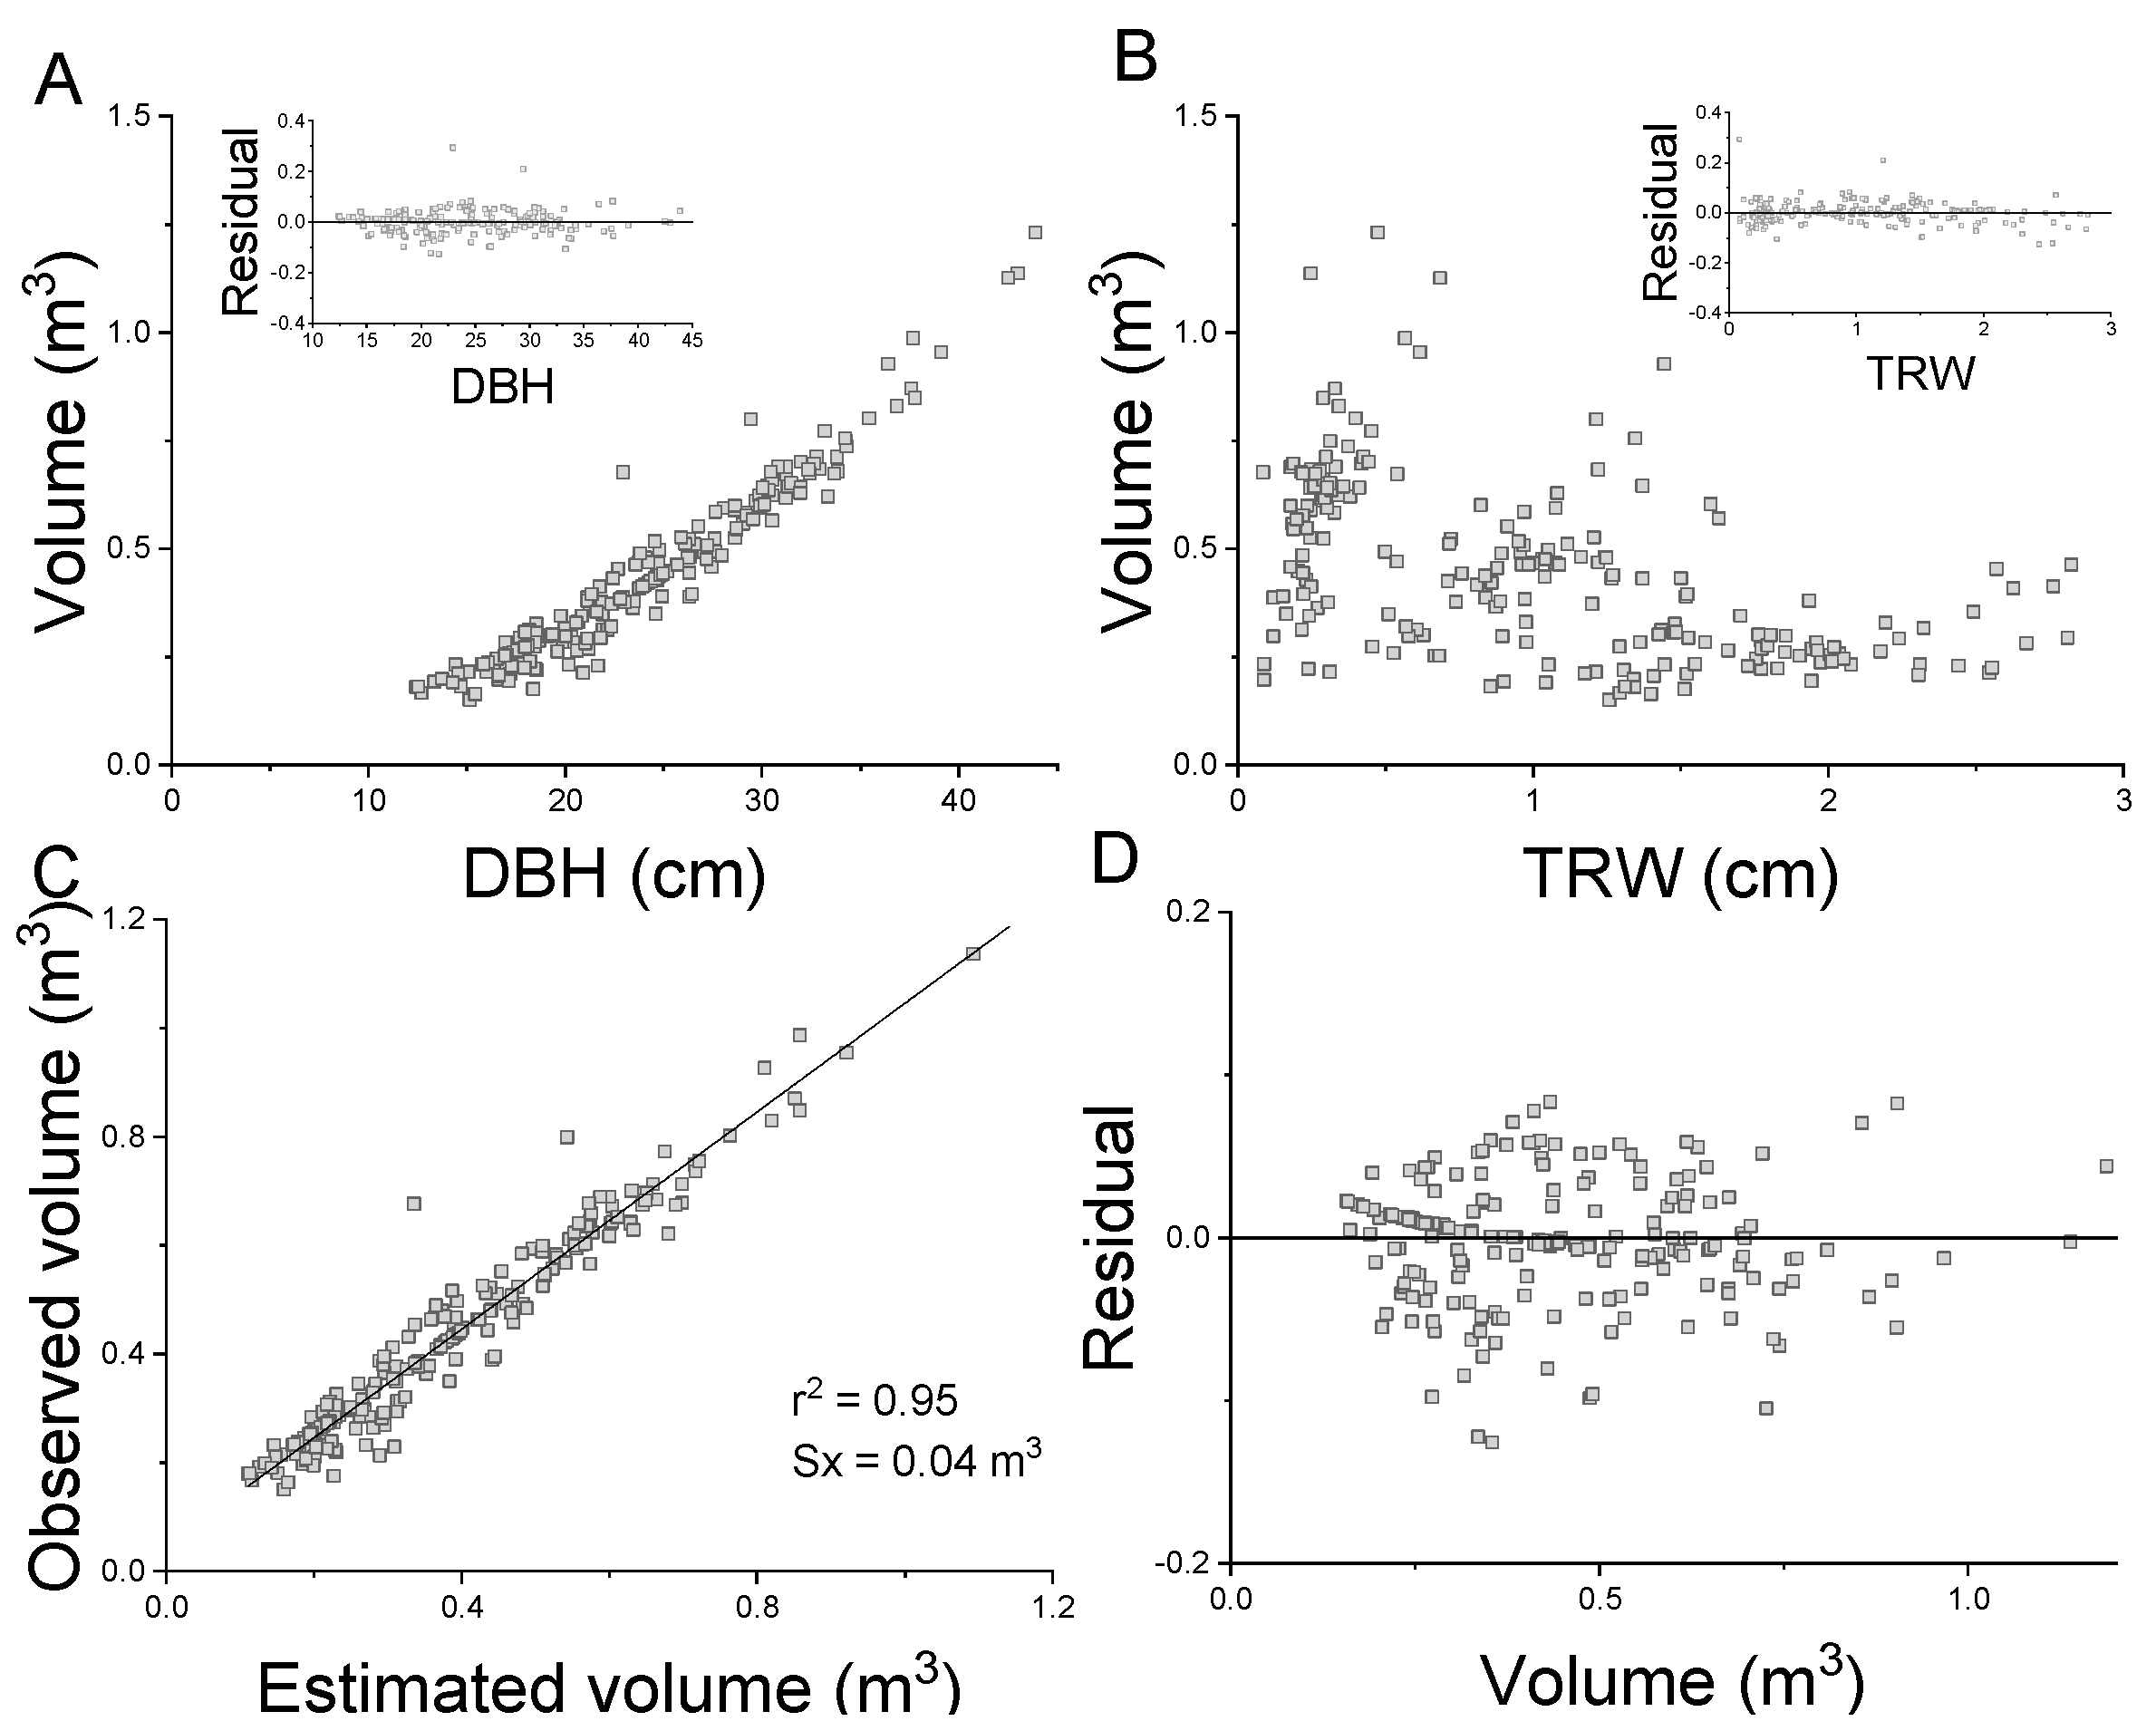
3.3. Allometric Equation Using Tree-Ring Parameters
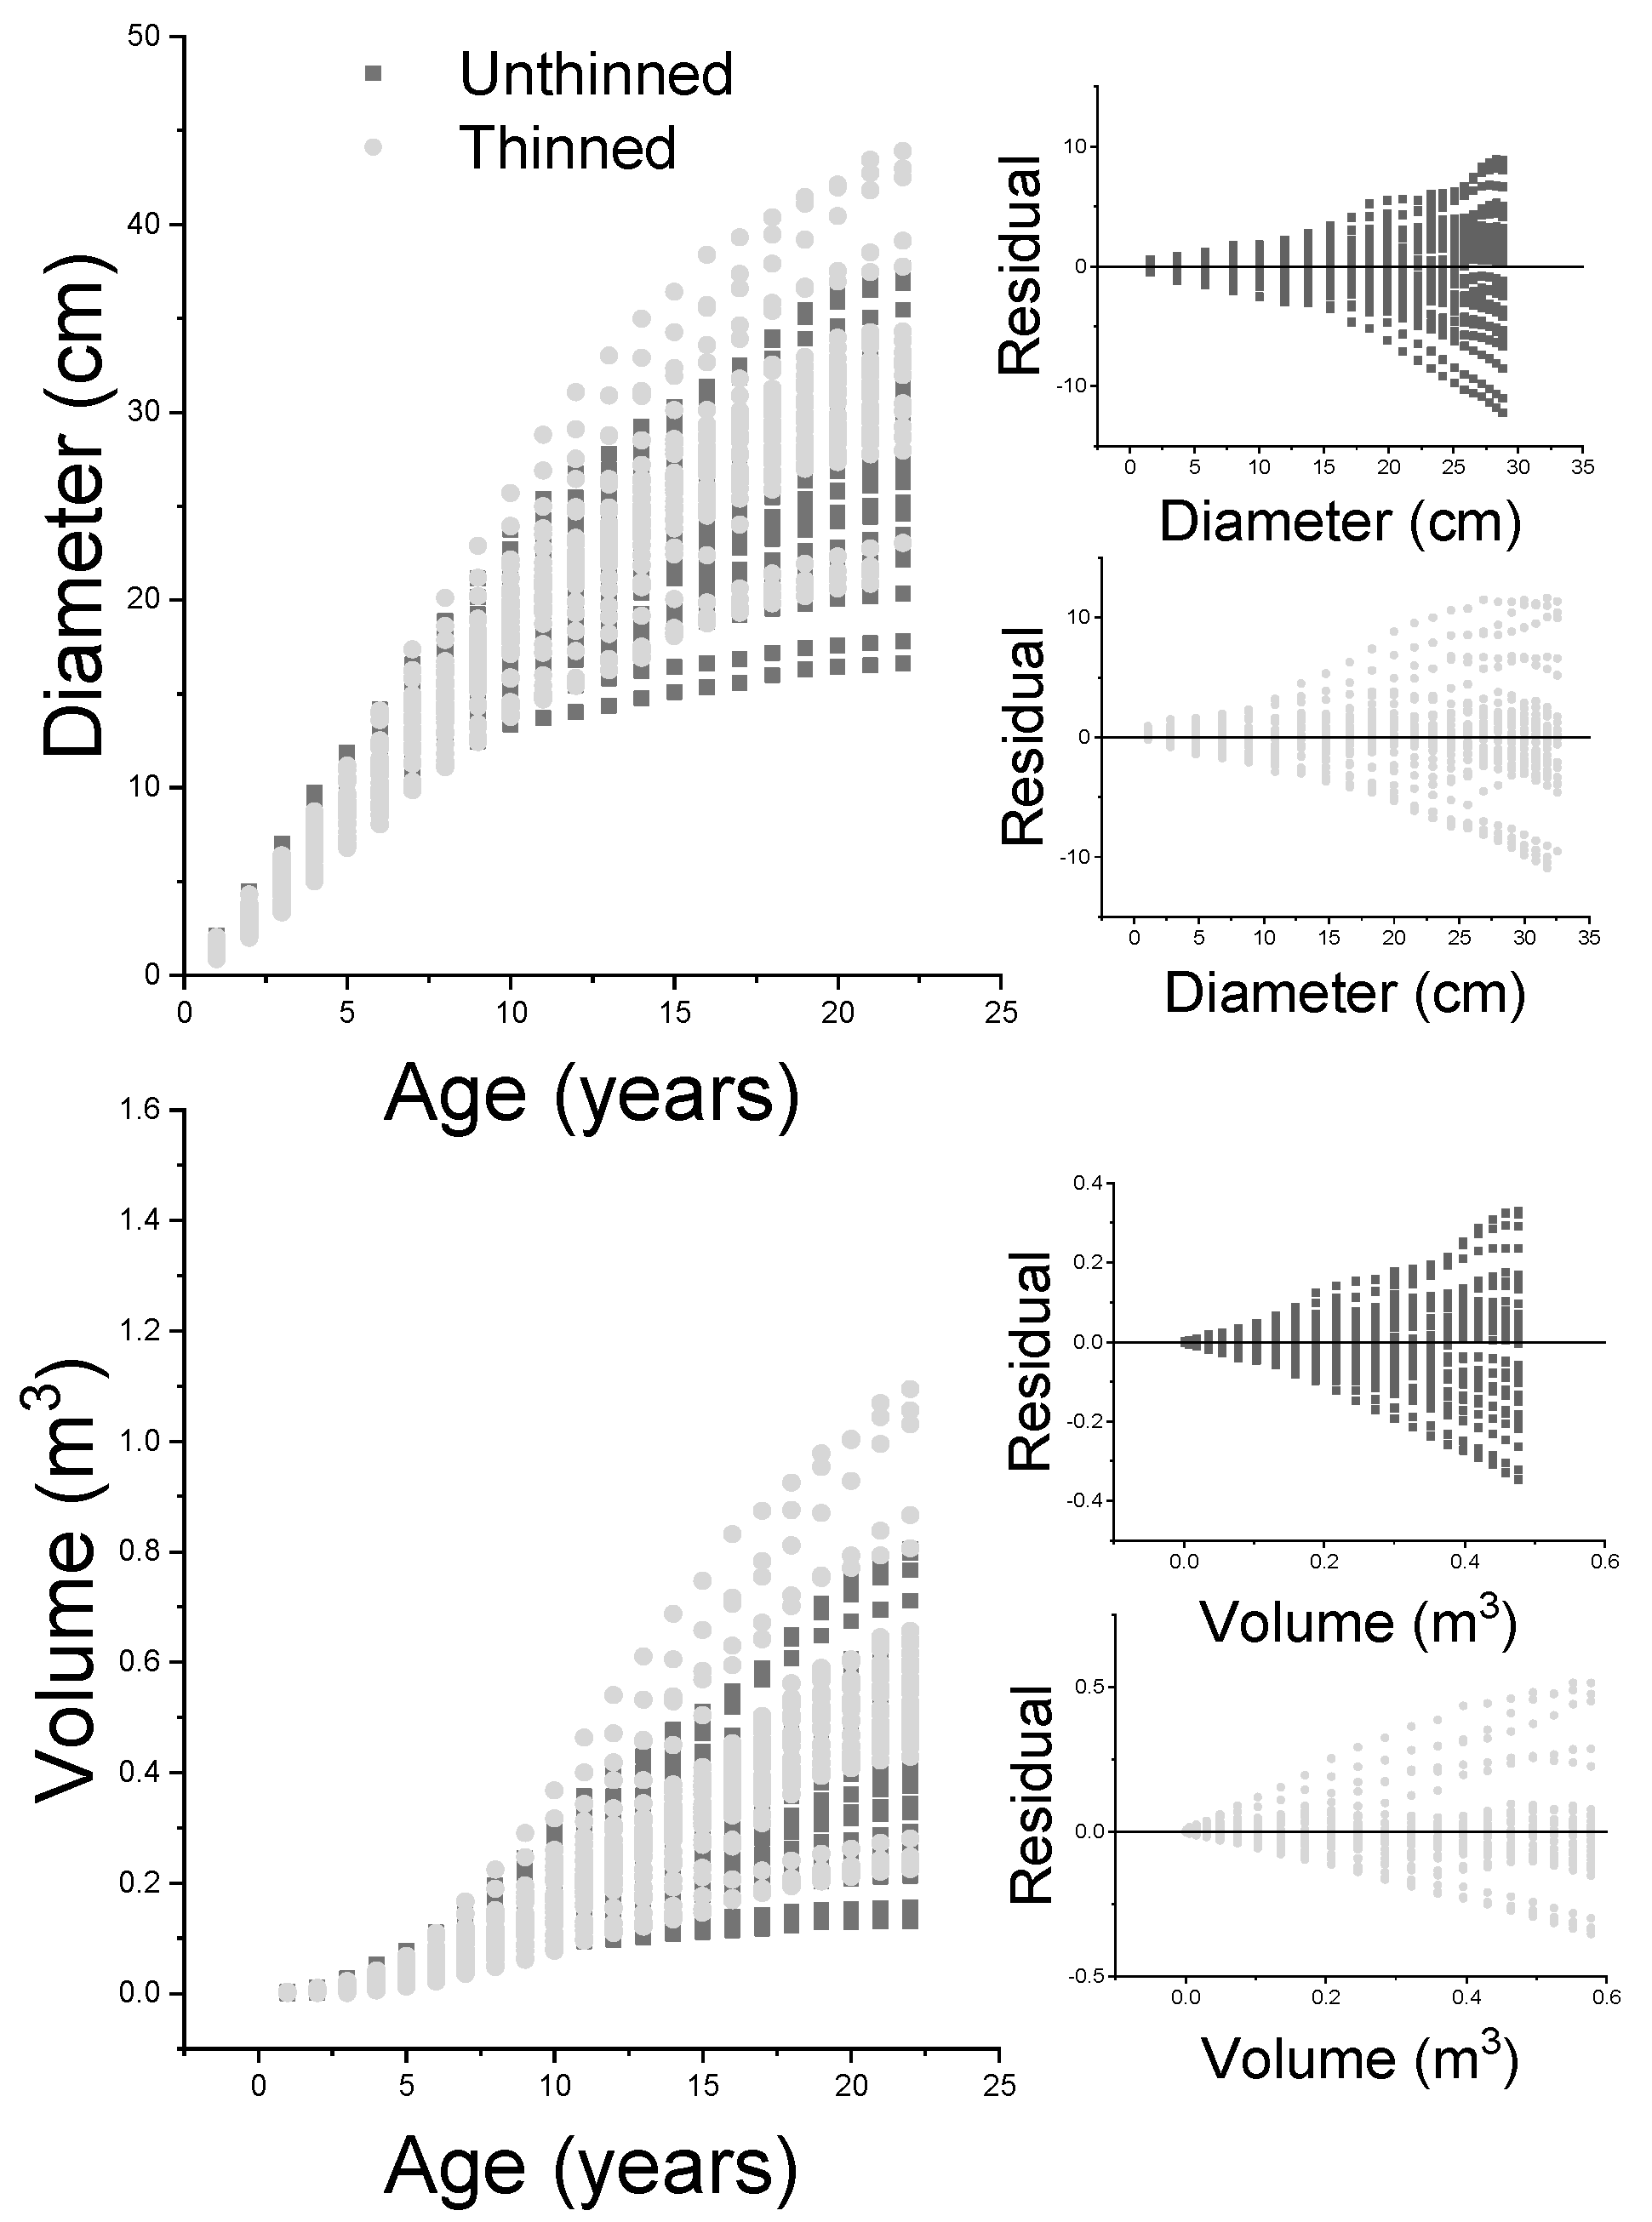
3.4. Growth Simulation
4. Discussion
4.1. Stem Growth
4.2. Stand Growth
4.3. Allometric Equations for P. patula
4.4. Management Guide
5. Conclusions
Author Contributions
Funding
Institutional Review Board Statement
Informed Consent Statement
Data Availability Statement
Acknowledgments
Conflicts of Interest
Appendix A


| Model | Parameter | Estimate | SE | t-Value | p-Value | Fit Statistics | ||
|---|---|---|---|---|---|---|---|---|
| Adj. R2 | RMSE (m3) | |E|% | ||||||
| Equation (1) | a | 0.00541 | 0.00271 | 2.19 | <0.01 | 0.95 | 0.04602 | 10.45 |
| b | 0.00091 | 0.00036 | 2.53 | <0.01 | ||||
| c | 1.88575 | 0.10142 | 18.59 | <0.0001 | ||||
| d | 0.00674 | 0.01055 | 0.64 | 0.52 | ||||
| Model | Growth Variable | Parameter | Stand | Estimate | SE | t-Value | p-Value | Fit Statistics | ||
|---|---|---|---|---|---|---|---|---|---|---|
| Adj. R2 | RMSE | |E|% | ||||||||
| Equation (2) | DBH | a | Nthi | 33.427 | 1.174 | 28.5 | <0.0001 | 0.87357 | 3.18 cm | 17.20 |
| b | 0.101 | 0.011 | 9.6 | <0.0001 | ||||||
| c | 1.303 | 0.089 | 14.7 | <0.0001 | ||||||
| a | Thi | 42.116 | 2.346 | 18.0 | <0.0001 | 0.88812 | 3.45 cm | 18.23 | ||
| b | 0.082 | 0.010 | 8.0 | <0.0001 | ||||||
| c | 1.433 | 0.101 | 14.3 | <0.0001 | ||||||
| Volume | a | Nthi | 0.692 | 0.090 | 7.7 | <0.0001 | 0.74606 | 0.09 m3 | 39.09 | |
| b | 0.090 | 0.019 | 4.6 | <0.0001 | ||||||
| c | 2.486 | 0.396 | 6.3 | <0.0001 | ||||||
| a | Thi | 0.848 | 0.114 | 7.4 | <0.0001 | 0.72868 | 0.12 m3 | 44.39 | ||
| b | 0.107 | 0.021 | 5.0 | <0.0001 | ||||||
| c | 3.790 | 0.741 | 5.1 | <0.0001 | ||||||
References
- Lauer, W. Ecoclimatological conditions of the Paramo belt in the tropical high mountains. Mt. Res. Dev. 1981, 1, 209–221. [Google Scholar] [CrossRef]
- Cuatrecasas, J. Aspectos de la vegetación natural de Colombia. Rev. Acad. Colomb. Cienc. Ex. Fís. Nat. 1958, 10, 221–264. [Google Scholar]
- Fjeldsa, J.; Kessler, M. Obter uma Cópia Encontrar uma Cópia na Biblioteca Amazon$29.95 Conserving the Biological Diversity of Polylepis Woodlands of the Highland of Peru and Bolivia: A Contribution to Sustainable Natural Resource Management in the Andes; Nordeco: Copenhagen, Denmark, 1996. [Google Scholar]
- Wille, M.; Hooghiemstra, H.; Hofstede, R.; Fehse, J.; Sevink, J. Upper forest line reconstruction in a deforested area in northern Ecuador based on pollen and vegetation analysis. J. Trop. Ecol. 2002, 18, 409–440. [Google Scholar] [CrossRef]
- Van Wesenbeeck, B.K.; Van Mourik, T.; Duivenvoorden, J.F.; Cleef, A.M. Strong effects of a plantation with Pinus patula on Andean subpáramo vegetation: A case study from Colombia. Biol. Conserv. 2003, 114, 207–218. [Google Scholar] [CrossRef]
- Lugo, A. Tree plantations for rehabilitating damaged forest lands in the tropics. In Ecosystem Rehabilitation: Ecosystem Analysis and Synthesis; Wali, M.K., Ed.; SPB Academic Publishing: Hague, The Netherlands, 1992; pp. 247–255. [Google Scholar]
- Godt, M.C.; Hadley, M. Ecosystem rehabilitation and forest regeneration in the humid tropics: Case studies and management insights. In Restoration of Tropical Forest Ecosystems; Springer: Dordrecht, The Netherlands, 1993; pp. 25–36. [Google Scholar]
- Parrotta, J.A. The role of plantation forests in rehabilitating degraded tropical ecosystems. Agric. Ecosyst. Environ. 1992, 41, 115–133. [Google Scholar] [CrossRef]
- Parrotta, J.A. Influence of overstory composition on understory colonization by native species in plantations on a degraded tropical site. J. Veg. Sci. 1995, 6, 627–636. [Google Scholar] [CrossRef]
- Simberloff, D.; Souza, L.; Nũnez, M.A.; Barrios-Garcia, M.N.; Bunn, W. The natives are restless, but not often and mostly when disturbed. Ecology 2012, 93, 598–607. [Google Scholar] [CrossRef]
- Carton, C. Pioneros del oro verde-El Poncho Verde de los Andes del Perú. Xilema 2014, 27, 94–103. [Google Scholar]
- Llerena, C.; Hermoza, M.; Llerena, L. Plantaciones forestales, agua y gestión de cuencas. Debate Agrar. 2016, 42, 79–110. [Google Scholar]
- Carton, C. Reforestacion Y Manejo de Cuencas En La Cat. Atahualpa Jerusalen Granja Porcon, Cajamarca. In Manejo Integral de Microcuencas Jequetepeque-Cajamarca; International Potato Center, Adefor, Eds.; Condesan: Lima, Peru, 1996; p. 205. [Google Scholar]
- Jonard, M.; Colmant, R.; Heylen, C.; Ysebaert, C.; Carton, C.; Picard, L.; Cassart, B.; Hounzandji, A.P.I.; Ponette, Q. Impact de Boisements Résineux Sur La Séquestration Du Carbone Dans Les Andes Péruviennes: Cas Des Plantations de Pinus Patula Dans La Coopérative de Granja Porcon (Cajamarca), Pérou. Bois For. Trop. 2014, 68, 17–27. [Google Scholar] [CrossRef] [Green Version]
- Hofstede, R. Los páramos en el mundo: Su diversidad y sus habitantes. In Los Páramos en el Mundo. Proyecto Atlas Mundial de los Páramos; Hofstede, R., Segarra, P., Mena, P., Eds.; Global Peatlands Initiative/NC- IUCN/EcoCiencia: Quito, Ecuador, 2003; pp. 15–38. [Google Scholar]
- Ospina, C.; Hernández, R.; Restrepo, E.; Sánchez, F.; Urrego, J.; Rondas, C.; Ramírez, C.; Riaño, N. El Pino Pátula-Guías Silviculturales; Federación Nacional de Cafeteros de Colombia-Centro Nacional de Investigaciones de Café: Manizales, Colombia, 2011; ISBN 9789588490090. [Google Scholar]
- Raboin, M.L.; Posner, J.L. Pine or pasture? estimated costs and benefits of land use change in the peruvian andes. Mt. Res. Dev. 2012, 32, 158–168. [Google Scholar] [CrossRef]
- Vázquez Maguirre, M.; Portales, L.; Velásquez Bellido, I. Indigenous Social Enterprises as Drivers of Sustainable Development: Insights From Mexico and Peru. Crit. Sociol. 2018, 44, 323–340. [Google Scholar] [CrossRef]
- Ochoa-Tocachi, B.F.; Buytaert, W.; De Bièvre, B.; Célleri, R.; Crespo, P.; Villacís, M.; Llerena, C.A.; Acosta, L.; Villazón, M.; Guallpa, M.; et al. Impacts of land use on the hydrological response of tropical Andean catchments. Hydrol. Proc. 2016, 30, 4074–4089. [Google Scholar] [CrossRef]
- Tovar, C.; Seijmonsbergen, A.C.; Duivenvoorden, J.F. Monitoring land use and land cover change in mountain regions: An example in the Jalca grasslands of the Peruvian Andes. Landsc. Urban Plan. 2013, 112, 40–49. [Google Scholar] [CrossRef]
- Zunino, A.R. Forest production and marketing cooperatives in the Peruvian Andes. In Effective Forest and Farm Producer Organizations; European Tropical Forest Research Network (ETFRN news), Ed.; European Tropical Forest Research Network (ETFRN news): Wageningen, The Netherlands, 2015; Volume 57, pp. 99–105. ISBN 9789051131277. [Google Scholar]
- Merino Coral, J.; Chuquicaja Segura, C.; Ajares Gallardo, U.P. Estimación del valor de uso directo del suelo en el ámbito del proyecto piloto de reforestación (PPF), granja Porcón, Cajamarca. Rev. For. del Perú 2017, 32, 56. [Google Scholar] [CrossRef] [Green Version]
- Dvorak, W.S.; Hodge, G.R.; Kietzka, J.E.; Malan, F.; Osorio, L.F.; Stanger, T.K. Pinus Patula. In Conservation and Testing of Tropical and Subtropical Forest Tree Species by the Camcore Cooperative; College of Natural Resources-North Carolina State University: Raleigh, NC, USA, 2000; pp. 148–173. [Google Scholar]
- Carton, C.; Chávez, A. Porcón Medio Siglo de Forestación En Los Andes de Cajamarca-Perú; Lluvia-Editores, Ed.; Lluvia Editores: Cajamarca, Peru, 2018; ISBN 978-612-4412-00-4. [Google Scholar]
- Asociación Civil para la Investigación y Desarrollo Forestal (ADEFOR). Plan General de Manejo Forestal de Las Plantaciones de La Cooperativa Agraria Atahualpa Jerusalén de Trabajadores LTDA-Granja Porcón, Establecido En Convenio Con El Proyecto Piloto de Forestación (PPF); Asociación Civil para la Investigación y Desarrollo Forestal (ADEFOR): Cajamarca, Peru, 2005. [Google Scholar]
- Kometter, R. Revisión de La Validación de Plantaciones Forestales En La Granja Porcón; ResearchGate GmbH: Lima, Peur, 2018. [Google Scholar]
- Villar Cabeza, M.A.; Marcelo Bazán, E.F.; Baselly Villanueva, R.J.; Villena Velásquez, J.J. Estimation of Timber Volumes in Plantations of Pinus Patula Schltdl Cham in the Cooperativa Atahualpa Jerusalén Granja Porcón in the Cajamarca Region; INIA: La Molina, Peru, 2014. [Google Scholar]
- Hackenberg, J.; Wassenberg, M.; Spiecker, H.; Sun, D. Non Destructive Method for Biomass Prediction Combining TLS Derived Tree Volume and Wood Density. Forests 2015, 6, 1274–1300. [Google Scholar] [CrossRef]
- Verzino, G.; Ingaramo, P.; Joseau, J.; Astini, E.; Di Rienzo, J.; Dorado, M. Basal area growth curves for Pinus patula in two areas of the Calamuchita Valley, Cordoba, Argentina. For. Ecol. Manag. 1999, 124, 185–192. [Google Scholar] [CrossRef]
- Ortega Rodriguez, D.R.; de Andrade, G.C.; Bellote, A.F.J.; Tomazello-Filho, M. Effect of pulp and paper mill sludge on the development of 17-year-old loblolly pine (Pinus taeda L.) trees in Southern Brazil. For. Ecol. Manag. 2018, 422, 179–189. [Google Scholar] [CrossRef]
- Melo-Poblete, J.; Zevallos, P.; Chavesta-custodio, M. Dendrocronología de Pinus radiata en plantaciones de la Granja Porcón, Cajamarca-Perú. Mentor For. 2017, 1, 6–11. [Google Scholar]
- Moreno-Fernández, D.; Hevia, A.; Majada, J.; Cañellas, I. Do common silvicultural treatments affect wood density of Mediterranean montane pines ? Forests 2018, 9, 80. [Google Scholar] [CrossRef] [Green Version]
- Dobner, M.; Huss, J.; Tomazello Filho, M. Wood density of loblolly pine trees as affected by crown thinnings and harvest age in southern Brazil. Wood Sci. Technol. 2018, 52, 465–485. [Google Scholar] [CrossRef]
- Bouriaud, O.; Teodosiu, M.; Kirdyanov, A.V.; Wirth, C. Influence of wood density in tree-ring-based annual productivity assessments and its errors in Norway spruce. Biogeosciences 2015, 12, 6205–6217. [Google Scholar] [CrossRef] [Green Version]
- Topanotti, L.R.; Vaz, D.R.; de Carvalho, S.P.C.; Rios, P.D.; Tomazello-Filho, M.; Dobner, M.; Nicoletti, M.F. Growth and wood density of Pinus taeda L. as affected by shelterwood harvest in a two-aged stand in Southern Brazil. Eur. J. For. Res. 2021, 140, 869–881. [Google Scholar] [CrossRef]
- Delgado-Matas, C.; Pukkala, T. Growth models for Pinus patula in Angola. South For. 2010, 72, 153–161. [Google Scholar] [CrossRef]
- Ortega Rodriguez, D.R.; Tomazello, M. Clues to wood quality and production from analyzing ring width and density variabilities of fertilized Pinus taeda trees. New For. 2019, 50, 821–843. [Google Scholar] [CrossRef]
- Spaargaren, O.C.; Deckers, J. The world Reference Base For Soil Resources; An Introduction with Special Reference to Soils of Tropical Forest Ecosystems. In Soils of Tropical Forest Ecosystems; Schulte, A., Ruhiyat, D., Eds.; Springer: Berlin/Heidelberg, Germany, 1998; pp. 21–28. [Google Scholar]
- KNMI KNMI Climate Explorer. Available online: https://climexp.knmi.nl/selectstation.cgi?id=20894535aa8a3ef16c4bebec439709fc (accessed on 2 March 2018).
- Schreuder, H.T.; Hugo, R.E.; Maldonado, R. Técnicas Estadísticas para Evaluación y Monitoreo de Recursos Naturales, 1st ed.; Universidad Autónoma Chapingo, Ed.; Universidad Autónoma Chapingo: Texcoco, Mexico, 2006. [Google Scholar]
- Kitzberger, T.; Veblen, T.; Villalba, R. Métodos dendroecológicos y sus aplicaciones en estudios de dinámica de bosques templados de Sudamérica. In Dendrocronología en América Latina; Roig, F.A., Ed.; Ediunc: Mendoza, Argentina, 2000; pp. 17–78. [Google Scholar]
- Martínez, C. Estadística y Muestreo; Ediciones, E., Ed.; 13ra Edici: Bogotá, Colombia, 2012; ISBN 978-958-648-702-3. [Google Scholar]
- Cancino, J. Dendrometría Básica; de Concepción, U., Ed.; Universidad de Concepción: Concepción, Chile, 2006; ISBN 9568029672. [Google Scholar]
- Holmes, R.L. Computer-assisted quality control in tree-ring dating and measurement. Tree Ring Bull. 1983, 43, 69–78. [Google Scholar] [CrossRef]
- Vanclay, J. Growth modelling and yield prediction for sustainable forest management. Malays. For. 2002, 66, 58–69. [Google Scholar]
- Zhao-gang, L.; Fengri, L. The generalized Chapman-Richards function and applications to tree and stand growth. J. For. Res. 2003, 14, 19–26. [Google Scholar] [CrossRef]
- Romo Guzmán, D.; Navarro Garza, H.; De los Santos Posadas, H.M.; Hernández Romero, O.; López Upton, J. Crecimiento maderable y biomasa aérea en plantaciones jóvenes de Pinus patula Schiede ex Schltdl. Et Cham. En Zacualpan, Veracruz. Rev. Mex. Cienc. For. 2014, 5, 78–91. [Google Scholar]
- Zeide, B. Analysis of growth equations. For. Sci. 1993, 39, 594–616. [Google Scholar] [CrossRef]
- OriginLab Corporation Origin; Version 2018; OriginLab: Northampton, UK, 2018.
- Missanjo, E.; Kamanga-Thole, G. Effect of first thinning and pruning on the individual growth of Pinus patula tree species. J. For. Res. 2015, 26, 827–831. [Google Scholar] [CrossRef]
- Rodríguez-Ortiz, G.; González-Hernández, V.A.; Aldrete, A.; De los Santos-Posadas, H.M.; Gómez-Guerrero, A.; Fierros-González, A.M. Modelos para estimar crecimiento y eficiencia de crecimiento en plantaciones de Pinus patula en respuesta al aclareo. Rev. Fitotec. Mex. 2011, 34, 205. [Google Scholar] [CrossRef]
- Evans, J. Plantation Forestry in the Tropics: Tree Planting for Industrial, Social, Environmental, and Agroforestry Purposes, 2nd ed.; Oxford University Press: New York, NY, USA, 1992. [Google Scholar]
- Liu, J.; Burkhart, H.E. Modelling Inter- and Intra-specific Competition in Loblolly Pine (Pinus taeda L.) Plantations on Cutover, Site-prepared Lands. Ann. Bot. 1994, 73, 429–435. [Google Scholar] [CrossRef]
- Dangal, S.P.; Das, A.K. Effect of management practice and age on increment in. Banko Janakari 2018, 27, 27–37. [Google Scholar] [CrossRef]
- Cardoso, J.D.; Biscaia, E.A.; Doetzer, A.M.; Cordeiro, M.; Teixeira, R. Influence of spacing regimes on the development of loblolly pine (Pinus taeda L.) in Southern Brazil. For. Ecol. Manag. 2013, 310, 761–769. [Google Scholar] [CrossRef] [Green Version]
- Diéguez-Aranda, U.; Castedo Dorado, F.; Álvarez González, J.G.; Rojo Alboreca, A. Dynamic growth model for Scots pine (Pinus sylvestris L.) plantations in Galicia (north-western Spain). Ecol. Model. 2006, 191, 225–242. [Google Scholar] [CrossRef]
- Ngaga, Y.M. Forest Plantations and Woodlots in Tanzania; African Forest Forum: Nairobi, Kenya, 2011; p. 1. [Google Scholar]
- Zhang, S.Y.; Chauret, G.; Swift, D.E.; Duchesne, I. Effects of precommercial thinning on tree growth and lumber quality in a jack pine stand in New Brunswick, Canada. Can. J. For. Res. 2006, 36, 945–952. [Google Scholar] [CrossRef]
- Borders, B.E.; Will, R.E.; Markewitz, D.; Clark, A.; Hendrick, R.; Teskey, R.O.; Zhang, Y. Effect of complete competition control and annual fertilization on stem growth and canopy relations for a chronosequence of loblolly pine plantations in the lower coastal plain of Georgia. For. Ecol. Manag. 2004, 192, 21–37. [Google Scholar] [CrossRef]
- McEvoy, T.J. Positive Impact Forestry: A Sustainable Approach to Managing Woodlands; Island Press: Washington, DC, USA, 2004. [Google Scholar]
- Jokela, E.J.; Martin, T.A. Effects of ontogeny and soil nutrient supply on production, allocation, and leaf area efficiency in loblolly and slash pine stands. Can. J. For. Res. 2000, 30, 1511–1524. [Google Scholar] [CrossRef]
- Martin, T.A.; Jokela, E.J. Stand development and production dynamics of loblolly pine under a range of cultural treatments in north-central Florida USA. For. Ecol. Manag. 2004, 192, 39–58. [Google Scholar] [CrossRef]
- Jokela, E.J.; Martin, T.A.; Vogel, J.G. Twenty-Five Years of Intensive Forest Management with Southern Pines: Important Lessons Learned. J. For. 2010, 108, 338–347. [Google Scholar]
- Medhurst, J.L.; Beadle, C.L.; Neilsen, W.A. Early-age and later-age thinning affects growth, dominance, and intraspecific competition in Eucalyptus nitens plantations. Can. J. For. Res. 2001, 31, 187–197. [Google Scholar] [CrossRef]
- Santiago-García, W.; De los Santos-Posadas, H.M.; Ángeles-Pérez, G.; Valdez-Lazalde, J.R.; Corral-Rivas, J.J.; Rodríguez-Ortiz, G.; Santiago-García, E. Modelos de crecimiento y rendimiento de totalidad del rodal para Pinus patula. Madera Bosques 2015, 21, 95–110. [Google Scholar] [CrossRef] [Green Version]
- Ackerman, S.A.; Ackerman, P.A.; Seifert, T. Effects of irregular stand structure on tree growth, crown extension and branchiness of plantation-grown Pinus patula. South. For. 2013, 75, 247–256. [Google Scholar] [CrossRef]
- Babst, F.; Poulter, B.; Bodesheim, P.; Mahecha, M.D.; Frank, D.C. Improved tree-ring archives will support earth-system science. Nat. Ecol. Evol. 2017, 1, 8. [Google Scholar] [CrossRef] [Green Version]
- Valle-Carrión, L.; Hildebrandt, P.; Castro, L.M.; Ochoa-Moreno, W.-S.; Knoke, T. Simultaneous optimization model for thinningand harvesting Alnus acuminata and Pinus patulaplantations in Southern Ecuador. Scand. For. Res. 2021, 36, 144–154. [Google Scholar] [CrossRef]
- Mesfin, D.; Sterba, H. A yield table model for the growth of Pinus Patula in Ethiopia. J. Trop. For. Sci. 1996, 9, 221–241. [Google Scholar]


| Stand Name | Age (Years) | Stand (n of Plots) * | Density (Trees ha−1) | Mortality (%) | Basal Area (m2 ha−1) | Volume (m3 ha−1) | Average DBH (cm) | Average Total Height (m) |
|---|---|---|---|---|---|---|---|---|
| Cushuro | 22 | Unthinned (10) | 1140 | 11 | 98 | 631.56 | 30.5 (6.8) | 22.8 (2.1) |
| Enterador | 22 | Thinned (9) | 380 | 8 | 43 | 270.18 | 37.6 (4.7) | 20.5 (1.6) |
| Diameter Classes | Unthinned | Thinned | ||||||
|---|---|---|---|---|---|---|---|---|
| Inventoried Trees | Volume of Inventoried Trees (m3) | Cored Trees (n) | Volume of Cored Trees (m3) | Inventoried Trees | Volume of Inventoried Trees (m3) | Cored Trees (n) | Volume of Cored Trees (m3) | |
| (−∞, 10) | 6 | 0.028 (0.01) | 0 | - | 0 | - | 0 | - |
| [10, 20) | 26 | 0.159 (0.06) | 2 | 0.167 (0.06) | 0 | - | 0 | - |
| [20, 30) | 223 | 0.393 (0.11) | 9 | 0.381 (0.06) | 10 | 0.371 (0.09) | 2 | 0.375 (0.05) |
| [30, 40) | 282 | 0.666 (0.14) | 17 | 0.66 (0.04) | 105 | 0.638 (0.11) | 21 | 0.642 (0.05) |
| [40, 50) | 37 | 1.034 (0.19) | 2 | 1.111 (0.05) | 56 | 0.893 (0.12) | 11 | 0.913 (0.04) |
| [50, ∞) | 0 | - | 0 | - | 2 | 1.339 (0.08) | 0 | - |
| Total | 574 | 0.554 (0.24) | 35 | 0.579 (0.32) | 173 | 0.711 (0.19) | 35 | 0.65 (0.26) |
| Model | Growth Variable | Growth Class | Parameter | Estimate | SE | t-Value | p-Value | Fit Statistics | ||
|---|---|---|---|---|---|---|---|---|---|---|
| Adj. R2 | RMSE | |E|% | ||||||||
| Equation (2) | DBH | C1 | a | 23.560 | 0.674 | 35.0 | <0.0001 | 0.91 | 1.95 cm | 13.15 |
| b | 0.134 | 0.014 | 9.4 | <0.0001 | ||||||
| c | 1.365 | 0.120 | 11.4 | <0.0001 | ||||||
| C2 | a | 37.961 | 0.746 | 50.9 | <0.0001 | 0.97 | 1.68 cm | 8.94 | ||
| b | 0.090 | 0.005 | 20.0 | <0.0001 | ||||||
| c | 1.382 | 0.042 | 33.2 | <0.0001 | ||||||
| C3 | a | 50.482 | 2.400 | 21.0 | <0.0001 | 0.97 | 2.13 cm | 9.23 | ||
| b | 0.087 | 0.010 | 9.1 | <0.0001 | ||||||
| c | 1.518 | 0.101 | 15.1 | <0.0001 | ||||||
| Volume | C1 | a | 0.417 | 0.049 | 8.5 | <0.0001 | 0.79 | 0.05 m3 | 22.86 | |
| b | 0.100 | 0.022 | 4.6 | <0.0001 | ||||||
| c | 2.502 | 0.443 | 5.6 | <0.0001 | ||||||
| C2 | a | 0.845 | 0.045 | 18.9 | <0.0001 | 0.95 | 0.04 m3 | 17.02 | ||
| b | 0.095 | 0.008 | 12.5 | <0.0001 | ||||||
| c | 3.109 | 0.205 | 15.2 | <0.0001 | ||||||
| C3 | a | 1.376 | 0.166 | 8.3 | <0.0001 | 0.94 | 0.08 m3 | 18.56 | ||
| b | 0.102 | 0.018 | 5.6 | <0.0001 | ||||||
| c | 3.556 | 0.582 | 6.1 | <0.0001 | ||||||
Publisher’s Note: MDPI stays neutral with regard to jurisdictional claims in published maps and institutional affiliations. |
© 2022 by the authors. Licensee MDPI, Basel, Switzerland. This article is an open access article distributed under the terms and conditions of the Creative Commons Attribution (CC BY) license (https://creativecommons.org/licenses/by/4.0/).
Share and Cite
Ortega-Rodriguez, D.R.; Hevia, A.; Sánchez-Salguero, R.; Bermudez Dobbertin, S.; Rosero-Alvarado, J.; Chavesta, M.; Tomazello-Filho, M. Novel Yield Model of Pinus patula Schltdl. & Cham. Growth near the Ecological Limit in Northwestern Peruvian Andes. Forests 2022, 13, 2109. https://doi.org/10.3390/f13122109
Ortega-Rodriguez DR, Hevia A, Sánchez-Salguero R, Bermudez Dobbertin S, Rosero-Alvarado J, Chavesta M, Tomazello-Filho M. Novel Yield Model of Pinus patula Schltdl. & Cham. Growth near the Ecological Limit in Northwestern Peruvian Andes. Forests. 2022; 13(12):2109. https://doi.org/10.3390/f13122109
Chicago/Turabian StyleOrtega-Rodriguez, Daigard Ricardo, Andrea Hevia, Raúl Sánchez-Salguero, Santiago Bermudez Dobbertin, Jedi Rosero-Alvarado, Manuel Chavesta, and Mario Tomazello-Filho. 2022. "Novel Yield Model of Pinus patula Schltdl. & Cham. Growth near the Ecological Limit in Northwestern Peruvian Andes" Forests 13, no. 12: 2109. https://doi.org/10.3390/f13122109