Essay

Effects of Climate Change and Environmental Factors on Bamboo (Ferrocalamus strictus), a PSESP Unique to China

1
College of Biodiversity and Conservation, Southwest Forestry University, Kunming 650024, China
2
Key Laboratory for Sympodial Bamboo Research, Southwest Forestry University, Kunming 650024, China
3
College of Forestry, Southwest Forestry University, Kunming 650024, China
*
Author to whom correspondence should be addressed.
Forests 2022, 13(12), 2108; https://doi.org/10.3390/f13122108
Submission received: 7 November 2022 / Revised: 28 November 2022 / Accepted: 2 December 2022 / Published: 9 December 2022
(This article belongs to the Section Forest Ecology and Management)

Abstract

:
Bamboo is a plant that may replace plastics and wood as a new green environmental protection material that can be developed. Ferrocalamus strictus is a very special and rare bamboo which is a plant species with extremely small populations (PSESP) endemic to Yunnan, China, and it is listed as a China key national first-class protected wild plant. To explore the effects of extreme climate and environmental changes on this PSESP, we conducted a case study on the response of F. strictus to climate under two extreme future emission scenarios. We combined 29 environmental variables, including the temperature, precipitation, altitude, slope, aspect, soil pH, soil organic carbon content, and mean UV-B radiation of the highest month, to analyze the important environmental factors limiting the distribution of F. strictus and identified the priority conservation areas (PCAs) of F. strictus. Under the two future extreme climate scenarios, the core potential suitable distribution area of F. strictus would decrease by 26%–34% in 2040, 44%–46% in 2060, and 23%–58% in 2080, respectively. Bio18 (precipitation in the warmest quarter) and Bio3 (isotherm) were the two key factors limiting the geographical distribution of F. strictus (the contribution rates were 40.1% and 18.45%, respectively). The results of this study show that F. strictus is in urgent need of protection and PSESPs require more attention.

1. Introduction

China is very rich in plant diversity [1], but there are still many plants that are threatened or that have even gone extinct [2], e.g., plant species with extremely small populations (PSESP). PSESPs are priority species for conservation in China due to their narrow distribution, habitat disturbance, and high extinction risk [3,4,5,6], and they have attracted international attention in recent years [7,8,9,10].
Climate change is an important factor affecting plant survival [11,12]. Climate affects forests by influencing plant phenology, plant pests and diseases, and the characteristics of forest ecosystems [13,14], which in turn have strong influences on soil properties [15,16]. These effects threaten plants in many ways [17,18,19], especially species with a narrow habitat distribution [20]. Continuing climate change will shift the distribution of species [21] and reduce the quality of habitats [21], which will increase the risk of extinction. According to the 2022 intergovernmental panel on climate change (IPCC) sixth assessment (AR6) (https://www.ipcc.ch/assessment-report/ar6/ (accessed on 27 November 2022)), the impact of human activities is intensifying, regional climate change is significant, and extreme weather events are more frequent.
Under climate change, protecting the extremely small populations of PSESPs is urgent. Many PSESPs are relict species dating back hundreds of years. The conservation of PSESPs is of great significance to the conservation of global biodiversity [22,23,24]. At the same time, the impact of climate change on PSESPs should be considered when implementing protection plans [25,26,27,28].
In order to estimate the potential impact of climate on species habitat and evaluate the habitat distribution characteristics and environmental factors affecting habitat suitability, various distribution models have been used to predict ecological environments and distribution areas [29,30]. Priority conservation areas (Pca) were established with the help of the model [31,32,33,34]. The MaxEnt (maximum entropy) model is widely used as a niche simulation method to predict the impact of future climate change on an area of suitable habitat for a species [35,36,37,38]. The MaxEnt model can predict the distribution range of a small number of species, which is very suitable for the prediction of some endangered plants, and it can achieve a high level of accuracy [39,40,41].
Bamboo is one of the fastest growing plants in the world and has an irreplaceable place in biodiversity. Bamboo is crucial to environmental protection and biodiversity conservation, which are beneficial to the environment and to economies [42,43]. Bamboo has a very important conservation value. It is a new type of green material with a high development value, for example, it may replace plastics, and “bamboo instead of plastic”, “bamboo instead of wood”, “bamboo instead of cotton”, “bamboo instead of steel and concrete building materials”, and other innovations reduce global plastic pollution and help to build a green and low-carbon environment.
F. strictus is a rare bamboo species in China, and there have been few reports on it [44]. Ferrocalamus strictus belongs to Poaceae Ferrocalamus. It has been listed as a key national first-class protected wild plant species in China and a PSESP unique to China. F. strictus is a fast-growing bamboo, and only three bamboo species, including F. rimosivaginus and F. fibrillosus, are members of Ferrocalamus throughout the world [45,46]. F. strictus is a special type of bamboo with branches that are nearly as thick as culms. Its longest section can reach up to 121 cm, which is one of the longest sections of bamboo reported in the world. It has great development potential as a green environmental protection material. With global plastic and carbon pollution rising, it is increasingly urgent to promote green materials to develop a carbon-neutral economy. F. strictus has great significance in ecological protection.
The natural distribution area of F. strictus is very narrow, and its habitat is seriously fragmented. As a typical PSESP within its narrow geographical range, F. strictus is vulnerable to rapid environmental changes caused by natural or human interference. The analysis of the species distribution and habitat is the basis and premise for its effective protection [47]. However, thus far, limited information is available regarding the habitat suitability of its habitat distribution characteristics and the major ecological environmental factors affecting its suitability, especially under climate change scenarios. Understanding its habitat suitability and risk factors are the first steps in conserving these PSESPs.
In this paper, the effects of climate on PSESPs were investigated using F. strictus as an example. On the basis of extensive field investigation, we used climate models to study the potential suitable habitat and spatial variation in the geographical distribution of F. strictus in China. We sought to (1) investigate the population distribution and habitat status of F. strictus. (2) predict the potential geographic distribution of F. strictus under two future climate change scenarios and analyze the key environmental variables that would limit the distribution of F. strictus, and (3) determine the priority protection area of F. strictus and put forward some suggestions for its protection. The results of this study will help to guide the conservation of F. strictus and provide reference for the conservation of other PESP habitats on an international scale.

2. Materials and Methods

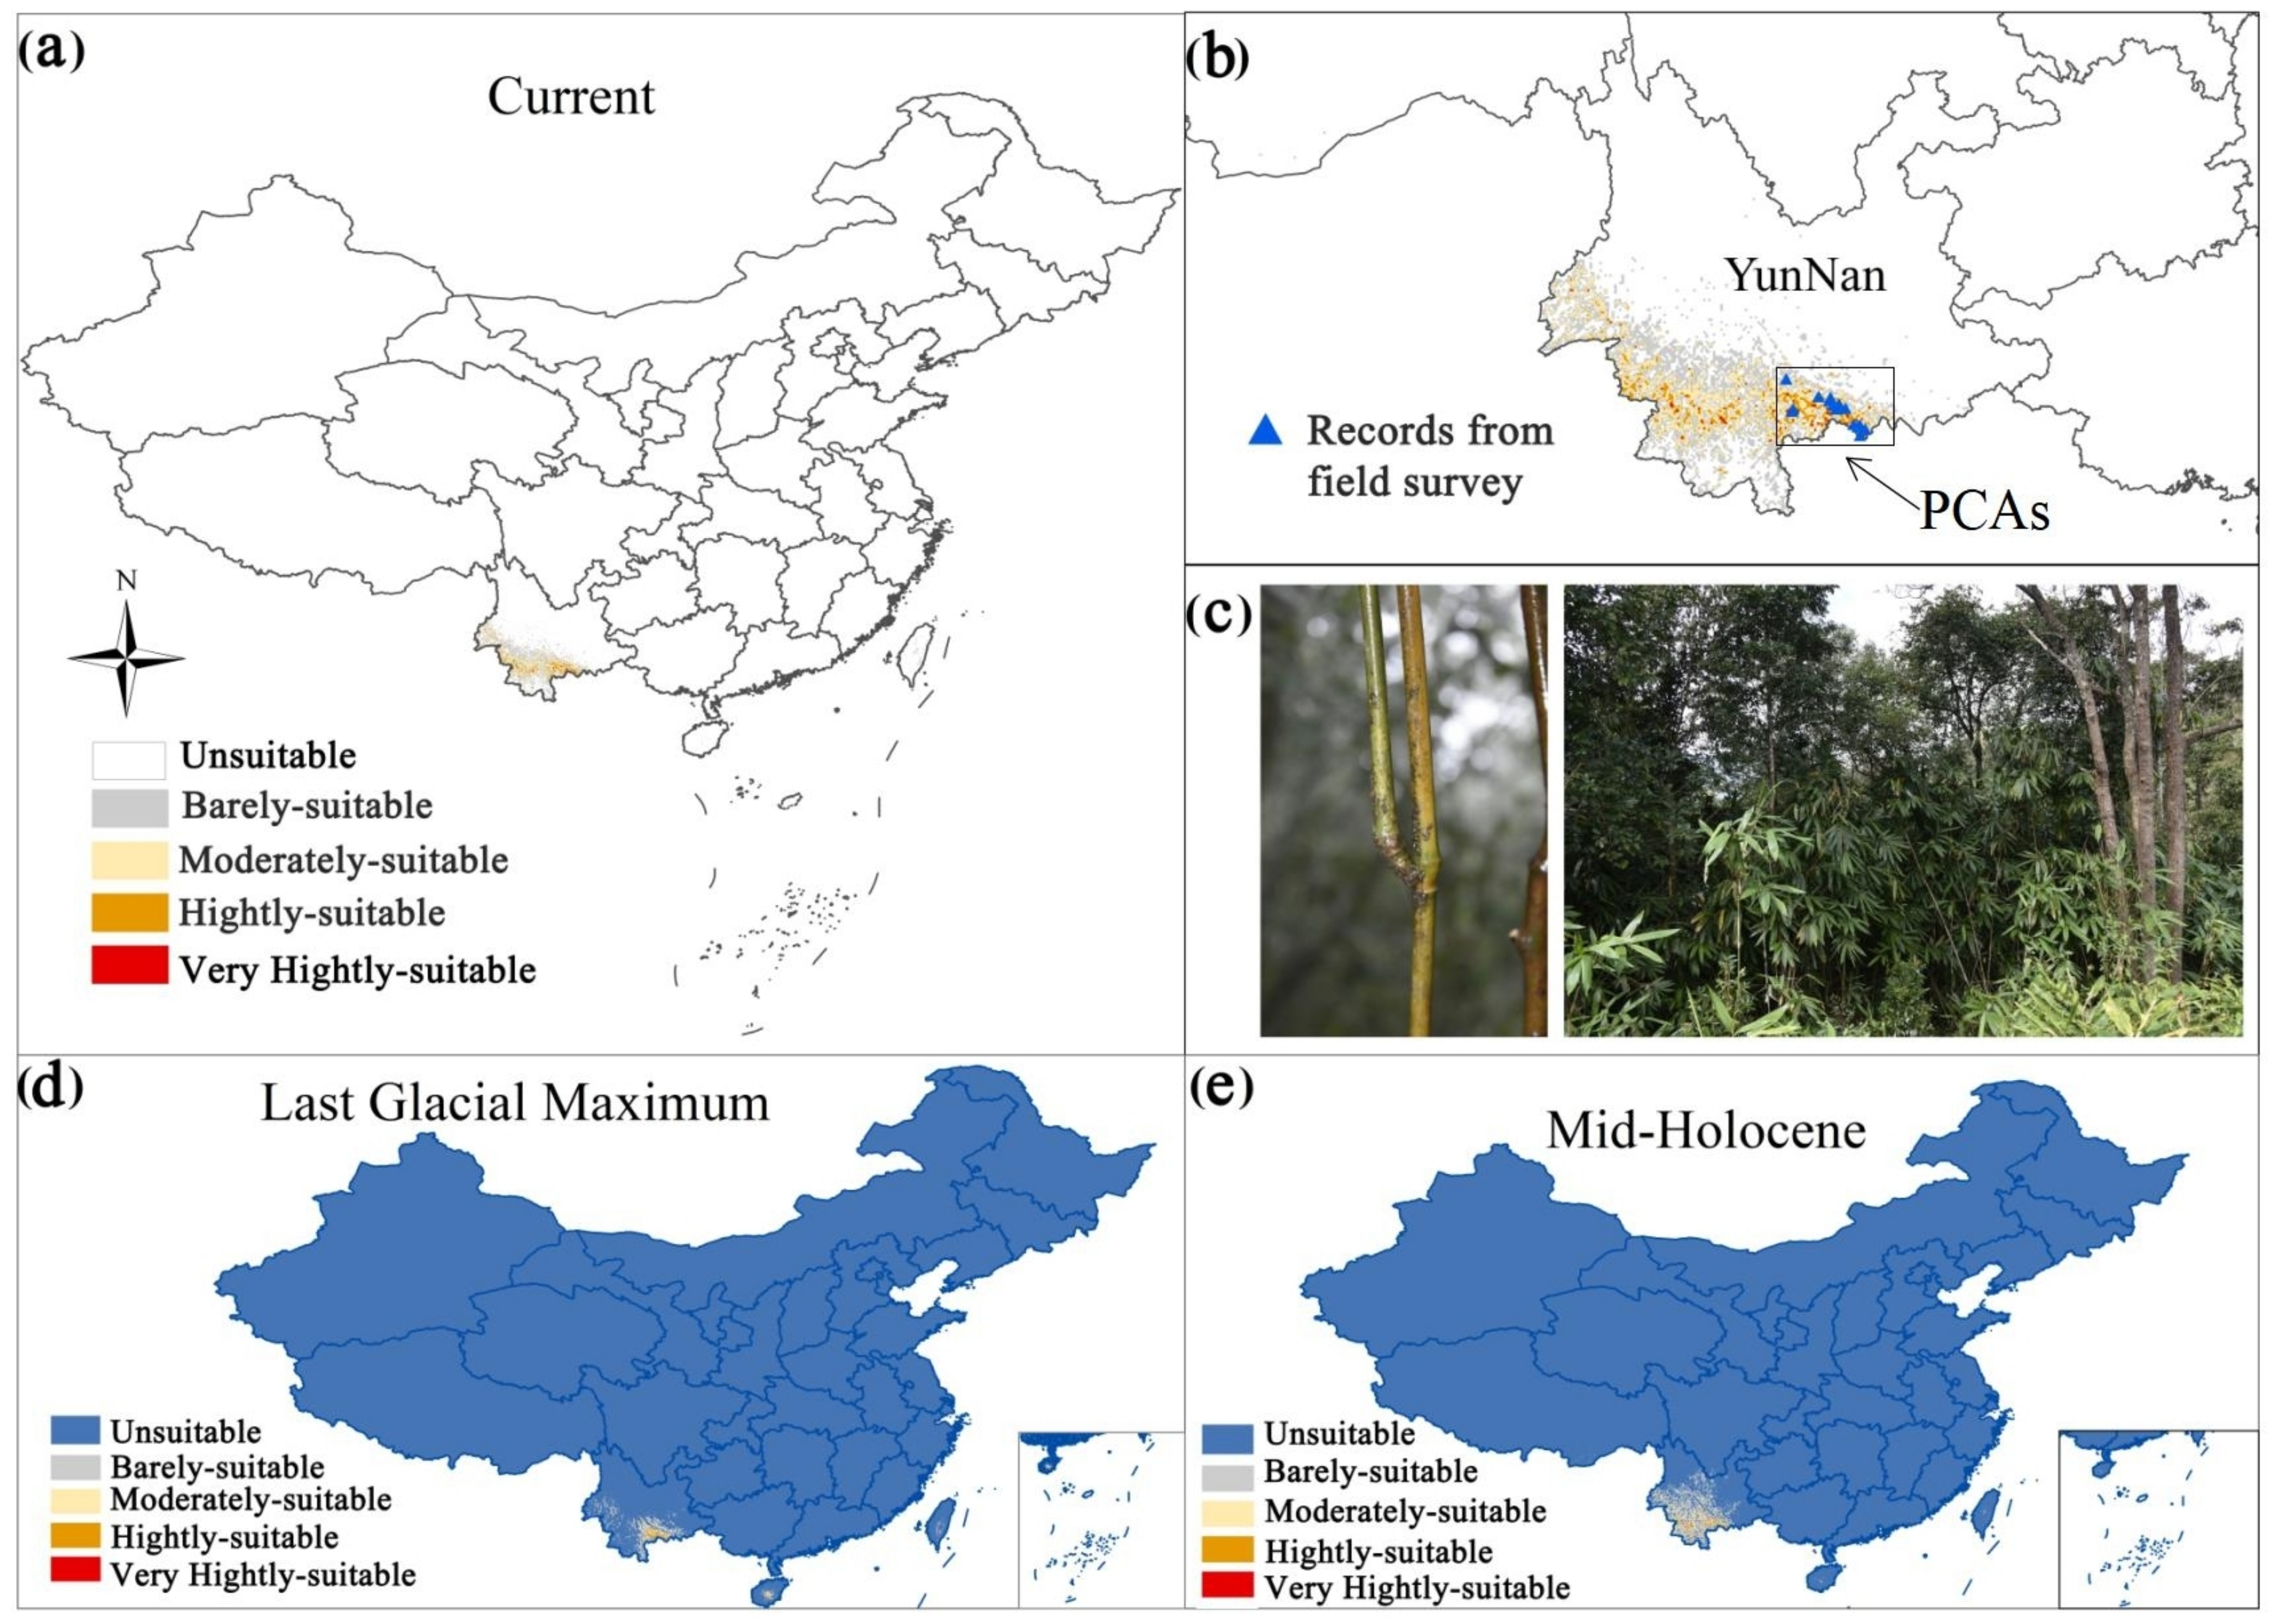
2.1. Distribution of F. strictus

The distribution information of F. strictus was obtained from the literature and data records, e.g., Flora of China, Flora of Yunnan, the flora of various places, and the specimen records collected by the herbarium of the Southwest Forestry University. From October 2020 to March 2021, we conducted extensive field surveys and GPS positioning of all of the distribution areas of F. strictus documented in China, and we confirmed all of the distribution points of F. strictus in China through field investigations. According to the literature and our field investigations, the distribution of F. strictus was recorded only in the south of Yunnan Province. In order to prevent model overfitting, we used ArcGIS software to screen the distribution points and we selected only one distribution point in a “30 × 30” grid. Finally, we selected 25 distribution points from the field investigations which covered almost all of its distribution range.

2.2. Environment Variables

Several environmental factors were used in this study, including 19 climate factors and 3 topographic factors (altitude, slope, and aspect) from the World Climate website (https://www.worldclim.org/ (accessed on 27 November 2022)), 4 UV-B variables from the Global UV-B Radiation Database [48], and 2 soil factors (soil pH and organic carbon content) from the Harmonized world soil database v1.2 [49]. In the MaxEnt (version 3.4.3, https://biodiversityinformatics.amnh.org/open_source/MaxEnt/ (accessed on 27 November 2022)) model, the contribution rate of 28 environmental factors was tested by jackknife to rank their importance. In order to prevent mutual influences among the variables, we conducted a correlation coefficient analysis to eliminate variables with correlation coefficients greater than 0.75. Combined with the jackknife of the MaxEnt model, we finally selected 5 climate factors, 3 topographic factors, 2 soil factors, and 1 UV-B factor (Table 1). Each variable has a uniform resolution of 2.5 arc-minutes and was in the coordinate system CGS_WGS_1984. The maps we used in this article are from the China geographic information system network and were provided on the basis of a 1:4,000,000 map of China and the administrative zoning map of China. We selected two shared socioeconomic pathways (SSP 1-2.6 and SSP 5-8.5) from the BCC CSM2-MR climate system model [50].

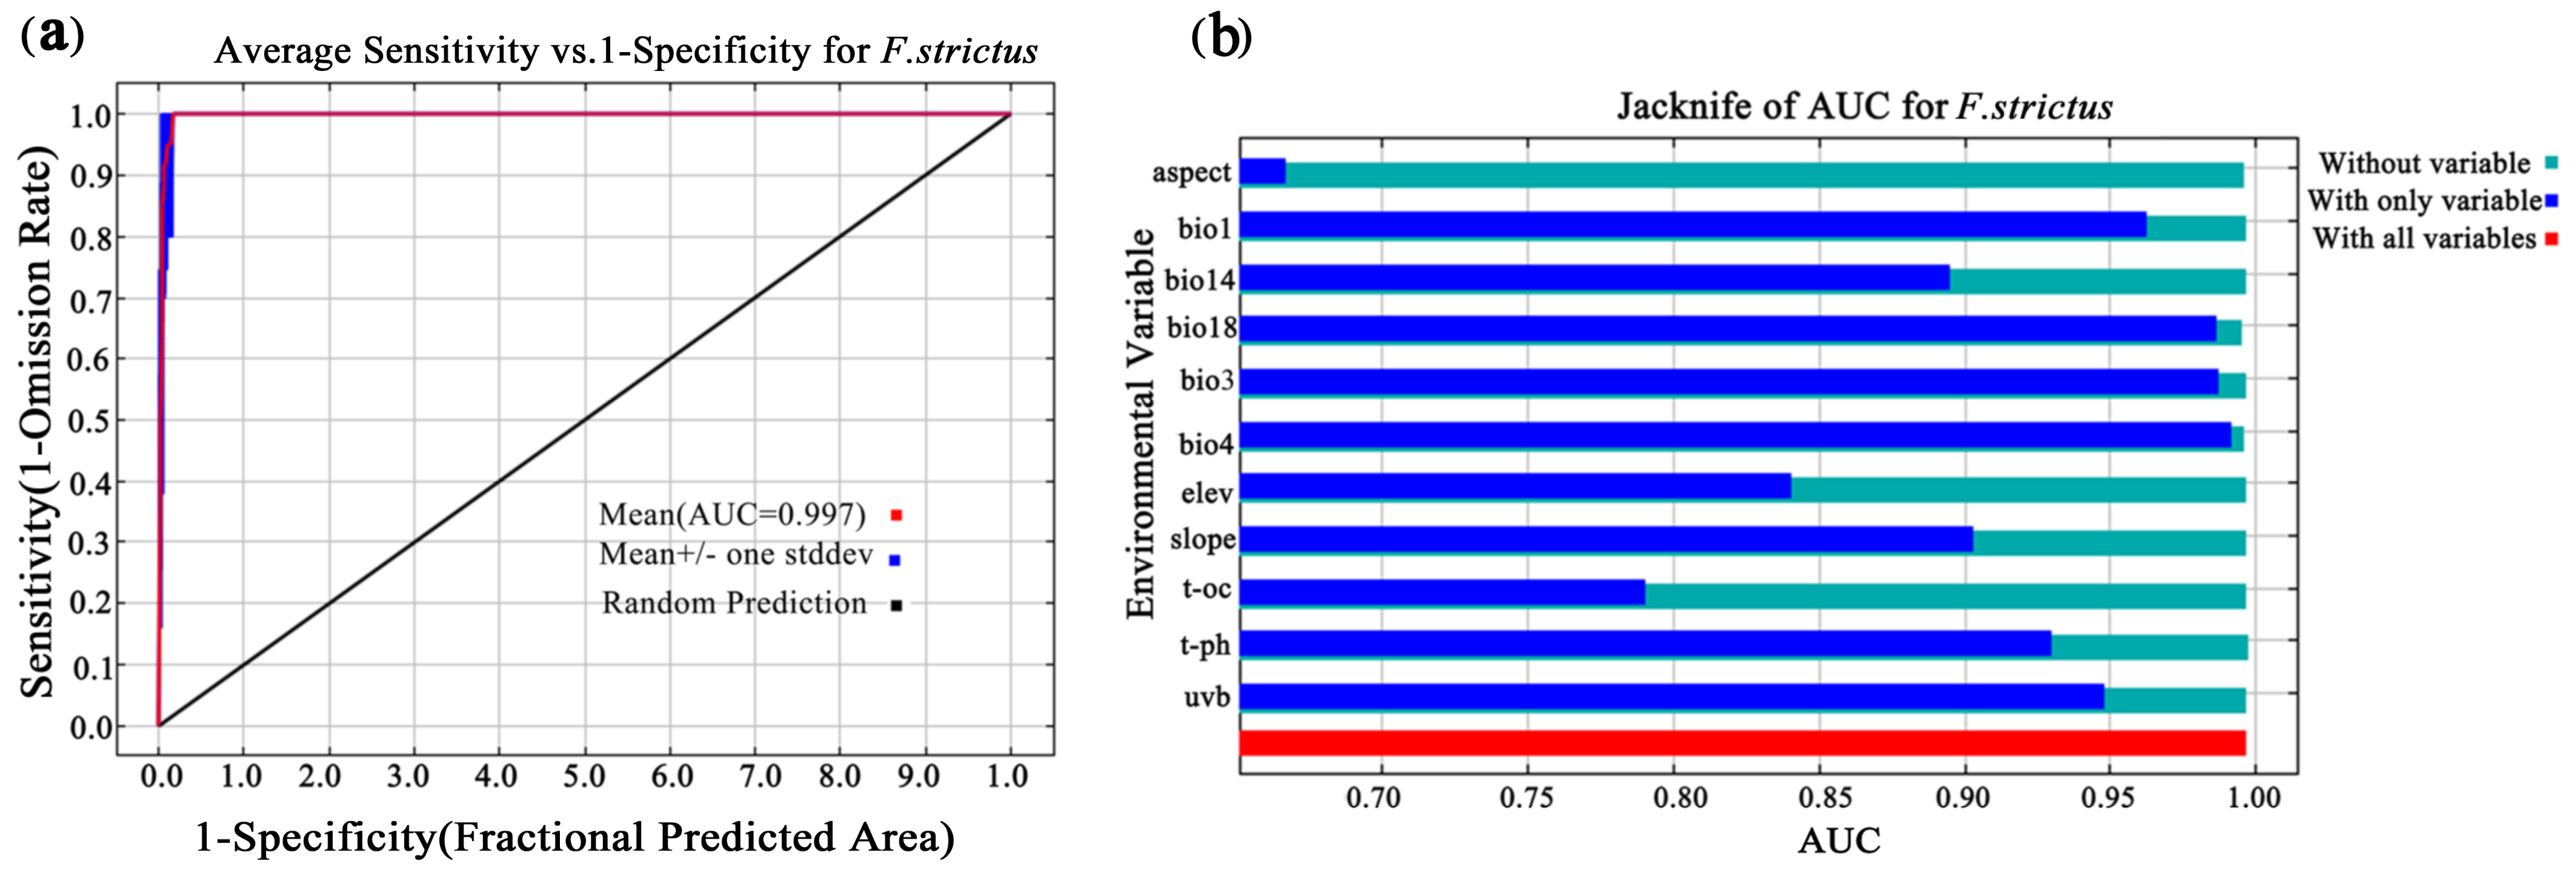
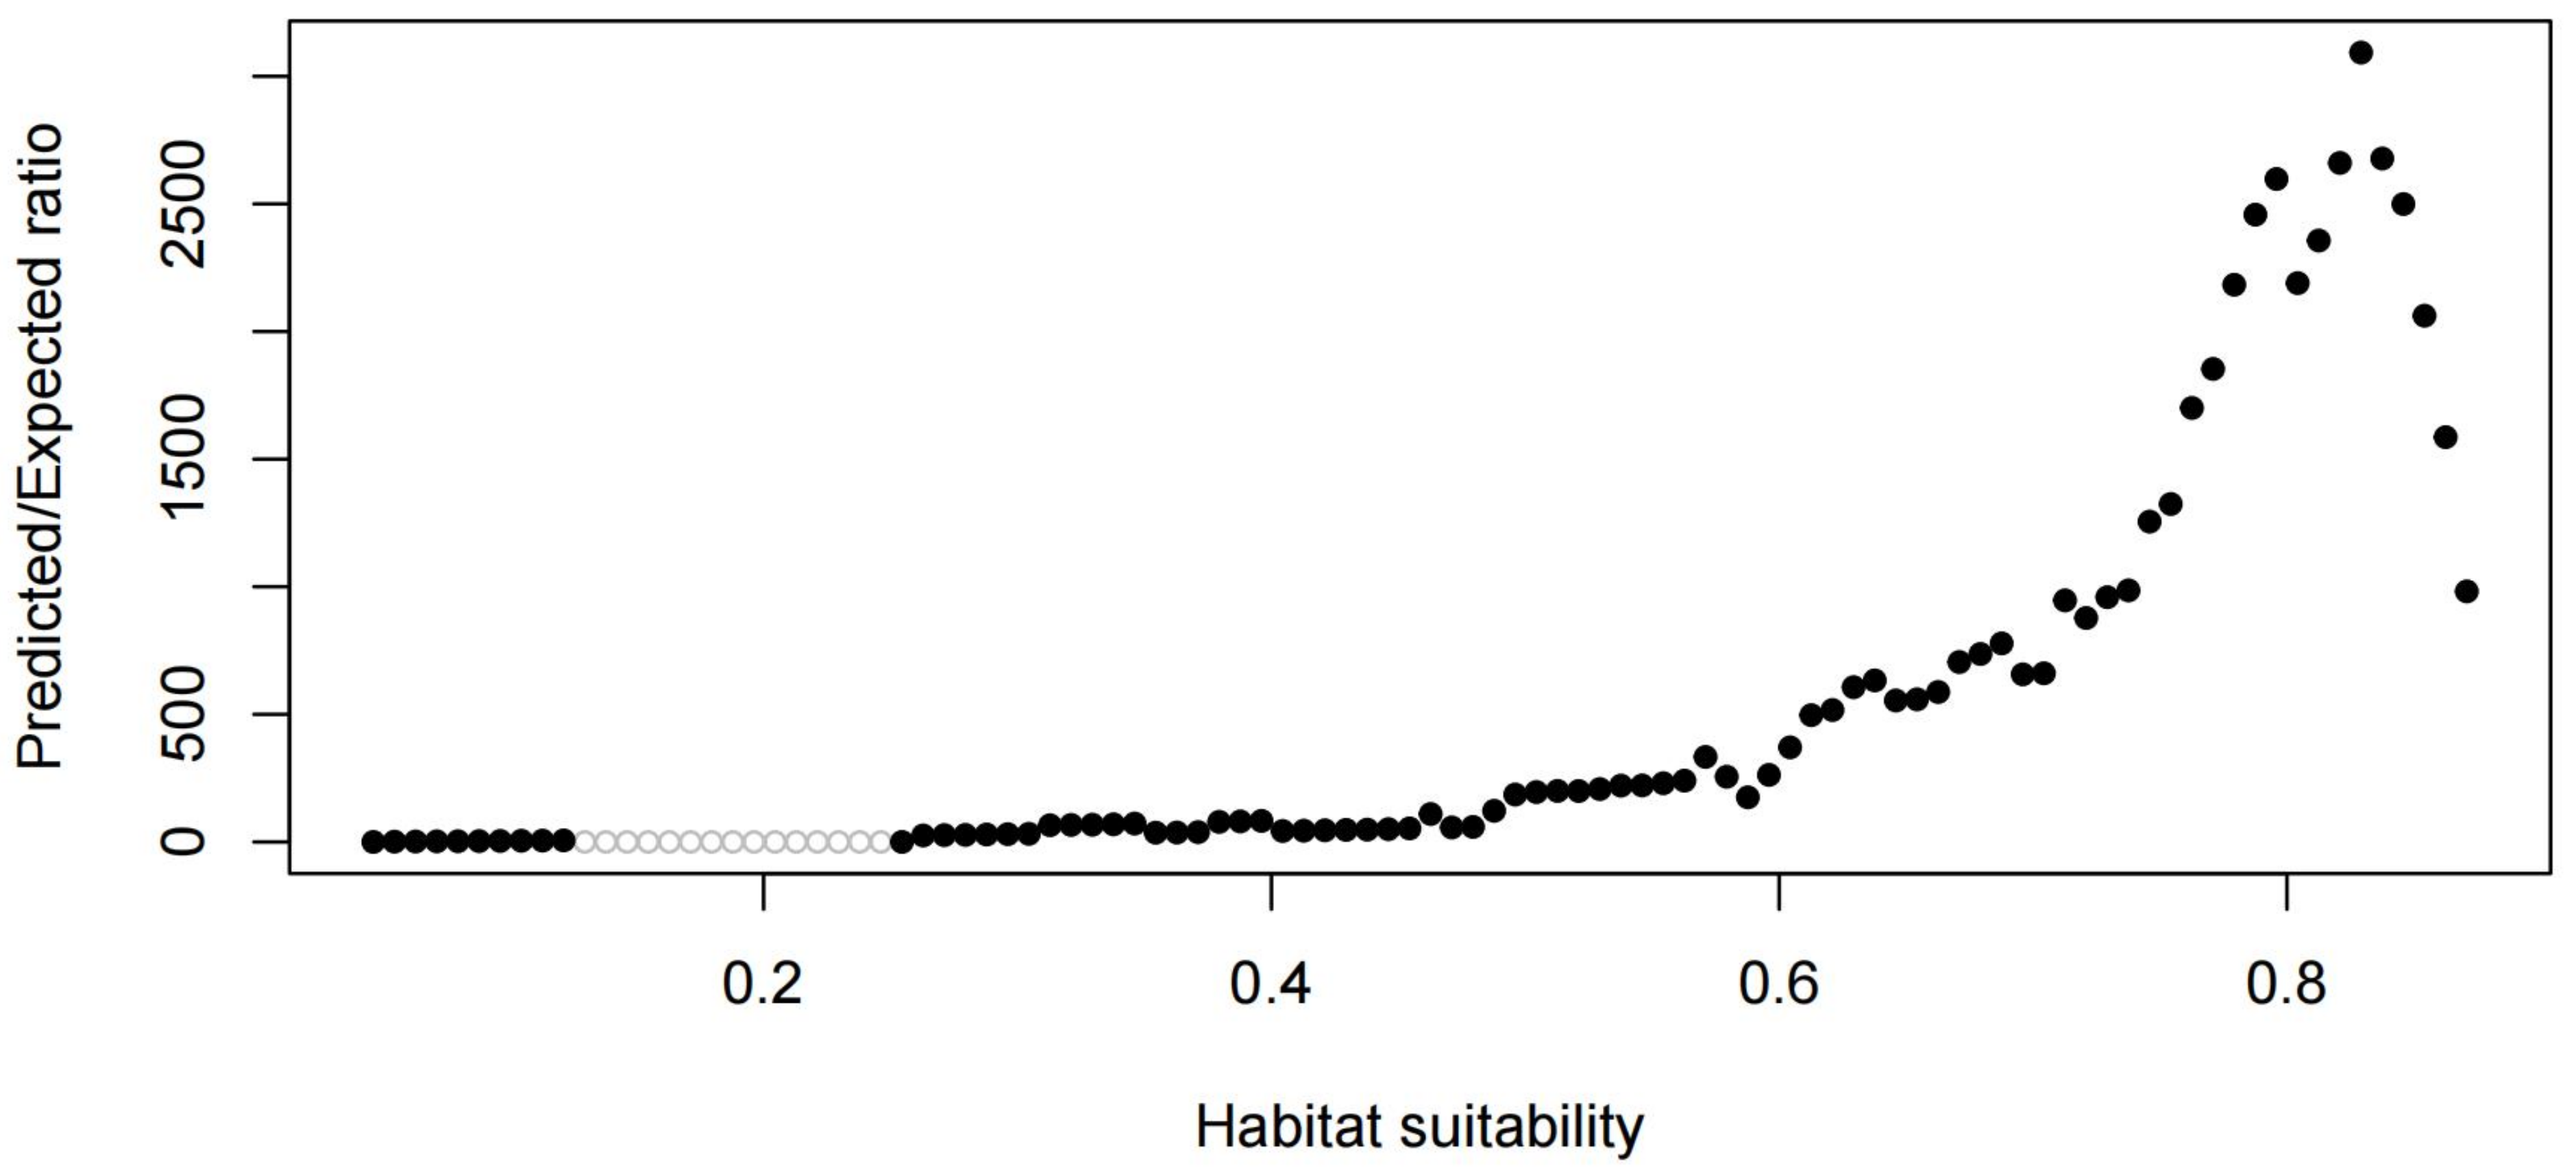
2.3. MaxEnt Model Accuracy

MaxEnt was chosen because it only requires the presence of data and can provide accurate predictions, even with a small sample size [40,51]. Distribution data and environmental data were imported into MaxEnt and 25% of the distribution records were randomly selected for model testing, with the remaining 75% used as training data sets. Because of the small sample size, we used the ENMeval package (http://cran.r-project.org/web/packages/ENMeval/index.html (accessed on 27 November 2022)) to optimize the regularization multipliers and feature combinations to improve the model’s performance and avoid overfitting the results [52,53]. Setting regularization multiplier = 2 and feature combination = LQHPT [54]. Spatial filtering of the raw data with ARGIS software’s SDMtoolbox tool was used to avoid model performance exaggeration [55,56]. Model setup iterations run 10,000 times [51].
The jackknife cutting method was selected to analyze the importance of the environmental factors. The prediction accuracy test of MaxEnt was evaluated by the receiver operating characteristic curve (ROC) and the “continuous Boyce index” package (adamlilith/enmSdm source: R/contBoyce.r (rdrr.Io)), because AUC is not enough to fully evaluate model performance [57]. Therefore, AUC and CBI (continuous Boyce index) were adopted to evaluate the model together. The CBI is suitable for evaluating the performance of models with small sample sizes [58]. The values of the Aucs ranged from 0 to 1, and the prediction effects were divided into poor (<0.7) and good (>0.9) [59]. The outputs from MaxEnt were transferred into ArcGIS10.5 and the reclassification tool of ArcGIS10.5 was used to classify the suitable areas as follows: very highly suitable area (1–0.8), highly suitable area (0.8–0.6), moderately suitable area (0.6–0.4), lowly suitable area (0.4–0.2), and unsuitable area (Mt < 0.2) [60]. The very highly suitable area was the core distribution region. We used the centroid of its core distribution region to detect the change spatial distribution pattern of F. strictus for different periods [61].

3. Results

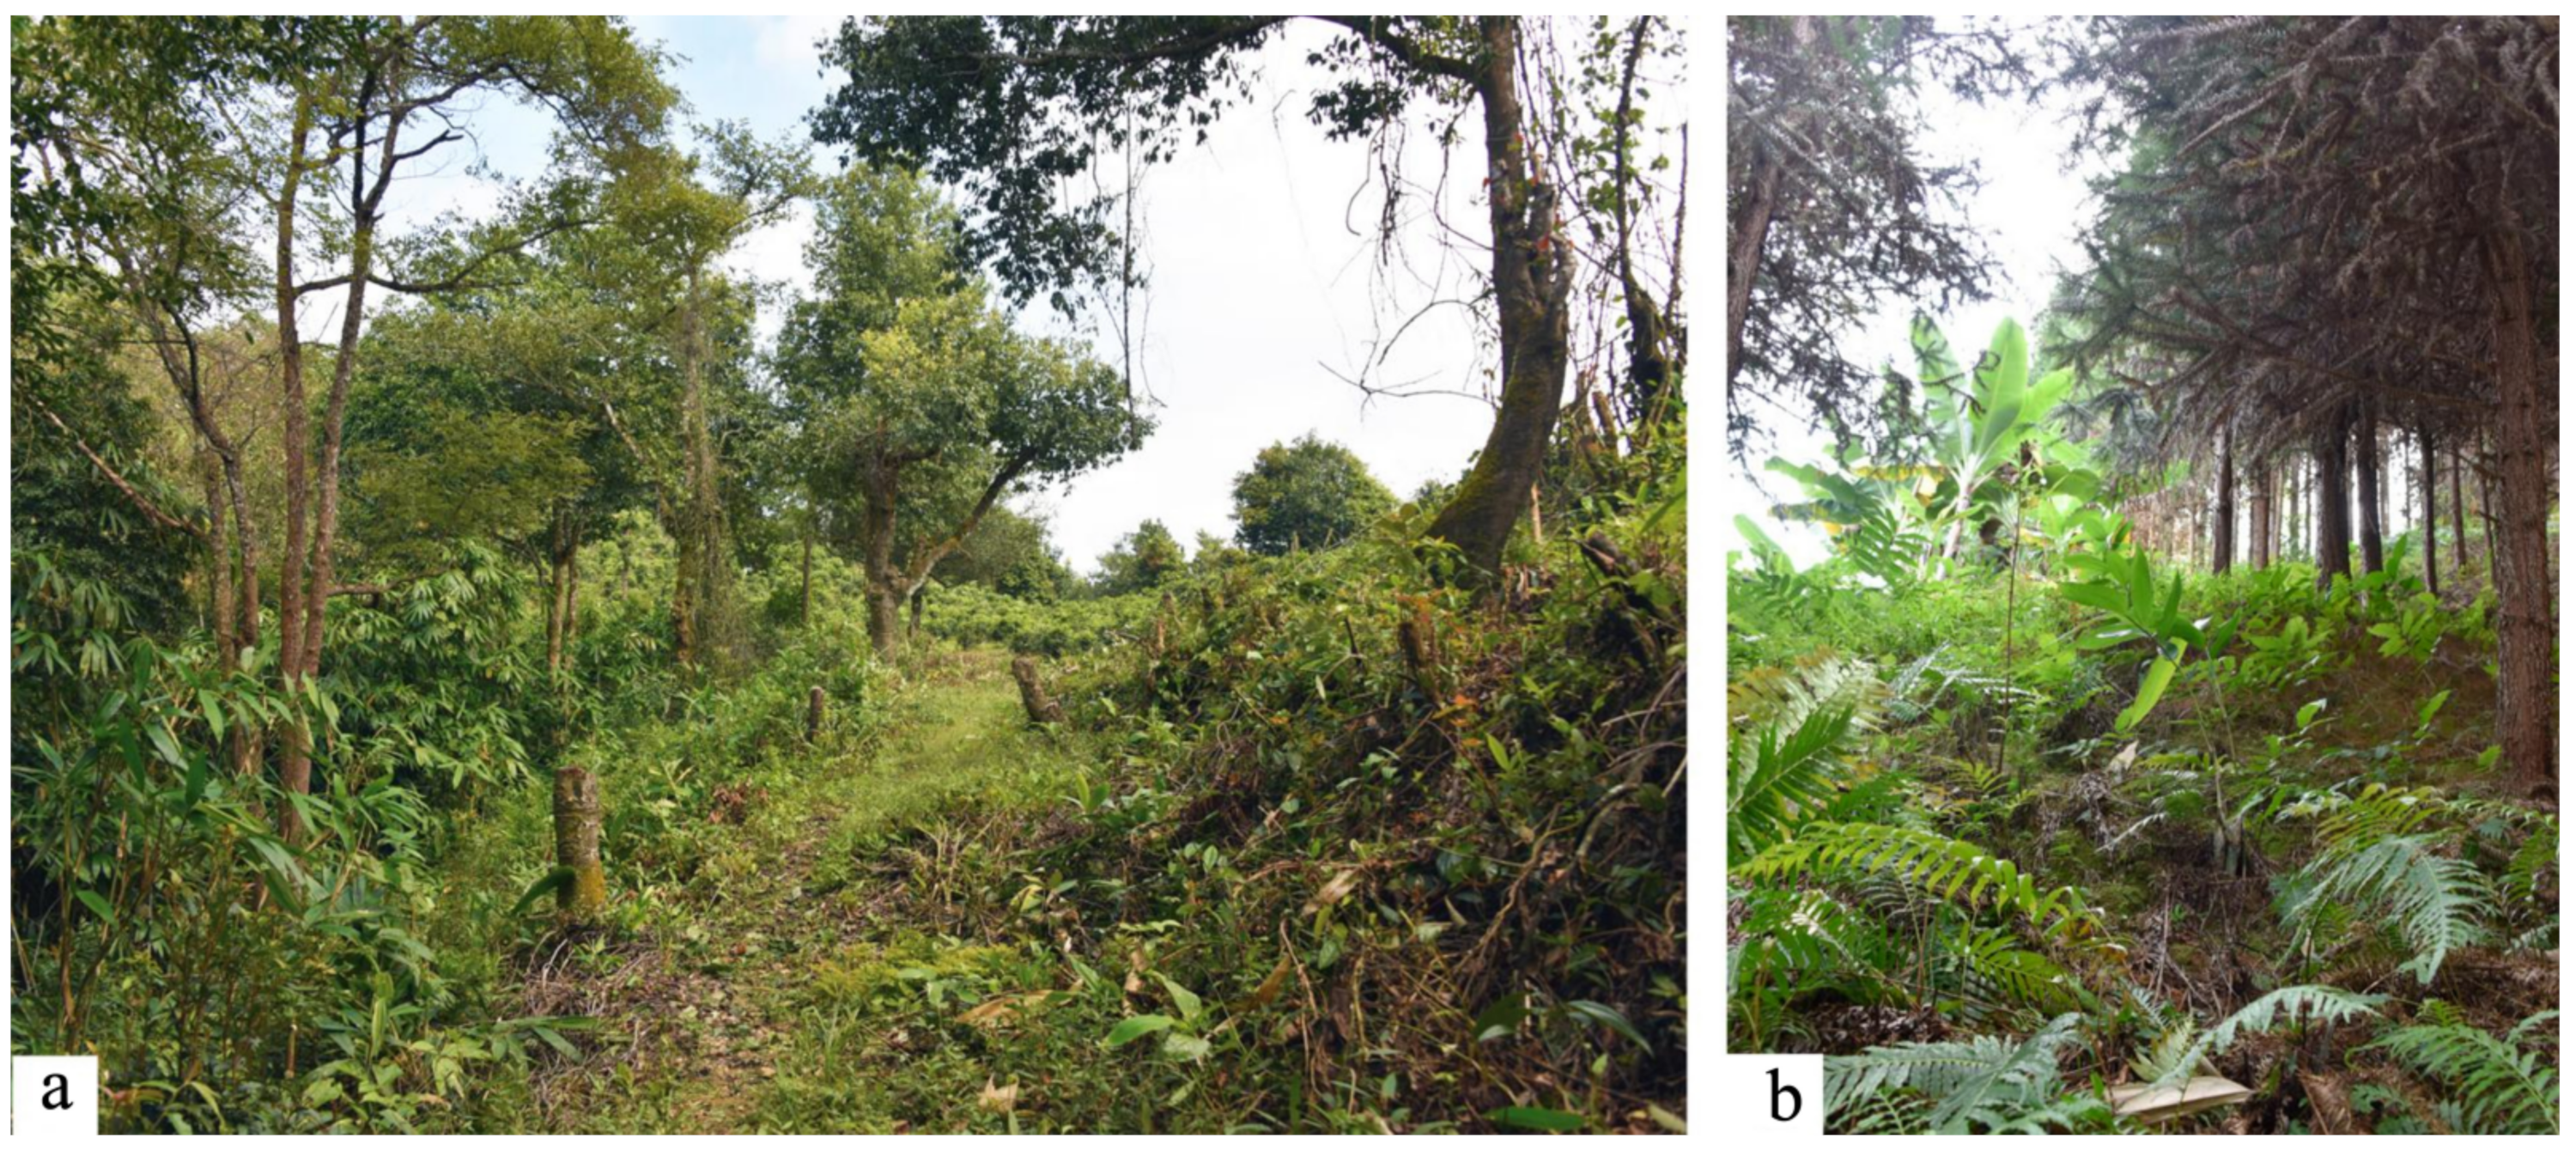
3.1. Population Status of F. strictus

According to the literature and our field investigations, F. strictus was only distributioned in Honghe and Puer in Yunnan (Figure 1). And Honghe County of Honghe Prefecture is a new county distribution point we found. The longitude range of F. strictus in the field was 101°42′53.57″–103°03′13.435″, and the latitude range was 23°27′24.549″–22°29′37.366″. The altitude range was ~750–1985 m. The actual distribution area of F. strictus was only approximately 5.92 km2, which was very narrow and patchy. The distribution area showed a decreasing trend. After our field investigations, we found that the distribution area was suffering from serious human disturbance (Figure 2). Local residents had been cutting it down to make fences and sheds and using its leaves to make traditional Chinese rice pudding. According to the rules of the IUCN Red List of Threatened Species, F. strictus can be classified as endangered (B1a+B1bi). However, F. strictus is not listed on the IUCN Red List of Threatened Species, and it is recommended that F. Strictus be added to the IUCN Red List of Threatened Species.

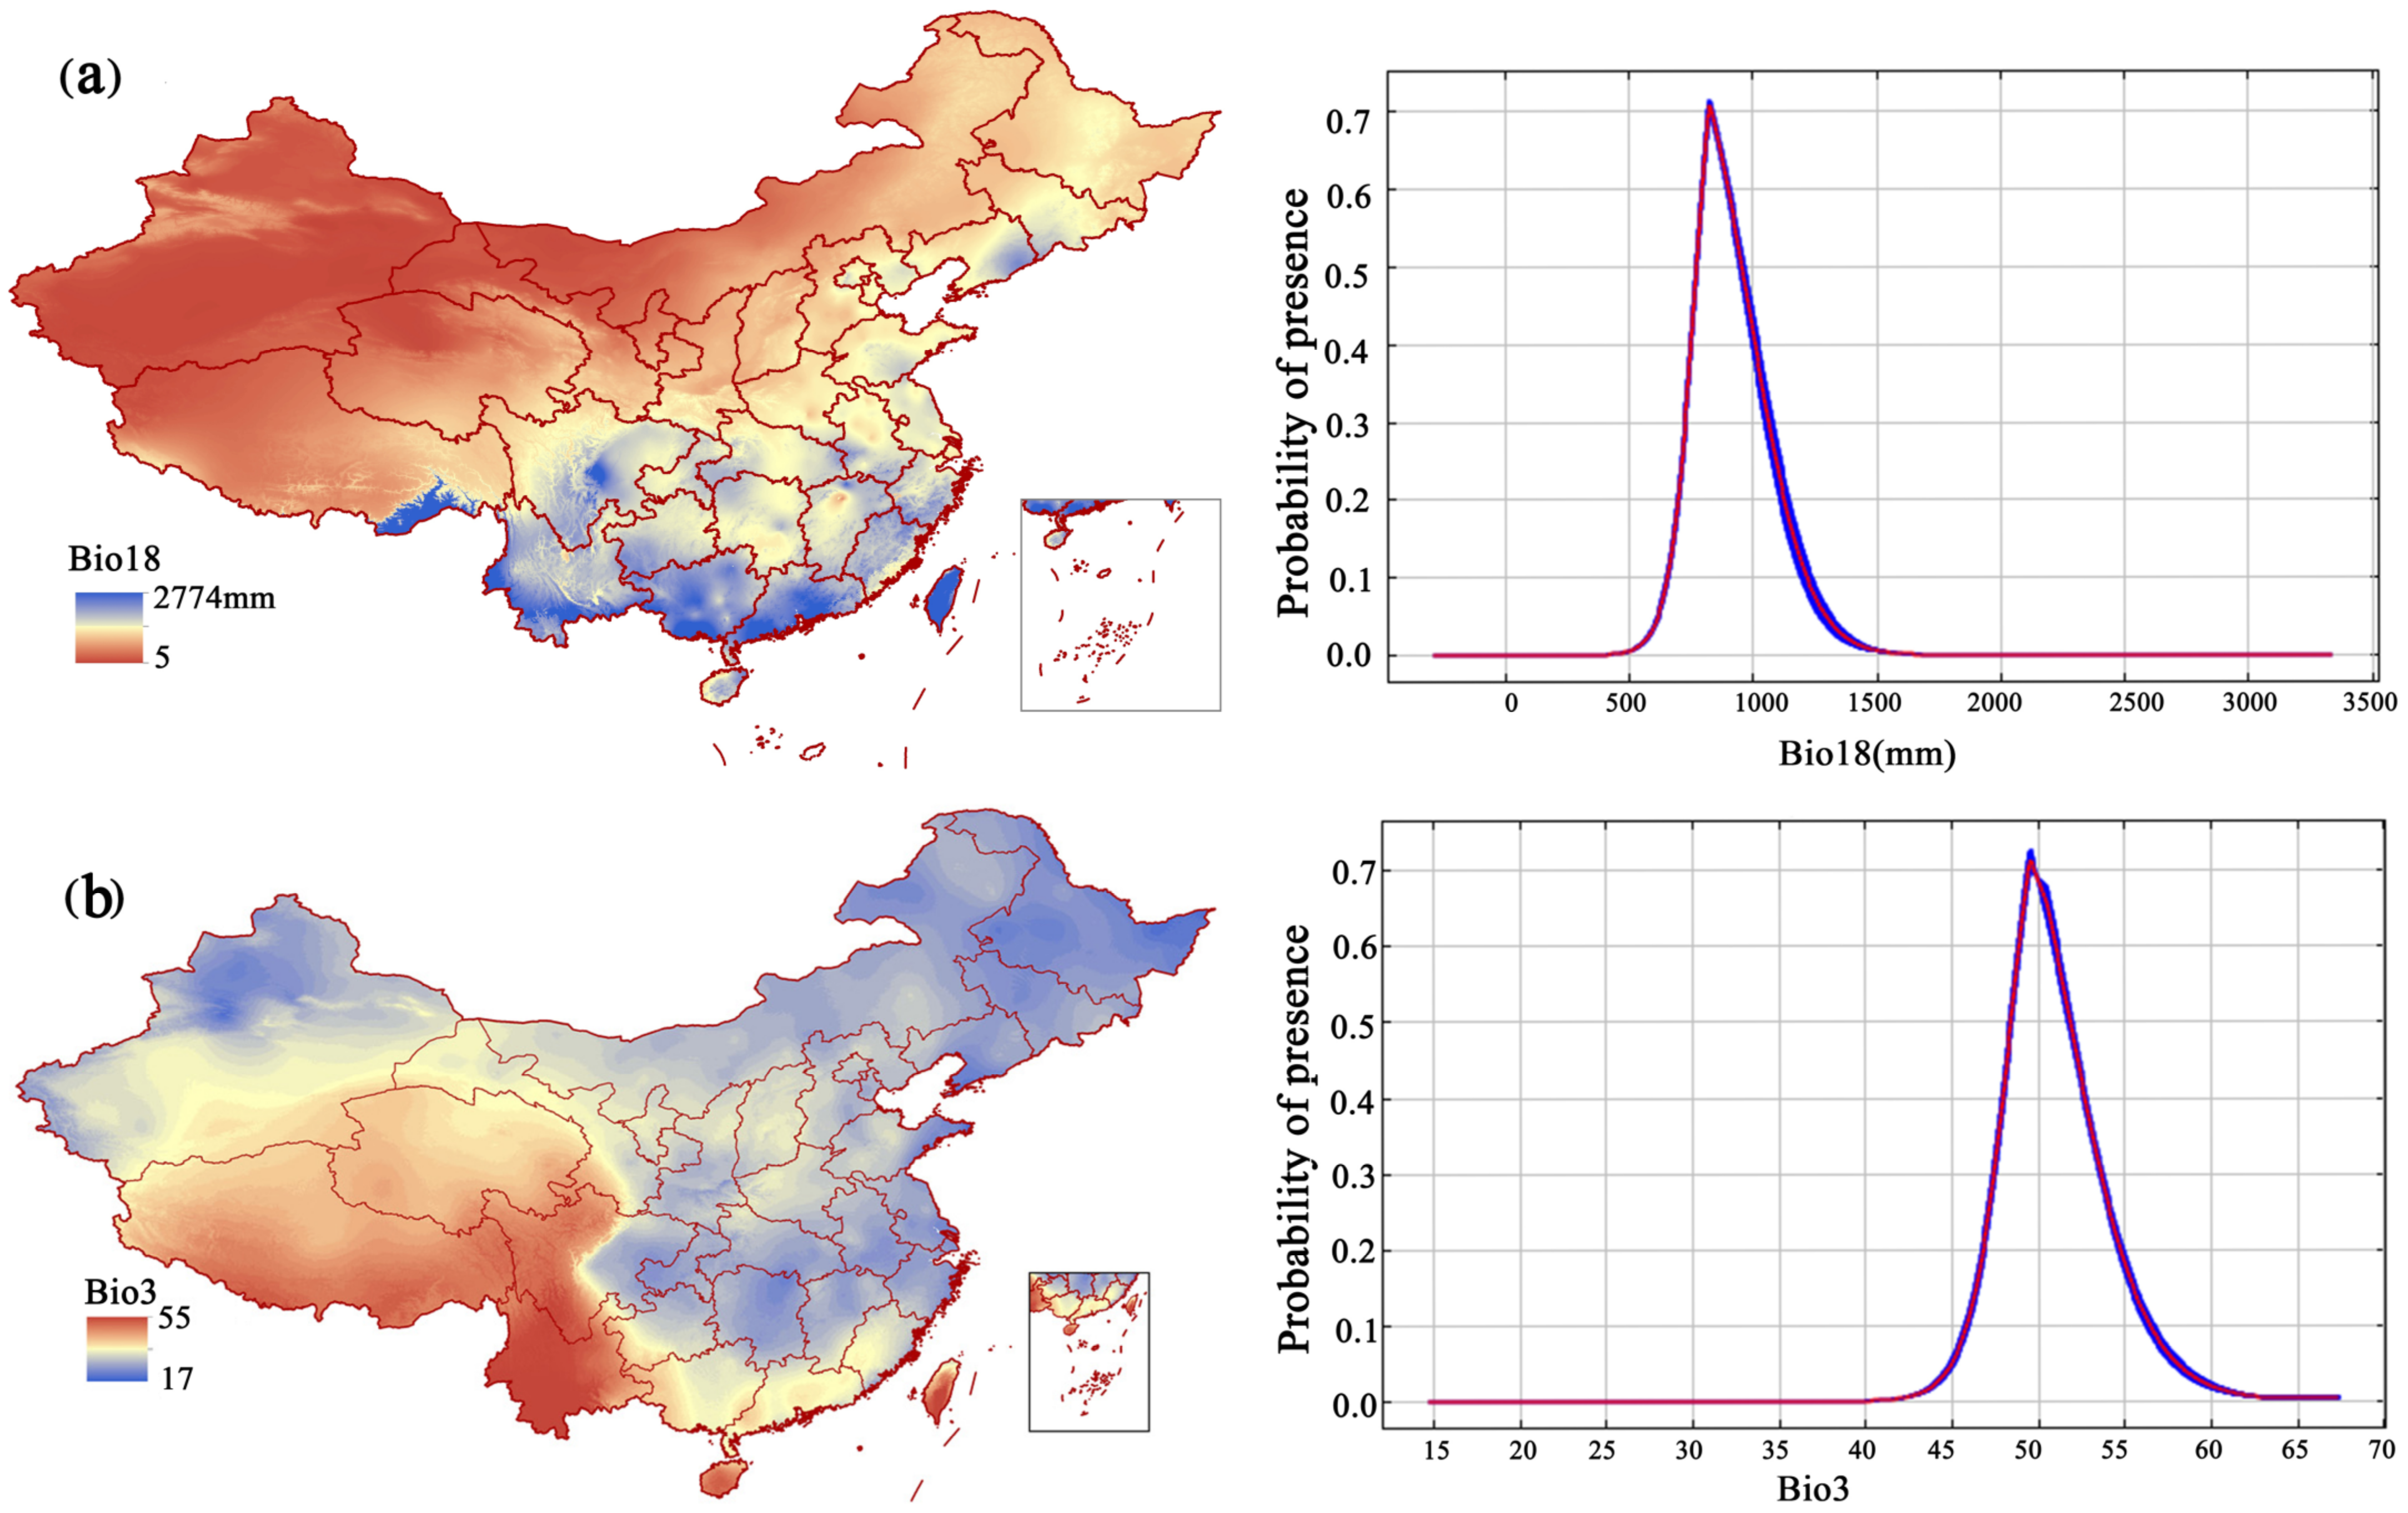
3.2. The Restriction of Environmental Factors on the Geographical Distribution of F. strictus

The AUC value reached 0.997 (Figure 3) and the CBI value reached 0.975 (Figure 4), indicating that the prediction results were accurate. Based on the MaxEnt model, the current total suitable area for F. strictus in China is ~63,883 km2, accounting for 0.99% of the total area of China. Of the total area in China, 99.01% is unsuitable for F. strictus growth (Figure 1). The potential suitable areas are concentrated in Southwest Yunnan, and partial suitable areas in Hainan. The very highly suitable area of F. strictus is ~1162 km2, the highly suitable area is 8586 km2, the moderately suitable area is ~18,906 km2, and the barely suitable area is ~35,228 km2.
Based on the contribution rate (Table 1) and the AUC results based on the model, the precipitation in the warmest quarter (bio18), isotherm (bio3), slope, precipitation in the driest month (bio14), and temperature seasonality (standard deviation × 100) (bio4) were important to the distribution of F. strictus. The precipitation of the warmest quarter (bio18) and the isotherm (bio3) were the key factors affecting the distribution of F. strictus (their cumulative contribution reached 63.3%). When 702 mm < bio18 < 1124 mm, or 42 °C < Bio3 < 54.6 °C, the area was suitable for the growth of F. strictus (Figure 5). This was consistent with our field observations. We have observed in the wild that F. strictus preferred a humid and hot habitat and preferred to grow in a gully with water.

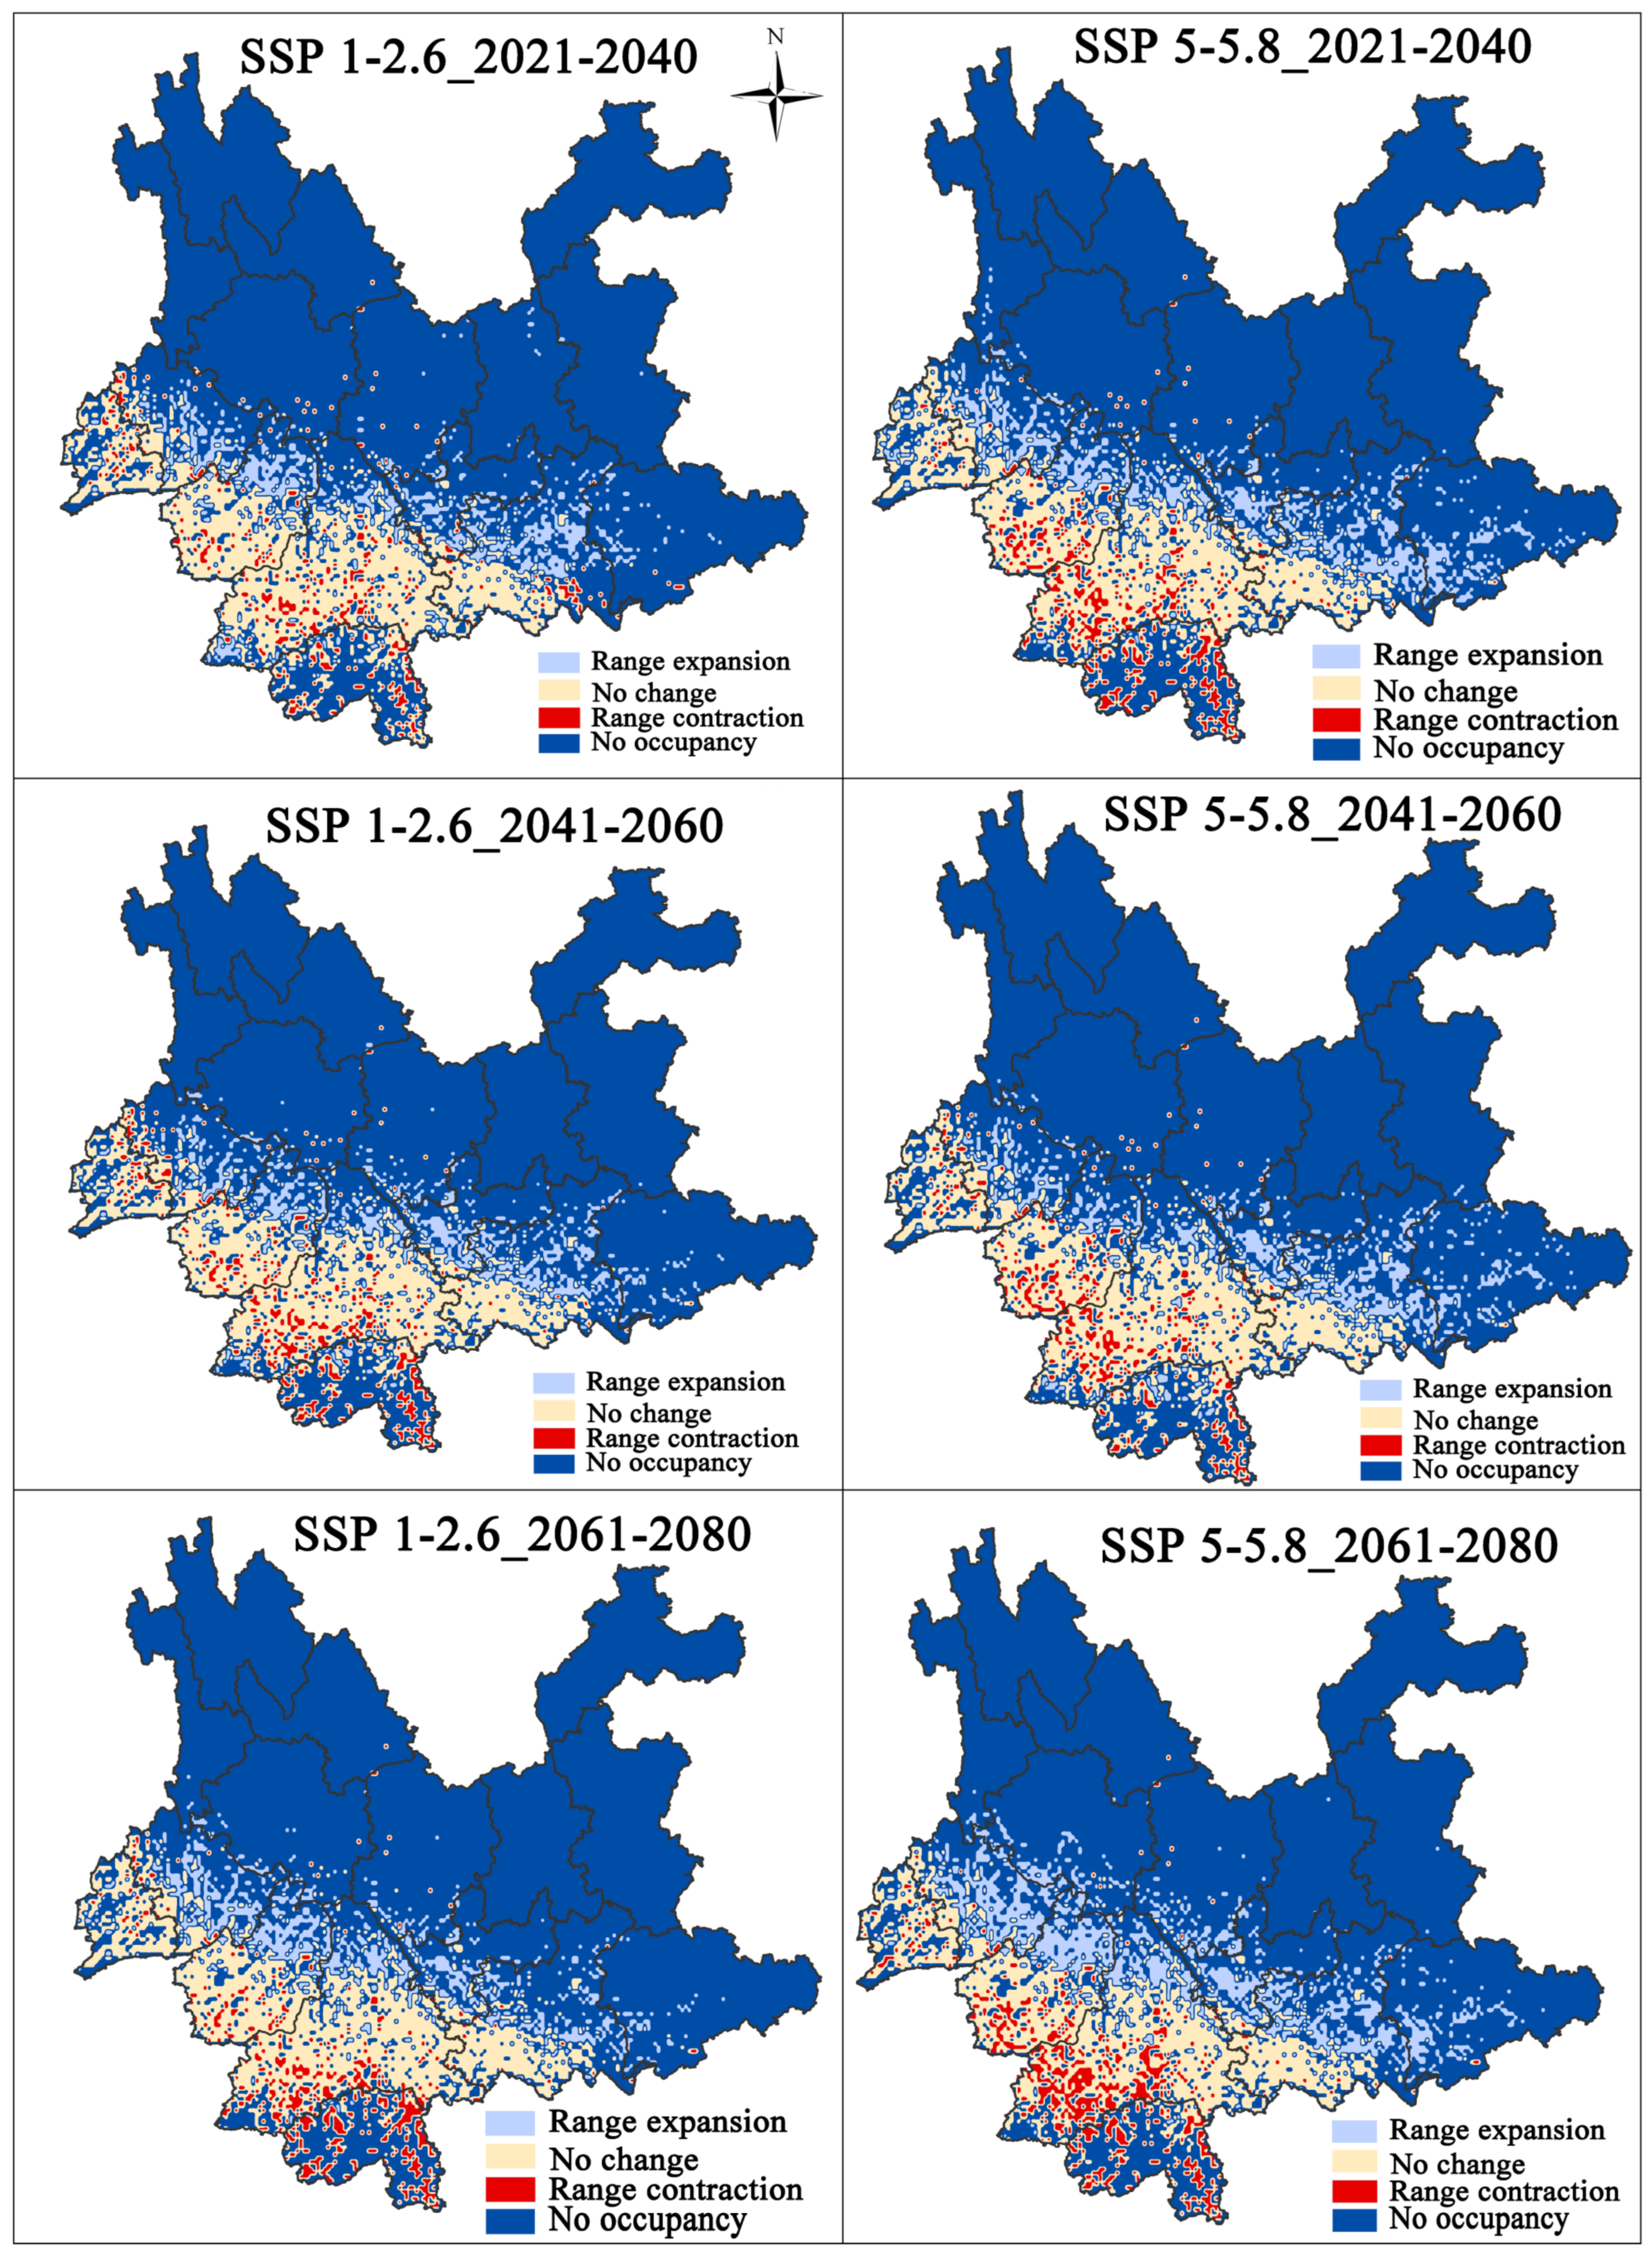
3.3. Changes in the Potential Distribution of F. strictus under Climate Change

Figure 4 shows the change in suitable habitat for three different periods in the future (2021–2040, 2041–2060, and 2061–2080) based on two different climate scenarios (Figure 6). The current total ecologically suitable area for F. strictus increased ~21.6%, ~19.9%, and ~21.1%, respectively, compared with the future SSP1-2.6 climate scenario, and the current total ecologically suitable area for F. strictus increased ~34%, ~26%, and ~30.9%, respectively, compared with the future SSP5-5.8 climate scenario (Table 2). The potentially suitable area for F. strictus in the high emission scenario increased faster than that of the low emission scenario. This indicates that the scenario for high concentration emissions was conducive to the expansion of the suitable area for F. strictus.
During the Last Glacial Maximum and the mid-Holocene periods, the distribution center of F. strictus migrated northward (Figure 7). According to the dynamic distribution and location of the center of the mass of F. strictus from the present to the future, the distribution direction of F. strictus is first east and then north in the low emission scenario. In the high emission scenario, the distribution direction of F. strictus shifts eastward.

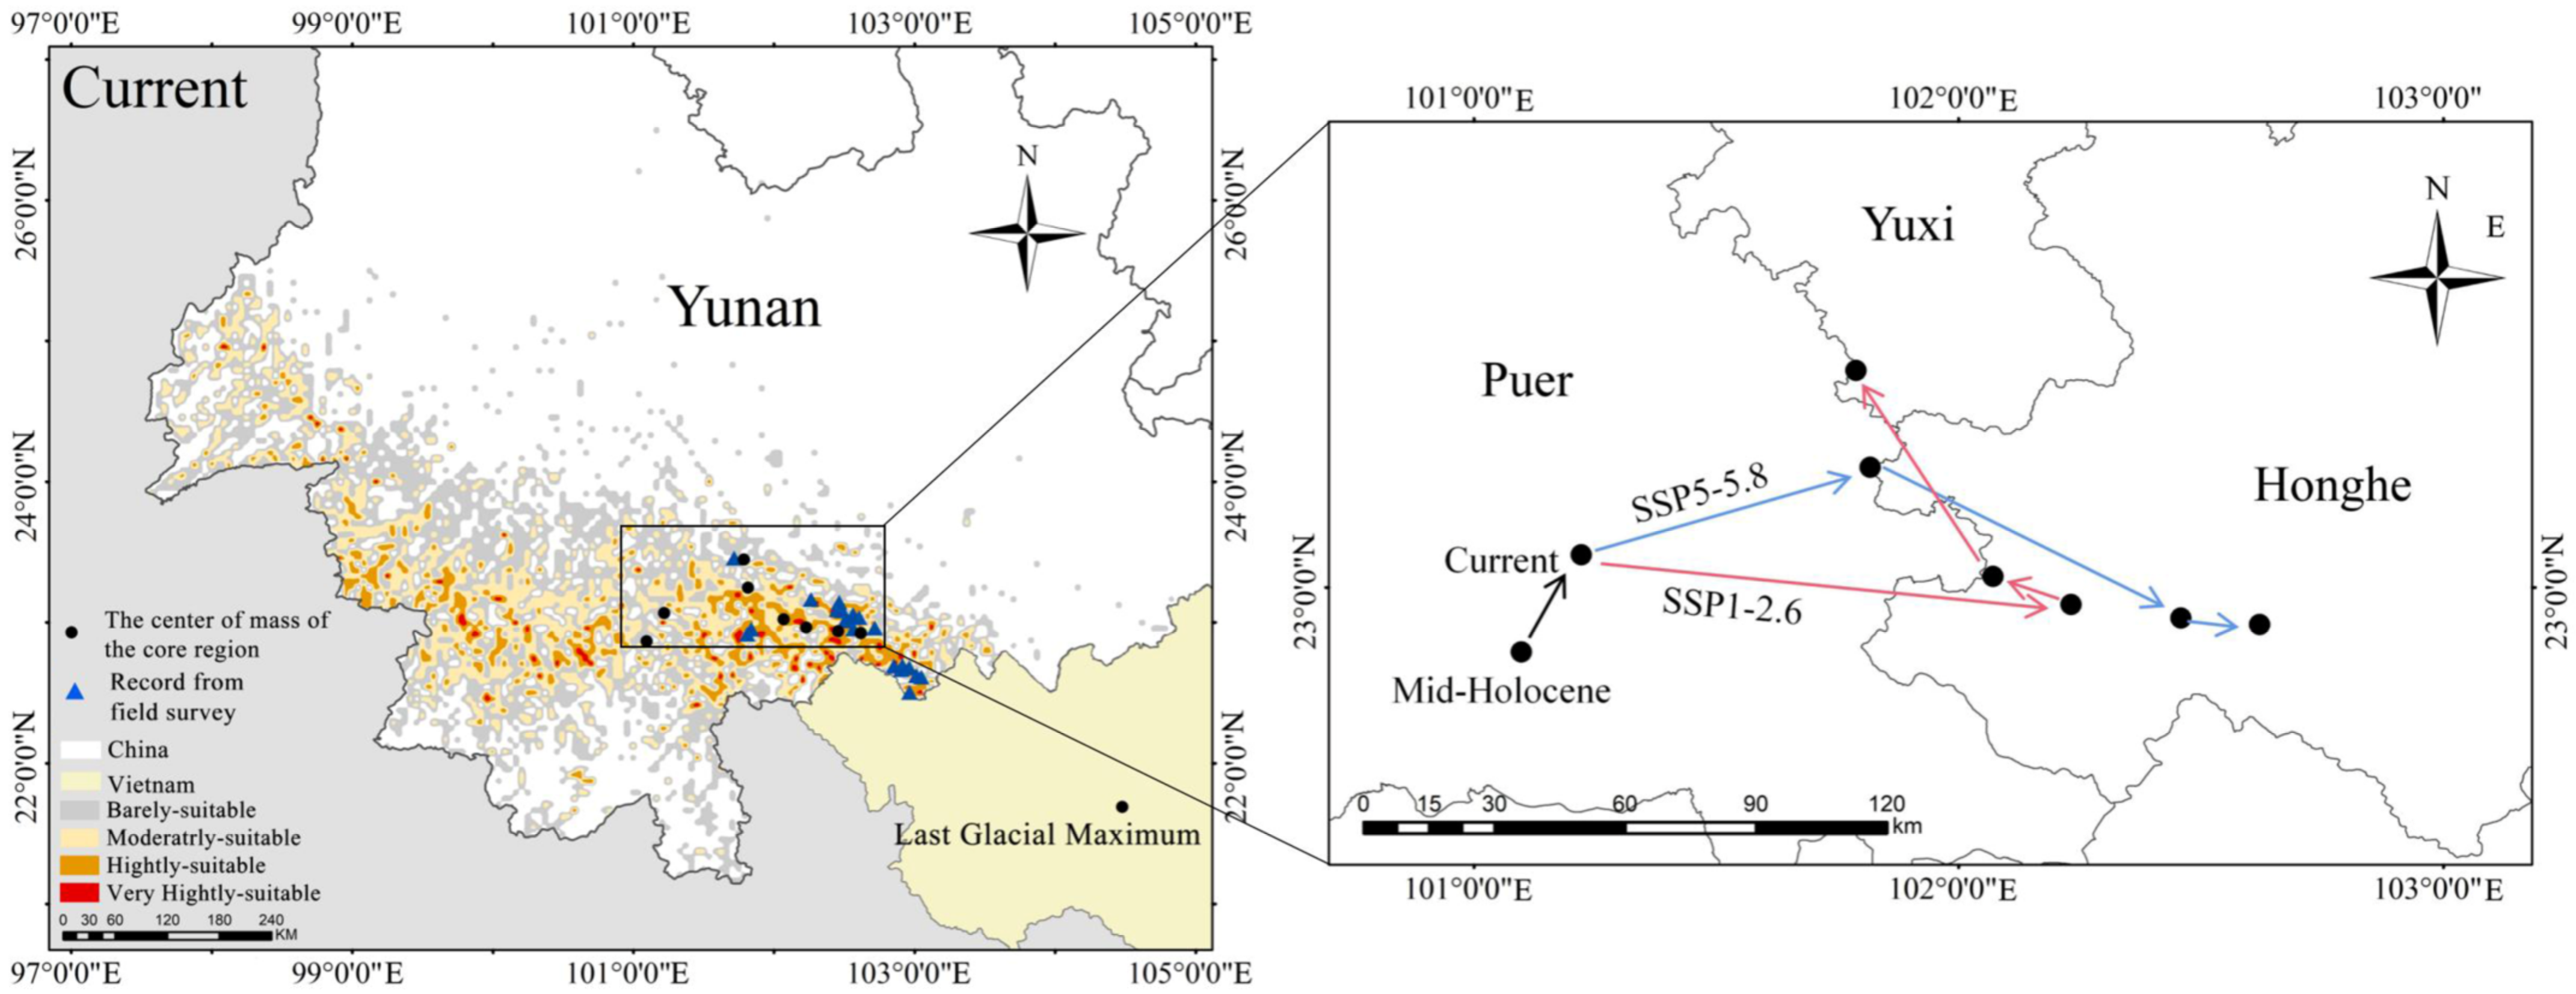
3.4. Priority Conservation Areas

Considering the distribution of suitable areas in the Last Glacial Maximum period, the mid-Holocene period, and the future, the core area of F. strictus in each period was near south Yunnan. Combined with the modern distribution of F. strictus, it is suggested to establish priority conservation areas for in situ and ex situ protection in Yunnan Honghe Jinping Fenshuiling Provincial Nature Reserve and Pu’er Mojiang Xiqisuoluo Provincial Nature Reserve (Figure 1). F. strictus is found in both reserves.

4. Discussion and Conclusions

4.1. The Effect of Climate on Distribution

The potential distribution of F. strictus during the Last Glacial Maximum period decreased by ~37% compared to the current period, but it increased by ~47% during the mid-Holocene period. This shows that the climate of the mid-Holocene period was more suitable for the growth of F. strictus. This is likely because the climate began to warm from the Last Glacial Maximum to the mid-Holocene period. As the ice age receded and temperatures rose, the potential distribution areas of barely suitable, moderately suitable, and highly suitable were increasing, and the total potential distribution area of F. strictus reached its maximum in the middle of the mid-Holocene period.
Under climate change, many species tend to expand northward [62]. The reason that F. strictus does not migrate northward in the high-emission scenario may be that precipitation decreases due to the future’s increased temperatures, which would limit its distribution. Temperature and precipitation play vital roles in plant survival and distribution [63,64,65]. Most of the actual distribution points of F. strictus are in the Ailao Mountain area of southern Yunnan Province, China. This is likely because the mountain barrier is conducive to the formation of a stable microclimate environment, which also provides more suitable conditions for the survival of F. strictus [66]. In combination with the present geographical distribution and future climate responses, F. strictus is sensitive to moisture and temperature, which is likely the main reason for its narrow distribution. Further continuous field monitoring is needed to identify the predictions for F. strictus, which are crucial for the survival of the population.

4.2. Refuge

During the Quaternary glacial period, many species were affected by the glacial climate and moved to areas where they could survive. These areas are called refuges. Refuges are also the starting point for post-glacial redevelopment and the dispersal of species. Studies have shown that southwest China and northern Vietnam were sanctuaries for many plants during the ice age [67]. According to the potential suitable habitat during the Last Glacial Maximum period, the refuge for F. strictus during the glacial period may have been located in Southwest China and Northern Vietnam (Figure 1). However, in the plant survey records of China and Vietnam, there are no records of F. strictus in Vietnam. More evidence is needed to determine whether F. strictus ever survived in Vietnam during the Last Glacial Maximum period. At present, the core area of the model analysis is very close to the actual distribution of F. strictus. Thus, iron bamboo responds very sensitively to the climate. It also shows that the future unstable climate will be a significant challenge for the survival of F. strictus. Before we understand why F. strictus is endangered, we should first protect it. In our field investigations, we found that the anthropogenic influence of F. strictus greatly aggravated its degree of endangerment. It has been found in many places that F. strictus has been cut down, and many specimen-recording sites could not find any trace of it. It is important to identify their priority conservation areas (PCAs) [34], which are essential for providing the in situ and ex situ conservation management of plant populations and habitats.

4.3. Limitations and Prospects

With the increasing application of species distribution models, many studies have shown that the combination model is more suitable for rare species with fewer distribution points [68]. There may be limitations in predicting the results of species in this study using a single model [69]. The human activity factor [70] and spread of species [71,72] was not taken into account in this study, which is also the point that future research needs to address. In this paper, only the relationship between environmental factors and the distribution has been preliminarily explored as the cause of the endangerment of iron bamboo, but there are limitations. In order to better protect iron bamboo, we should study its biological characteristics, ecological adaptability, genetic diversity, and reproductive biology in the future to find out the mechanisms of its endangerment.

4.4. Recommendations for Protection

As a typical PSESP and a rare bamboo species, F. strictus is of great value and should be protected. F. strictus is under great threat, and the threat continues to expand. We need to take measures to protect this rare resource, and herein, we provide suggestions for protecting the natural distribution of F. strictus: (1) establishing priority conservation areas to protect existing population habitats and implementing cultivation and breeding programs; (2) monitoring the growth dynamics of F. strictus to carry out scientific research on its biological characteristics and exploring its endangered mechanisms; (3) planning for the effects of climate change on iron bamboo and developing conservation plans; and (4) strengthening iron bamboo protection publicity and popularizing science work to reduce human interference.

Author Contributions

Investigation, H.H., X.Z., Y.W. and W.W.; formal analysis, H.H.; writing—original draft, H.H.; writing—review and editing, H.H., C.W. and H.Z.; data curation, X.Z., Y.W. and W.W.; revising the manuscript, M.L., S.W. and J.W.; supervision, C.W. and H.Z. All authors have read and agreed to the published version of the manuscript.

Funding

This work was jointly funded by the Xingdian Talent Support Plan, National Natural Science Foundation of China (No. 32160415); Yunnan Fundamental Research Project (No. 202001AT070108); and Yunnan Provincial Joint Special Project for Basic Research in Agriculture (202101BD070001-114).

Institutional Review Board Statement

Not applicable.

Informed Consent Statement

Not applicable.

Data Availability Statement

All of the data in this paper were downloaded from the publicly accessible websites cited in the main text. The species occurrence data are available on request from the corresponding author.

Conflicts of Interest

The authors declare that they have no known competing financial interests or personal relationships that could affect the work reported here.

References

  1. Yang, Q.E.; Zhu, G.H.; Hong, D.; Wu, Z.; Raven, P.H. World’s largest flora completed. Science 2005, 309, 2163. [Google Scholar] [CrossRef] [PubMed]
  2. Volis, S. How to conserve threatened Chinese plant species with extremely small populations? Plant Divers. 2016, 38, 45–52. [Google Scholar] [PubMed] [Green Version]
  3. Ma, Y.; Gao, C.; Grumbine, R.E.; Dao, Z.; Sun, W.; Guo, H. Conserving plant species with extremely small populations (PSESP) in China. Biodivers. Conserv. 2013, 22, 803–809. [Google Scholar] [CrossRef]
  4. Ren, H.; Zhang, Q.m.; Lu, H.f.; Liu, H.x.; Guo, Q.F.; Wang, J.; Jian, S.g.; Bao, H. Wild plant species with extremely small populations require conservation and reintroduction in China. Ambio 2012, 41, 8. [Google Scholar]
  5. State Forestry Administration of China. The Saving and Conservation Program on Extremely Small Populations in China; State Forestry Administration of China: Beijing, China, 2012.
  6. Sun, W.B.; Yang, J.; Dao, Z.L. Study and Conservation of Plant Species with Extremely Small Populations (PSESP) in Yunnan Province, China; Science Press: Beijing, China, 2019. [Google Scholar]
  7. Wade, E.M.; Nadarajan, J.; Yang, X.; Ballesteros, D.; Sun, W.; Pritchard, H.W. Plant species with extremely small populations (psesp) in China: A seed and spore biology perspective. Plant Divers. Engl. Ed. 2016, 38, 12. [Google Scholar] [CrossRef] [PubMed] [Green Version]
  8. Crane, P. Conserving our global botanical heritage: The PSESP plant conservation program. Plant Divers. 2020, 42, 319–322. [Google Scholar]
  9. Sun, W.B.; Ma, Y.P.; Blackmore, S. How a new conservation action concept has accelerated plant conservation in china. Trends Plant Sci. 2019, 24, 4–6. [Google Scholar]
  10. Yang, J.; Muhammad, W.H.; Tao, L.; Zhang, R.; Yun, Q.; Peter, H.; Dao, Z.L.; Luo, G.F.; Guo, H.J.; Ma, Y.P.; et al. De novo genome assembly of the endangered acer yangbiense, a plant species with extremely small populations endemic to Yunnan province, China. GigaScience 2019, 8, giz085. [Google Scholar] [CrossRef] [Green Version]
  11. Bachman, S.P.; Nic Lughadha, E.M.; Rivers, M.C. Quantifying progress toward a conservation assessment for all plants. Conserv. Biol. J. Soc. Conserv. Biol. 2018, 32, 516–524. [Google Scholar] [CrossRef] [Green Version]
  12. Huang, Y.; Fu, J.; Wang, W.; Li, j. Development of China’s nature reserves over the past 60 years: An overview. Land Use Policy 2019, 80, 224–232. [Google Scholar] [CrossRef]
  13. Bertrand, R.; Lenoir, J.; Piedallu, C.; Riofrío-Dillon, G.; De Ruffray, P.; Vidal, C.; Pierrat, J.C.; Gégoutet, J.C. Changes in plant community composition lag behind climate warming in lowland forests. Nature 2011, 479, 517–520. [Google Scholar] [CrossRef]
  14. Zheng, Y.; Ji, N.N.; Wu, B.W.; Wang, J.T.; Hu, H.W.; Guo, L.D.; He, J.Z. Climatic factors have unexpectedly strong impacts on soil bacterial β-diversity in 12 forest ecosystems. Soil Biol. Biochem. 2020, 142, 107699. [Google Scholar] [CrossRef]
  15. Moreno, J.L.; Bastida, F.; Díaz-López, M.; Li, Y.; Zhou, Y.; López-Mondéjar, R.; Benavente-Ferraces, I.; Rojas, R.; Rey, A.; García-Gil, J.C.; et al. Response of soil chemical properties, enzyme activities and microbial communities to biochar application and climate change in a mediterranean agroecosystem. Geoderma 2022, 407, 115536. [Google Scholar]
  16. Bellard, C.; Bertelsmeier, C.; Leadley, P.; Thuiller, W.; Courchamp, F. Impacts of climate change on the future of biodiversity. Ecol. Lett. 2012, 15, 365–377. [Google Scholar] [CrossRef]
  17. Thomas, C.D.; Cameron, A.; Green, R.E.; Bakkenes, M.; Beaumont, L.J.; Collingham, Y.C.; Williams, S.E. Extinction risk from climate change. Nature 2004, 427, 145–148. [Google Scholar] [CrossRef] [Green Version]
  18. Thuiller, W.; Lavorel, S.; Araújo, M.B.; Sykes, M.T.; Prentice, I.C. Climate change threats to plant diversity in Europe. Proc. Natl. Acad. Sci. USA 2005, 102, 8245–8250. [Google Scholar] [CrossRef] [Green Version]
  19. Segan, D.B.; Murray, K.A.; Watson, J.E. A global assessment of current and future biodiversity vulnerability to habitat loss–climate change interactions. Glob. Ecol. Conserv. 2016, 5, 12–21. [Google Scholar] [CrossRef] [Green Version]
  20. Zhang, Y.; Wang, Y.; Zhang, M.; Ma, K. Climate change threats to protected plants of china: An evaluation based on species distribution modeling. Chin. Sci. Bull. 2014, 59, 4652–4659. [Google Scholar] [CrossRef]
  21. Zhao, Z.; Wang, Y.; Zang, Z.; Deng, S.; Shen, G. Climate warming has changed phenology and compressed the climatically suitable habitat of metasequoia glyptostroboides over the last half century. Glob. Ecol. Conserv. 2020, 23, e01140. [Google Scholar] [CrossRef]
  22. Cogoni, D.; Fenu, G.; Dessì, C.; Deidda, A.; Giotta, C.; Piccitto, M.; Bacchetta, G. Importance of Plants with Extremely Small Populations (PSESPs) in Endemic-Rich Areas, Elements Often Forgotten in Conservation Strategies. Plants 2021, 10, 1504. [Google Scholar] [CrossRef]
  23. Teixeira, T.M.; Nazareno, A.G. One Step Away from Extinction: A Population Genomic Analysis of A Narrow Endemic, Tropical Plant Species. Front. Plant Sci. 2021, 12, 1876. [Google Scholar] [CrossRef] [PubMed]
  24. Watson, J.E.; Iwamura, T.; Butt, N. Mapping vulnerability and conservation adaptation strategies under climate change. Nat. Clim. Change 2013, 3, 989. [Google Scholar] [CrossRef]
  25. Butt, N.; Possingham, H.P.; De Los Rios, C.; Maggini, R.; Fuller, R.A.; Maxwell, S.L.; Watson, J.E.M. Challenges in assessing the vulnerability of species to climate change to inform conservation actions. Biol. Conserv. 2016, 199, 10–15. [Google Scholar] [CrossRef] [Green Version]
  26. Feng, L.; Sun, J.; El-Kassaby, Y.A.; Yang, X.; Tian, X.; Wang, T. Predicting Potential Habitat of a Plant Species with Small Populations under Climate Change: Ostryarehderiana. Forests 2022, 13, 129. [Google Scholar] [CrossRef]
  27. Yang, J.; Cai, L.; Liu, D.; Chen, G.; Sun, W. China’s conservation program on plant species with extremely small populations (psesp): Progress and perspectives. Biol. Conserv. 2020, 244, 108535. [Google Scholar] [CrossRef]
  28. Sun, W.B. Special issue for plant species with extremely small populations. Plant Divers. 2016, 38, 207–258. [Google Scholar] [CrossRef] [Green Version]
  29. Elith, J.; Leathwick, J.R. Species Distribution Models: Ecological Explanation and Prediction across Space and Time. Annu. Rev. Ecol. Evol. Syst. 2009, 40, 677–697. [Google Scholar]
  30. Hirzel, A.H.; Le Lay, G.; Helfer, V.; Randin, C.; Guisan, A. Evaluating the ability of habitat suitability models to predict species presences. Ecol. Model. 2006, 199, 142–152. [Google Scholar] [CrossRef]
  31. Wan, J.; Wang, C.; Yu, F. Spatial conservation prioritization for dominant tree species of Chinese forest communities under climate change. Clim. Change 2017, 144, 303–316. [Google Scholar] [CrossRef]
  32. Lu, Y.; Xu, P.; Li, Q.; Wang, Y.; Wu, C. Planning priority conservation areas for biodiversity under climate change in topographically complex areas: A case study in sichuan province, china. PLoS ONE 2020, 15, e0243425. [Google Scholar]
  33. Cable, A.B.; O’Keefe, J.M.; Deppe, J.L.; Hohoff, T.C.; Taylor, S.J.; Davis, M.A. Habitat suitability and connectivity modeling reveal priority areas for indiana bat (Myotis sodalis) conservation in a complex habitat mosaic. Landsc. Ecol. 2021, 36, 119–137. [Google Scholar] [CrossRef]
  34. Qu, H.; Wang, C.J.; Zhang, Z.X. Planning priority conservation areas under climate change for six plant species with extremely small populations in China. Nat. Conserv. 2018, 25, 89–106. [Google Scholar] [CrossRef] [Green Version]
  35. Ma, B.; Sun, J. Predicting the distribution of Stipa purpurea across the Tibetan Plateau via the MaxEnt model. BMC Ecol. 2018, 18, 10. [Google Scholar] [CrossRef] [Green Version]
  36. Yan, H.; Feng, L.; Zhao, Y.; Feng, L.; Wu, D.; Zhu, C. Prediction of the spatial distribution of Alternanthera philoxeroides in China based on ArcGIS and MaxEnt. Glob. Ecol. Conserv. 2020, 21, e00856. [Google Scholar] [CrossRef]
  37. West, A.M.; Kumar, S.; Brown, C.S.; Stohlgren, T.J.; Bromberg, J. Field validation of an invasive species Maxent model. Ecol. Inform. 2016, 36, 126–134. [Google Scholar] [CrossRef] [Green Version]
  38. Elith, J.; Phillips, S.; Hastie, T.; Dudík, M.; Chee, Y.E.; Yates, C.J. A statistical explanation of MaxEnt for ecologists. Divers. Distrib. 2015, 17, 43–57. [Google Scholar] [CrossRef]
  39. Yi, Y.J.; Cheng, X.; Yang, Z.F.; Zhang, S.H. Maxent modeling for predicting the potential distribution of endangered medicinal plant (h. riparia lour) in Yunnan, China. Ecol. Eng. 2016, 92, 260–269. [Google Scholar]
  40. Wisz, M.S.; Hijmans, R.J.; Li, J.; Peterson, A.T.; Graham, C.H.; Guisan, A. NCEAS Predicting Species Distributions Working Group. Effects of sample size on the performance of species distribution models. Divers. Distrib. 2008, 14, 763–773. [Google Scholar] [CrossRef]
  41. Phillips, S.J.; Dudík, M. Modeling of species distributions with maxent: New extensions and a comprehensive evaluation. Ecography 2008, 31, 161–175. [Google Scholar] [CrossRef]
  42. Emamverdian, A.; Ding, Y.; Ranaei, F.; Ahmad, Z. Application of Bamboo Plants in Nine Aspects. Sci. World J. 2020, 2020, 7284203. [Google Scholar] [CrossRef]
  43. Sohel, M.S.I.; Alamgir, M.; Akhter, S.; Rahman, M. Carbon storage in a bamboo (Bambusa vulgaris) plantation in the degraded tropical forests: Implications for policy development. Land Use Policy 2015, 49, 142–151. [Google Scholar] [CrossRef]
  44. Nguyen, H.N.; Tran, V.T.; Nguyen, N.T. Ferrocalamus fibrillosus (poaceae: Bambusoideae), a new species from vietnam. Ann. Bot. Fenn. 2012, 49, 206–208. [Google Scholar] [CrossRef]
  45. Keng, P.J.; Xue, J.R. Ferrocalamus, Bambusoideae, Trib. Arundinarieae, Sasinae. J. Bamboo Res. 1982, 1, 1–5. [Google Scholar]
  46. Wen, T.H. New taxa of Bambusoideae in China (I). J. Bamboo Res. 1984, 1, 23–47. [Google Scholar]
  47. Volis, S.; Deng, T. Importance of a single population demographic census as a first step of threatened species conservation planning. Biodivers. Conserv. 2020, 29, 527–543. [Google Scholar] [CrossRef]
  48. Beckmann, M.; Václavík, T.; Manceur, A.M.; Šprtová, L.; Von Wehrden, H.; Welk, E.; Cord, A.F. glUV: A global UV-B radiation dataset for macroecological studies. Methods Ecol. Evol. 2014, 5, 372–383. [Google Scholar] [CrossRef]
  49. Fischer, G.; Nachtergaele, F.; Prieler, S.; Van Velthuizen, H.T.; Verelst, L.; Wiberg, D. Global Agro-Ecological Zones Assessment for Agriculture (GAEZ 2008); IIASA: Laxenburg, Austria; FAO: Rome, Italy, 2008. [Google Scholar]
  50. Xu, W.; Du, Q.; Yan, S.; Cao, Y.; Liu, X.; Guan, D.X.; Ma, L.Q. Geographical distribution of as-hyperaccumulator pteris vittata in China: Environmental factors and climate changes. Sci. Total Environ. 2022, 803, 149864. [Google Scholar]
  51. Phillips, S.J.; Anderson, R.P.; Schapire, R.E. Maximum entropy modeling of species geographic distribution. Ecol. Model. 2006, 190, 231–259. [Google Scholar] [CrossRef] [Green Version]
  52. Muscarella, R.; Galante, P.J.; Soley-Guardia, M.; Boria, R.A.; Kass, J.M.; Uriarte, M.; Anderson, R.P. ENM eval: An R package for conducting spatially independent evaluations and estimating optimal model complexity for Maxent ecological niche models. Methods Ecol. Evol. 2014, 5, 1198–1205. [Google Scholar] [CrossRef] [Green Version]
  53. Kass, J.M.; Muscarella, R.; Galante, P.J.; Bohl, C.L.; Pinilla-Buitrago, G.E.; Boria, R.A. ENMeval 2.0: Redesigned for customizable and reproducible modeling of species’ niches and distributions. Methods Ecol. Evol. 2021, 12, 1602–1608. [Google Scholar] [CrossRef]
  54. Merow, C.; Smith, M.J.; Silander, J.A., Jr. A practical guide to MaxEnt for modeling species’ distributions: What it does, and why inputs and settings matter. Ecography 2013, 36, 1058–1069. [Google Scholar]
  55. Brown, J.L.; Bennett, J.R.; French, C.M. Sdmtoolbox 2.0: The next generation python-based gis toolkit for landscape genetic, biogeographic and species distribution model analyses. PeerJ 2017, 5, e4095. [Google Scholar] [CrossRef] [Green Version]
  56. Brown, J.L. SDMtoolbox: A python-based GIS toolkit for landscape genetic, biogeographic and species distribution model analyses. Methods Ecol. Evol. 2014, 5, 694–700. [Google Scholar] [CrossRef]
  57. Lobo, J.M.; Jiménez-Valverde, A.; Real, R. AUC: A misleading measure of the performance of predictive distribution models. Glob. Ecol. Biogeogr. 2008, 17, 145–151. [Google Scholar] [CrossRef]
  58. Boyce, M.S.; Vernier, P.R.; Nielsen, S.E.; Schmiegelow, F.K.A. Evaluating resource selection functions. Ecol. Model. 2002, 157, 281–300. [Google Scholar] [CrossRef] [Green Version]
  59. Janitza, S.; Strobl, C.; Boulesteix, A.-L. An AUC-based permutation variable importance measure for random forests. BMC Bioinform. 2013, 14, 119. [Google Scholar] [CrossRef] [Green Version]
  60. Zhang, K.; Yao, L.; Meng, J.; Tao, J. Maxent modeling for predicting the potential geographical distribution of two peony species under climate change. Sci. Total Environ. 2018, 634, 1326–1334. [Google Scholar] [CrossRef]
  61. Liao, J.; Wang, H.; Xiao, S.; Guan, Z.; Zhang, H.; Dumont, H.J.; Han, B.-P. Modeling and Prediction of the Species’ Range of Neurobasis chinensis (Linnaeus, 1758) under Climate Change. Biology 2022, 11, 868. [Google Scholar] [CrossRef]
  62. Boisvert-Marsh, L.; De Blois, S. Unravelling potential northward migration pathways for tree species under climate change. J. Biogeogr. 2021, 48, 1088–1100. [Google Scholar] [CrossRef]
  63. Zhang, H.; Wang, X.P.; Zhang, Y.F.; Hu, R.; Chen, N. Responses of plant growth of different life forms to rainfall amount changes in an arid desert area. Chin. J. Ecol. 2015, 34, 1847–1853. [Google Scholar]
  64. Wang, J.J.; Cao, B.; Bai, C.K.; Zhang, L.L.; Che, L. Potential distribution prediction and suitability evaluation of Fritillaria cirrhosa D. Don based on Maxent modeling and GIS. Bull. Bot. Res. 2014, 34, 642–649. [Google Scholar]
  65. Feeley, K.J.; Malhi, Y.; Zelazowski, P.; Silman, M.R. The relative importance of deforestation, precipitation change, and temperature sensitivity in determining the future distributions and diversity of amazonian plant species. Glob. Change Biol. 2012, 18, 2636–2647. [Google Scholar] [CrossRef]
  66. Enquist, B.J.; Feng, X.; Boyle, B.; Maitner, B.; Newman, E.A.; Jørgensen, P.M.; Roehrdanz, P.R.; Thiers, B.M.; Burger, J.R.; Corlett, R.T.; et al. The commonness of rarity: Global and future distribution of rarity across land plants. Sci. Adv. 2019, 5, eaaz0414. [Google Scholar] [PubMed]
  67. Tang, C.Q.; Matsui, T.; Ohashi, H.; Dong, Y.F.; Momohara, A.; Herrando, M.S.; Qian, S.H.; Yang, Y.C.; Ohsawa, M.; Luu, H.T.; et al. Identifying long-term stable refugia for relict plant species in East Asia. Nat. Commun. 2018, 9, 4488. [Google Scholar] [CrossRef] [Green Version]
  68. Breiner, F.T.; Nobis, M.P.; Bergamini, A.; Guisan, A. Optimizing ensembles of small models forpredicting the distribution of species with few occurrences. Methods Ecol. Evol. 2018, 9, 802–808. [Google Scholar]
  69. Hao, T.; Elith, J.; Lahoz-Monfort, J.J.; Guillera-Arroita, G. Testing whether ensemble modelling is advantageous for maximising predictive performance of species distribution models. Ecography 2020, 43, 549–558. [Google Scholar] [CrossRef] [Green Version]
  70. Hastings, R.; Cummins, V.; Holloway, P. Assessing the Impact of Physical and Anthropogenic Environmental Factors in Determining the Habitat Suitability of Seagrass Ecosystems. Sustainability 2020, 12, 8302. [Google Scholar] [CrossRef]
  71. Engler, R.; Guisan, A. MigClim: Predicting plant distribution and dispersal in a changing climate. Divers. Distrib. 2009, 15, 590–601. [Google Scholar]
  72. Engler, R.; Hordijk, W.; Guisan, A. The MIGCLIM R package—Seamless integration of dispersal constraints into projections of species distribution models. Ecography 2012, 35, 872–878. [Google Scholar] [CrossRef]
Figure 1. Current distribution of the potential suitable areas for Ferrocalamus strictus (a). The current distribution and priority conservation areas of Ferrocalamus strictus (b). A picture of a whole F. strictus specimen (c). Potential distribution area of Ferrocalamus strictus in the mid-Holocene (approximately 6 kya) (d) and Last Glacial Maximum (approximately 21 kya) (e) periods.
Forests 13 02108 g001
Figure 2. Remnants of F. strictus and tea forests (a). The remaining F. strictus forest, sand forest, and banana forest (b).
Forests 13 02108 g002
Figure 3. Prediction of the ROC in the MaxEnt model. The model accuracy reached 0.997 (a). The jackknife of the AUC for F. strictus (b).
Forests 13 02108 g003
Figure 4. CBI = 0.975. CBI is used as a reliable performance measure.
Forests 13 02108 g004
Figure 5. Response curves of the major environmental factors affecting F. strictus (a,b).
Forests 13 02108 g005
Figure 6. Distribution of potential suitable change for F. strictus under future climate change. The change of the suitable area compared to the present.
Forests 13 02108 g006
Figure 7. Spatial variation patterns of the potential geographical distribution for F. strictus in different periods. Pca is the priority conservation area for F. strictus.
Forests 13 02108 g007
Table 1. The environmental factors used in the model and their contributions in predicting the current and future distributions of Ferrocalamus strictus in China.
VariablesDescriptionPercent Contribution (%)
CurrentSSP c 1-2.6SSP5-8.5
1 d23123
bio1 (°C) aAnnual mean temperature0.10.80.10.10.10.10.1
bio2 (°C) bMean diurnal range (mean of monthly (max temp–min temp)-------
bio3Isothermality (bio2/bio7) (×100)31.83427.326.21722.524.8
bio4Temperature seasonality (standard deviation × 100)1.91.84.13.85.73.34.1
bio5 (°C)Maximum temperature of warmest month-------
bio6 (°C)Minimum temperature of coldest month-------
bio7 (°C)Temperature annual range (bio5-bio6) × 10-------
bio8 (°C)Mean temperature of wettest quarter-------
bio9 (°C)Mean temperature of driest quarter × 10-------
bio10 (°C)Mean temperature of warmest quarter-------
bio11 (°C)Mean temperature of coldest quarter-------
bio12 (mm)Annual precipitation-------
bio13 (mm)Precipitation of wettest month-------
bio14 (mm)Precipitation of driest month10.23.53.56.62.54.94.1
bio15 (mm)Precipitation seasonality (coefficient of variation)-------
bio16 (mm)Precipitation of wettest quarter-------
bio17 (mm)Precipitation of driest quarter-------
bio18 (mm)Precipitation of warmest quarter31.53435.536.345.838.337
bio19 (mm)Precipitation of coldest quarter-------
aspect(Uphill height/horizontal distance) × 100%3.22.53.73.63.53.83.4
slope(height difference/distance) × 100%10.512.413.612.311.213.712.9
elev (m)Elevation0.71.62.72.563.12.5
T-phSoil pH1.12.31.81.622.12.2
T-ocOrganic carbon (g/kg × 100%)8.37.46.35.85.56.77.1
Uvb3 (J/m2/d)Mean UV-B radiation of highest month0.62.11.31.20.81.61.6
a Bioclimatic variable from the WorldClim database (worldclim.org). b The variables in bold were used in the maximum entropy model. The current distribution based on the historical bioclimatic data was averaged for 1970–2000. c SSP 1-2.6 represents the climate change scenario of +2.6 W m−2 radiative forcing under an SSP1 assumption, and SSP 5–8.5 represents the climate change scenario of +8.5 W m−2 radiative forcing under an SSP5 assumption. d 1, 2, and 3 represent the periods 2021–2040, 2041–2060, and 2061–2080, respectively.
Table 2. The distribution area of F. strictus under climate change.
AreaLast Glacial MaximumMid-HoloceneCurrentSSP 1-2.6SSP 5-5.8
2021–20402041–20602061–20802021–20402041–20602061–2080
Barely suitable a−28% b+63%3.5229 (km2)+34%+28%+23%+40%+43%+48%
Moderately suitable −51%+32%1.8907 (km2)+17%+21%+24%+35%+16%+25%
Highly suitable−41%+18%8586 (km2) c−12.8%−8.19%+11.6%+14.3%−15%−16.4%
Very highly suitable +377%+42%1162 (km2)−34%−46%−23%−26%−44%−58%
Total suitable−37%+47%6.3883 (km2)+21.6%+19.9%+21.1%+34%+26%+30.9%
a The values of the MaxEnt logistic outputs were divided into five classes, i.e., unsuitable (0–0.2), barely suitable (0.2–0.4), moderately suitable (0.4–0.6), highly suitable (>0.6), and very highly suitable (0.8–1). b −/+ represents the percentage of the potential distribution area that decreased or increased in each period compared with the current potential distribution. c represents the current potential distribution area for F. strictus.
Publisher’s Note: MDPI stays neutral with regard to jurisdictional claims in published maps and institutional affiliations.

