
Model-Based Identification of Larix sibirica Ledeb. Damage Caused by Erannis jacobsoni Djak. Based on UAV Multispectral Features and Machine Learning
 , and
, and
Abstract
:1. Introduction
2. Materials and Methods
2.1. Study Sites
2.2. Data Acquisition
2.2.1. UAV Multispectral Remote Sensing Data
2.2.2. Data on the Extent of Damage to Forest Trees
2.3. Research Methodology
2.3.1. UAV Multispectral Image Feature Selection
2.3.2. UAV Multispectral Image Sensitive Feature Extraction
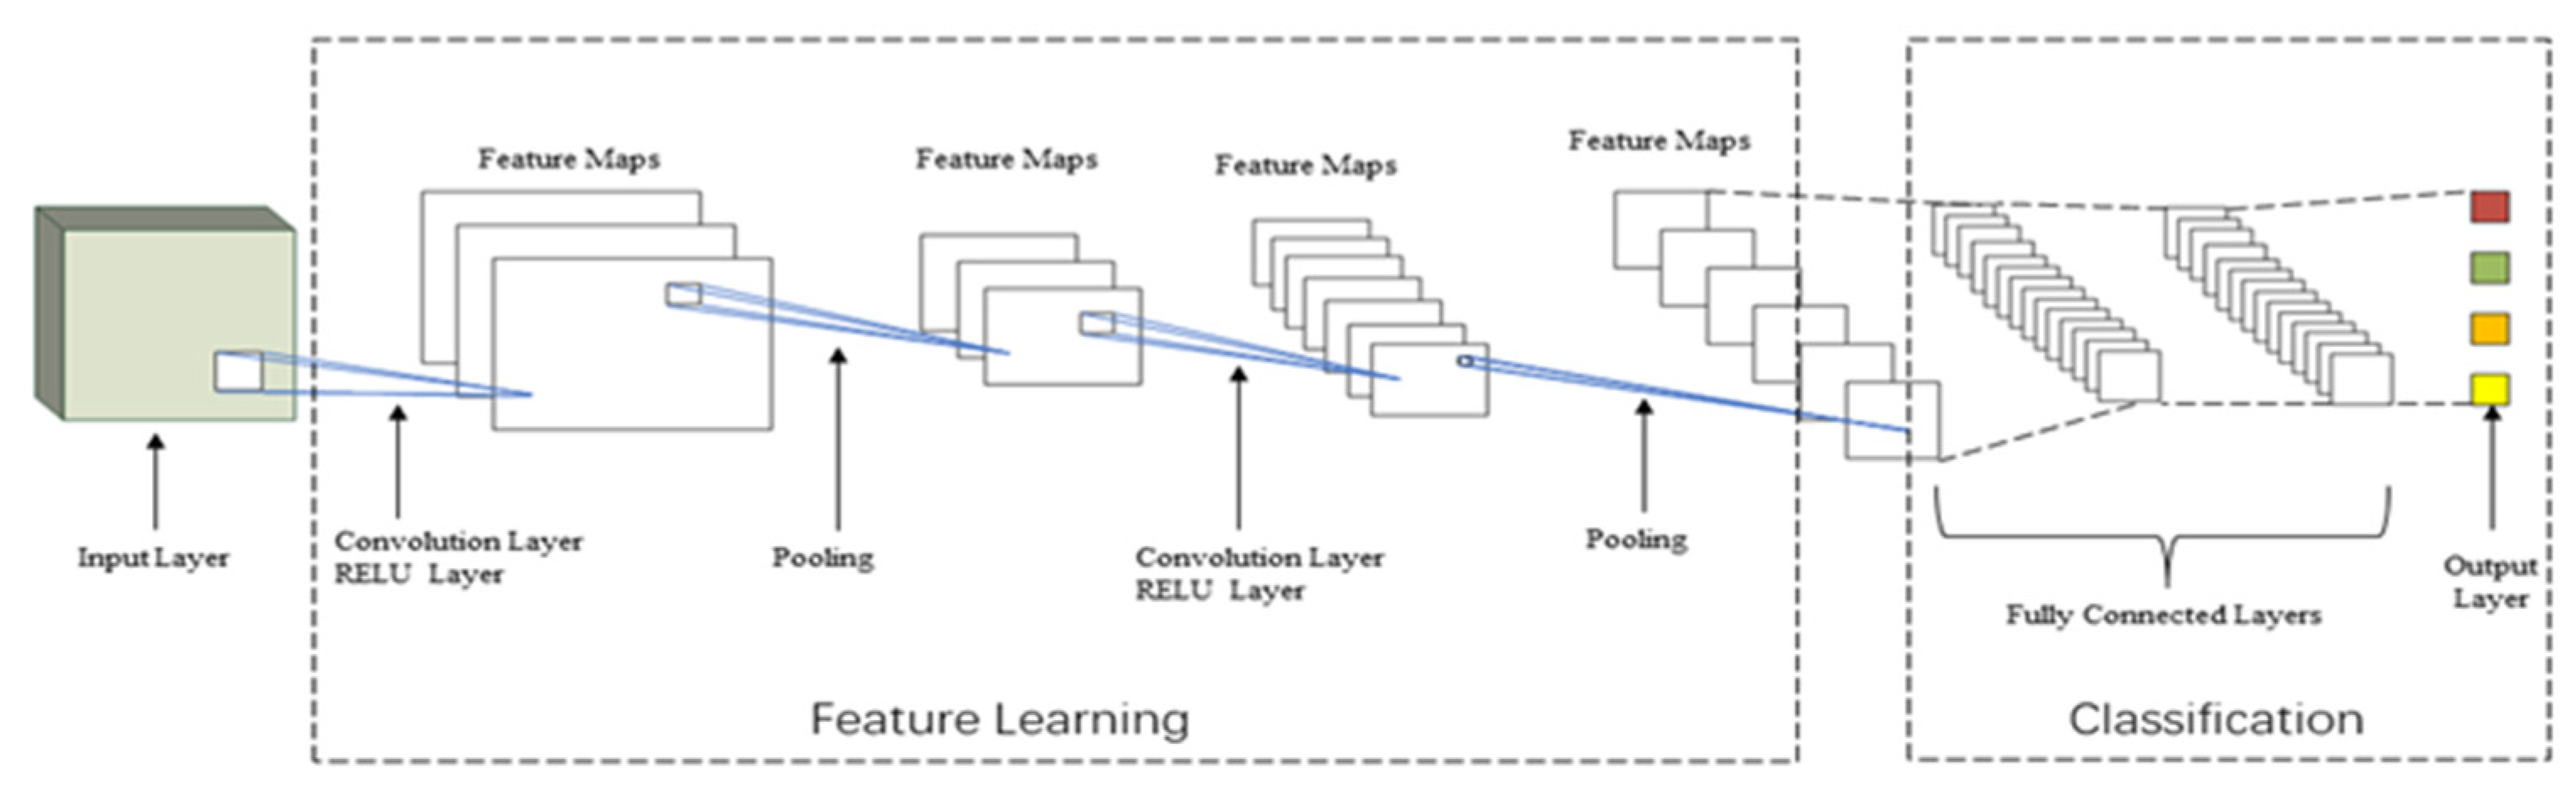
2.3.3. Forest Tree Damage Recognition Model
2.3.4. Model Evaluation Metrics
3. Results
3.1. Sensitivity Analysis
3.1.1. Sensitivity of Spectral Reflectance to the Degree of Damage of Forest Trees
3.1.2. ANOVA of Spectral Characteristics on the Degree of Damage to Forest Trees
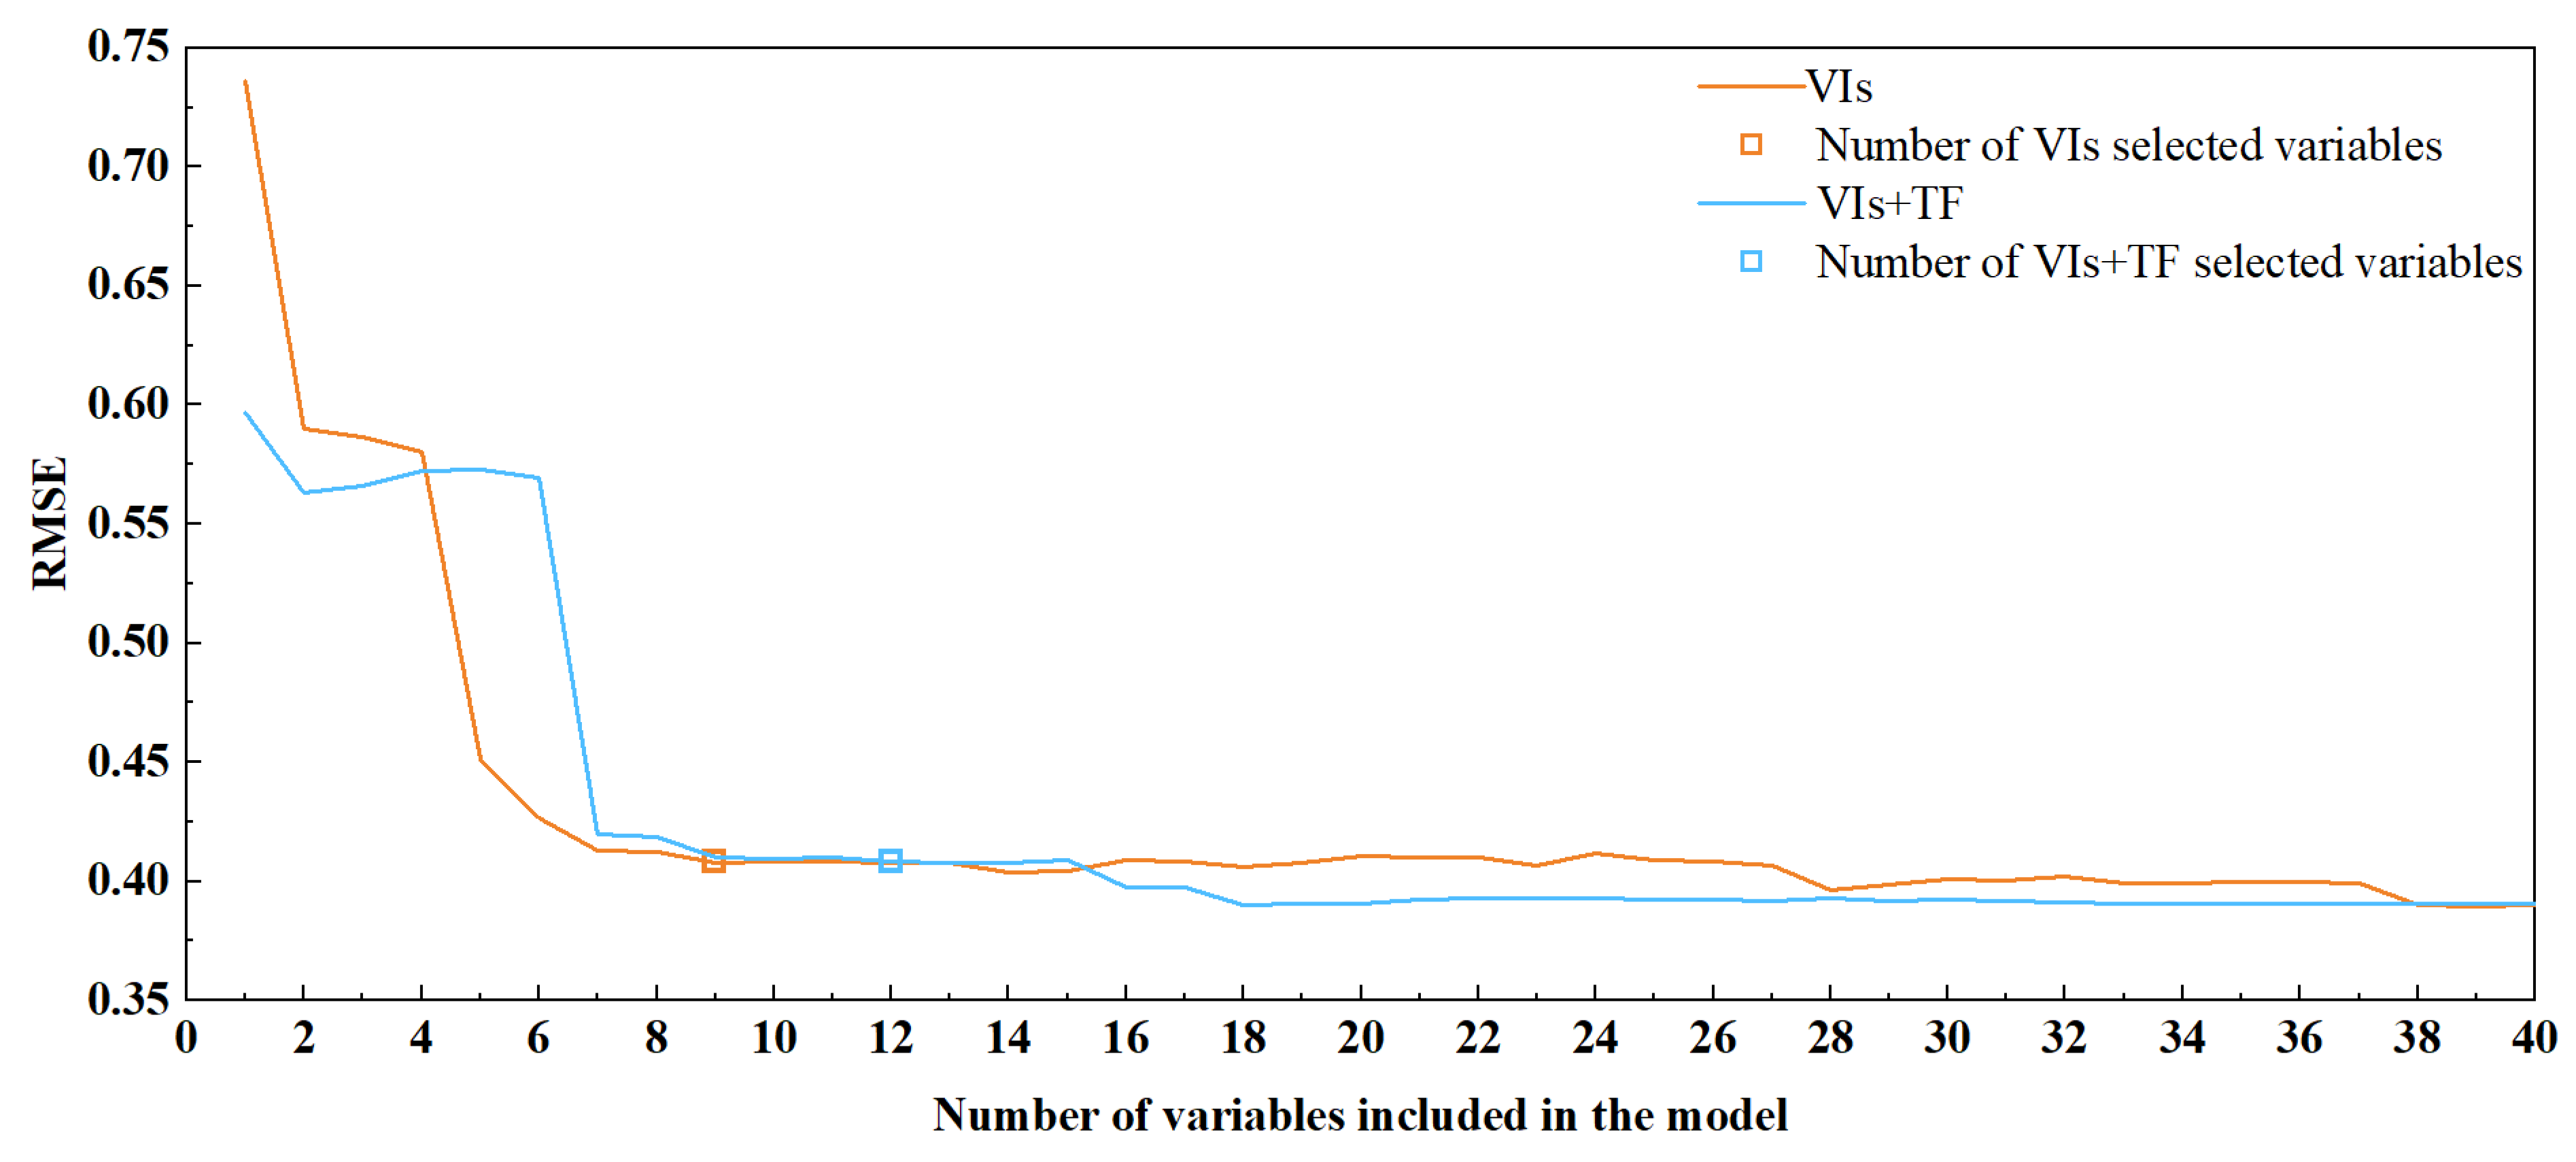
3.2. Sensitive Feature Extraction for SPA
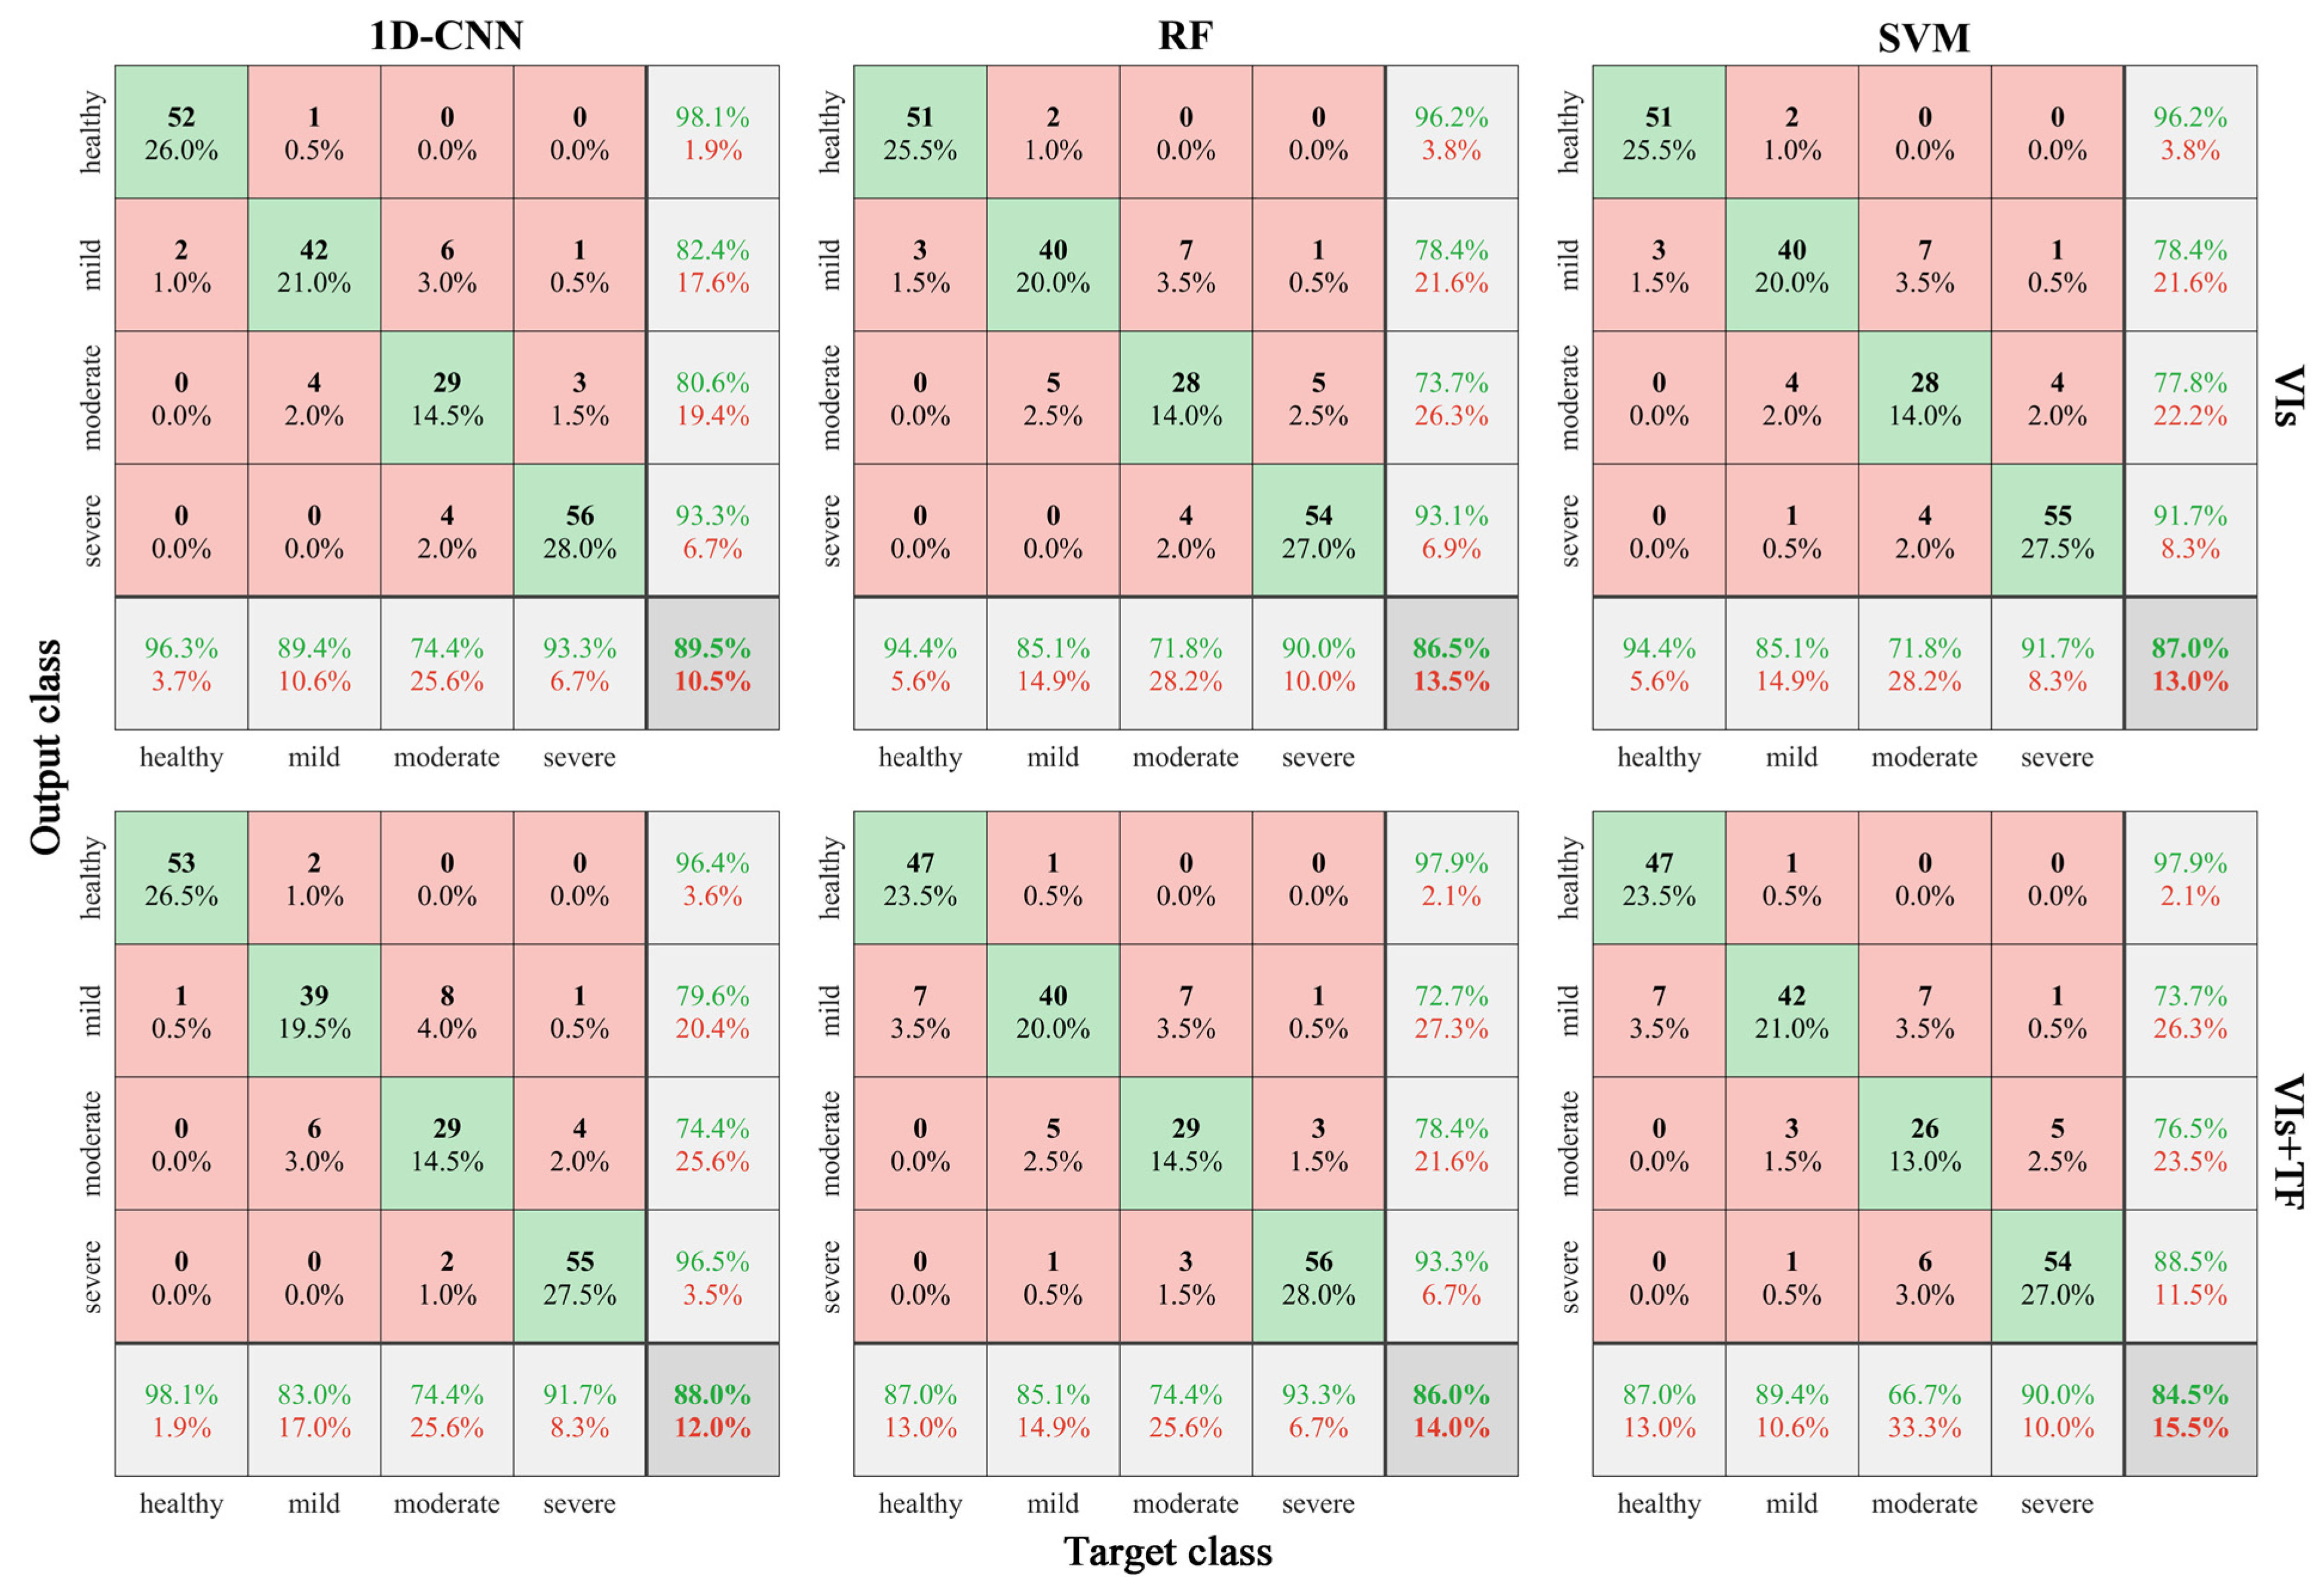
3.3. Construction of a Classification Model for the Degree of Damage of EJD in Forest Trees
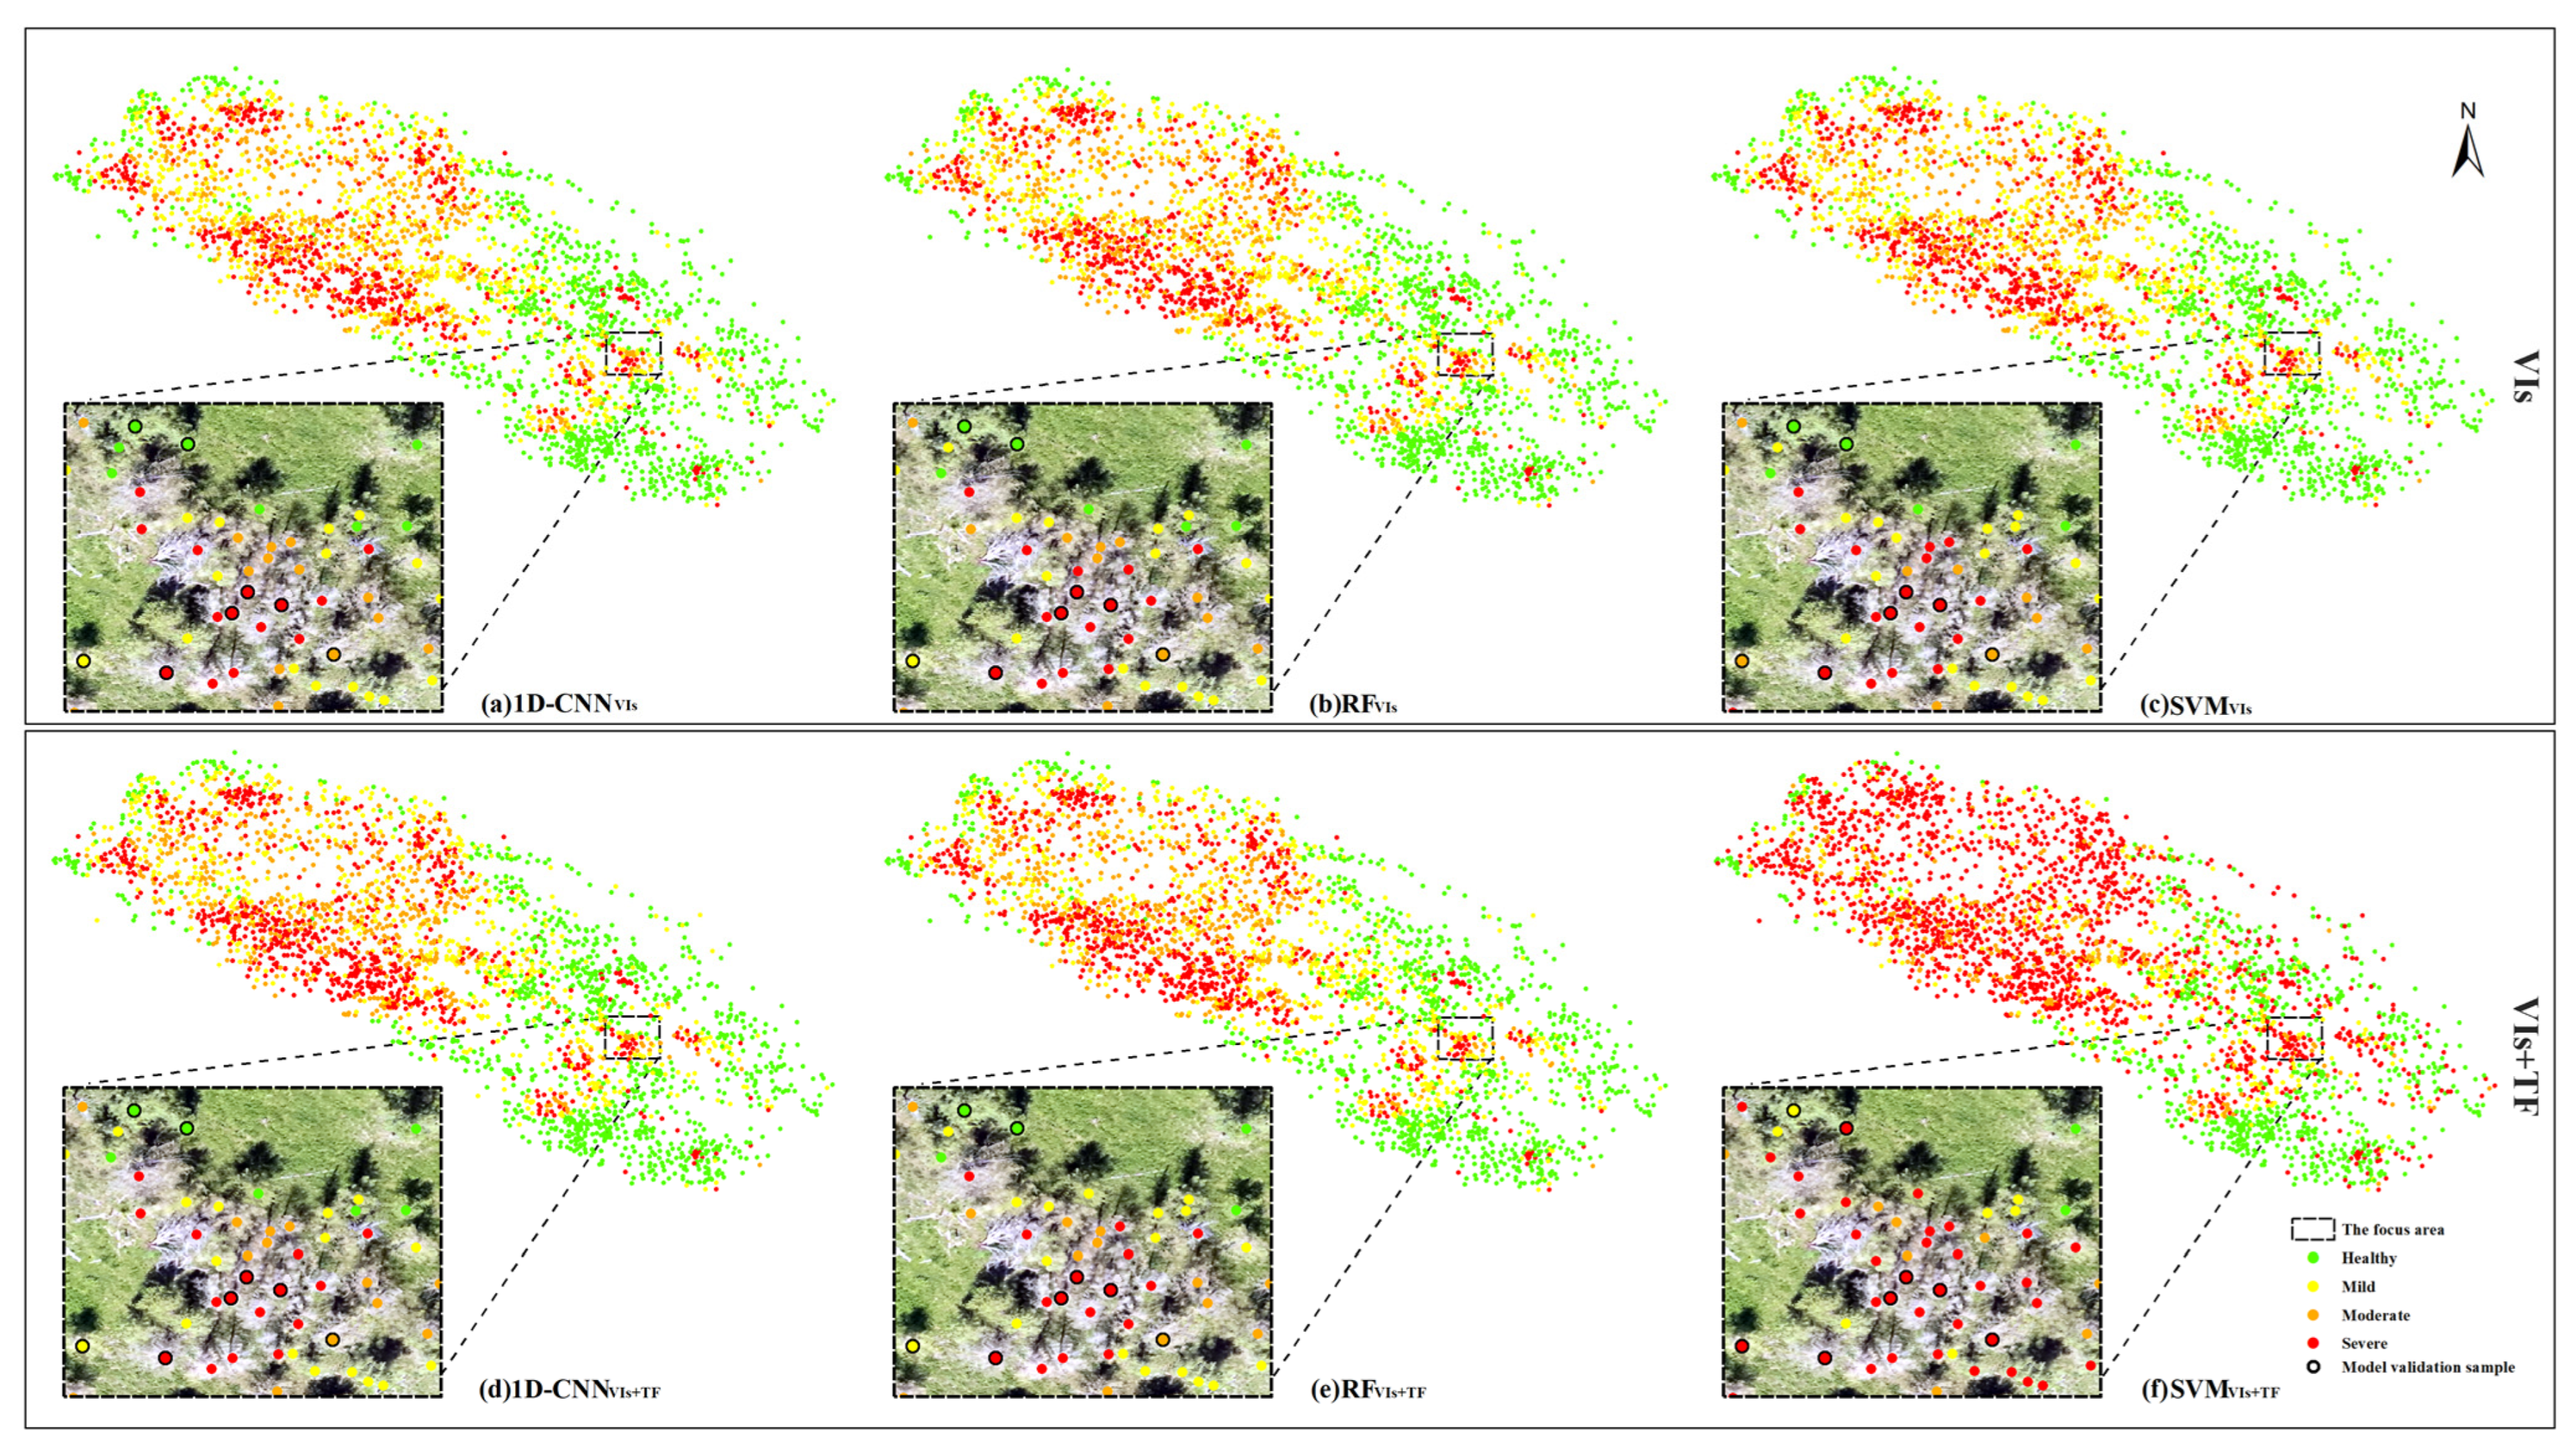
3.4. Identification of the Severity of EJD Stands
4. Discussion
5. Conclusions
- The spectral reflectance of forest trees with different degrees of damage had obvious differences, especially in the red band, red-edge band, and near-infrared band. With increasing damage, the spectral reflectance of the green, red-edge, and near-infrared bands decreased, while the spectral reflectance of the red band continued to increase.
- Sensitive spectral indices and texture features were extracted by ANOVA with SPA for different damage levels, and, finally, 9 sensitive VIs and 12 VIs + TF combinations were obtained. The sensitive characteristics extracted by SPA were basically greater than the F test values, indicating that there was a difference between the sensitive VIs and VIs + TF extracted using ANOVA with SPA and the degree of stand damage, showing significant sensitivity.
- The overall accuracy, Kappa, Rmacro, and F1macro coefficients of all six classification models exceeded 0.8, indicating that all models could effectively identify the degree of forest tree damage. CNNVIs had the best accuracy (OA: 0.8950, Kappa: 0.8666, Rmacro: 0.8859, and F1macro: 0.8839), followed by CNNVIs+TF (OA: 0.8800, Kappa: 0.8485, Rmacro: 0.8670, and F1macro: 0.8672), while SVMVIs+TF had the worst accuracy (OA: 0.8450, Kappa: 0.8082, Rmacro: 0.8415, and F1macro: 0.8335).
Author Contributions
Funding
Data Availability Statement
Conflicts of Interest
Appendix A


| Dependent Variable | Mean Difference (I–J) | Standard Error | Statistical Significance | 99.9999% Confidence Intervals | |||
|---|---|---|---|---|---|---|---|
| I | J | Lower Limit | Upper Limit | ||||
| WDRVI | Health | Mild | 0.3482 * | 0.0068 | 0.0000 | 0.3125 | 0.3840 |
| Moderate | 0.4627 * | 0.0068 | 0.0000 | 0.4270 | 0.4985 | ||
| Severe | 0.5571 * | 0.0068 | 0.0000 | 0.5214 | 0.5929 | ||
| Mild | Health | −0.3482 * | 0.0068 | 0.0000 | −0.3840 | −0.3125 | |
| Moderate | 0.1145 * | 0.0068 | 0.0000 | 0.0788 | 0.1502 | ||
| Severe | 0.2089 * | 0.0068 | 0.0000 | 0.1732 | 0.2446 | ||
| Moderate | Health | −0.4627 * | 0.0068 | 0.0000 | −0.4985 | −0.4270 | |
| Mild | −0.1145 * | 0.0068 | 0.0000 | −0.1502 | −0.0788 | ||
| Severe | 0.0944 * | 0.0068 | 0.0000 | 0.0586 | 0.1301 | ||
| Severe | Health | −0.5571 * | 0.0068 | 0.0000 | −0.5929 | −0.5214 | |
| Mild | −0.2089 * | 0.0068 | 0.0000 | −0.2446 | −0.1732 | ||
| Moderate | −0.0944 * | 0.0068 | 0.0000 | −0.1301 | −0.0586 | ||
| EVIreg | Health | Mild | −0.0003 | 0.0035 | 0.9996 | −0.0188 | 0.0181 |
| Moderate | 0.0030 | 0.0035 | 0.8278 | −0.0155 | 0.0215 | ||
| Severe | −0.0041 | 0.0035 | 0.6438 | −0.0226 | 0.0144 | ||
| Mild | Health | −0.0033 | 0.0035 | 0.7752 | −0.0218 | 0.0151 | |
| Moderate | −0.0030 | 0.0035 | 0.8278 | −0.0215 | 0.0155 | ||
| Severe | −0.0071 | 0.0035 | 0.1782 | −0.0256 | 0.0114 | ||
| Moderate | Health | 0.0038 | 0.0035 | 0.7055 | −0.0147 | 0.0222 | |
| Mild | 0.0041 | 0.0035 | 0.6438 | −0.0144 | 0.0226 | ||
| Severe | 0.0071 | 0.0035 | 0.1782 | −0.0114 | 0.0256 | ||
| Severe | Health | 0.0003 | 0.0035 | 0.9996 | −0.0181 | 0.0188 | |
| Mild | −0.0011 | 0.0031 | 0.9856 | −0.0177 | 0.0155 | ||
| Moderate | −0.0091 | 0.0031 | 0.0211 | −0.0257 | 0.0075 | ||
| EVI | Health | Mild | −0.0003 | 0.0031 | 0.9998 | −0.0169 | 0.0163 |
| Moderate | −0.0011 | 0.0031 | 0.9856 | −0.0177 | 0.0155 | ||
| Severe | −0.0091 | 0.0031 | 0.0211 | −0.0257 | 0.0075 | ||
| Mild | Health | 0.0003 | 0.0031 | 0.9998 | −0.0163 | 0.0169 | |
| Moderate | −0.0008 | 0.0031 | 0.9937 | −0.0174 | 0.0158 | ||
| Severe | −0.0088 | 0.0031 | 0.0271 | −0.0254 | 0.0078 | ||
| Moderate | Health | 0.0011 | 0.0031 | 0.9856 | −0.0155 | 0.0177 | |
| Mild | 0.0008 | 0.0031 | 0.9937 | −0.0158 | 0.0174 | ||
| Severe | −0.0080 | 0.0031 | 0.0555 | −0.0246 | 0.0086 | ||
| Severe | Health | 0.0091 | 0.0031 | 0.0211 | −0.0075 | 0.0257 | |
| Mild | 0.0088 | 0.0031 | 0.0271 | −0.0078 | 0.0254 | ||
| Moderate | 0.0080 | 0.0031 | 0.0555 | −0.0086 | 0.0246 | ||
| …… | |||||||
| Mean3 × 3 | Health | Mild | −0.1230 * | 0.0145 | 0.0000 | −0.1996 | −0.0464 |
| Moderate | −0.1816 * | 0.0145 | 0.0000 | −0.2581 | −0.1050 | ||
| Severe | −0.1701 * | 0.0145 | 0.0000 | −0.2467 | −0.0936 | ||
| Mild | Health | 0.1230 * | 0.0145 | 0.0000 | 0.0464 | 0.1996 | |
| Moderate | −0.0585 | 0.0145 | 0.0003 | −0.1351 | 0.0180 | ||
| Severe | −0.0471 | 0.0145 | 0.0066 | −0.1237 | 0.0295 | ||
| Moderate | Health | 0.1816 * | 0.0145 | 0.0000 | 0.1050 | 0.2581 | |
| Mild | 0.0585 | 0.0145 | 0.0003 | −0.0180 | 0.1351 | ||
| Severe | 0.0114 | 0.0145 | 0.8598 | −0.0651 | 0.0880 | ||
| Severe | Health | 0.1701 * | 0.0145 | 0.0000 | 0.0936 | 0.2467 | |
| Mild | 0.0471 | 0.0145 | 0.0066 | −0.0295 | 0.1237 | ||
| Moderate | −0.0114 | 0.0145 | 0.8598 | −0.0880 | 0.0651 | ||
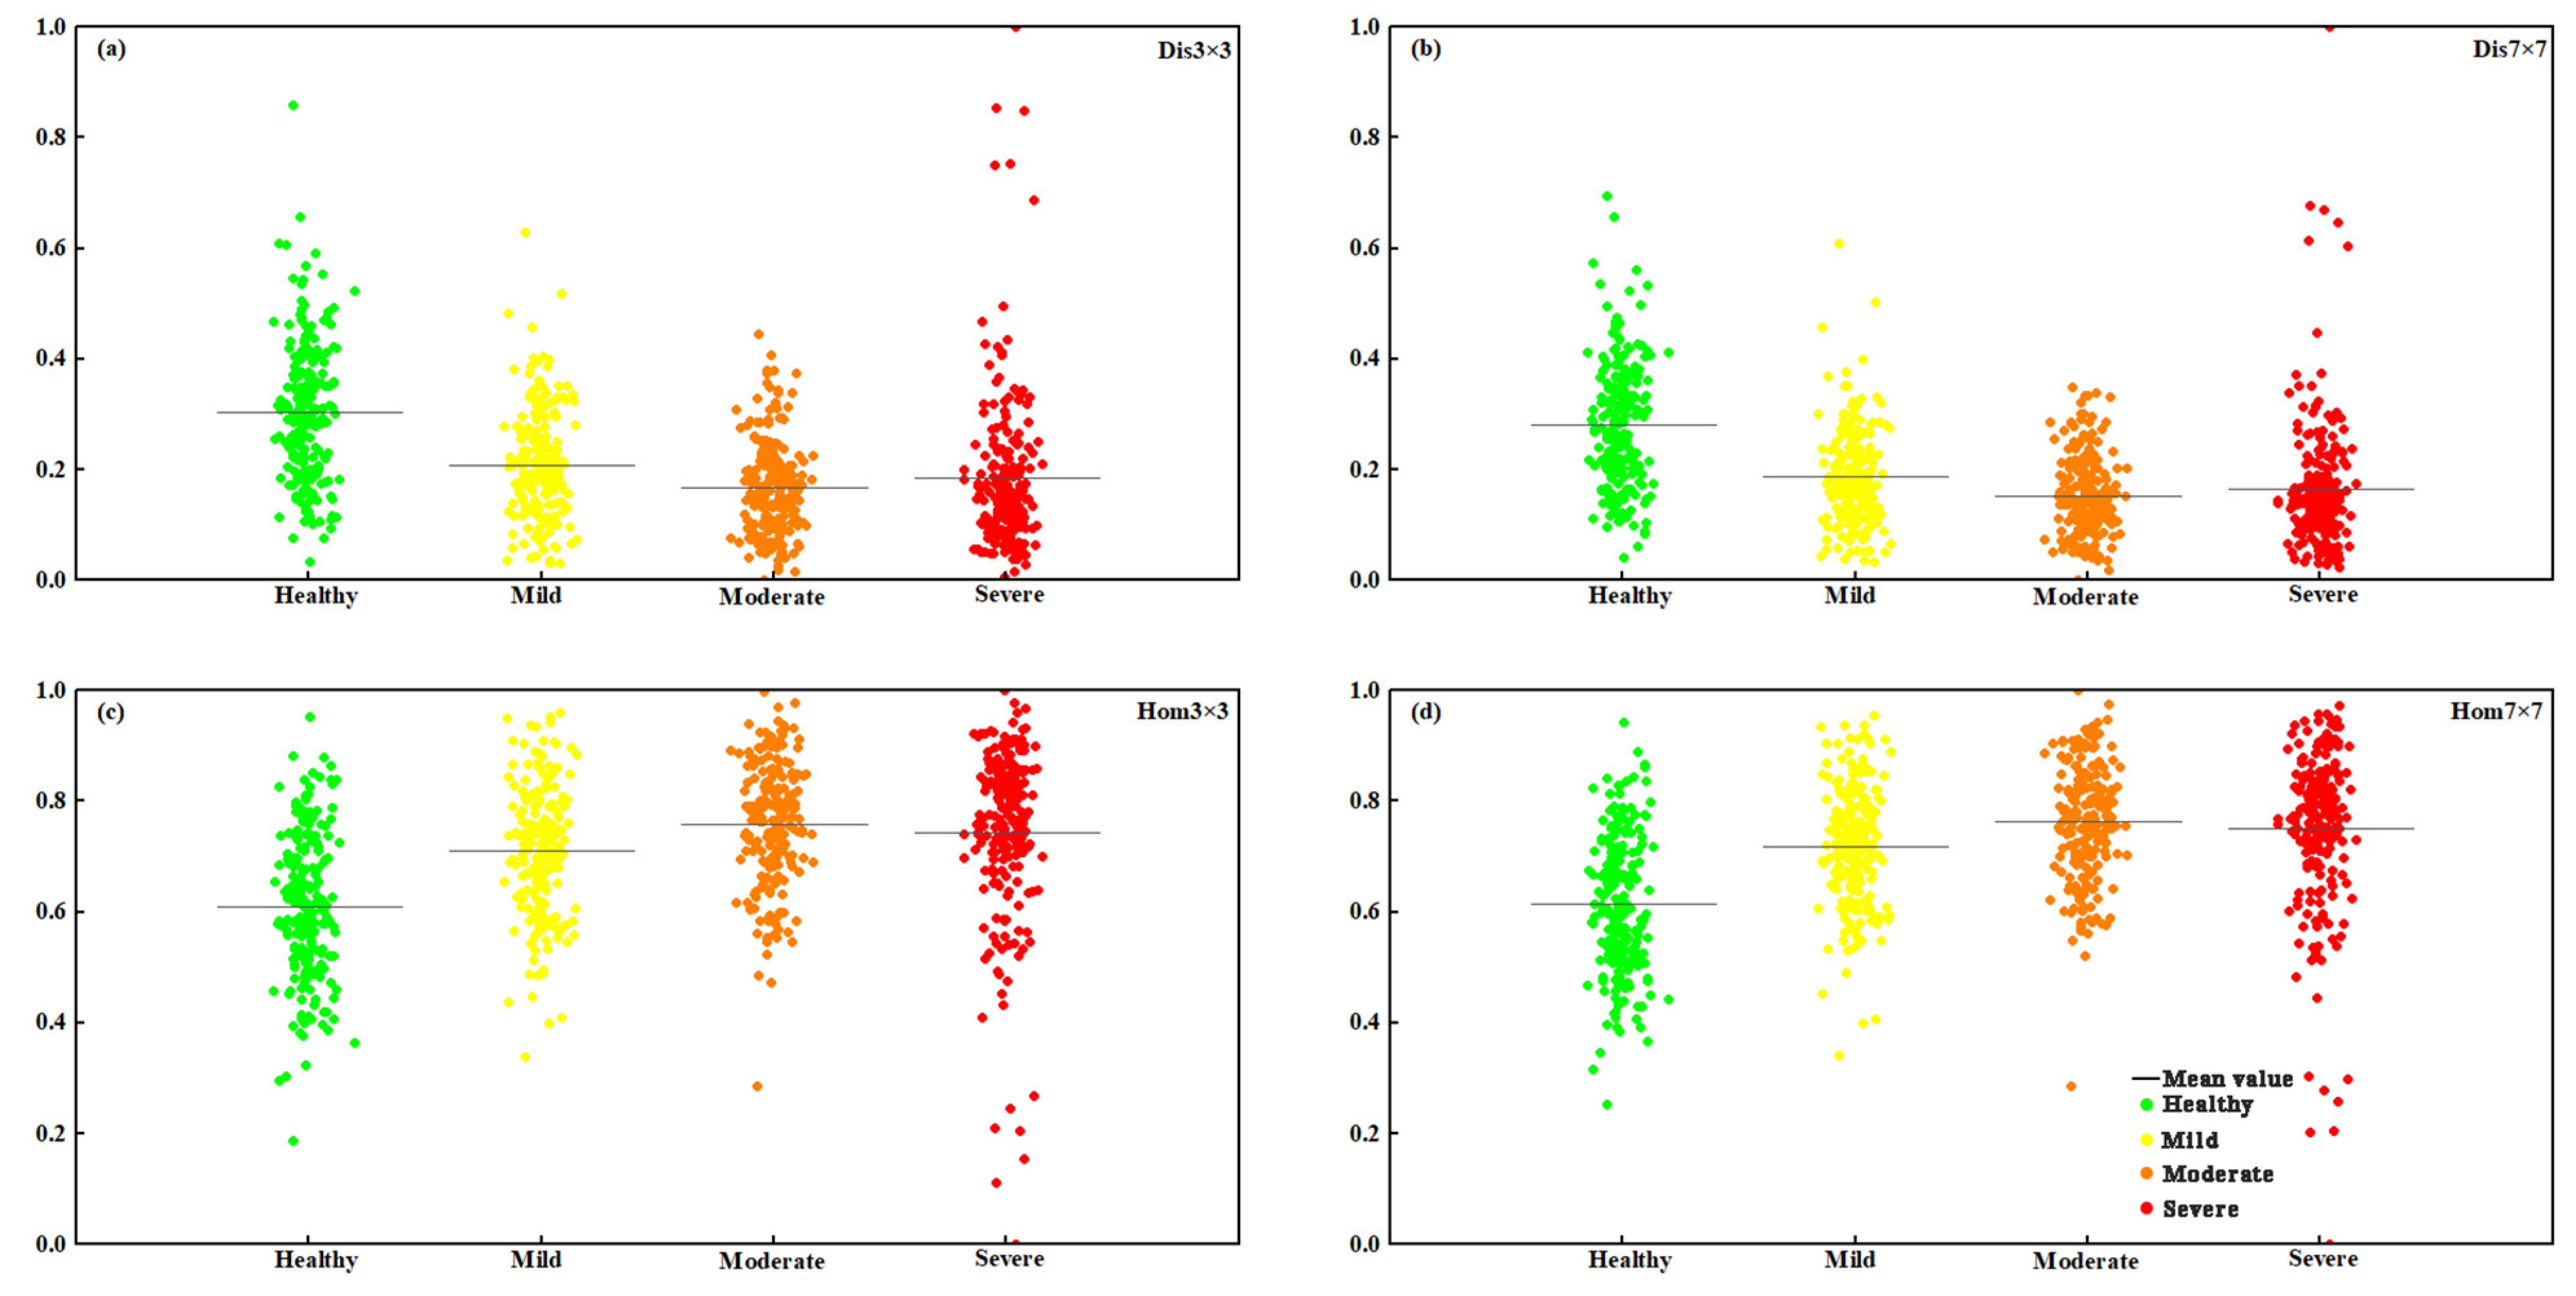
| Hom3 × 3 | Health | Mild | −0.2696 * | 0.0107 | 0.0000 | −0.3260 | −0.2132 |
| Moderate | −0.3193 * | 0.0107 | 0.0000 | −0.3757 | −0.2629 | ||
| Severe | −0.4984 * | 0.0107 | 0.0000 | −0.5548 | −0.4421 | ||
| Mild | Health | 0.2696 * | 0.0107 | 0.0000 | 0.2132 | 0.3260 | |
| Moderate | −0.0497 | 0.0107 | 0.0000 | −0.1061 | 0.0067 | ||
| Severe | −0.2288 * | 0.0107 | 0.0000 | −0.2852 | −0.1724 | ||
| Moderate | Health | 0.3193 * | 0.0107 | 0.0000 | 0.2629 | 0.3757 | |
| Mild | 0.0497 | 0.0107 | 0.0000 | −0.0067 | 0.1061 | ||
| Severe | −0.1791 * | 0.0107 | 0.0000 | −0.2355 | −0.1228 | ||
| Severe | Health | 0.4984 * | 0.0107 | 0.0000 | 0.4421 | 0.5548 | |
| Mild | 0.2288 * | 0.0107 | 0.0000 | 0.1724 | 0.2852 | ||
| Moderate | 0.1791 * | 0.0107 | 0.0000 | 0.1228 | 0.2355 | ||
| Dis3 × 3 | Health | Mild | 0.1216 * | 0.0131 | 0.0000 | 0.0524 | 0.1908 |
| Moderate | 0.1743 * | 0.0131 | 0.0000 | 0.1052 | 0.2435 | ||
| Severe | 0.1592 * | 0.0131 | 0.0000 | 0.0901 | 0.2284 | ||
| Mild | Health | −0.1216 * | 0.0131 | 0.0000 | −0.1908 | −0.0524 | |
| Moderate | 0.0527 | 0.0131 | 0.0004 | −0.0164 | 0.1219 | ||
| Severe | 0.0376 | 0.0131 | 0.0218 | −0.0315 | 0.1068 | ||
| Moderate | Health | −0.1743 * | 0.0131 | 0.0000 | −0.2435 | −0.1052 | |
| Mild | −0.0527 | 0.0131 | 0.0004 | −0.1219 | 0.0164 | ||
| Severe | −0.0151 | 0.0131 | 0.6570 | −0.0843 | 0.0541 | ||
| Severe | Health | −0.1592 * | 0.0131 | 0.0000 | −0.2284 | −0.0901 | |
| Mild | −0.0376 | 0.0131 | 0.0218 | −0.1068 | 0.0315 | ||
| Moderate | 0.0151 | 0.0131 | 0.6570 | −0.0541 | 0.0843 | ||

References
- Jugnee, P.; Dorjsuren, A.; Enkhnasan, D. Forest Insects of Mongolia; Best Color International Printing Company: Ulaanbaatar, Mongolia, 2020; p. 306. [Google Scholar]
- van Lierop, P.; Lindquist, E.; Sathyapala, S.; Franceschini, G. Global forest area disturbance from fire, insect pests, diseases and severe weather events. For. Ecol. Manag. 2015, 352, 78–88. [Google Scholar] [CrossRef] [Green Version]
- Foster, A.C.; Shuman, J.K.; Shugart, H.H.; Dwire, K.A.; Fornwalt, P.J.; Sibold, J.; Negron, J. Validation and application of a forest gap model to the southern Rocky Mountains. Ecol. Model. 2017, 351, 109–128. [Google Scholar] [CrossRef]
- Dulamsuren, C. Organic carbon stock losses by disturbance: Comparing broadleaved pioneer and late-successional conifer forests in Mongolia’s boreal forest. For. Ecol. Manag. 2021, 499, 119636. [Google Scholar] [CrossRef]
- Haynes, K.J.; Allstadt, A.J.; Klimetzek, D. Forest defoliator outbreaks under climate change: Effects on the frequency and severity of outbreaks of five pine insect pests. Glob. Chang. Biol. 2014, 20, 2004–2018. [Google Scholar] [CrossRef]
- Hall, R.J.; Castilla, G.; White, J.C.; Cooke, B.J.; Skakun, R.S. Remote sensing of forest pest damage: A review and lessons learned from a Canadian perspective. Can. Entomol. 2016, 148, 296–356. [Google Scholar] [CrossRef]
- Tungalag, M.; Altanzagas, B.; Gerelbaatar, S.; Dorjsuren, C. Tree-Level Above-Ground Biomass Equations for Pinus sylvestris L. in Mongolia. Mong. J. Biol. Sci. 2020, 18, 13–21. [Google Scholar] [CrossRef]
- Environmental Database (Байгаль Орчны Мэдээллийн Сан). Copyright Environmental Information Center. Available online: https://eic.mn/forestresource/ (accessed on 15 July 2022).
- Xi, G.; Huang, X.; Xie, Y.; Gang, B.; Bao, Y.; Dashzebeg, G.; Nanzad, T.; Dorjsuren, A.; Enkhnasan, D.; Ariunaa, M. Detection of Larch Forest Stress from Jas’s Larch Inchworm (Erannis jacobsoni Djak) Attack Using Hyperspectral Remote Sensing. Remote Sens. 2021, 14, 124. [Google Scholar] [CrossRef]
- Tumenjargal, B.; Ishiguri, F.; Aiso, H.; Takahashi, Y.; Nezu, I.; Takashima, Y.; Baasan, B.; Chultem, G.; Ohshima, J.; Yokota, S. Physical and mechanical properties of wood and their geographic variations in Larix sibirica trees naturally grown in Mongolia. Sci. Rep. 2020, 10, 12936. [Google Scholar] [CrossRef]
- Zhang, J.; Huang, Y.; Pu, R.; Gonzalez-Moreno, P.; Yuan, L.; Wu, K.; Huang, W. Monitoring plant diseases and pests through remote sensing technology: A review. Comput. Electron. Agric. 2019, 165, 104943. [Google Scholar] [CrossRef]
- Zhang, J.; Huang, Y.; Yuan, L.; Yang, G.; Chen, L.; Zhao, C. Using satellite multispectral imagery for damage mapping of armyworm (Spodoptera frugiperda) in maize at a regional scale. Pest Manag. Sci. 2016, 72, 335–348. [Google Scholar] [CrossRef]
- Calderón, R.; Navas-Cortés, J.A.; Lucena, C.; Zarco-Tejada, P.J. High-resolution airborne hyperspectral and thermal imagery for early detection of Verticillium wilt of olive using fluorescence, temperature and narrow-band spectral indices. Remote Sens. Environ. 2013, 139, 231–245. [Google Scholar] [CrossRef]
- Cheng, T.; Rivard, B.; Sánchez-Azofeifa, G.A.; Feng, J.; Calvo-Polanco, M. Continuous wavelet analysis for the detection of green attack damage due to mountain pine beetle infestation. Remote Sens. Environ. 2010, 114, 899–910. [Google Scholar] [CrossRef]
- Zhang, J.; Pu, R.; Huang, W.; Lin, Y.; Luo, J.; Wang, J. Using in-situ hyperspectral data for detecting and discriminating yellow rust disease from nutrient stresses. Field Crop. Res. 2012, 134, 165–174. [Google Scholar] [CrossRef]
- Huang, X.; Zhang, Q.; Hu, L.; Zhu, T.; Zhou, X.; Zhang, Y.; Xu, Z.; Ju, W. Monitoring Damage Caused by Pantana phyllostachysae Chao to Moso Bamboo Forests Using Sentinel-1 and Sentinel-2 Images. Remote Sens. 2022, 14, 5012. [Google Scholar] [CrossRef]
- Broge, N.H.; Leblanc, E. Comparing prediction power and stability of broadband and hyperspectral vegetation indices for estimation of green leaf area index and canopy chlorophyll density. Remote Sens. Environ. 2001, 76, 156–172. [Google Scholar] [CrossRef]
- Barry, K.; Corkrey, R.; Thi, H.; Ridge, S.; Mohammed, C. Spectral characterization of necrosis from reflectance of Eucalyptus globulus leaves with Mycosphaerella leaf disease or subjected to artificial lesions. Int. J. Remote Sens. 2011, 32, 9243–9259. [Google Scholar] [CrossRef]
- Yu, L.; Zhan, Z.; Ren, L.; Zong, S.; Luo, Y.; Huang, H. Evaluating the Potential of WorldView-3 Data to Classify Different Shoot Damage Ratios of Pinus yunnanensis. Forests 2020, 11, 417. [Google Scholar] [CrossRef] [Green Version]
- Harati, S.; Pérez, L.; Molowny-Horas, R. Integrating Neighborhood Effect and Supervised Machine Learning Techniques to Model and Simulate Forest Insect Outbreaks in British Columbia, Canada. Forests 2020, 11, 1215. [Google Scholar] [CrossRef]
- Tang, L.; Shao, G. Drone remote sensing for forestry research and practices. J. For. Res. 2015, 26, 791–797. [Google Scholar] [CrossRef]
- Torresan, C.; Berton, A.; Carotenuto, F.; Di Gennaro, S.F.; Gioli, B.; Matese, A.; Miglietta, F.; Vagnoli, C.; Zaldei, A.; Wallace, L. Forestry applications of UAVs in Europe: A review. Int. J. Remote Sens. 2017, 38, 2427–2447. [Google Scholar] [CrossRef]
- Su, J.; Liu, C.; Hu, X.; Xu, X.; Guo, L.; Chen, W.-H. Spatio-temporal monitoring of wheat yellow rust using UAV multispectral imagery. Comput. Electron. Agric. 2019, 167, 105035. [Google Scholar] [CrossRef]
- Xu, Z.; Zhang, Q.; Xiang, S.; Li, Y.; Huang, X.; Zhang, Y.; Zhou, X.; Li, Z.; Yao, X.; Li, Q.; et al. Monitoring the Severity of Pantana phyllostachysae Chao Infestation in Moso Bamboo Forests Based on UAV Multi-Spectral Remote Sensing Feature Selection. Forests 2022, 13, 418. [Google Scholar] [CrossRef]
- Severtson, D.; Callow, N.; Flower, K.; Neuhaus, A.; Olejnik, M.; Nansen, C. Unmanned aerial vehicle canopy reflectance data detects potassium deficiency and green peach aphid susceptibility in canola. Precis. Agric. 2016, 17, 659–677. [Google Scholar] [CrossRef] [Green Version]
- Ye, H.; Huang, W.; Huang, S.; Cui, B.; Dong, Y.; Guo, A.; Ren, Y.; Jin, Y. Recognition of Banana Fusarium Wilt Based on UAV Remote Sensing. Remote Sens. 2020, 12, 938. [Google Scholar] [CrossRef] [Green Version]
- Anting, G.; Huang, W.; Dong, Y.; Ye, H.; Ma, H.; Liu, B.; Wu, W.; Ren, Y.; Ruan, C.; Geng, Y. Wheat Yellow Rust Detection Using UAV-Based Hyperspectral Technology. Remote Sens. 2021, 13, 123. [Google Scholar] [CrossRef]
- Rodríguez, J.; Lizarazo, I.; Prieto, F.; Angulo-Morales, V. Assessment of potato late blight from UAV-based multispectral imagery. Comput. Electron. Agric. 2021, 184, 106061. [Google Scholar] [CrossRef]
- Ferentinos, K.P. Deep learning models for plant disease detection and diagnosis. Comput. Electron. Agric. 2018, 145, 311–318. [Google Scholar] [CrossRef]
- Wu, B.; Liang, A.; Zhang, H.; Zhu, T.; Zou, Z.; Yang, D.; Tang, W.; Li, J.; Su, J. Application of conventional UAV-based high-throughput object detection to the early diagnosis of pine wilt disease by deep learning. For. Ecol. Manag. 2021, 486, 118986. [Google Scholar] [CrossRef]
- Deng, X.; Tong, Z.; Lan, Y.; Huang, Z. Detection and Location of Dead Trees with Pine Wilt Disease Based on Deep Learning and UAV Remote Sensing. AgriEngineering 2020, 2, 294–307. [Google Scholar] [CrossRef]
- Duarte, A.; Acevedo-Muoz, L.; Gonalves, C.I.; Mota, L.; Valente, C. Detection of Longhorned Borer Attack and Assessment in Eucalyptus Plantations Using UAV Imagery. Remote Sens. 2020, 12, 3153. [Google Scholar] [CrossRef]
- Syifa, M.; Park, S.-J.; Lee, C.-W. Detection of the Pine Wilt Disease Tree Candidates for Drone Remote Sensing Using Artificial Intelligence Techniques. Engineering 2020, 6, 919–926. [Google Scholar] [CrossRef]
- Sishodia, R.P.; Ray, R.L.; Singh, S.K. Applications of Remote Sensing in Precision Agriculture: A Review. Remote Sens. 2020, 12, 3136. [Google Scholar] [CrossRef]
- Ulziibaatar, M.; Matsui, K. Herders’ Perceptions about Rangeland Degradation and Herd Management: A Case among Traditional and Non-Traditional Herders in Khentii Province of Mongolia. Sustainability 2021, 13, 7896. [Google Scholar] [CrossRef]
- Shlens, J. A Tutorial on Principal Component Analysis. arXiv 2014, arXiv:1404.1100. [Google Scholar]
- Zhang, L.; Dong, W.; Zhang, D.; Shi, G. Two-stage image denoising by principal component analysis with local pixel grouping. Pattern Recognit. 2010, 43, 1531–1549. [Google Scholar] [CrossRef] [Green Version]
- Mário César Ugulino, A.; Teresa Cristina Bezerra, S.; Roberto Kawakami Harrop, G.; Takashi, Y.; Henrique Caldas, C.; Valeria, V. The successive projections algorithm for variable selection in spectroscopic multicomponent analysis. Chemom. Intell. Lab. Syst. 2001, 57, 65–73. [Google Scholar]
- Kattenborn, T.; Leitloff, J.; Schiefer, F.; Hinz, S. Review on Convolutional Neural Networks (CNN) in Vegetation Remote Sensing. ISPRS J. Photogramm. Remote Sens. 2021, 173, 24–49. [Google Scholar] [CrossRef]
- Zhu, X.; Tuia, D.; Mou, L.; Xia, G.-S.; Zhang, L.; Xu, F.; Fraundorfer, F. Deep Learning in Remote Sensing: A Comprehensive Review and List of Resources. IEEE Geosci. Remote Sens. Mag. 2017, 5, 8–36. [Google Scholar] [CrossRef] [Green Version]
- Blanchet, L.; Vitale, R.; van Vorstenbosch, R.; Stavropoulos, G.; Pender, J.; Jonkers, D.; Schooten, F.-J.v.; Smolinska, A. Constructing bi-plots for random forest: Tutorial. Anal. Chim. Acta 2020, 1131, 146–155. [Google Scholar] [CrossRef]
- Breiman, L. Random Forests. Mach. Learn. 2001, 45, 5–32. [Google Scholar] [CrossRef] [Green Version]
- Kumar, B.; Vyas, O.; Vyas, R. A comprehensive review on the variants of support vector machines. Mod. Phys. Lett. B 2019, 33, 1950303. [Google Scholar] [CrossRef]
- Burges, C.J.C. A Tutorial on Support Vector Machines for Pattern Recognition. Data Min. Knowl. Discov. 1998, 2, 121–167. [Google Scholar] [CrossRef]
- Amari, S.; Wu, S. Improving support vector machine classifiers by modifying kernel functions. Neural Netw. 1999, 12, 783–789. [Google Scholar] [CrossRef] [PubMed]
- Guo, A.; Huang, W.; Ye, H.; Dong, Y.; Ma, H.; Ren, Y.; Chao, R. Identification of Wheat Yellow Rust using Spectral and Texture Features of Hyperspectral Images. Remote Sens. 2020, 12, 1419. [Google Scholar] [CrossRef]
- Chen, Y.; Guerschman, J.P.; Cheng, Z.; Guo, L. Remote sensing for vegetation monitoring in carbon capture storage regions: A review. Appl. Energy 2019, 240, 312–326. [Google Scholar] [CrossRef]
- Yang, M.D.; Tseng, H.H.; Hsu, Y.C.; Hui, P.T. Semantic Segmentation Using Deep Learning with Vegetation Indices for Rice Lodging Identification in Multi-date UAV Visible Images. Remote Sens. 2020, 12, 633. [Google Scholar] [CrossRef] [Green Version]
- Yang, J.; He, Y.; Caspersen, J. Region merging using local spectral angle thresholds: A more accurate method for hybrid segmentation of remote sensing images. Remote Sens. Environ. 2017, 190, 137–148. [Google Scholar] [CrossRef]
- Li, D.; Zhang, G.; Wu, Z.; Yi, L. An Edge Embedded Marker-Based Watershed Algorithm for High Spatial Resolution Remote Sensing Image Segmentation. IEEE Trans. Image Process. 2010, 19, 2781–2787. [Google Scholar]
- Gitelson, A.; Merzlyak, M.; Chivkunova, O. Optical Properties and Nondestructive Estimation of Anthocyanin Content in Plant Leaves. Photochem. Photobiol. 2007, 74, 38–45. [Google Scholar] [CrossRef]
- Niu, Q.; Feng, H.; Zhou, X.; Zhu, J.; Yong, B.; Li, H. Combining UAV Visible Light and Multispectral Vegetation Indices for Estimating SPAD Value of Winter Wheat. Trans. Chin. Soc. Agric. Mach. 2021, 52, 183–194. [Google Scholar]
- Govender, M.; Chetty, K.; Bulcock, H. A review of hyperspectral remote sensing and its application in vegetation and water resource studies. Water SA 2007, 33, 145–151. [Google Scholar] [CrossRef] [Green Version]
- Huo, L.; Lindberg, E.; Holmgren, J. Towards low vegetation identification: A new method for tree crown segmentation from LiDAR data based on a symmetrical structure detection algorithm (SSD). Remote Sens. Environ. 2022, 270, 112857. [Google Scholar] [CrossRef]
- Coops, N.C.; Tompalski, P.; Goodbody, T.; Queinnec, M.; Hermosilla, T. Modelling lidar-derived estimates of forest attributes over space and time: A review of approaches and future trends. Remote Sens. Environ. 2021, 260, 112477. [Google Scholar] [CrossRef]
- Zhou, Y.; Lao, C.; Yang, Y.; Zhang, Z.; Yang, N. Diagnosis of winter-wheat water stress based on UAV-borne multispectral image texture and vegetation indices. Agric. Water Manag. 2021, 256, 107076. [Google Scholar] [CrossRef]
- Haralick, R.M.; Shanmugam, K.; Dinstein, I.H. Textural features for image classification. IEEE Trans. Syst. Man Cybern 1973, 3, 610–621. [Google Scholar] [CrossRef] [Green Version]
- Kamilaris, A.; Prenafeta-Boldú, F.X. A review of the use of convolutional neural networks in agriculture. J. Agric. Sci. 2018, 156, 312–322. [Google Scholar] [CrossRef] [Green Version]
- Tao, H.; Li, C.; Zhao, D.; Deng, S.; Jing, W. Deep learning-based dead pine trees detection from unmanned aerial vehicle images. Int. J. Remote Sens. 2020, 41, 8238–8255. [Google Scholar] [CrossRef]
- Kingma, D.; Ba, J. Adam: A Method for Stochastic Optimization. arXiv 2014, arXiv:1412.6980. [Google Scholar]
- Belgiu, M.; Draguţ, L. Random forest in remote sensing: A review of applications and future directions. ISPRS J. Photogramm. Remote Sens. 2016, 114, 24–31. [Google Scholar] [CrossRef]
- Rodriguez-Galiano, V.; Sanchez-Castillo, M.; Chica-Olmo, M.; Chica-Rivas, M. Machine learning predictive models for mineral prospectivity: An evaluation of neural networks, random forest, regression trees and support vector machines. Ore Geol. Rev. 2015, 71, 804–818. [Google Scholar] [CrossRef]
- Boateng, E.Y.; Otoo, J.; Abaye, D. Basic Tenets of Classification Algorithms K-Nearest-Neighbor, Support Vector Machine, Random Forest and Neural Network: A Review. J. Data Anal. Inf. Process. 2020, 8, 341–357. [Google Scholar] [CrossRef]
- Nalepa, J.; Kawulok, M. Selecting training sets for support vector machines: A review. Artif. Intell. Rev. 2018, 52, 857–900. [Google Scholar] [CrossRef] [Green Version]
- Abaimov, A.P. Geographical Distribution and Genetics of Siberian Larch Species; Springer: Dordrecht, The Netherlands, 2010. [Google Scholar]
- Zhang, J.; Qiu, X.; Wu, Y.; Zhu, Y.; Cao, Q.; Liu, X.; Cao, W. Combining texture, color, and vegetation indices from fixed-wing UAS imagery to estimate wheat growth parameters using multivariate regression methods. Comput. Electron. Agric. 2021, 185, 106138. [Google Scholar] [CrossRef]


| Band | Wavelength Range/nm | Central Wavelength/nm | Bandwidth/nm |
|---|---|---|---|
| Blue band (B) | 434–466 | 450 | ±16 |
| Green band (G) | 544–576 | 560 | ±16 |
| Red band (R) | 634–666 | 650 | ±16 |
| Red-edge band (RE) | 714–746 | 730 | ±16 |
| Near-infrared band (NIR) | 814–866 | 840 | ±26 |
| Victim Level | Healthy | Mild | Moderate | Severe | |
|---|---|---|---|---|---|
| Tree Class | |||||
| Leaf loss rate | 0%–5% | 6%–30% | 31%–70% | 71%–100% | |
| Canopy appearance characteristics | Needles and leaves are abundant; no branches exposed; green crown | Needles are bushier; a few branches are bare; canopy is starting to turn yellow | Needles are sparse and a large number of branches are exposed; crown is yellow and red | Only a few needles; branches are all bare; canopy is gray | |
| Classification Models | VIs | VIs + TF | ||||
|---|---|---|---|---|---|---|
| RFVIs | SVMVIs | 1D-CNNVis | RFVIs+TF | SVMVIs+TF | 1D-CNNVIs+TF | |
| OA | 0.8650 | 0.8700 | 0.8950 | 0.8600 | 0.8450 | 0.8800 |
| Kappa | 0.8311 | 0.8369 | 0.8666 | 0.8256 | 0.8082 | 0.8485 |
| Rmacro | 0.8536 | 0.8603 | 0.8859 | 0.8559 | 0.8415 | 0.8670 |
| F1macro | 0.8530 | 0.8582 | 0.8839 | 0.8506 | 0.8335 | 0.8672 |
| Classification Model | VIs | VIs + TF | |||||
|---|---|---|---|---|---|---|---|
| Victimization Level | RFVIs | SVMVIs | CNNVIs | RFVIs+TF | SVMVIs+TF | CNNVIs+TF | |
| Healthy | 979 | 987 | 1010 | 931 | 740 | 971 | |
| Mild | 726 | 746 | 726 | 677 | 296 | 623 | |
| Moderate | 635 | 543 | 611 | 599 | 359 | 612 | |
| Severe | 602 | 666 | 595 | 735 | 1547 | 736 | |
Publisher’s Note: MDPI stays neutral with regard to jurisdictional claims in published maps and institutional affiliations. |
© 2022 by the authors. Licensee MDPI, Basel, Switzerland. This article is an open access article distributed under the terms and conditions of the Creative Commons Attribution (CC BY) license (https://creativecommons.org/licenses/by/4.0/).
Share and Cite
Ma, L.; Huang, X.; Hai, Q.; Gang, B.; Tong, S.; Bao, Y.; Dashzebeg, G.; Nanzad, T.; Dorjsuren, A.; Enkhnasan, D.; et al. Model-Based Identification of Larix sibirica Ledeb. Damage Caused by Erannis jacobsoni Djak. Based on UAV Multispectral Features and Machine Learning. Forests 2022, 13, 2104. https://doi.org/10.3390/f13122104
Ma L, Huang X, Hai Q, Gang B, Tong S, Bao Y, Dashzebeg G, Nanzad T, Dorjsuren A, Enkhnasan D, et al. Model-Based Identification of Larix sibirica Ledeb. Damage Caused by Erannis jacobsoni Djak. Based on UAV Multispectral Features and Machine Learning. Forests. 2022; 13(12):2104. https://doi.org/10.3390/f13122104
Chicago/Turabian StyleMa, Lei, Xiaojun Huang, Quansheng Hai, Bao Gang, Siqin Tong, Yuhai Bao, Ganbat Dashzebeg, Tsagaantsooj Nanzad, Altanchimeg Dorjsuren, Davaadorj Enkhnasan, and et al. 2022. "Model-Based Identification of Larix sibirica Ledeb. Damage Caused by Erannis jacobsoni Djak. Based on UAV Multispectral Features and Machine Learning" Forests 13, no. 12: 2104. https://doi.org/10.3390/f13122104