Article

Carbonaceous Materials from Forest Waste Conversion and Their Corresponding Hazardous Pollutants Remediation Performance

1
Faculty of Chemical Engineering and Environmental Protection, “Gheorghe Asachi” Technical University of Iasi, 73, Prof. Dimitrie Mangeron Street, 700050 Iasi, Romania
2
National Institute for R&D in Electrical Engineering ICPE-CA, 313 Splaiul Unirii, 030138 Bucuresti, Romania
*
Author to whom correspondence should be addressed.
Forests 2022, 13(12), 2080; https://doi.org/10.3390/f13122080
Submission received: 12 November 2022 / Revised: 26 November 2022 / Accepted: 2 December 2022 / Published: 7 December 2022
(This article belongs to the Special Issue Development and Utilization of Lignocellulose and Other Wood Biomass)

Abstract

:
The conversion of lignocellulosic waste ascends as a promising path to generate new materials with wide industrial and environmental uses. Pyrolytic biochar (PBc), hydrochar (Hc), and activated hydrochar (AcHc) produced from the waste of Picea Abies bark were considered bio-based sorbents for lead uptake from aqueous effluents. PBc was obtained through slow pyrolysis (550 °C), while Hc resulted under hydrothermal conversion (280 °C). In order to enhance the specific surface, Hc was subjected to a physical activation, resulting AcHc. All three carbonaceous materials were prepared through relatively simple processes from a readily locally available resource. The carbonaceous materials were characterized using infrared spectroscopy and scanning electron microscopy. The Pb (II) removal has been tested in batch mode on a synthetic monocomponent wastewater matrix, as well as on a real mine drainage effluent. A significant effect of pH was observed, while the equilibrium was achieved in a short time, about 60 min for PBc and Hc and 120 min for AcHc. Langmuir model predicted a maximum adsorption capacity of 15.94 mg/g for PBc, 9.99 mg/g for Hc, and 37.46 mg/g for AcHc. All materials studied had good uptake capacities for lead with no drastic effect of typical coexisting species.

1. Introduction

It is estimated that 1 billion tons of lignocellulosic biomass will be produced in Europe by 2030, while 476 million tons represent the requirement to complete the needs of all biobased European industries [1]. Wood biomass as by-product material from forest processing is used as feedstock for bioenergy processes [2,3], for pulp and paper, in the development of wood pellets, to create engineered wood products [4], as raw material for value-added bioproducts [5].
Lignocellulosic waste can follow three main routes: (i) landfilling, (ii) incineration, and (iii) conversion through a multi-purpose cascading biorefinery. Even with the spread of the circular economy concept, a large amount of this waste still goes to landfill or incineration, causing high environmental and financial losses. The conversion and reuse of lignocellulosic waste ascend as a promising path to generate new materials with wide industrial and environmental uses. Especially, biobased carbon-rich materials (bio- and hydrochar) occur as possible environmental-friendly products used in organic decontamination—dyes [6], phenolics [7], pesticides [8], polynuclear aromatics [9], antibiotics [10] or inorganic remediation—anionic [11] and cationic contaminants [12]. Thus, carbonaceous materials obtained from lignocellulosic waste appear as a promising solution to the critical issue of waste reuse and offer a green alternative to environmental remediation.
As general features, carbonaceous materials are characterized by chemical stability, very good conductivity, good porosity, and surface area and are cost-effective. They are extremely versatile materials and include chars, fullerenes, carbon nanotubes, graphene, or graphene-like particles, and activated carbon. Carbonaceous materials are used for composites preparation, catalysis, and carbon sequestration and are extensively applied as electrode materials, having extreme importance for electrochemical energy storage and energy conversion devices. These carbon-rich materials also have countless applications perfectly compatible with a sustainable and minimally polluting approach as effluent remediation sorbents [13].
Biochar represents the solid phase resulting from biomass pyrolysis with characteristics depending on the feedstock as well as on the conversion process parameters. It is considered a low-cost alternative to activated carbon, with equivalent sorption efficiency for various inorganic contaminants [14]. Due to its cost-effective production from waste, the estimated break-even price for biochar is US $246/t, which is approximately 1/6 of commercially available activated carbon (US $1500/t) [15]. Compared to conventional technologies applied for the removal of hazardous which normally have secondary polluting effects involving the handling and disposal of toxic sludge, the adsorption onto biochars seems a very encouraging approach.
Hydrochar is a carbonaceous material obtained through hydrothermal carbonization. Hydrolysis, dehydration, decarboxylation, aromatization, and re-condensation are reactions that lead to hydrothermal carbonization [16]. This conversion procedure does not require a previous drying stage, making it a cheaper technique than other conversion methods, non-polluting, and easy to achieve [17].
The carbon-rich materials such as bio and hydro chars are good precursors for activated carbon. Two methods (physical and chemical) are usually used for activation. The very good adsorption capacity of activated carbon is due to its porous structure as well as to large and complex surface area [18].
The literature reports publications on adsorption capacities for lead, in batch mode, mainly for modified biochar [19,20,21,22], and the results were promising. Biochar from pomelo peel dried-H3PO4 impregnated and then pyrolyzed was tested [23] and showed an adsorption capacity of 88.7 mg/g through precipitation of phosphorous functional groups mechanism. The peanut shell washed, dried and milled, pyrolyzed, and treated with hydrated manganese oxide presented an adsorption capacity of 36 mg/g [24]. Maple wood dried, pyrolyzed, and H2O2 modified presented a maximum adsorption capacity of 43.3 mg/g by a complexation mechanism with oxygen functional groups [25]. Jimenez et al. [26] tested pecan nutshell, dried and milled, and this biochar shows a maximum adsorption capacity of 80.3 mg/g through an ion exchange by calcium ion mechanisms. A critical review of biochars used in wastewater treatment [27] details the pre-treatment and post-treatment of feedstock that affects biochar production and points out the adsorption capacities of various types of biochars for different contaminants.
As well, hydrochar, used as such or improved by pre-treatments, was used for heavy metal uptake from contaminated effluents. The adsorption capacity varies depending on the feedstock used and the hydrothermal parameters. A hydrochar produced from the hydrothermal carbonization of peanut hull was tested for lead removal by Xue et al., and the sorption capacity was 22.82 mg/g [28]. A significantly higher lead retention capacity (151.51 mg/g) was highlighted after testing a dithiocarbamate-modified hydrochar produced from agricultural and forestry waste [29]. Pinewood sawdust hydrochar modified with 20% H2O2 solution shows a very good adsorption capacity of Pb2+ (92.80 mg/g) compared with the pristine hydrochar (2.20 mg/g) [30]. Babeker et al. have published an extensive review article about heavy metal removal from wastewater by adsorption with hydrochar derived from wood biomass [31]. Activated carbon is a well-known adsorbent for heavy-metals sequestration from wastewater, including lead [32,33,34,35]. Shi et al. [32] compared the performance of lead removal using sorbents activated carbon and metal oxides (Fe(OH)3 and TiO2) and found for activated carbon, an adsorption capacity of 21.2 mg/g, lower than that reported for metal oxides. Activated carbon derived from pine cone [33] showed a retention capacity of 27.53 mg/g. In comparison, an activated carbon produced from winemaking waste [34] had a maximum adsorption capacity of 58 mg/g for a low concentration of the initial lead solution (only 10 mg/L Pb). Also, the interaction between lead and functional groups of activated carbons, competitive adsorption comportment, the structure of the adsorbent, and the mechanism of the adsorption was explored in detail [35].
However, most of the research previously cited has used biochars, hydrochars, or activated carbons improved through various chemical processes, and the studies were conducted considering high initial concentrations of lead (50–250 mg/mL), which, most of the time, exceeds the lead concentration reported for wastewater streams.
Either from endogenous or anthropogenic sources, lead contamination of the natural environment (water, soil, air) could exceed the legal limits allowed and endanger the health or even the life of living organisms. Resulting from the production of lead-acid batteries with a concentration in wastewater of 5–15 mg/L [36] or even much higher, as well as from paints, pigments, glass, chemicals, electroplating industries (0.7–25 mg/L), metal mining (up to 6 mg/L) or pesticides manufacturing, lead generates important water stream contamination [37].
Consequently, toxic effects on humans are reported, depending on the dose and duration of exposure. The International Agency for Research on Cancer (IARC) classifies lead and its inorganic compounds as probably carcinogenic to humans. In contrast, the American Conference of Governmental Industrial Hygienists (ACGIH) classifies lead and inorganic lead compounds as confirmed animal carcinogens [38]. Children are sensitive to the toxic effects of lead on the central nervous system, while adults develop peripheral neuropathy and hypertension. For these reasons, removing lead from contaminated environments, particularly from wastewater, is still a critical goal and an environmental and public health emergency [39].
In this work, three different types of carbonaceous materials obtained through different conversion paths applied on spruce bark waste were studied: biochar (PBc), hydrochar (Hc), and activated hydrochar (AcHc). This work provides (i) a chemical and structural characterization of these carbon materials and (ii) a critical comparative study on the lead uptake capacity of these biobased carbon-rich materials and a possible mechanism of lead sequestration in correlation with the chemical and structural features of the sorbents. The study was conducted considering a mono-component wastewater matrix as well as a real mine drainage effluent stream. Moreover, the initial concentration of lead solution deliberately takes into account the levels reported in industrial wastewater pollution. To the best of our knowledge, no other studies reported the use of PBc, Hc, and AcHc from spruce bark in aqueous lead remediation, considering concentrations are hard to remove from real complex effluent matrixes.

2. Experimental Methods

2.1. Chemicals and Glassware Preparation

Adsorbate stock solution (1000 ppm) was prepared by dissolving an accurate amount of Pb(NO3)2 (Merck, analytical grade) in distilled water. From this, the remaining lower-concentration solutions used in this study were prepared. The pH was adjusted to the required values using diluted solutions of NaOH and HNO3. These solutions were prepared from analytical grade chemicals: NaOH pellets (purity ≥ 99.0%, Merck) and HNO3 65% (PA, Sigma Aldrich, Germany). Glassware and plastic materials were acid-washed (soaked for 24 h in HNO3 20% solution) and rinsed with distilled water.

2.2. Sorbent Preparation

From the perspective of a “zero waste” economy that requires a sustainable use of natural resources together with the lowest possible waste generation, the conversion and reuse of lignocellulosic waste ascend as a promising path to design environmentally friendly materials for hazardous remediation and/or critical pollutants recovery. A wood processing company provided the spruce (Picea abies) bark as waste, and the biomass was dried under regular aeration conditions at 22–24 °C. Afterward, it was milled (GrindoMix GM 2000 mill) to particles with a size between 0.25 to 1.25 mm. From this feedstock, three types of carbonaceous materials were generated: biochar (PBc), hydrochar (Hc), and activated hydrochar (AcHc).
The biochar (PBc) resulted from the spruce bark subjected to a biorefinery process as follows: in the primary biorefinery step, the extractibles (polyphenols, pigments, or resins) were separated in an ultrasound-assisted process using ethanol 70% v/v, solid to liquid ratio 1:10, at 50 °C temperature and 45 min. extraction time [40]. An ultrasonic thermostatic bath Sonorex RK 100 H (Bandeline Electronic GmbH & Co.KG, Berlin, Germany) 35 kHz frequency and 80–320 W was used. The residual biomass was washed with distilled water, dried in a Binder oven at 45 °C, and then, in the second biorefinery step, subjected to conversion via slow pyrolysis at 550 °C in a lab-scale reactor. The temperature inside the reactor was increased progressively by 10 °C per min until 550 °C was reached and maintained for 15 min. At the end of the process, three fractions were obtained: a gaseous fraction, a liquid one, and a solid part representing the biochar (PBc). Only PBc was further used for biosorption remedial tests.
The hydrochar (Hc) was produced as a slurry in water via hydrothermal conversion of spruce bark under mild temperature and self-generated pressure, as was previously reported by our group [41].
The activated hydrochar (AcHc) resulted from Hc subjected to a physical activation with steam at 925 °C for 15 min. This technique was applied in order to improve the bio-based sorbent properties.

2.3. Characterization of the Sorbent

2.3.1. Infrared Spectroscopy

Fourier transform infrared spectroscopy (FTIR) was used to qualitatively assess functional groups on the surface of PBc, Hc, and AcHc. A PerkinElmer Spectrum 100 Series FT-IR spectrometer was used to obtain the infrared spectra in a range of 400 to 4000 cm−1.

2.3.2. SEM/EDX Analysis

The surface morphology of carbonaceous materials samples before and after lead sorption tests was studied by scanning electron microscopy (SEM) using a Carl Zeiss SMT FESEM-FIB (Scanning Microscope Tunneling Field Emission, Scanning Electron Microscope-Focused Ion Beam) Auriga, Oberkochen, Germany, in the following conditions: the tension of acceleration was 10 kV and the magnitude between 20 and 50 k. The elemental analysis was performed by energy-dispersive X-ray spectroscopy with an energy-dispersive probe (Inca Energy 250 type Oxford Instruments, Abingdon, UK) coupled to SEM equipment.

2.3.3. Brunauer–Emmett–Teller (BET) Surface Area Analysis

An Autosorb 1 MP (Quantachrome, Boynton Beach, FL, USA) analyzer was used for the determination of specific surface area through the BET method, based on nitrogen multilayer absorption. The surface area was determined by the BET equation; a V-T method was applied for the micropores volume assay, and the difference between the volume of nitrogen adsorption and the micropores volume was taken as mesopores volume [42].

2.4. Analytical Procedures

The metal concentrations in the aqueous solution were determined by atomic adsorption spectrometry (using an AAS 932 GBC Scientific Equipment, Braeside, Victoria, Australia). When necessary, dilutions were made to obtain concentrations within linear ranges. Calibration curves were performed before each analysis, and the minimum determination coefficient admitted R2 > 0.995. In each measurement, three absorbance readings were performed. Before AAS analysis, the samples were filtered using cellulose acetate membrane filters (45 μm porosity). Sorption experiments were performed in a batch system in Erlenmeyer flasks containing 25 mL of Pb(II) solution under continuous stirring with 150 rpm (GFL3031) at constant temperature (23 ± 1 °C). The stirring rate values were considered sufficient to ensure that all active centers of adsorbent are available for metal removal, ranging between 150 rpm [43] and 300 rpm [44]. The graphite furnace (GBC SensAA Dual) atomic absorption spectrophotometry was used for the analyses carried out in the order of µg/L. All experiments were performed in duplicate.

2.5. Adsorption Studies

A widely known and accepted methodology for the adsorption study was applied [19,20,21,22,23,24,25,28,30,34] following the stages presented below.

2.5.1. Effect of pH

Preliminary tests were completed in order to estimate the optimal pH value for the lead adsorption capacity of carbonaceous materials. The experiments were performed in an acidic pH range, as these are common conditions expected to be found in most contaminated waters [36,45,46]. Adsorption tests were performed in Erlenmeyer flasks containing 25 mL Pb solution 20 mg/L, at different pH (2, 3.5, and 5), using 0.5 g/L sorbents, accurately weighed. If necessary, pH was monitored regularly and readjusted to maintain a constant value (±0.5). After 4 h contact time, samples were filtered, and concentrations of lead in the liquid phase were measured by AAS. The amount of lead adsorbed on equilibrium (q, mg/g) was calculated using the mass balance equation (Equation (1)):
q = C i n C f m   V
where Cin is the initial Pb concentration in the liquid phase (mg/L), Cf is the concentration after adsorption (mg/L), m is the char mass (g), and V is the solution volume (L).
The removal efficiency was calculated using the equation (Equation (2)):
%   r e m o v a l = C i n C f C i n   100

2.5.2. Adsorbent Dosage

The optimal adsorbent dosage is mandatory to be established in order to determine the efficiency of the tested materials accurately. For this purpose, experiments were conducted with a metal solution of 25 mg/L initial concentration, at pH 5 ± 0.5, varying the carbonaceous sorbents dosage as follows: 0.25, 0.5, 1.0, 2.0, 4.0, and 10.0 g/L. Total dissolved lead was analyzed in the liquid phase, and the amount of lead adsorbed per gram of carbonaceous materials was calculated applying equation (Equation (1)) as well as the removal efficiency using equation (Equation (2)).

2.5.3. Adsorption Kinetic Study

The dynamic kinetic studies were performed at pH 5 ± 0.5, periodically checked, and corrected if necessary. The suspensions were stirred for different pre-set contact times (5, 15, 30, 60, 120, 240, 480, and 720 min) in order to achieve the Pb concentration decay for distinct reaction times. To evaluate the effect of adsorbent concentration on the kinetic parameters, the initial concentration (Cin) of 20 mg/L Pb (II) and a dose of sorbent of 0.5 g/L were considered. The lead concentration in the liquid phase was recorded as a function of contact time, also using Equation (1)

2.5.4. Equilibrium Study

The equilibrium study provides information on the affinity of the bio-based materials to the adsorbate and indicates the maximum adsorption capacity that could be expected for the adsorbent. The sorption isotherms for the uptake of Pb(II) by carbonaceous materials were determined at pH 5 ± 0.5, using a char’s initial concentration of 0.5 g/L (accurately weighed for each sample). The initial lead concentration ranged between 7.5 and 100 mg/L. This range of concentrations was chosen based on data reported for the electroplating industry (0.7–25 mg/L), for the mines drainage waters (about 6 mg/L) [37], for battery manufacturing or recycling industries (5–15 mg/L) [36] as well as for wastewater monitoring (40.8 to 319.4 mg/L) [47]. Equilibrium studies were performed in Erlenmeyer flasks using a 25 mL volume of lead solution. Following the kinetics study results, a time of 6 h was considered to ensure that equilibrium was reached for each concentration tested. The residual lead concentration (Cf) was determined by AAS, and the amount of Pb adsorbed per char mass unity (q) was calculated using Equation (1). Although, in this case, Cf corresponds to the equilibrium lead concentration (Ce) and q to the equilibrium absorbed quantity (qe).

2.5.5. Mine Drainage Wastewater Assay

The presence of other metal ions in the composition of aqueous effluent could influence the retention capacity of lead ions by the adsorbates. To verify this hypothesis, real mining effluent was used. The mine drainage water was collected from the Rosia Montana mine, Romania, in July 2022 and was chemically characterized. The mine was being used for the extraction of gold and silver and is currently decommissioned, the mining activity ceasing after several centuries of exploitation. The experimental conditions applied for these aqueous complex matrix tests were similar to those used for the synthetic lead solutions.

3. Results and Discussion

3.1. Chars Characterization

3.1.1. Fourier Transform Infrared Analysis
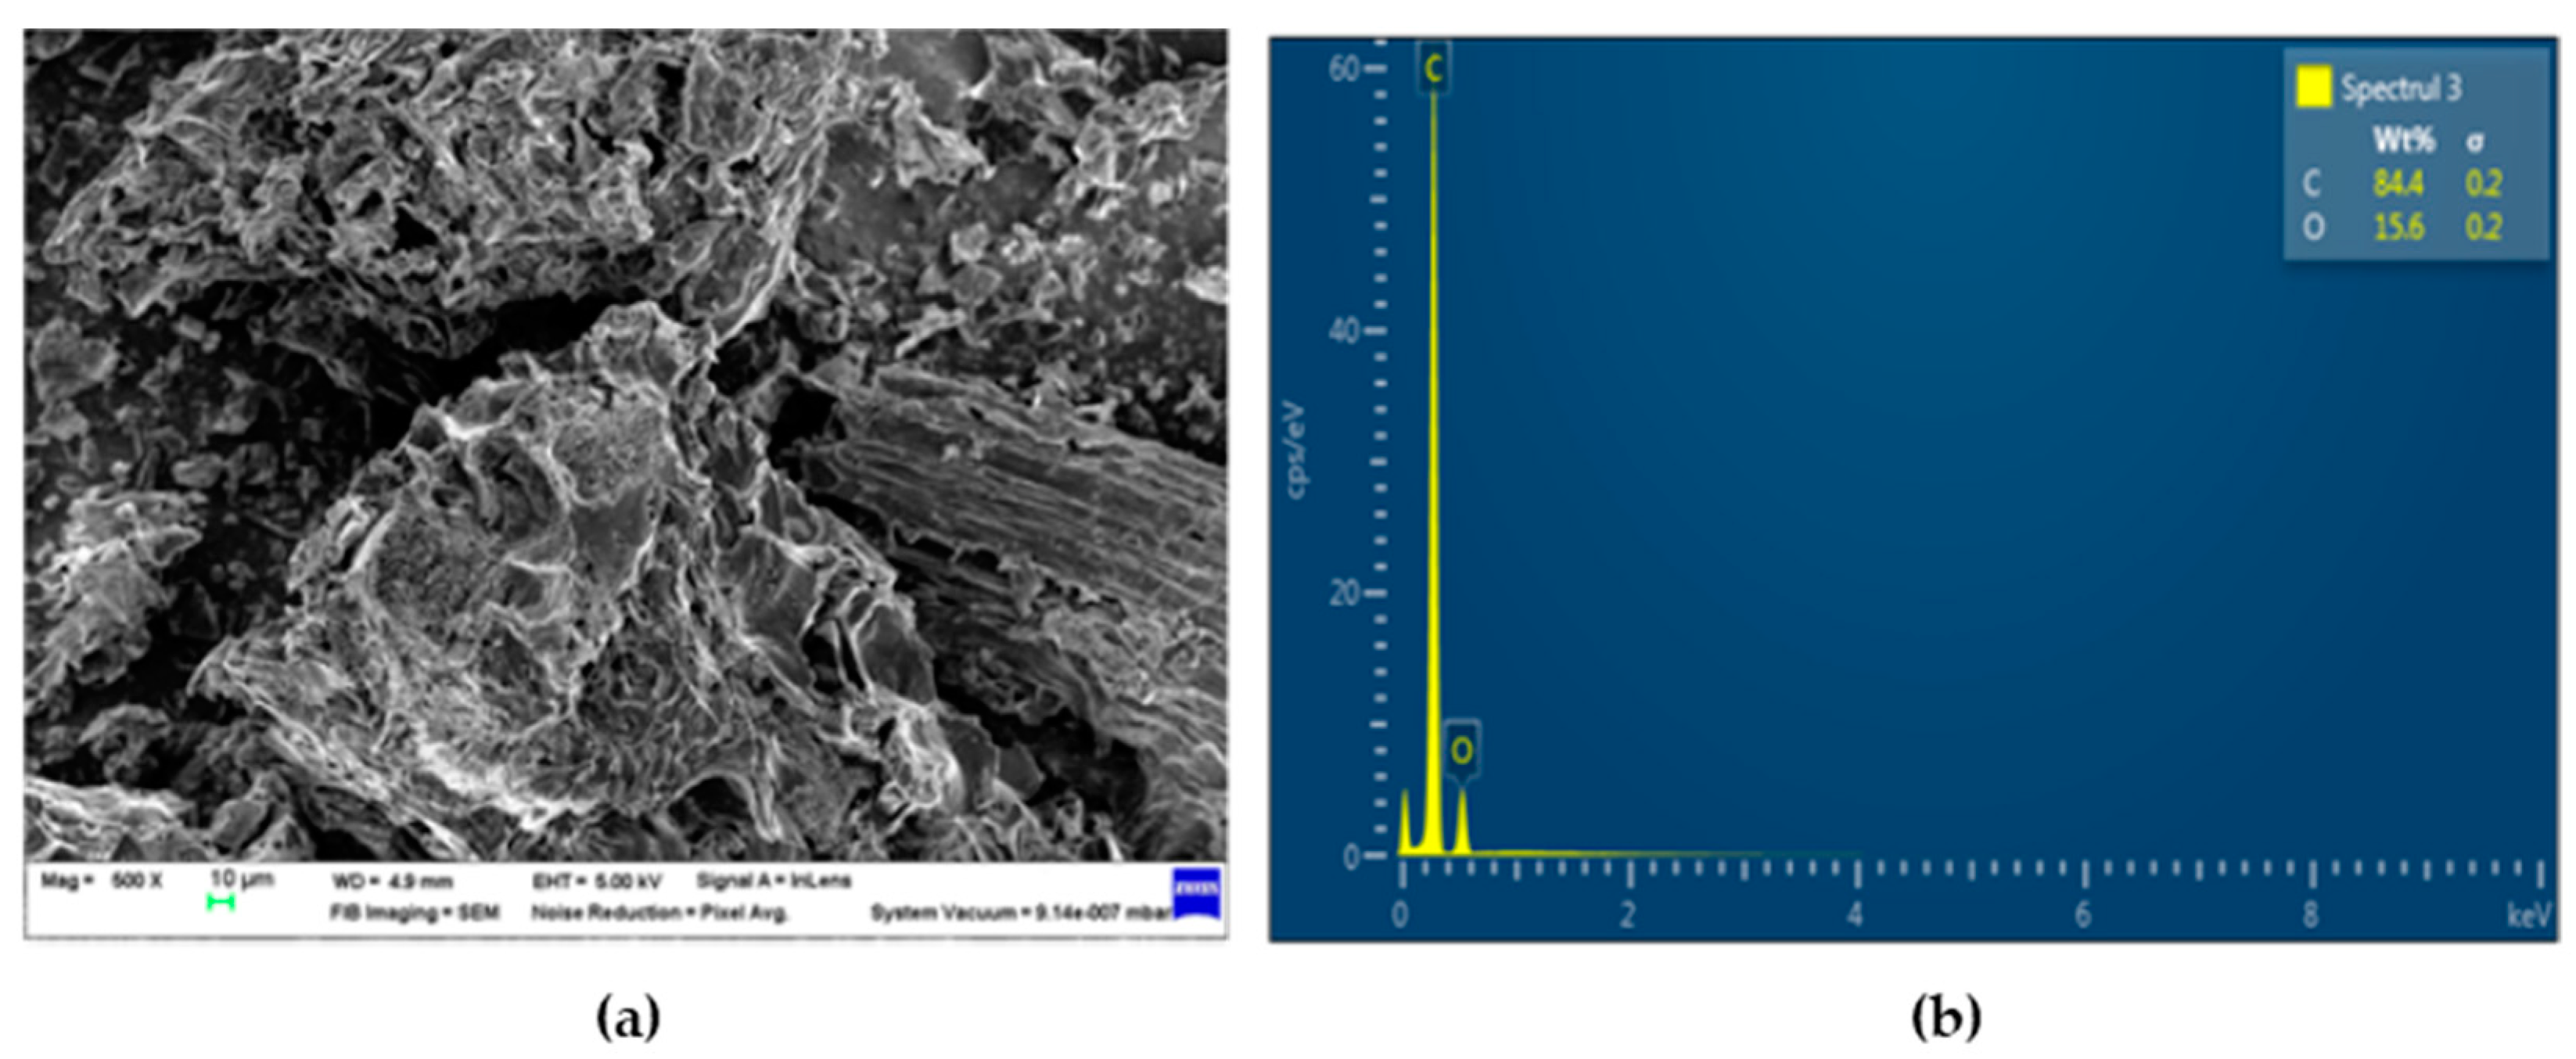
FTIR analysis is an important step for the qualitative identification of the functional groups present on the material's surface that have a critical role in the pollutant’s retention mechanisms. The information obtained from the FTIR screening (Figure 1) is correlated with existing data reported so far [48,49,50,51,52,53,54,55,56].
The spectra of all three analyzed carbonaceous materials show peaks in the band 3700 to 3000 cm−1 assigned to (O-H) groups present in aliphatic and phenolic structures. At 2950 to 2850 cm−1 have identified the vibrations of (C-H) bounds from aromatic methoxy, methyl and methylene groups [57]. The peaks between 2000–2600 cm−1 could indicate the possible presence of the (C-N) or (CC) triple bond. Descending below 2000 cm−1, all peaks recorded for Hc have a higher intensity than those registered for PBc and AcHc spectra. This can probably be explained by the fact that Hc resulted directly from the feedstock conversion as a result of hydrolysis, dehydration, decarboxylation, aromatization, and recondensation reactions which generally occur during hydrothermal conversion. Subsequently, with the thermal activation of the hydrochar, more dehydration and decarboxylation reactions occur, and the double bonds (C=O) and (C=C) are probably transformed into simple bonds such as carboxyl and hydroxyl groups [58].
The PBc IR spectra also confirm a (C=O) stretching of the carbonyl group typical for hemicelluloses at 1640–1845 cm−1 and (C=C) stretching of the aromatic ring of lignin found between 1515–1640 cm−1. The peaks of (C-O-C) asymmetric valence vibrations are detected at 1158–1250 cm−1. In a general way, the bands from 1400 cm−1 to approx. 2000 cm−1 are assigned to the aromatic structure. The peaks detected at 1000–1120 cm−1 are determined by aliphatic (C-O) stretching of the ether. All the signals placed under 900 cm−1 correspond to aromatic (C-H) stretch vibration.

3.1.2. SEM/EDX

The surface morphology of PBc, Hc, and AcHc was analyzed using SEM images, and elemental levels were estimated based on the EDX spectra alongside elemental mapping, as shown in Figure 2, Figure 3 and Figure 4. The images revealed a hierarchical porous structure resembling a cellular structure for all three types of chars. This porous network could facilitate the diffusion of lead ions to the interior of adsorbents by creating a larger contact surface and increasing the binding sites for lead.
The EDX analysis results reveal that carbon is the main component of bio-based sorbents, with a content ranging from 80 to 96%. Oxygen is also present in all examined structures, in the highest concentration in Hc. PBc and AcHc include a number of other chemical elements (Zn, Fe, Ca, Mn, Al, S) in low percentages. The elemental analysis data were obtained as an average of spectra of several surveyed areas of carbonaceous samples and are considered for comparative assessment.

3.1.3. Brunauer–Emmett–Teller (BET) Surface Area Analysis
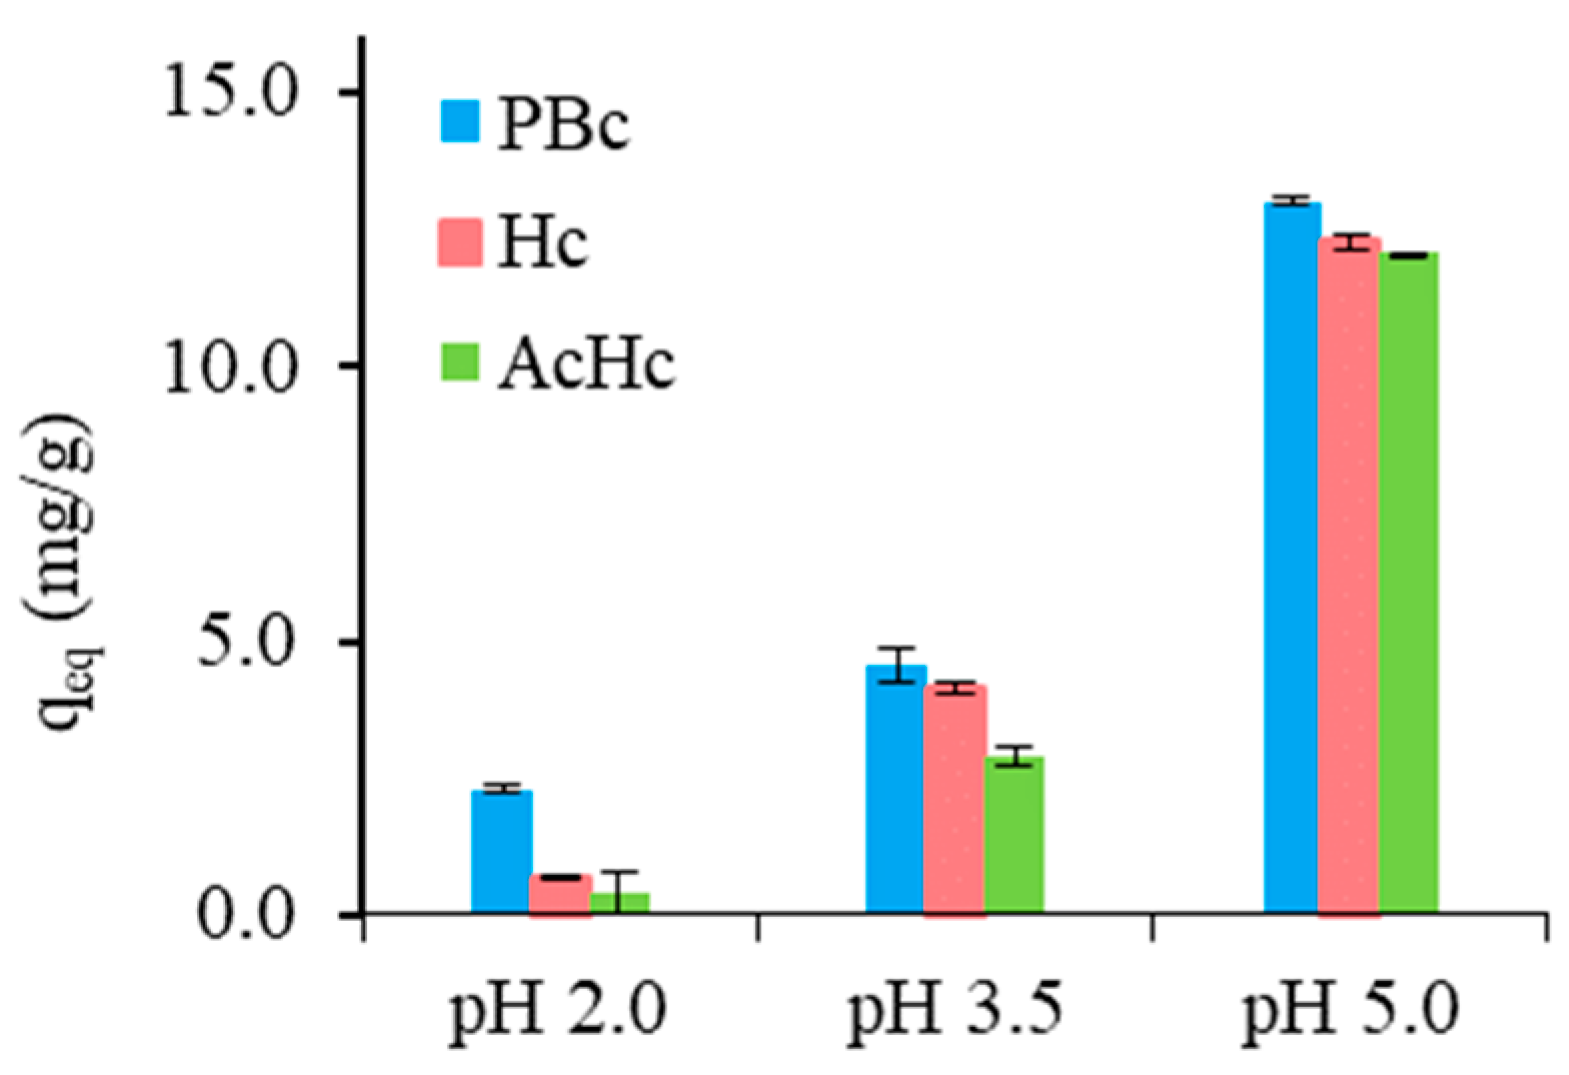
The specific surface area and the porosity are important properties of an adsorbent and, together with the functional groups on the surface, contribute to the removal capacity of pollutants [59]. The BET analysis revealed a specific surface area of 62.3 m2/g and an adsorption volume of 0.0945 cm3/g for PBc, while for Hc, 13.0 m2/g and an adsorption volume of 0.0899 cm3/g (Table 1).
The modest presence of micropores (0.008 cm3/g for PBc and 0 cm3/g for Hc) indicates only a weak activation that can be explained considering the moderate temperature used for the conversion processes (550 °C for pyrolysis and 280 °C for hydrothermal carbonization).
In the case of AcHc, all the porous properties are much improved, and the micropores volume reached values of over 50% of the total pore volume.

3.2. Effect of pH

Lead speciation in aqueous solutions is mostly controlled by pH and redox potential (Eh). Lead Eh–pH diagrams are well documented and easily found in the literature [60,61]. The Pourbaix (or potential/Ph) diagram, which schematically presents the lead speciation in water according to effluent pH, is shown in Figure 5. Until pH around 7, typically found in natural environments, Pb2+ is expected to be dominant in an aqueous solution. The zone between the dotted lines represents the stability zone of water.
As is easy to notice from the diagram, for pH lower than 6, the cationic elementary Pb2+ form dominates the lead speciation in water. Also, the basic pH favors the presence of hydrolyzed lead species as well as precipitation of the lead solution, especially for higher concentrations. For these reasons, the effect of pH on the adsorption capacity of lead was studied in the pH range (2–5) ± 0.5.
All carbonaceous sorbents are effective for lead removal, which greatly influences the pH (Figure 6). The increase in pH entails an increase in the retention of lead ions, equally for PBc, Hc, and AcHc. For pH in the acidic range, the density of negative charges increases on the surface of the carbonaceous sorbent due to carboxyl, amino, or phosphate groups. This negative charge density produces active centers where lead ions can be sequestrated [62]. At the same time, with an increase in pH, the deprotonation of functional groups, mainly carboxylic, occurs, especially for pH 3–5 [63], leading to a reduction of the repulsive forces between H3O+ and Pb2+, which facilitates the retention of lead ions on the active centers formed on the surface of the chars. Considering these aspects, further tests in this work were performed at pH 5 ± 0.5.

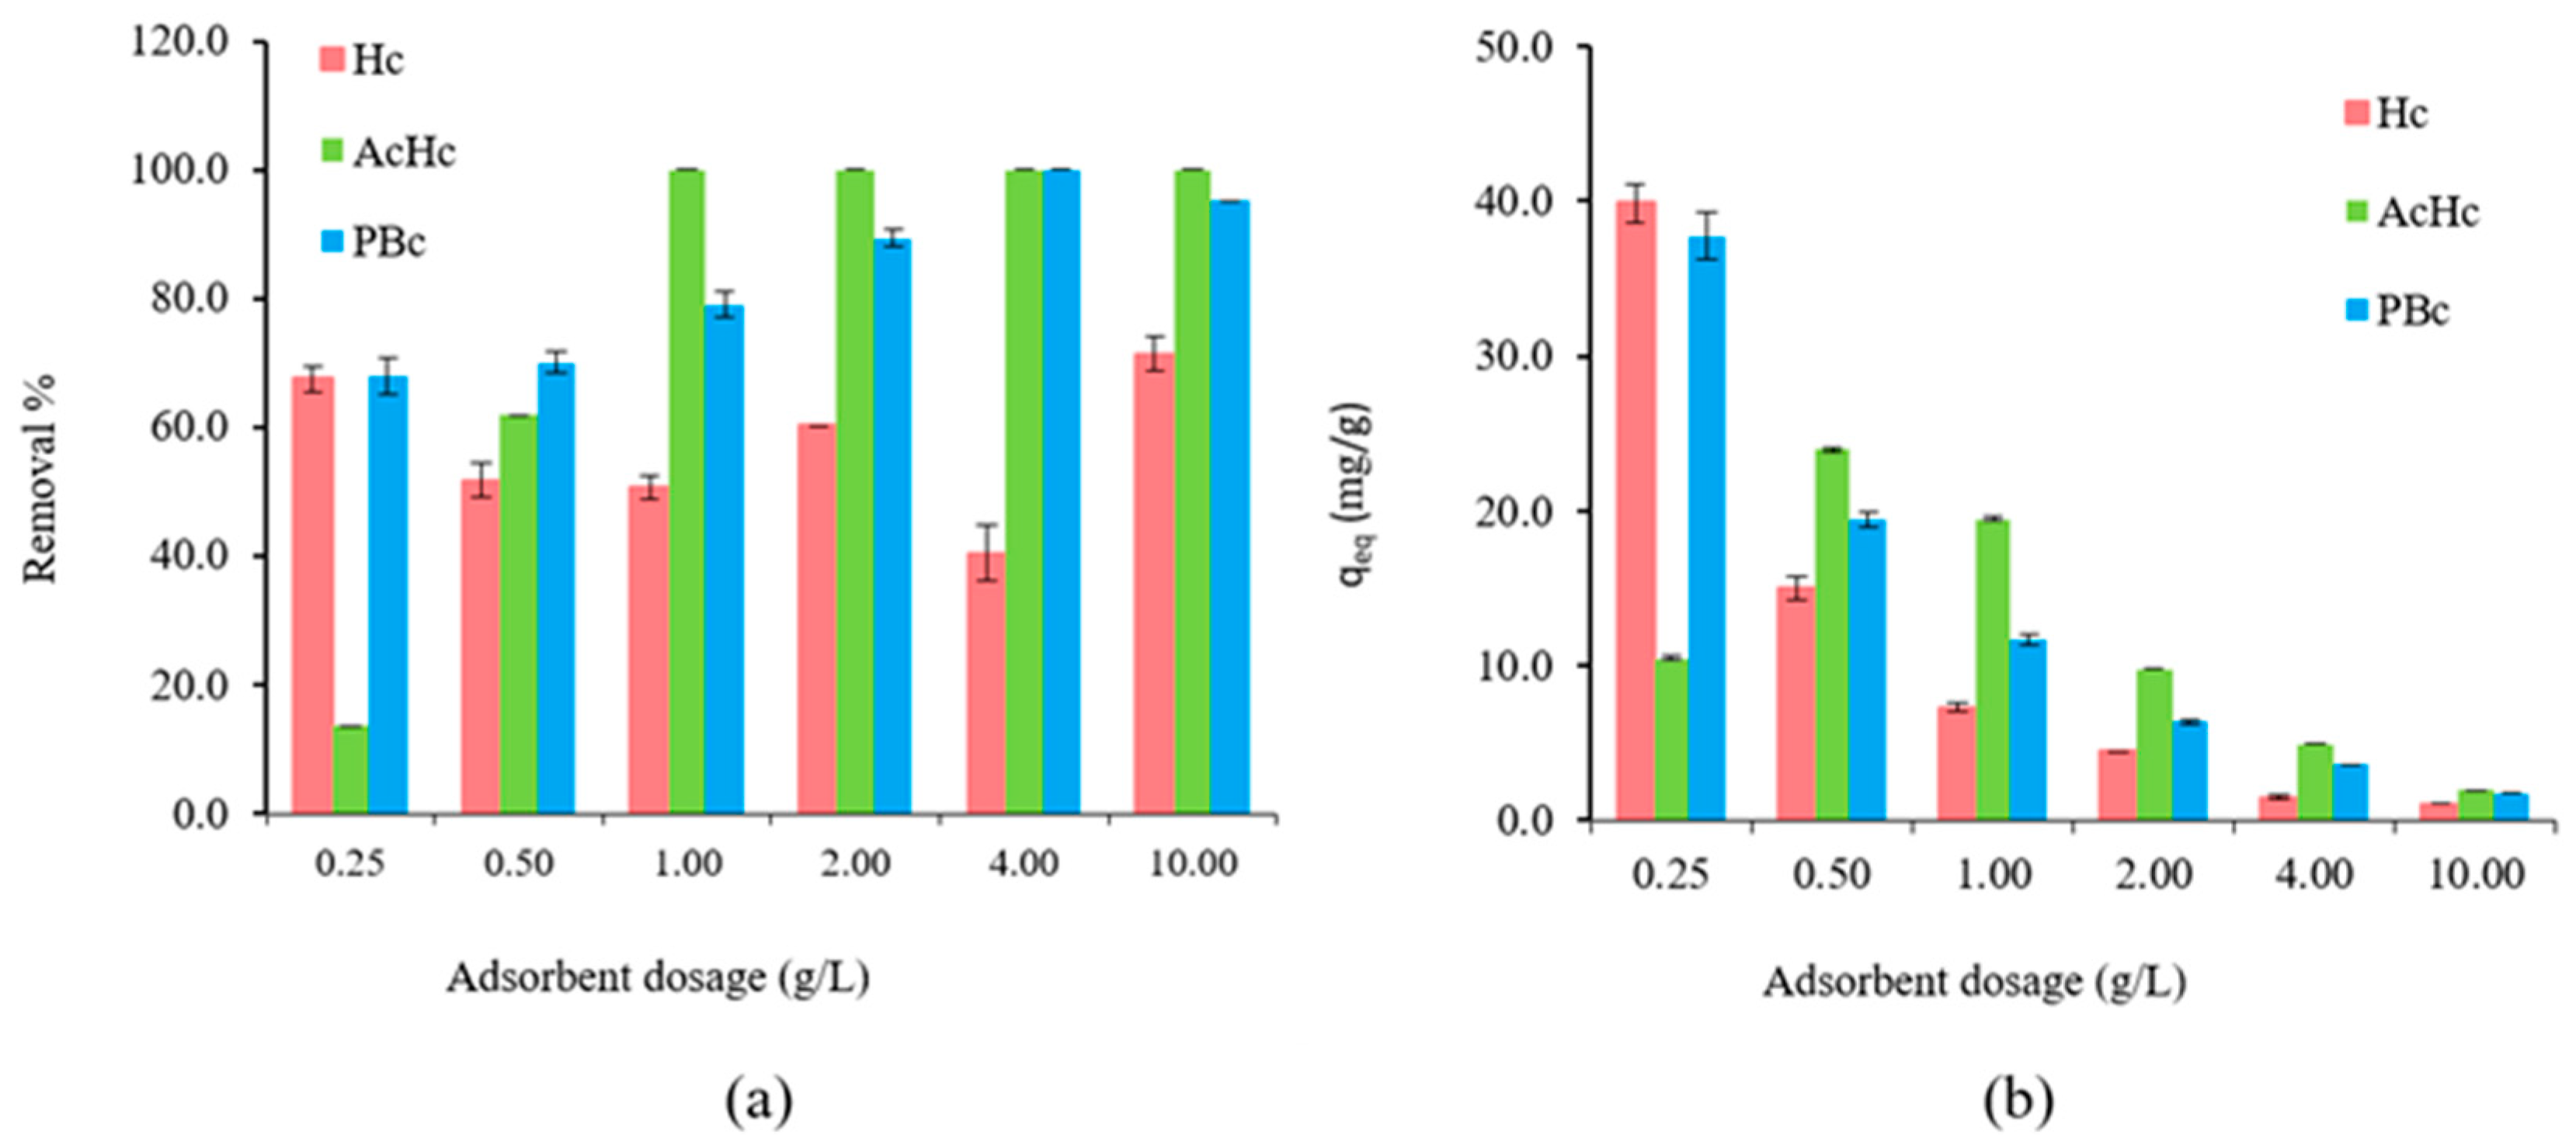
3.3. Adsorbent Dosage Test

Figure 7 depicts the influence of the initial adsorbent dose on lead uptake. The retention percentage is high for all three biosorbents tested, reaching up to 71% for Hc, 99% for PBc, and 100% for AcHc for an adsorbent dosage of 1 g/L biosorbent.
These results correspond to adsorption capacities from 39.9 ± 1.2 mg/g for a solid/liquid ratio of 0.25 g/L to 1.05 ± 0.04 mg/g for 10 g/L for Hc, from 10.5 ± 0.1 mg/g for a solid/liquid ratio of 0.25 g/L to 1.960 ± 0.001 mg/g for 10 g/L for AcHc, respectively 37.8 ± 1.6 mg/g for 0.25 g/L adsorbent dosage to 1.754 ± 0.001 mg/g for 10 g/L for PBc.
Considering the removal efficiency as well as the adsorbed amounts recorded after testing the effect of adsorbent dosage, the solid-to-liquid ratio of 0.5 g/L was selected for future kinetics and equilibrium studies.

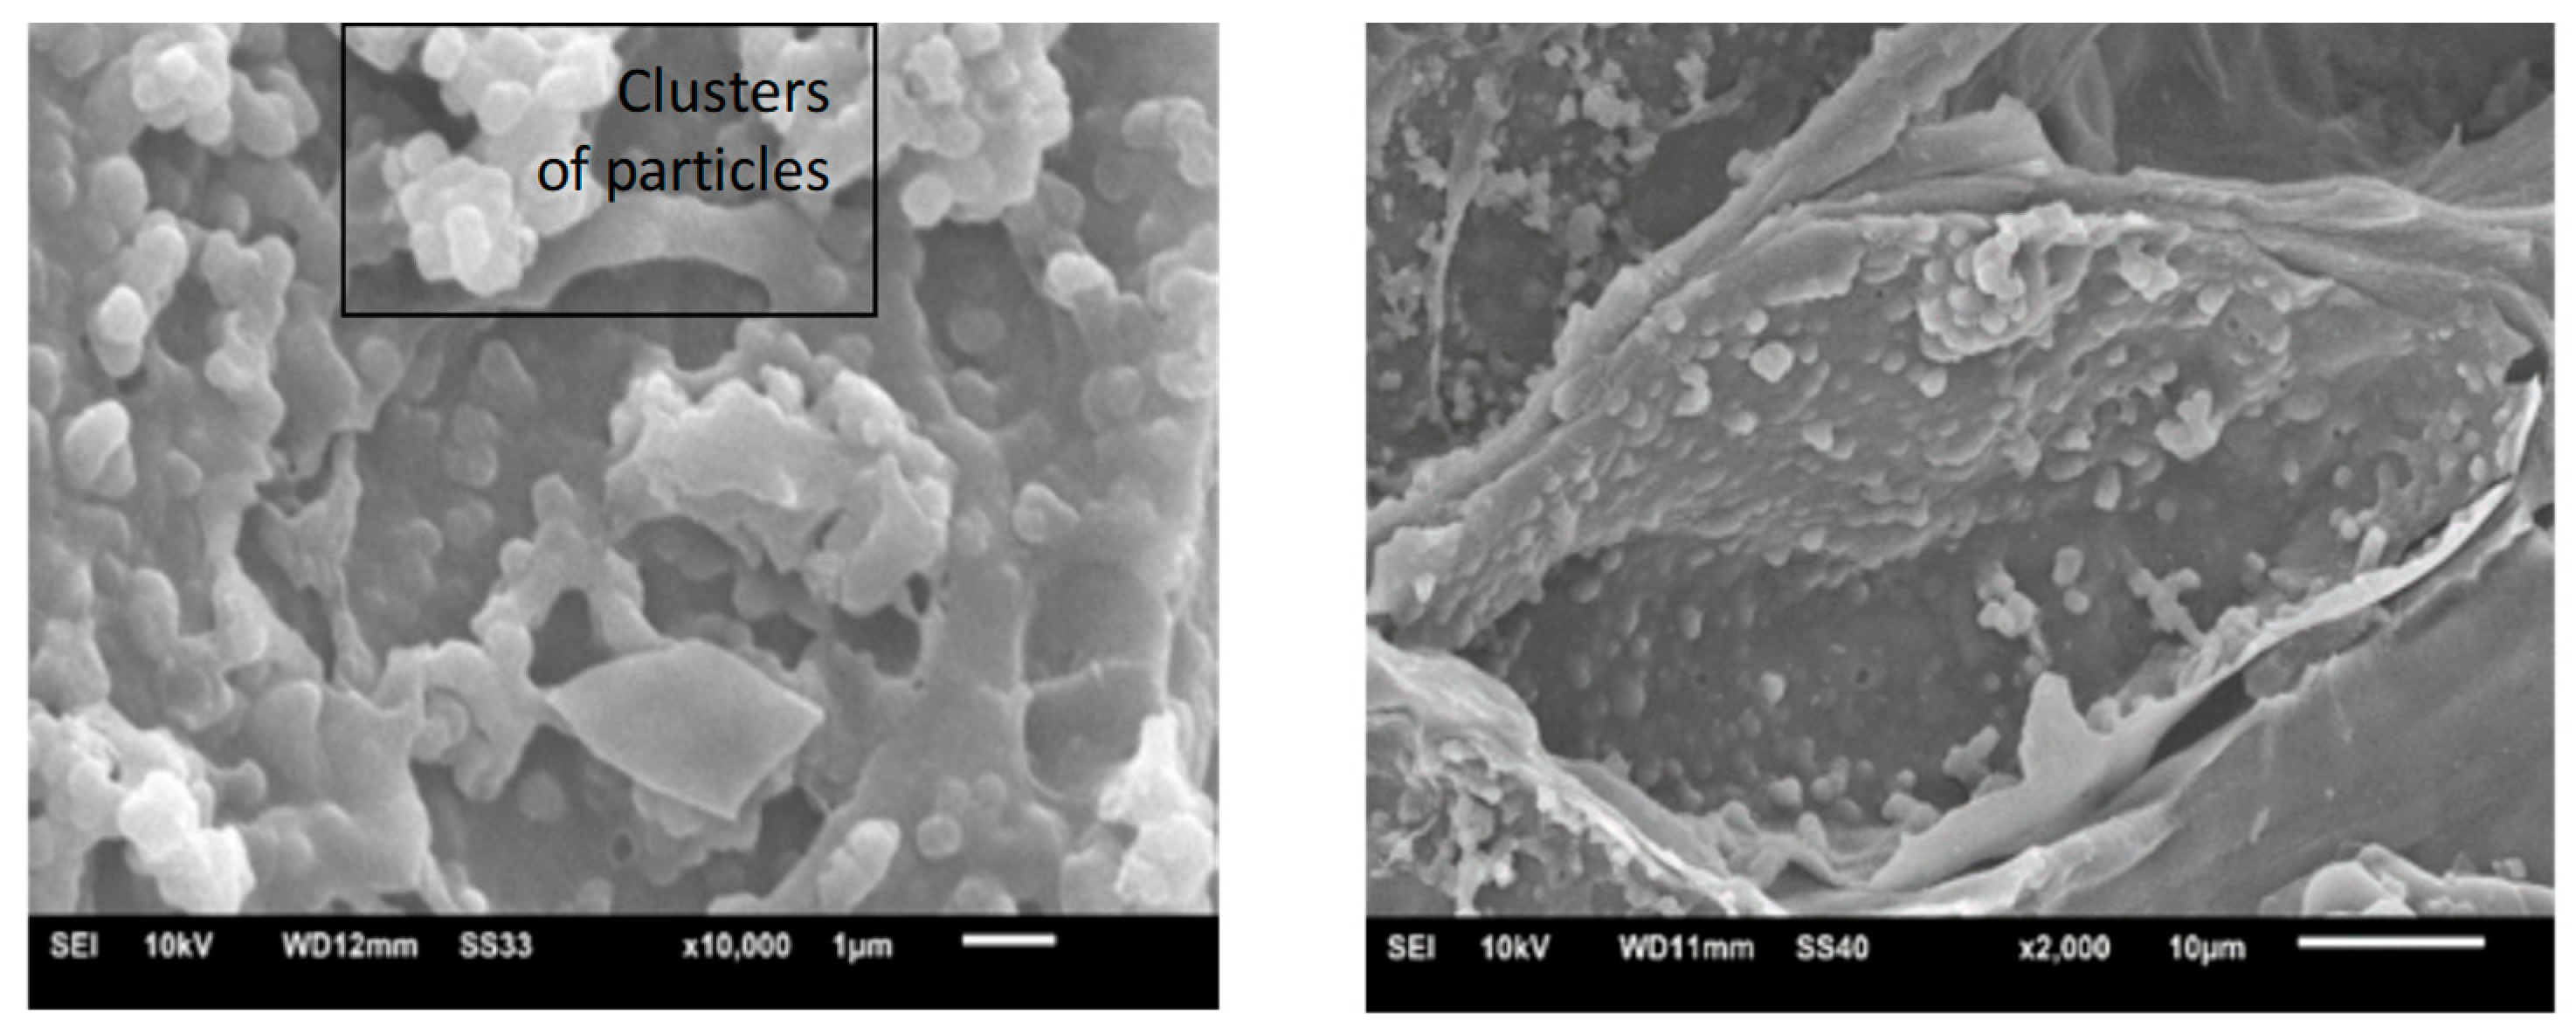
3.4. Morphology of Carbonaceous Materials Loaded with Lead

The surface morphology of carbonaceous materials was also investigated after the adsorption process (Figure 8, Figure 9 and Figure 10). The SEM images proved the lead uptake and, furthermore, the organization of the pollutant depending on the adsorbent morphology. Thus, for PBc, the lead was loaded as cluster particles, Hc retained the pollutant as lamellar lead oxide, while for AcHc, lamellar and hexagonal sheets were observed. Certainly, the chemistry of the carbonaceous materials’ surface affects the way that Pb binds and interacts.
Lead oxide can take a wide variety of forms, including nanoplates, nanodendrites [64], nanorods [65], and sheets or tubes [66]. Pattern development and inter-particle interaction typically have a strong relationship. Stripes, clusters, and other very diverse morphologies result from the competition between repulsive and attractive interactions between particles [67]. Certainly, the chemistry of the carbonaceous materials’ surface affects the way that Pb binds and interacts with them.

3.5. Adsorption Kinetic

The adsorption kinetics give important information on the speed of the mass transfer as well as on the reaching of the equilibrium. The variations of the pollutant concentration studied as a function of time, together with the applied mathematical models, are presented in Figure 11.
The adsorption of lead using carbonaceous materials tested in this work is a fairly fast process. The time required to almost reach the equilibrium was about 60 min for PHc and Hc when around 90% of the maximum amount of adsorbed Pb (II) was already sequestrated. Beyond this time, the adsorption of lead is carried out at a very slow rate and the amount of pollutant retained is very small. For AcHc, the equilibrium time is slightly longer and can be divided into two phases: the first one, until about 120 min, while about 70% of the lead is uptake, and a second longer phase, in which adsorption becomes slower. However, the amount of lead adsorbed by AcHc is considerably higher compared with PBc and Hc.
Lagergren’s (1898) pseudo-first order and pseudo-second order models [68], expressed by Equations (3) and (4), were adjusted to the experimental data by nonlinear regression using CurveExpert Professional software.
q = q e   ( 1 e k 1   t )
q = q e k 2 q e   2   t   1 + k 2 q e t
For both equations, q (mg/g) is the biosorbed amount for a contact time t (min), qe (mg/g) is the biosorbed amount at equilibrium, k1 (1/min) and k2 (g/(mg·min)) the kinetic constants of the models. The information resulting from the fitting of the models to the experimental data is listed in Table 2.
Analyzing the results plotted in Table 2 for all three chars, the pseudo-second order model provides a slightly better match, having lower standard error values, with predicted values of adsorption capacities at equilibrium (qe) near those obtained experimentally and a better correlation coefficient. The pseudo-second order model assumes that the surface of the sorbent is homogeneous and metal binds to two active centers [69].

3.6. Equilibrium Studies

The well-known equilibrium models Langmuir [69] and Freundlich [70] were adapted to the experimental data by nonlinear regression (Figure 12). The Langmuir model is expressed by Equation (5), where Qmax indicates the maximum biosorption capacity and KL is the Langmuir constant.
q e = K L Q m a x C e 1 + K L C e
The Freundlich model is expressed by Equation (6), where KF is a constant for the adsorbent adsorption system, related to the adsorption capacity and nF a constant indicating the adsorption intensity (nF > 1, favorable isotherm; nF ≤ 1, unfavorable isotherm).
q e = K F C e 1 n F
Langmuir model assumes monolayer adsorption and the presence of available positions where biosorption occurs. Each active site can fix only one adsorbate entity. The adsorption energy is equivalent in all active sites and is not dependent on the presence of neighboring adsorbed species. The Freundlich adsorption isotherm is an empirical model expressing surface heterogeneity and the exponential distribution of active sites and their energies.
Table 3 shows the parameters for both models. Standard errors (SE) and correlation coefficient (R) are presented as statistical parameters to assess the quality of model fitting. As can be seen, the Langmuir model better describes the equilibrium data for all biochars analyzed, with better values for correlation coefficient and lower standard errors. The Langmuir model predicted maximum adsorption capacities of 15.94 mg/g for PHc, 9.99 mg/g for Hc, and 37.46 mg/g for AcHc. Freundlich model provided nF values above 1, indicating favorable isotherms.

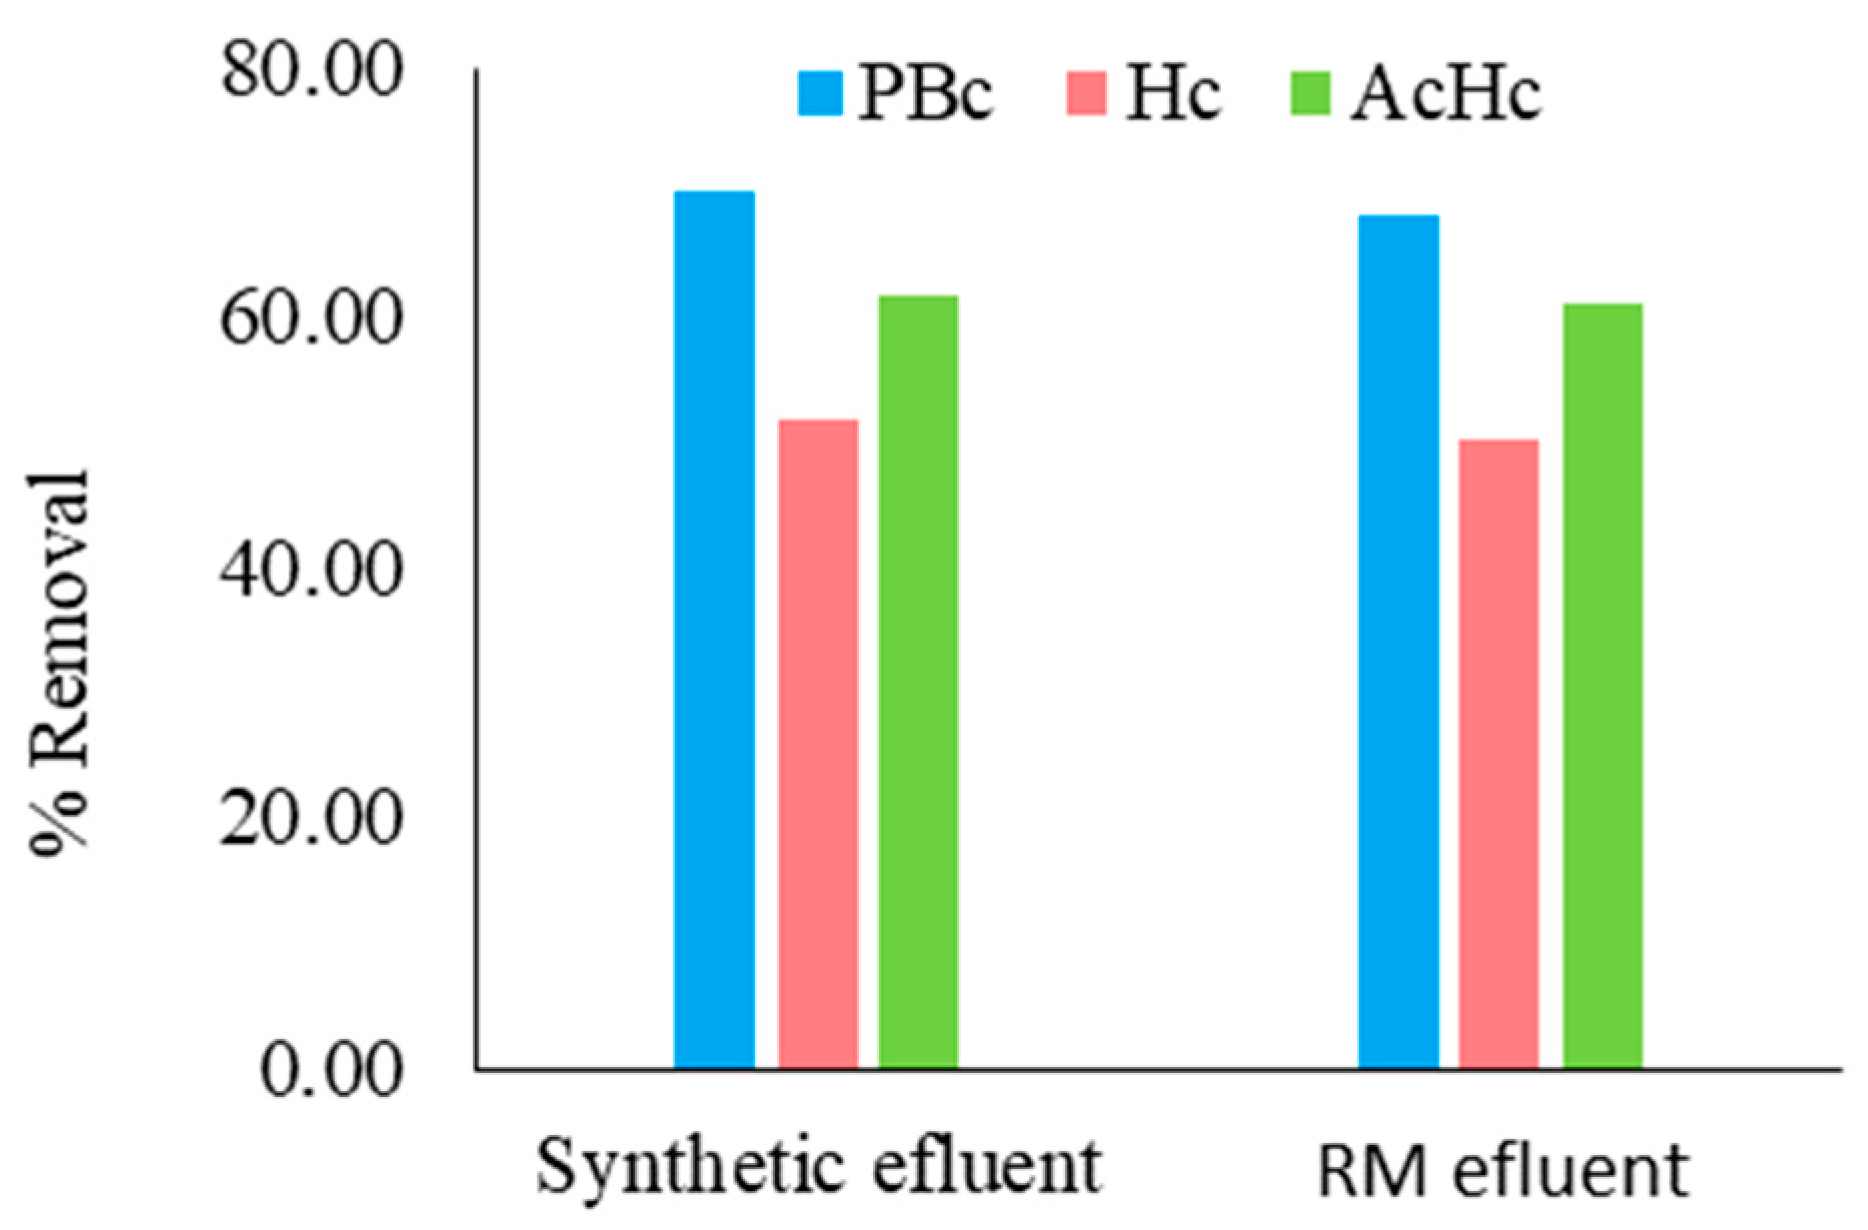
3.7. Mine Wastewater Characterization and Test Results

Lead-bearing wastewater, resulting from various natural sources or human activities, has a complex chemical matrix, and the presence of other ion species could influence the lead adsorption process. In this regard, the carbonaceous materials assessed in this study were tested with real mining effluent. The physical and chemical characterization of this drainage water is presented in Table 4.
In order to obtain data that can be compared with those previously obtained, the mine drainage water was enriched with the lead up to 20 mg/L Pb. The char’s initial concentration was 0.5 g/L, keeping it identical to the other experimental conditions. Even with a significant amount of several heavy metals (Fe, Zn, Cu), the obtained data show an insignificant decrease in the uptake capacity compared to the experiments conducted with synthetic lead solution (Figure 13). Considering the potential use of carbonaceous materials obtained from the thermochemical conversion of spruce bark waste in the removal of hazardous pollutants from industrial wastewater effluents, these findings are more than positive.
Recently, some papers have been published related to the uptake of lead from aqueous streams on biochars, hydrochars, and activated hydrochars. Table 5 highlighted results for different chars obtained from various feedstock (with and without additional treatments applied to increase the adsorption capacity).
As seen from Table 5, the lead adsorption capacities of the bio-based sorbents studied in this work fall within the values obtained for chars derived from a wide variety of feedstocks. The higher values reported in the case of other pyrolytic biochars are due to the chemical changes brought to the biochars subsequent to pyrolysis [23,24,25,26].
The potential reuse of a loaded adsorbent might be an important criterion to consider in the context of the “zero waste” concept as well as in the case of expensive adsorbents. A future study must be carried out in order to establish the suitable eluent and the number of adsorption-desorption cycles that can be achieved until the adsorbent loses its retention capacity and becomes ineffective.

4. Conclusions

Three carbonaceous materials achieved from spruce bark waste conversion (biochar, hydrochar, and activated hydrochar) were tested in batch mode, investigating the effect of pH value, the influence of adsorbent dosage, contact time, and the affinity of the bio-based materials to lead hazardous contamination.
The study was conducted in a range of lead concentrations usually found in industrial aqueous contaminated effluents (20 mg/L).
The characterization of the carbonaceous sorbents revealed a hierarchical porous structure resembling a cellular matrix for all three chars’ types, facilitating the diffusion of lead ions due to a larger contact surface and a higher number of binding sites.
The results demonstrate that all three materials are effective biosorbents for the uptake of lead (II) from wastewater. The maximum adsorption capacities are 15.94 mg/g for PBc, 9.99 mg/g for Hc, and 37.46 mg/g for AcHc at pH 5 and 23 °C.
The Langmuir model best fits the equilibrium results, while the equilibrium was reached in less than 2 h. The pseudo-second order kinetic model better fits biosorption kinetics experimental points.
Considering the FTIR spectra as well as the kinetics, we can assume that the adsorption mechanisms followed by carbonaceous materials studied are different. Thus, the Pb removal occurs mainly on physical adsorption in the case of PBc. At the same time, electrostatic attraction (based on the affinity of OH phenolic groups present on the surface), including coordination, is more likely in the case of Hc and AcHc.
A deeper analysis of the final recovery of lead from the carbonaceous sorbents, either by elution or incineration, should be considered in forthcoming work. More research is needed in continuous mode as well as to improve the circularity of waste.

Author Contributions

Conceptualization, I.V. and G.U.; methodology, G.U. and G.H.; software, I.B.; validation, G.H. and I.V.; formal analysis, G.U., I.B. and G.H.; investigation, G.U., I.B. and G.H.; resources, I.V.; writing—original draft preparation, G.U. and I.B.; writing—review and editing, G.U. and I.B.; visualization, G.H.; supervision, I.V.; project administration, I.V.; funding acquisition, I.V. All authors have read and agreed to the published version of the manuscript.

Funding

This research was supported by a grant from the Ministry of Research, Innovation, and Digitization, CNCS—UEFISCDI, project number PN-III-P4-PCE-2021-1455, within PNCDI III, and the APC was funded by Gheorghe Asachi Technical University of Iasi, Romania.

Data Availability Statement

Not applicable.

Conflicts of Interest

The authors declare no conflict of interest.

References

  1. D8.2 Vision for 1 Billion Dry Tonnes Lignocellulosic Biomass as a Contribution to Biobased Economy by 2030 in Europe. Available online: https://www.s2biom.eu/images/Publications/D8.2_S2Biom_Vision_for_1_billion_tonnes_biomass_2030.pdf (accessed on 14 October 2022).
  2. Skkema, R.; Junginger, M.; van Dam, J.; Stegeman, G.; Durrant, D.; Faaij, A. Legal harvesting, sustainable sourcing and cascaded use of wood for bioenergy: Their coverage through existing certification frameworks for sustainable forest management. Forests 2014, 5, 2163–2211. [Google Scholar] [CrossRef]
  3. Marta, P.; Tomczak, K.; Janiszewska-latterini, D.; Tomczak, A. Management of Forest Residues as a Raw Material for the Production of Particleboards. Forests 2022, 13, 1933. [Google Scholar]
  4. Pandey, S. Wood waste utilization and associated product development from under-utilized low-quality wood and its prospects in Nepal. SN Appl. Sci. 2022, 4, 168. [Google Scholar] [CrossRef]
  5. Grebner, D.L.; Bettinger, P.; Siry, J.P.; Boston, K. Forest products. In Introd. to For. Nat. Resour, 2nd ed.; Elsevier: Amsterdam, The Netherlands, 2022; pp. 101–129. [Google Scholar]
  6. Srivatsav, P.; Bhargav, B.S.; Shanmugasundaram, V.; Arun, J.; Gopinath, K.P.; Bhatnagar, A. Biochar as an eco-friendly and economical adsorbent for the removal of colorants (Dyes) from aqueous environment: A review. Water 2020, 12, 3561. [Google Scholar] [CrossRef]
  7. Singh, R.; Dutta, R.K.; Naik, D.V.; Ray, A.; Kanaujia, P.K. High surface area Eucalyptus wood biochar for the removal of phenol from petroleum refinery wastewater. Environ. Chall. 2021, 5, 100353. [Google Scholar] [CrossRef]
  8. Ponnam, V.; Katari, N.K.; Mandapati, R.N.; Nannapaneni, S.; Tondepu, S.; Jonnalagadda, S.B. Efficacy of biochar in removal of organic pesticide, Bentazone from watershed systems. J. Environ. Sci. Heal. Part B 2020, 55, 396–405. [Google Scholar] [CrossRef]
  9. Li, H.; Qu, R.; Li, C.; Guo, W.; Han, X.; He, F.; Ma, Y.; Xing, B. Selective removal of polycyclic aromatic hydrocarbons (PAHs) from soil washing effluents using biochars produced at different pyrolytic temperatures. Bioresour. Technol. 2014, 163, 193–198. [Google Scholar] [CrossRef]
  10. Krasucka, P.; Pan, B.; Sik Ok, Y.; Mohan, D.; Sarkar, B.; Oleszczuk, P. Engineered biochar—A sustainable solution for the removal of antibiotics from water. Chem. Eng. J. 2021, 405, 126926. [Google Scholar] [CrossRef]
  11. Li, X.; Zhao, C.; Zhang, M. Chapter 8—Biochar for Anionic Contaminants Removal From Water. In Biochar from Biomass and Waste; Ok, Y.S., Tsang, D.C.W., Bolan, N., Novak, J.M., Eds.; Elsevier: Amsterdam, The Netherlands, 2019; pp. 143–160. ISBN 978-0-12-811729-3. [Google Scholar]
  12. Qiu, M.; Liu, L.; Ling, Q.; Cai, Y.; Yu, S.; Wang, S.; Fu, D.; Hu, B.; Wang, X. Biochar for the removal of contaminants from soil and water: A review. Biochar 2022, 4, 19. [Google Scholar] [CrossRef]
  13. López-Salas, N.; Antonietti, M. Carbonaceous Materials: The Beauty of Simplicity. Bull. Chem. Soc. Jpn. 2021, 94, 2822–2828. [Google Scholar] [CrossRef]
  14. Yang, X.; Wan, Y.; Zheng, Y.; He, F.; Yu, Z.; Huang, J.; Wang, H.; Ok, Y.S.; Jiang, Y.; Gao, B. Surface functional groups of carbon-based adsorbents and their roles in the removal of heavy metals from aqueous solutions: A critical review. Chem. Eng. J. 2019, 366, 608–621. [Google Scholar] [CrossRef] [PubMed]
  15. Ahmad, M.; Rajapaksha, A.U.; Lim, J.E.; Zhang, M.; Bolan, N.; Mohan, D.; Vithanage, M.; Lee, S.S.; Ok, Y.S. Biochar as a sorbent for contaminant management in soil and water: A review. Chemosphere 2014, 99, 19–33. [Google Scholar] [CrossRef] [PubMed]
  16. Funke, A.; Ziegler, F. Hydrothermal carbonization of biomass: A summary and discussion of chemical mechanisms for process engineering. Biofuels Bioprod. Biorefining 2010, 4, 160–177. [Google Scholar] [CrossRef]
  17. Zhang, Z.; Zhu, Z.; Shen, B.; Liu, L. Insights into biochar and hydrochar production and applications: A review. Energy 2019, 171, 581–598. [Google Scholar] [CrossRef]
  18. Ahmad, A.; Azam, T. 4.8.8.4—Activated Carbon. In Bottled and Packaged Water, 1st ed.; Grumezescu, A.M., Holban, A.M., Eds.; The Science of Beverages; Elsevier: Amsterdam, The Netherlands, 2019; Volume 4, pp. 83–120. [Google Scholar]
  19. Sun, T.; Xu, Y.; Sun, Y.; Wang, L.; Liang, X.; Jia, H. Crayfish shell biochar for the mitigation of Pb contaminated water and soil: Characteristics, mechanisms, and applications. Environ. Pollut. 2021, 271, 116308. [Google Scholar] [CrossRef] [PubMed]
  20. Jin, Q.; Wang, Z.; Feng, Y.; Kim, Y.T.; Stewart, A.C.; O’Keefe, S.F.; Neilson, A.P.; He, Z.; Huang, H. Grape pomace and its secondary waste management: Biochar production for a broad range of lead (Pb) removal from water. Environ. Res. 2020, 186, 109442. [Google Scholar] [CrossRef]
  21. Liu, J.; Huang, Z.; Chen, Z.; Sun, J.; Gao, Y.; Wu, E. Resource utilization of swine sludge to prepare modified biochar adsorbent for the efficient removal of Pb(II) from water. J. Clean. Prod. 2020, 257, 120322. [Google Scholar] [CrossRef]
  22. Zahedifar, M.; Seyedi, N.; Shafiei, S.; Basij, M. Surface-modified magnetic biochar: Highly efficient adsorbents for removal of Pb(ΙΙ) and Cd(ΙΙ). Mater. Chem. Phys. 2021, 271, 124860. [Google Scholar] [CrossRef]
  23. Zhao, T.; Yao, Y.; Li, D.; Wu, F.; Zhang, C.; Gao, B. Facile low-temperature one-step synthesis of pomelo peel biochar under air atmosphere and its adsorption behaviors for Ag(I) and Pb(II). Sci. Total Environ. 2018, 640–641, 73–79. [Google Scholar] [CrossRef]
  24. Wan, S.; Wu, J.; Zhou, S.; Wang, R.; Gao, B.; He, F. Enhanced lead and cadmium removal using biochar-supported hydrated manganese oxide (HMO) nanoparticles: Behavior and mechanism. Sci. Total Environ. 2018, 616–617, 1298–1306. [Google Scholar] [CrossRef]
  25. Wang, Q.; Wang, B.; Lee, X.; Lehmann, J.; Gao, B. Sorption and desorption of Pb(II) to biochar as affected by oxidation and pH. Sci. Total Environ. 2018, 634, 188–194. [Google Scholar] [CrossRef] [PubMed]
  26. Jimenez, G.D.; Monti, T.; Titman, J.J.; Hernandez-Montoya, V.; Kingman, S.W.; Binner, E.R. New insights into microwave pyrolysis of biomass: Preparation of carbon-based products from pecan nutshells and their application in wastewater treatment. J. Anal. Appl. Pyrolysis 2017, 124, 113–121. [Google Scholar] [CrossRef]
  27. Xiang, W.; Zhang, X.; Chen, J.; Zou, W.; He, F.; Hu, X.; Tsang, D.C.W.; Ok, Y.S.; Gao, B. Biochar technology in wastewater treatment: A critical review. Chemosphere 2020, 252, 126539. [Google Scholar] [CrossRef] [PubMed]
  28. Xue, Y.; Gao, B.; Yao, Y.; Inyang, M.; Zhang, M.; Zimmerman, A.R.; Ro, K.S. Hydrogen peroxide modification enhances the ability of biochar (hydrochar) produced from hydrothermal carbonization of peanut hull to remove aqueous heavy metals: Batch and column tests. Chem. Eng. J. 2012, 200–202, 673–680. [Google Scholar] [CrossRef]
  29. Li, B.; Guo, J.-Z.; Liu, J.-L.; Fang, L.; Lv, J.-Q.; Lv, K. Removal of aqueous-phase lead ions by dithiocarbamate-modified hydrochar. Sci. Total Environ. 2020, 714, 136897. [Google Scholar] [CrossRef]
  30. Xia, Y.; Yang, T.; Zhu, N.; Li, D.; Chen, Z.; Lang, Q.; Liu, Z.; Jiao, W. Enhanced adsorption of Pb(II) onto modified hydrochar: Modeling and mechanism analysis. Bioresour. Technol. 2019, 288, 1–8. [Google Scholar] [CrossRef]
  31. Babeker, T.M.A.; Chen, Q. Heavy Metal Removal from Wastewater by Adsorption with Hydrochar Derived from Biomass: Current Applications and Research Trends. Curr. Pollut. Rep. 2021, 7, 54–71. [Google Scholar] [CrossRef]
  32. Shi, Q.; Terracciano, A.; Zhao, Y.; Wei, C.; Christodoulatos, C.; Meng, X. Evaluation of metal oxides and activated carbon for lead removal: Kinetics, isotherms, column tests, and the role of co-existing ions. Sci. Total Environ. 2019, 648, 176–183. [Google Scholar] [CrossRef]
  33. Momčilović, M.; Purenović, M.; Bojić, A.; Zarubica, A.; Ranđelović, M. Removal of lead(II) ions from aqueous solutions by adsorption onto pine cone activated carbon. Desalination 2011, 276, 53–59. [Google Scholar] [CrossRef]
  34. Alguacil, F.J.; Alcaraz, L.; García-Díaz, I.; López, F.A. Removal of Pb2+ in Wastewater via Adsorption onto an Activated Carbon Produced from Winemaking Waste. Metals 2018, 8, 697. [Google Scholar] [CrossRef] [Green Version]
  35. Shi, Q.; Sterbinsky, G.E.; Prigiobbe, V.; Meng, X. Mechanistic Study of Lead Adsorption on Activated Carbon. Langmuir 2018, 34, 13565–13573. [Google Scholar] [CrossRef] [PubMed]
  36. Dermentzis, K.; Valsamidou, E.; Marmanis, D. Simultaneous removal of acidity and lead from acid lead battery wastewater by aluminum and iron electrocoagulation. J. Eng. Sci. Technol. Rev. 2012, 5, 1–5. [Google Scholar] [CrossRef]
  37. Mondal, M.K. Removal of Pb(II) from industrial wastewater by using various natural materials—A review. Int. J. Sustain. Dev. Plan. 2008, 3, 377–393. [Google Scholar] [CrossRef]
  38. IARC Monographs on the Identification of Carcinogenic Hazards to Humans. Available online: https://monographs.iarc.who.int/agents-classified-by-the-iarc/ (accessed on 18 October 2022).
  39. Segurança Quimica. Available online: https://www.chemicalrisk.com.br/toxicologia-do-chumbo/ (accessed on 19 October 2022).
  40. Lazar, L.; Talmaciu, A.I.; Volf, I.; Popa, V.I. Kinetic modeling of the ultrasound-assisted extraction of polyphenols from Picea abies bark. Ultrason. Sonochem. 2016, 32, 191–197. [Google Scholar] [CrossRef]
  41. Bejenari, I.; Hristea, G.; Cărăușu, C.; Mija, A.; Volf, I. A Sustainable Approach on Spruce Bark Waste Valorization through Hydrothermal Conversion. Processes 2022, 10, 111. [Google Scholar] [CrossRef]
  42. Radjy, F.; Sellevold, E.J. A phenomenological theory for the t-method of pore structure analysis: I. Slit-shaped pores. J. Colloid Interface Sci. 1972, 39, 367–378. [Google Scholar] [CrossRef]
  43. Martins, B.L.L.; Cruz, C.C.V.; Luna, A.S.; Henriques, C.A. Sorption and desorption of Pb2+ ions by dead Sargassum sp. biomass. Biochem. Eng. J. 2006, 27, 310–314. [Google Scholar] [CrossRef]
  44. Yang, J.; Volesky, B. Intraparticle diffusivity of Cd ions in a new biosorbent material. J. Chem. Technol. Biotechnol. 1996, 66, 355–364. [Google Scholar] [CrossRef]
  45. Ungureanu, G.; Santos, S.C.R.; Volf, I.; Boaventura, R.A.R.; Botelho, C.M.S. Biosorption of antimony oxyanions by brown seaweeds: Batch and column studies. J. Environ. Chem. Eng. 2017, 5, 3463–3471. [Google Scholar] [CrossRef]
  46. Mansoorian, H.J.; Mahvi, A.H.; Jafari, A.J. Removal of lead and zinc from battery industry wastewater using electrocoagulation process: Influence of direct and alternating current by using iron and stainless steel rod electrodes. Sep. Purif. Technol. 2014, 135, 165–175. [Google Scholar] [CrossRef]
  47. Karimi, H. Effect of pH and Initial pb(II) Concentration on The Lead Removal Efficiency from Industrial Wastewater Using Ca(OH)2. Int. J. Water Wastewater Treat. 2017, 3, 1–4. [Google Scholar] [CrossRef]
  48. Bouras, M.; Grimi, N.; Bals, O.; Vorobiev, E. Impact of pulsed electric fields on polyphenols extraction from Norway spruce bark. Ind. Crops Prod. 2016, 80, 50–58. [Google Scholar] [CrossRef]
  49. Boeriu, C.G.; Bravo, D.; Gosselink, R.J.A.; van Dam, J.E.G. Characterisation of structure-dependent functional properties of lignin with infrared spectroscopy. Ind. Crops Prod. 2004, 20, 205–218. [Google Scholar] [CrossRef]
  50. Chupin, L.; Motillon, C.; Charrier-El Bouhtoury, F.; Pizzi, A.; Charrier, B. Characterisation of maritime pine (Pinus pinaster) bark tannins extracted under different conditions by spectroscopic methods, FTIR and HPLC. Ind. Crops Prod. 2013, 49, 897–903. [Google Scholar] [CrossRef]
  51. Ping, L.; Pizzi, A.; Guo, Z.D.; Brosse, N. Condensed tannins from grape pomace: Characterization by FTIR and MALDI TOF and production of environment friendly wood adhesive. Ind. Crops Prod. 2012, 40, 13–20. [Google Scholar] [CrossRef]
  52. Soto, R.; Freer, J.; Baeza, J. Evidence of chemical reactions between di- and poly-glycidyl ether resins and tannins isolated from Pinus radiata D. Don bark. Bioresour. Technol. 2005, 96, 95–101. [Google Scholar] [CrossRef]
  53. Parshetti, G.K.; Kent Hoekman, S.; Balasubramanian, R. Chemical, structural and combustion characteristics of carbonaceous products obtained by hydrothermal carbonization of palm empty fruit bunches. Bioresour. Technol. 2013, 135, 683–689. [Google Scholar] [CrossRef]
  54. Wu, Q.; Yu, S.; Hao, N.; Wells, T.; Meng, X.; Li, M.; Pu, Y.; Liu, S.; Ragauskas, A.J. Characterization of products from hydrothermal carbonization of pine. Bioresour. Technol. 2017, 244, 78–83. [Google Scholar] [CrossRef]
  55. Gao, P.; Zhou, Y.; Meng, F.; Zhang, Y.; Liu, Z.; Zhang, W.; Xue, G. Preparation and characterization of hydrochar from waste eucalyptus bark by hydrothermal carbonization. Energy 2016, 97, 238–245. [Google Scholar] [CrossRef]
  56. Cai, J.; Li, B.; Chen, C.; Wang, J.; Zhao, M.; Zhang, K. Hydrothermal carbonization of tobacco stalk for fuel application. Bioresour. Technol. 2016, 220, 305–311. [Google Scholar] [CrossRef] [Green Version]
  57. Dirckx, O.; Triboulot-Trouy, M.C.; Merlin, A.; Deglise, X. Modifications de la couleur du bois d’Abies grandis exposé à la lumière solaire. Ann. For. Sci. 1992, 49, 425–447. [Google Scholar] [CrossRef]
  58. Bejenari, I.; Dinu, R.; Montes, S.; Volf, I.; Mija, A. Hydrothermal carbon as reactive fillers to produce sustainable biocomposites with aromatic bio-based epoxy resins. Polymers 2021, 13, 240. [Google Scholar] [CrossRef] [PubMed]
  59. Ungureanu, G.; Patrautanu, O.A.; Volf, I. A bio-based carbon rich material for efficient remediation of environmental hazardous. Comptes Rendus. Chim. 2022, 25, 153–163. [Google Scholar] [CrossRef]
  60. Takeno, N. Atlas of Eh-pH diagrams Intercomparison of thermodynamic databases. Natl. Inst. Adv. Ind. Sci. Technol. Tokyo 2005, 285, 1–287. [Google Scholar]
  61. Lead. Available online: https://www.wikidoc.org/index.php/Lead (accessed on 19 October 2022).
  62. Ramteke, L.P.; Gogate, P.R. Removal of Copper and Hexavalent Chromium Using Immobilized Modified Sludge Biomass Based Adsorbent. CLEAN—Soil Air Water 2016, 44, 1051–1065. [Google Scholar] [CrossRef]
  63. da Silva Veiga, P.A.; Schultz, J.; da Silva Matos, T.T.; Fornari, M.R.; Costa, T.G.; Meurer, L.; Mangrich, A.S. Production of high-performance biochar using a simple and low-cost method: Optimization of pyrolysis parameters and evaluation for water treatment. J. Anal. Appl. Pyrolysis 2020, 148, 104823. [Google Scholar] [CrossRef]
  64. Chen, K.-C.; Wang, C.-W.; Lee, Y.-I.; Liu, H.-G. Nanoplates and nanostars of β-PbO formed at the air/water interface. Colloids Surfaces A Physicochem. Eng. Asp. 2011, 373, 124–129. [Google Scholar] [CrossRef]
  65. Ghasemi, S.; Mousavi, M.F.; Shamsipur, M.; Karami, H. Sonochemical-assisted synthesis of nano-structured lead dioxide. Ultrason. Sonochem. 2008, 15, 448–455. [Google Scholar] [CrossRef]
  66. Shi, L.; Xu, Y.; Li, Q. Controlled Growth of Lead Oxide Nanosheets, Scrolled Nanotubes, and Nanorods. Cryst. Growth Des. 2008, 8, 3521–3525. [Google Scholar] [CrossRef]
  67. Zhao, H.J.; Misko, V.R.; Peeters, F.M. Analysis of pattern formation in systems with competing range interactions. New J. Phys. 2012, 14, 063032. [Google Scholar] [CrossRef]
  68. Ho, Y.S.; Wase, D.A.; Forster, C.F. Kinetic studies of competitive heavy metal adsorption by sphagnum moss peat. Environ. Techolog. 1996, 17, 71–77. [Google Scholar] [CrossRef]
  69. Langmuir, I. The adsorption of gases on plane surfaces of glass, mica and platinum. J. Am. Chem. Soc. 1918, 40, 1361–1403. [Google Scholar] [CrossRef]
  70. Freundlich, H.M.F. Over the adsorption in solution. J. Phys. Chem. 1906, 57, 385–471. [Google Scholar]
  71. Petrović, J.T.; Stojanović, M.D.; Milojković, J.V.; Petrović, M.S.; Šoštarić, T.D.; Laušević, M.D.; Mihajlović, M.L. Alkali modified hydrochar of grape pomace as a perspective adsorbent of Pb2+ from aqueous solution. J. Environ. Manag. 2016, 182, 292–300. [Google Scholar] [CrossRef] [PubMed]
  72. Luo, X.; Huang, Z.; Lin, J.; Li, X.; Qiu, J.; Liu, J.; Mao, X. Hydrothermal carbonization of sewage sludge and in-situ preparation of hydrochar/MgAl-layered double hydroxides composites for adsorption of Pb(II). J. Clean. Prod. 2020, 258, 120991. [Google Scholar] [CrossRef]
  73. Yang, W.; Wang, Z.; Song, S.; Han, J.; Chen, H.; Wang, X.; Sun, R.; Cheng, J. Adsorption of copper(II) and lead(II) from seawater using hydrothermal biochar derived from Enteromorpha. Mar. Pollut. Bull. 2019, 149, 110586. [Google Scholar] [CrossRef]
Figure 1. FTIR spectra of studied biosorbents.
Forests 13 02080 g001
Figure 2. SEM image of PBc (a) and corresponding elemental chemical analysis, EDX (b).
Forests 13 02080 g002
Figure 3. SEM image of Hc (a) and corresponding elemental chemical analysis, EDX (b).
Forests 13 02080 g003
Figure 4. SEM image of AcHc (a) and corresponding elemental chemical analysis, EDX (b).
Forests 13 02080 g004
Figure 5. The Pourbaix diagram of lead in water [61].
Forests 13 02080 g005
Figure 6. Effect of pH on Pb(II) adsorption (±global uncertainty), C0 = 20 mg/L Pb(II), Cs = 0.5 g/L sorbent, T = 23 ± 1 °C, 4 h contact time.
Forests 13 02080 g006
Figure 7. Removal efficiency (a) and adsorbed amount (b) (±global uncertainty) by PBc, Hc, and AcHc at different adsorbent concentrations, C0 = 20 mg/L Pb(II), pH = 5 ± 0.5, T = 23 ± 1 °C, 4 h contact time.
Forests 13 02080 g007
Figure 8. SEM image of PBc—Pb2+ loaded (cluster particles).
Forests 13 02080 g008
Figure 9. SEM image of Hc—Pb2+ loaded (lamellar lead oxide).
Forests 13 02080 g009
Figure 10. SEM image of Ac-Hc—Pb2+ loaded (lamellar and hexagonal sheets).
Forests 13 02080 g010
Figure 11. Kinetics for Pb (II) biosorption on PBc, Hc, and AcHc (values ± global uncertainty) at C0 = 20 mg/L Pb(II), Cs = 0.5 g/L biochar dosage, T = 23 ± 1 °C: experimental data and pseudo-first (1st) and pseudo-second (2nd) order model.
Forests 13 02080 g011
Figure 12. Isotherms for Pb (II) biosorption on PHc, Hc, and AcHc (values ± global uncertainty) at different C0 of Pb(II), Cs = 0.5 g/L biochar dosage, T = 23 ± 1 °C, 4 h contact time: experimental data and Langmuir and Freundlich model.
Forests 13 02080 g012
Figure 13. The removal efficiency of lead on synthetic effluent and Rosia Montana mine drainage water (RM), C0 = 20 mg/L Pb(II), Cs = 0.5 g/L char, T = 23 ± 1 °C, 4 h contact time.
Forests 13 02080 g013
Table 1. Specific surface area and porosity of chars.
SamplesSBET,
m2/g
VS,
cm3/g
Vmi,
cm3/g
Vme,
cm3/g
PBc62.30.09450.0080.0865
Hc130.089900.0899
AcHc7480.3880.2700.118
Where: Vs—nitrogen adsorption volume; Vmi—micropores volume; Vme—mesopores volume.
Table 2. Parameters obtained from kinetic model fittings (value ± standard error of the coefficient).
Pseudo—1st Order ModelPseudo—2nd Order Model
k1 (1/min)qe (mg/g)RSEk2 103 (g/mg· min)qe (mg/g)RSE
PBc0.2 ± 0.113.79 ± 1.110.472.800.015 ± 0.00914.9 ± 1.10.702.28
Hc0.39 ± 0.1810.54 ± 0.480.951.260.06 ± 0.0310.92 ± 0.490.961.09
AcHc0.015 ± 0.00427.93 ± 2.150.953.590.0007 ± 0.000231.25 ± 2.190.972.63
Table 3. Parameters obtained from equilibrium model fittings (value ± standard error of the coefficient).
Langmuir ModelFreundlich Model
Qmax (mg/g)KL (L/mg)RSEnFKF (mg/g(mg/L)−1/nF)RSE
PHc15.94 ± 1.680.28 ± 0.180.752.345.8 ± 3.67.3 ± 2.90.563.12
Hc9.9900 ± 0.00010.0167 ± 0.00010.990.0041.7 ± 0.20.43 ± 0.090.990.27
AcHc37.455 ± 0.0010.2449 ± 0.00030.990.0014.76 ± 0.9714.62 ± 2.360.913.14
Table 4. Chemical characterization of Rosia Montana drainage water.
ParameterValue
pH2.62
Colourreddish
Visual aspectturbid with sediment
Li (mg/L)<0.01
Mg (mg/L)>50
Zn (mg/L)19.7
Cu (mg/L)1.02
Fe (mg/L)124.03
Ni (µg/L)0.67
Pb (mg/L)0.02
Cd (mg/L)0.04
Sb (µg/L)21
Se (µg/L)13
As (µg/L)139
Cr (mg/L)0.03
Table 5. The lead adsorption capacity for PBc, Hc, and AcHc was obtained from various feedstocks.
Lead Adsorption Capacity (mg/g)
Pyrolytic BiocharHydrocharActivated HydrocharReferences
15.949.9937.46Present study
88.7 (modified)--[23]
36 (modified)--[24]
43.3 (modified)--[25]
80.3 (modified)--[26]
-22.82-[28]
-2.20-[30]
-27.8-[71]
-0.88-[28]
--151.51[29]
--92.82[30]
--137.0[71]
--62.44[72]
--98.0[73]
--22.82[28]
Publisher’s Note: MDPI stays neutral with regard to jurisdictional claims in published maps and institutional affiliations.

