Article

Observed and Predicted Geographic Distribution of Acer monspessulanum L. Using the MaxEnt Model in the Context of Climate Change

1
Laboratory of Management and Valorisation of Forest Resources, The National Research Institute of Rural Engineering, Water, and Forestry (INRGREF), University of Carthage, Av. Hedi Karray, BP 10, Ariana 2080, Tunisia
2
Mediterranean Center for Environmental Studies (CEAM Foundation), Joint Research Unit University of Alicante-CEAM, Ctra. Sant Vicent del Raspeig s/n, Sant Vicent del Raspeig, 03690 Alicante, Spain
3
Department of Ecology, University of Alicante, Ctra. Sant Vicent del Raspeig s/n, Sant Vicent del Raspeig, 03690 Alicante, Spain
4
Multidisciplinary Institute for Environmental Studies (IMEM), Ctra. Sant Vicent del Raspeig s/n, Sant Vicent del Raspeig, 03690 Alicante, Spain
*
Author to whom correspondence should be addressed.
Forests 2022, 13(12), 2049; https://doi.org/10.3390/f13122049
Submission received: 1 October 2022 / Revised: 3 November 2022 / Accepted: 21 November 2022 / Published: 2 December 2022
(This article belongs to the Section Forest Inventory, Modeling and Remote Sensing)

Abstract

:
Acer monspessulanum (Montpellier Maple) is an important deciduous tree species native to the Mediterranean region. It is largely distributed in the southern part of western Europe; however, it is geographically less present in north Africa and western Asia. The effects of the most significant environmental variables for its habitat suitability, and climate change, are unclear in terms of the future changes to its distribution. The objective of the present study was to model the current and future geographical potential distribution of the Montpellier Maple in the Mediterranean basin and West Asia using maximum entropy modeling software (MaxEnt). The value of the Area Under the Curve (AUC) of MaxEnt was used to analyze the model’s performance. More than 5800 well-distributed presence points, elevation, slope, aspect, topographic wetness index (TWI), natural vegetation characteristics from MODIS products, and 19 bioclimatic variables were used to conduct the study. Regarding the projections of the species distribution under climate change, 17 global climatic models were used under two RCP scenarios (4.5 and 8.5) for the 2040–2060 and the 2060–2080 time periods. The results show that temperature seasonality (40% contribution to the model), elevation (33.5%), mean annual temperature (6.9%), mean annual precipitation (6.2%), and max temperature of the warmest month (4.5%) were identified as the primary factors that accounted for the current distribution of the Montpellier Maple. Under the climate change scenarios, MaxEnt predicts a large decrease in the species suitability area, with a shift towards the southwestern regions of the species distribution, especially to the mountainous zones of the Moroccan Atlas. Our results show that climate largely limits the distribution of the Montpellier Maple in the Mediterranean basin, as its change in the future is expected to significantly reduce the suitable area by more than 99% from the historical climate conditions, to reach only 16,166.9 and 9874.7 km2 under the moderate RCP4.5 and extreme RCP8.5 scenarios, respectively, by the end of the 21st century. Our study can provide a good view of the future changes in the distribution of Montpellier Maple for its protection and sustainable management.

1. Introduction

Ecosystem disturbance, habitat loss, anthropic behaviors, locality degradation, and climate change are the major factors that affect natural species distribution [1,2,3,4]. Environmental variables such as climate characteristics, field parameters, and edaphic state play a key role in influencing living organisms’ habitat preferences and shifts in occurrence by triggering the species’ sustainability needs (nutrient availability and stability) [5,6,7,8,9,10,11]. Habitats of different plant species are always related to external changes such as biotic stress and human activities, and abiotic parameters such as climatic conditions [5,8,12,13,14,15,16,17].
The environmental variables can affect ecosystems and species of the same ecosystem differently [6,10,18,19]. The reaction of plant species to exogenous factors can affect all of their existence due to either inter-specific competition or inadequate overall conditions [6,13,14,20,21]. Assessing species disturbance in relation to environmental variables is becoming more and more important, especially with the considerable climate change effects. To do so, plant species distribution models have been used in different study areas and fields [22,23,24,25,26,27,28]. Species modeling was initially based on the presence–absence approach [4,29], but regarding the low accuracy and the hard work needed to obtain accurate data, maximum entropy models such as the MaxEnt model have been used to measure potential species distribution in relation to environmental variables from restricted occurrence sampling based only on presence points [30].
The MaxEnt model is usually used to measure and predict rare and endangered plant species in a restricted niche distribution [3,23,28,31,32,33,34]. However, studying common species distribution and future changes is important in measuring the global effects of future climate change [15,35,36]. The last IPCC report [37] insisted on assessing the effects of human activity, and induced climate change will have more severe effects on species distribution and ecological patterns, especially in the Mediterranean area.
A common native Mediterranean species, the Montpellier Maple [38], was chosen for this study to measure the current distribution in relation to environmental conditions and to predict future potential ranges. The choice of the species was based on: (1) the specificity of the Mediterranean basin as a biodiversity hotspot [16,17,37,39,40,41]; (2) the wide distribution range of the species; and (3) the ecological importance of the species. The Montpellier Maple is a native tree species threatened by a multitude of environmental variables such as grazing and fires. The species has a shallow distribution in the eastern part of the Mediterranean and in north Africa, where it is considered a protected species, as is the case in Tunisia [38,42].
The main objective of this study was to assess the Montpellier Maple’s current potential distribution, and the effects of future climate scenarios on the species distribution using the MaxEnt software for maximum entropy modeling. This work will help identify the environmental conditions that best affect the potential distribution of the Montpellier Maple and understand how climate change may affect the future potential distribution area of this native Mediterranean species.

2. Materials and Methods

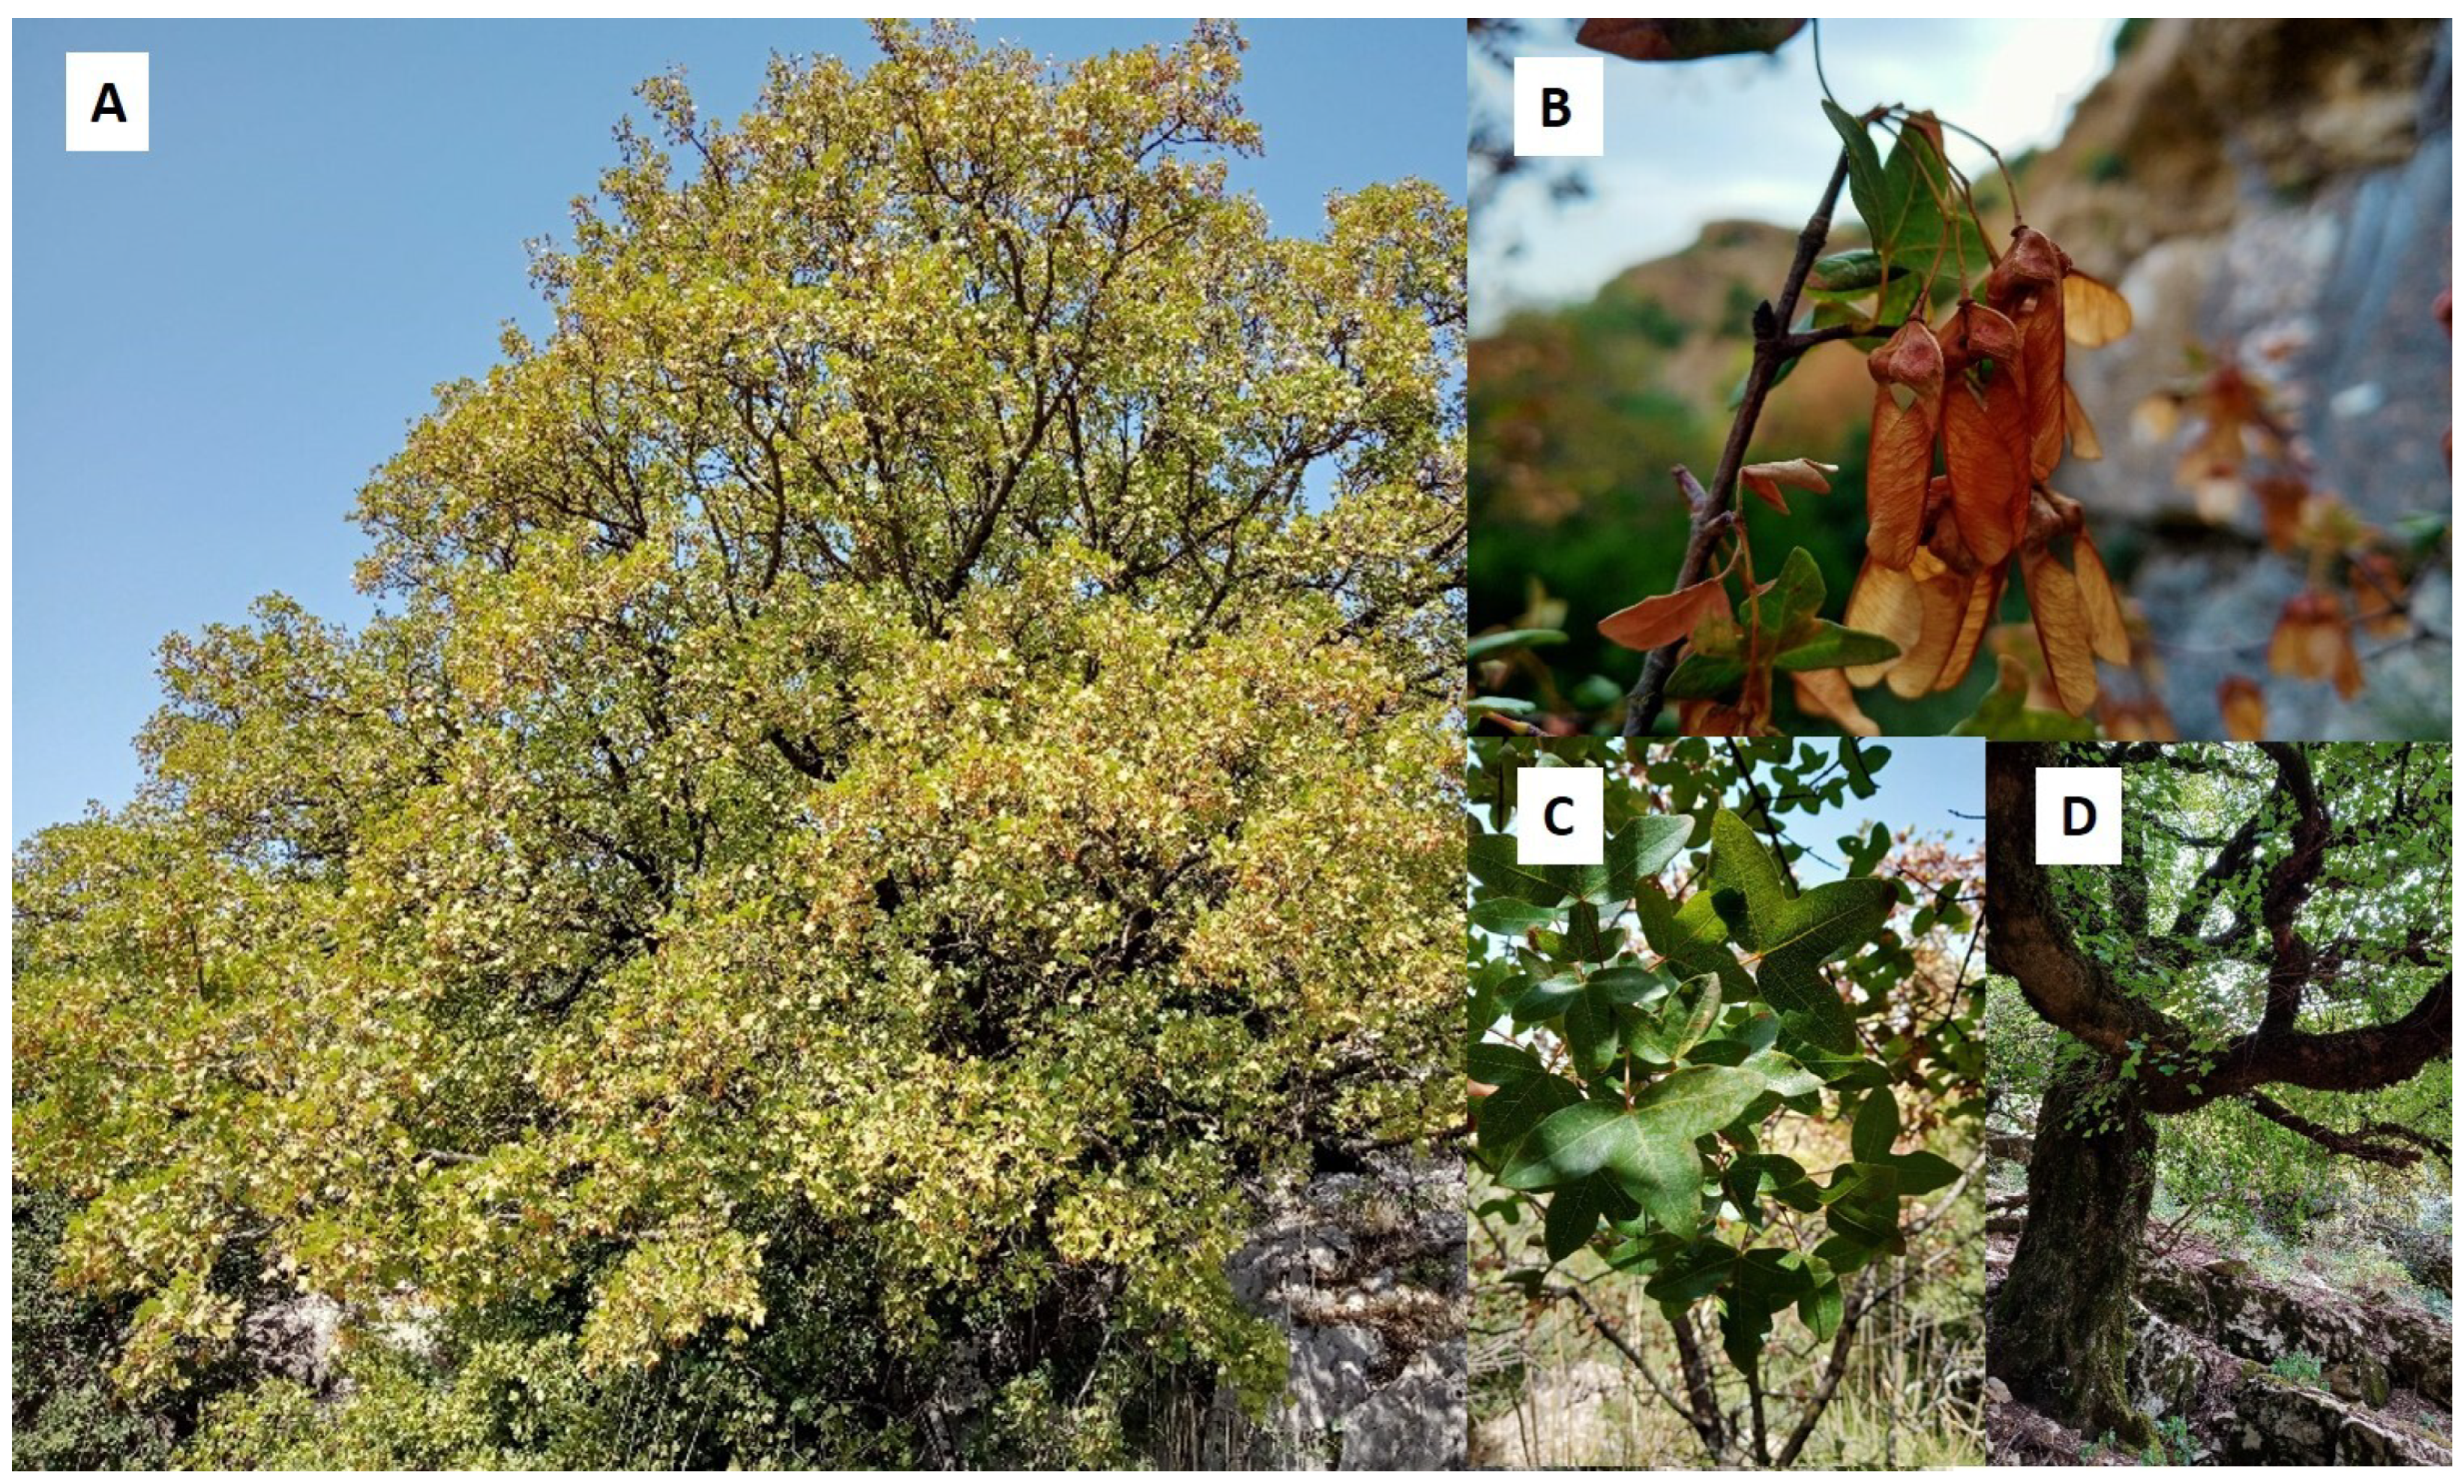
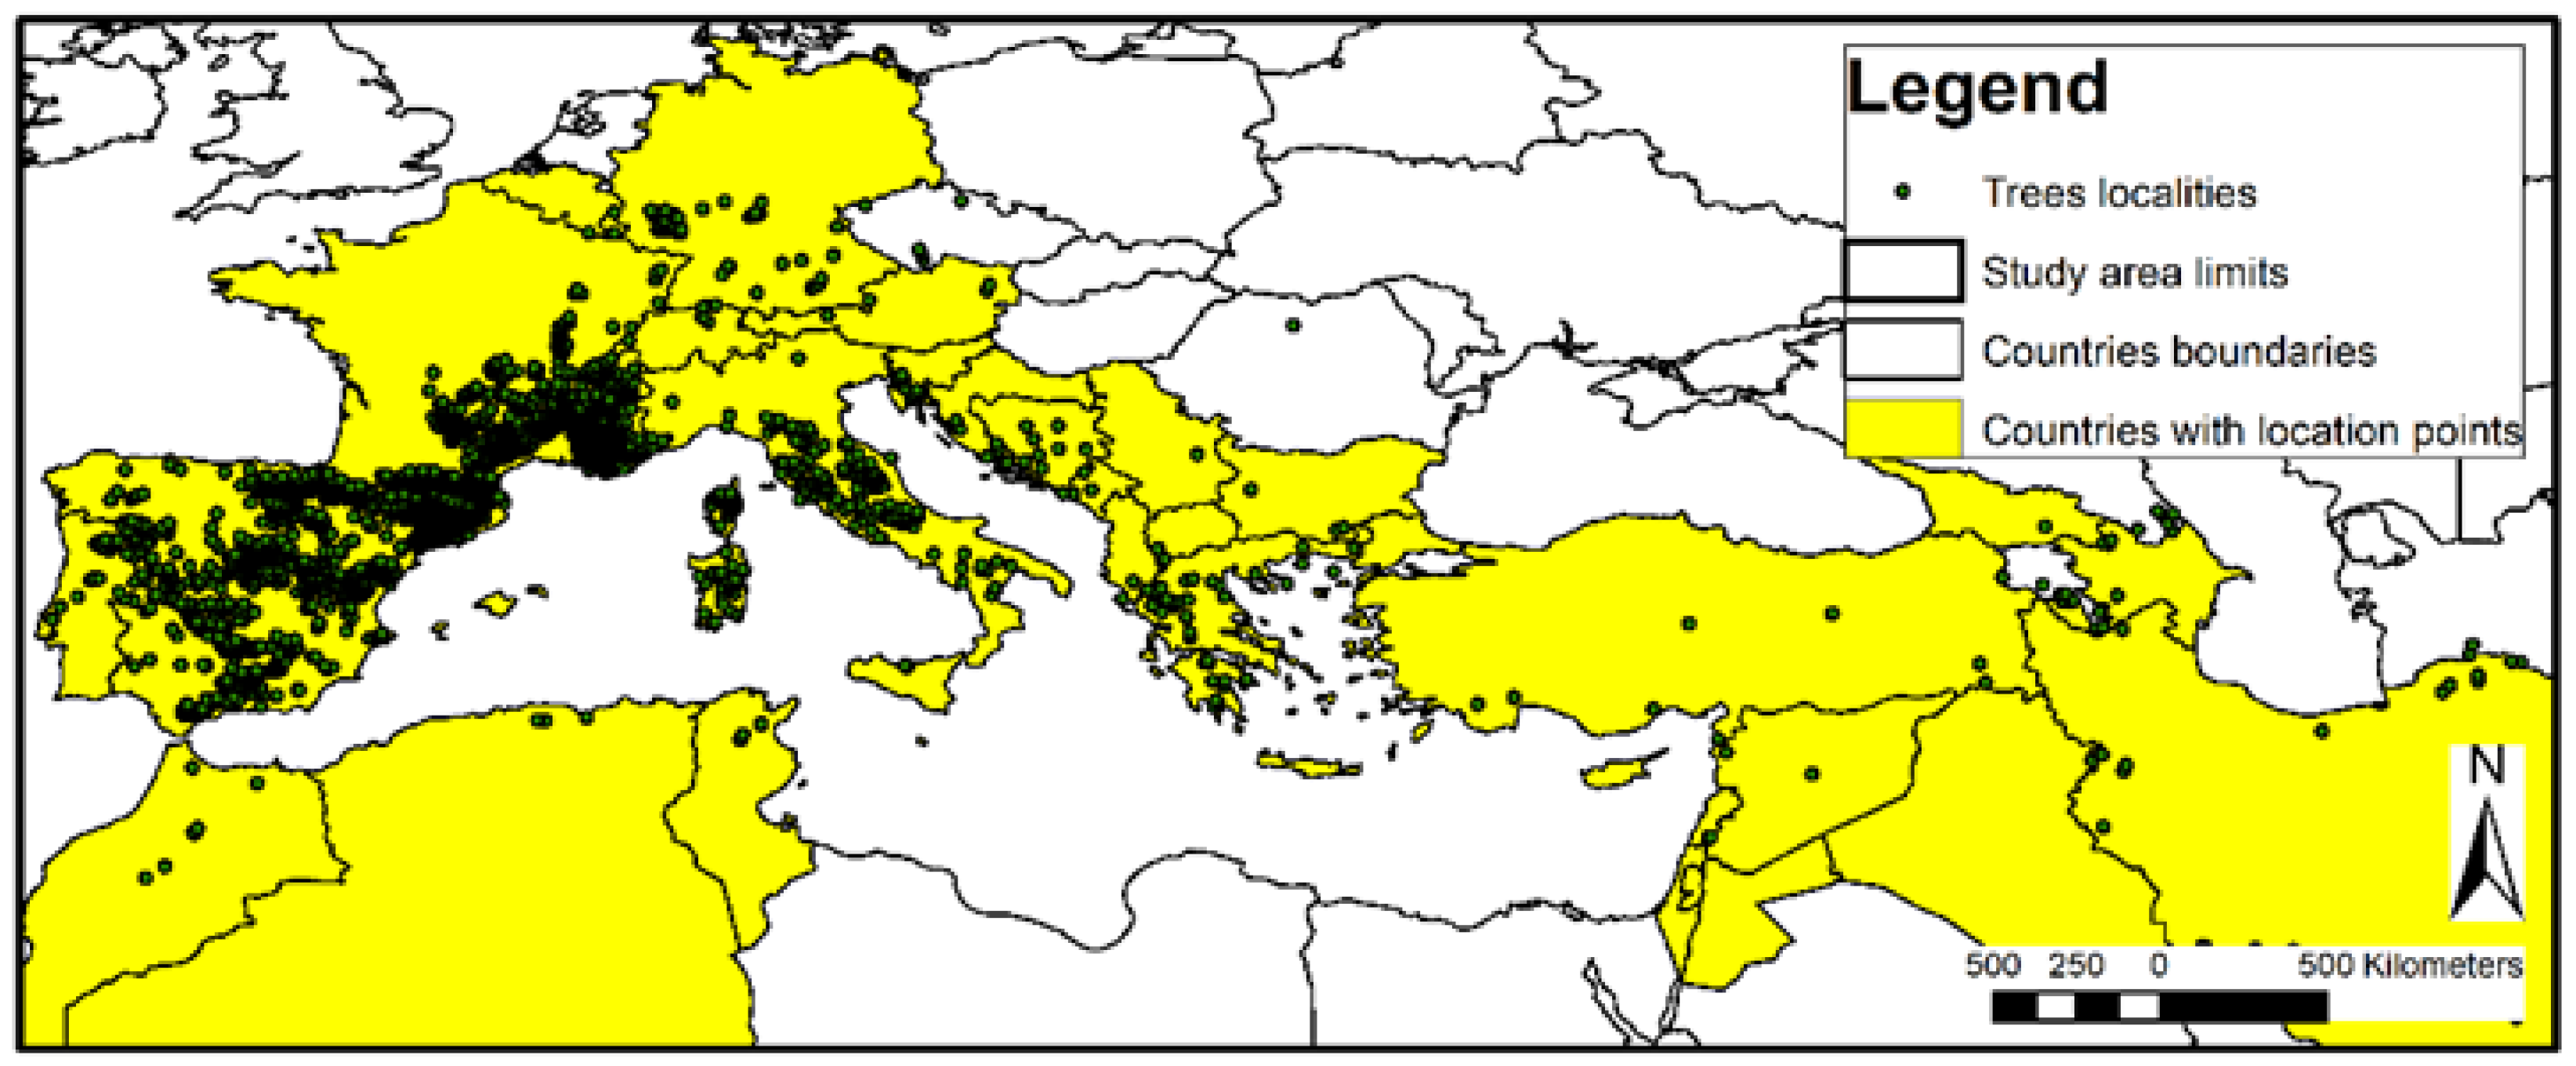
2.1. Species Description and Study Area

The Acer (Maple) genus is widely distributed in the Northern Hemisphere, containing around 143 mainly broad-leaf species [43]. Montpellier Maple (Acer monspessulanum L.) is native to the Mediterranean region and wildly distributed in South Europe, North Africa, and the Middle East regions. It is a highly adaptative tree with a good capacity for drought tolerance. The species prefers limestone and calcareous soils with southern slopes from 300 to 1800 m above sea level (m.a.s.l.) [44,45,46,47]. The Montpellier Maple (Figure 1) is a deciduous Mediterranean tree with an average height of 4–5 m, dark brownish bark, three lobbed coriaceous leaves, and samara fruits. It is a slow-growing tree, generally with multiple stems [46,48]. The Montpellier Maple can be used for gardening, wood products, and traditional medicine (as a laxative, for digestive issues, foot pain, and relieving cough) [49].
The study area covers approximately 20 million square kilometers (19.9 million km2) and encompasses the global distribution habitat of natural observations of the Montpellier Maple around the Mediterranean basin (north [27°57′; 55°38′ N. lat.] and east [−9°91′; 58°59′ E. long.]; Figure 2). The chosen area encompasses the Mediterranean and the Middle Western Asian regions.

2.2. Data

The species presence point data were retrieved from the GBIF database (www.gbif.org). The considered species layer is the Montpellier Maple distribution between 300 and 1800 m of altitude as mentioned on the IUCN Red List website. The presence point data set was cleaned considering the above elevation range as a threshold. In the case of Tunisia, where the species is considered to be rare, we completed the database using points obtained during our fieldwork. Only one observation point was considered by pixel to limit the heterogeneity of the species distribution as recommended by [33,50]. After cleaning, a total of 5810 presence points were used for running the model (Figure 2). The main presence of the species is observed in the northern areas, especially in Spain, France, and Italy. The presence of the species is narrow in Asia and, especially, in the north African regions where it is only observed in mountainous areas. Climate data were downloaded from the Worldclim database (www.worldclim.org) with resolution of 30 Arc Seconds. Nineteen bioclimatic variables [51] were considered to study the current species distribution. Only nine of these were selected to run the future model simulations. For the future climate projections, we used the Coupled Model Intercomparison Project—Phase 5 (CMIP5) data obtained from 17 global climate models (GCMs) and 2 Representative Concentration Pathway scenarios (moderate RCP 4.5 and extreme RCP 8.5 scenarios). Bioclimatic indexes (Table 1) were considered instead of monthly climatic data due to their accuracy and the irregular characteristics of the monthly data [21].
The elevation, slopes, and aspect were extracted from the digital elevation model (DEM) obtained from the FAO global Harmonized World Soil Database v 1.2 [52]. To take into account the soil water content, we used the topographic wetness index (TWI) considered as a proxy for the soil moisture conditions [53]. In addition to the topographic and climatic data, we used three MODIS vegetation data representing the tree and non-tree vegetation and bare soil percentages. The data pixel dimension used for this study was 30 Arc Seconds (1 km) in order to maximize the number of environmental data sets and, at the same time, have an accurate resolution to study the potential species distribution.

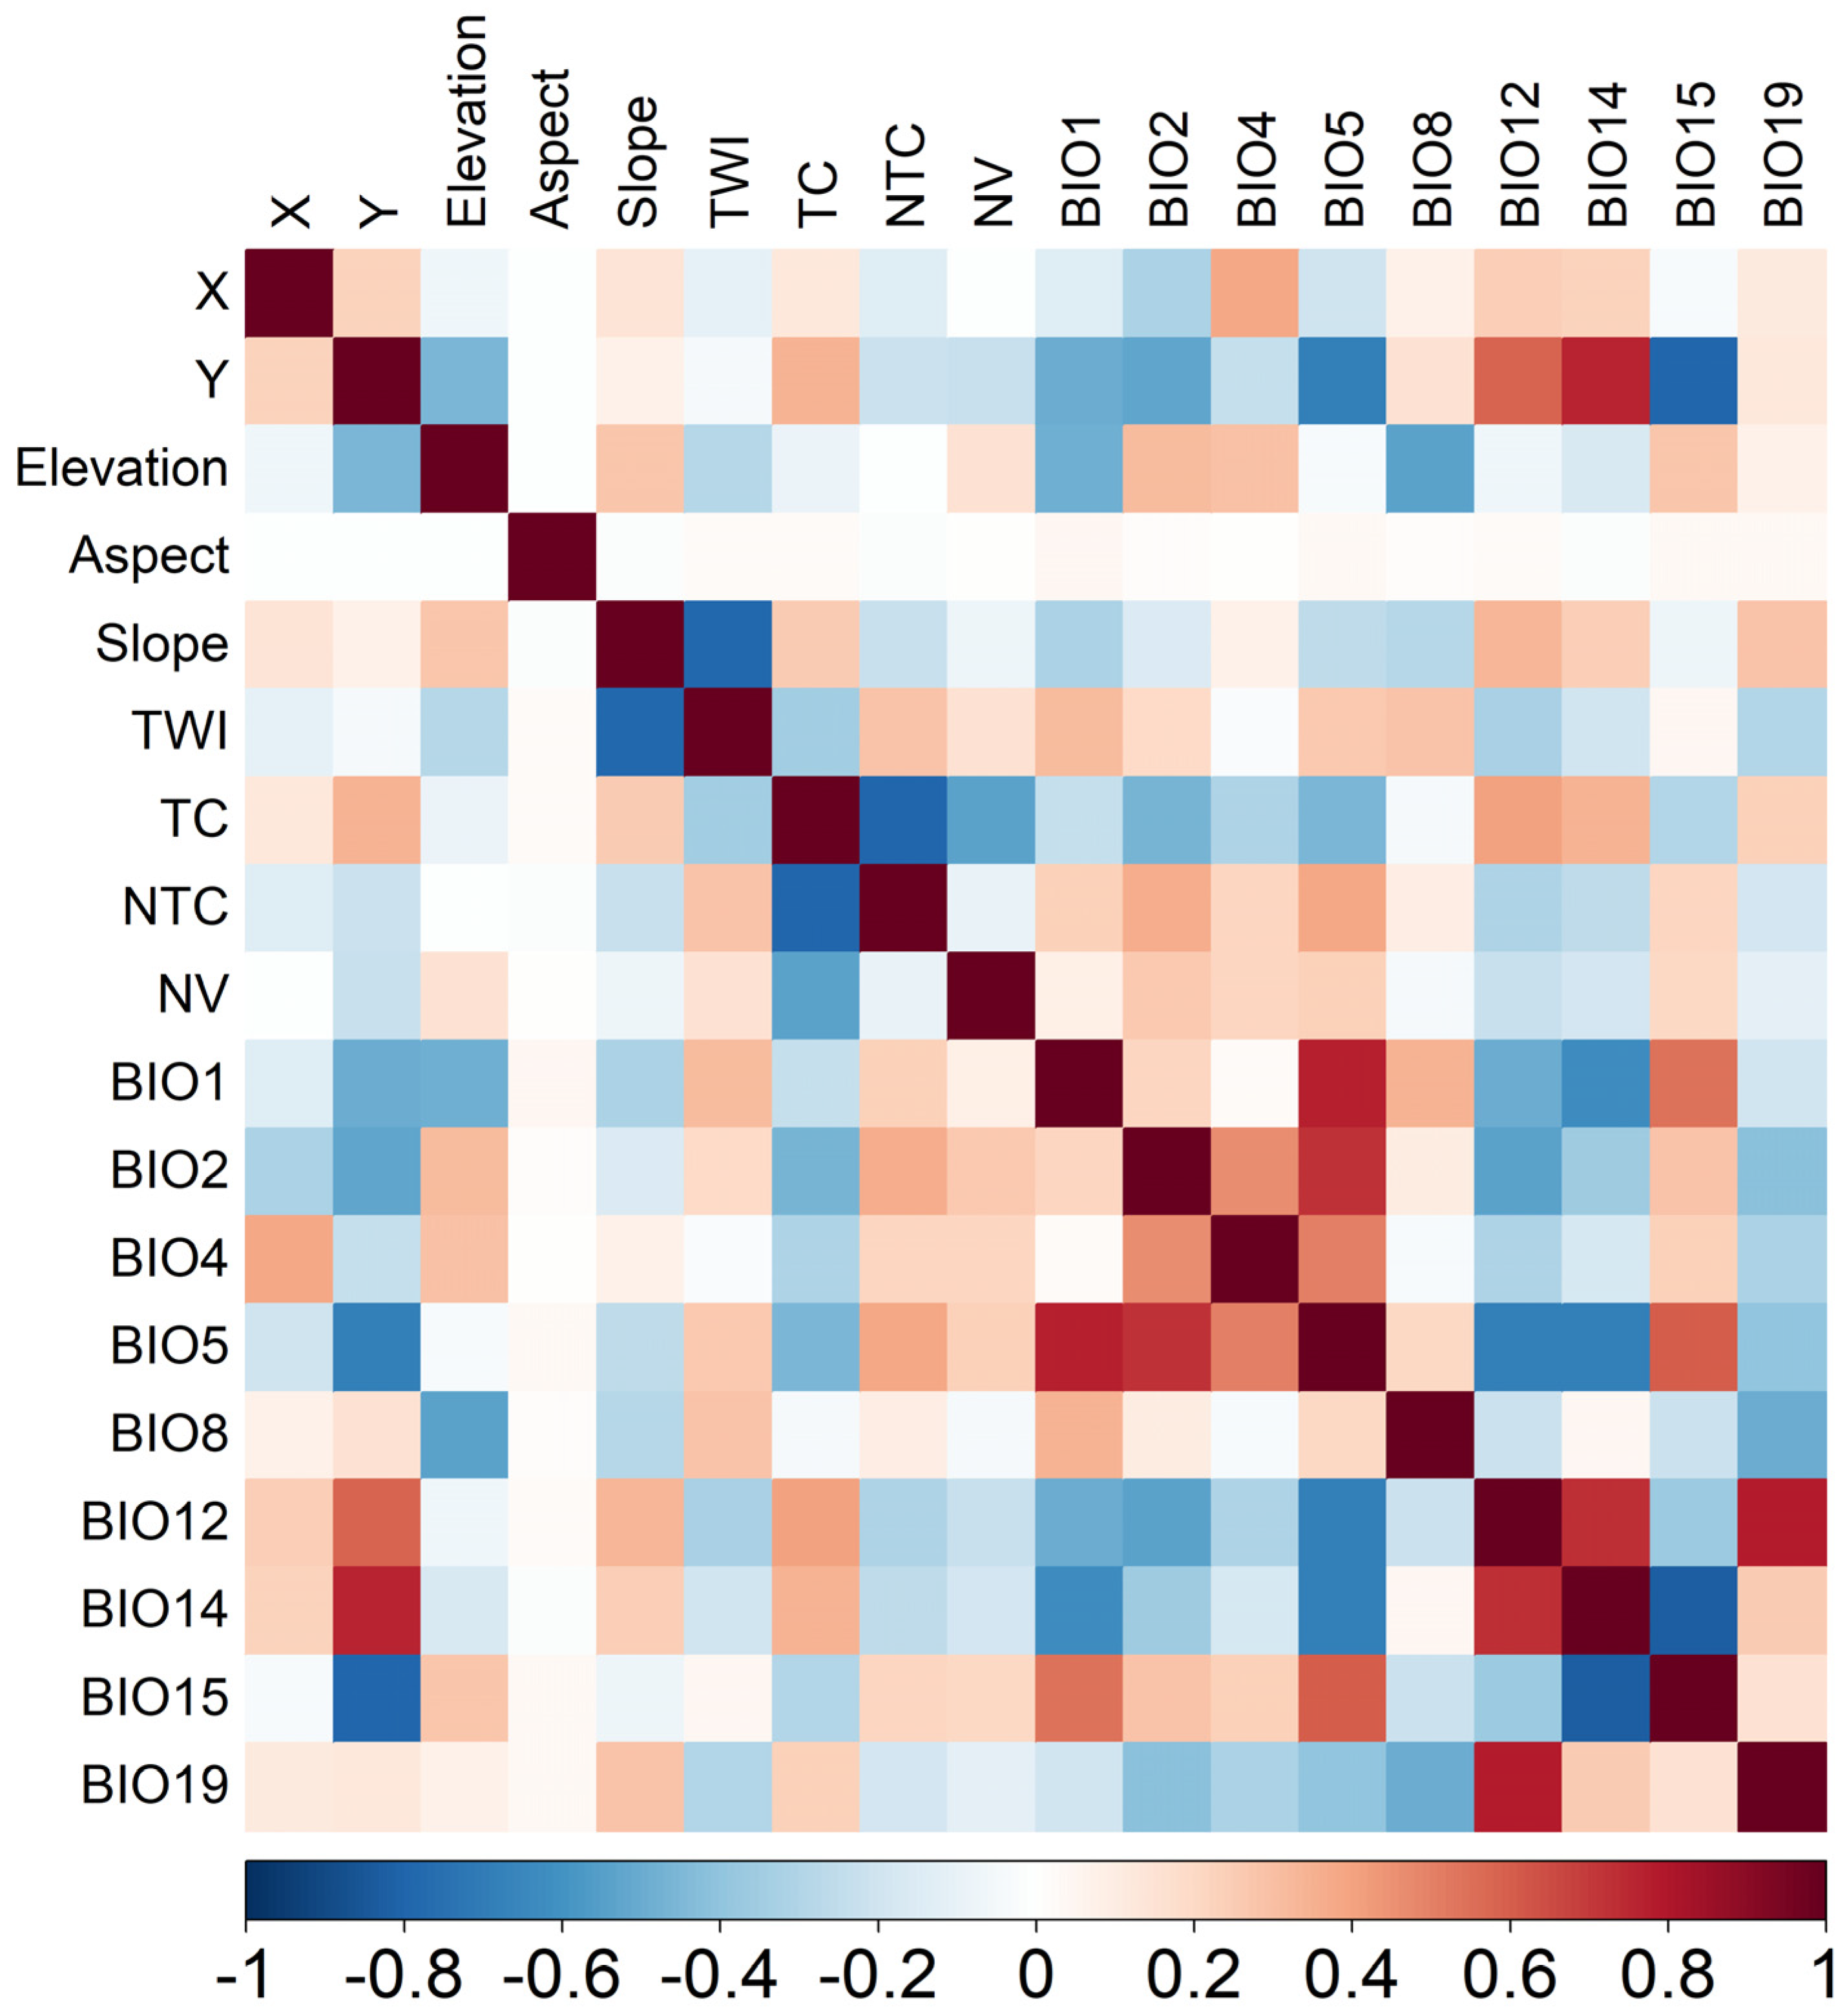
2.3. Variables Selection

To select the best environmental data sets to run the model on the minimum variable base, we extracted all used variables’ values to the presence point layer. Population distribution of the species localities by class variables, a correlation matrix between variables, box plots, Student’s t-test, and descriptive statistics were carried out using the R (x64 4.0.3) software (R Core Team, Vienna, Austria). For all correlated variables with a correlation index greater than 0.8, only one variable was left (Figure 3), as it is recommended to use non-correlated parameters for MaxEnt modeling [54].
In total, 16 variables were selected and classified into three types: 4 topographic variables, 3 vegetation variables, and 9 bioclimatic variables (Table 1). Low and no significant correlation between selected topographic and bioclimatic variables were found considering the presence point of the Montpellier Maple, which implies the use of those two sets of variables in the modeling of its suitable areas. Moreover, several studies [31,55,56] predicting suitable distribution areas using the MaxEnt model use bioclimatic variables coupled with topography in model fitting and analysis.

2.4. MaxEnt Modeling

MaxEnt, or Maximum Entropy Species Distribution Modeling software, is an open-source computer program that runs through the JAVA language and uses presence-only records to model the distribution of a species in relation to the environmental variables [30,54,57]. The model is used worldwide to assess the geographical distribution of birds, animals, aquatic life, and plants [57]. The software uses only presence records to model the distribution of a species [22]. It estimates the distribution rate of species based on decreasing the entropy between the estimated probabilities derived from presence data and environmental variables [22,54].

2.5. Model Application and Data Analysis

In our MaxEnt models, 70% of presence data were used for the model training while 30% were used as testing data. Jack-knife analyses were performed to estimate the importance of every variable. The AUC values were used to estimate model performance. AUC values range from 0 to 1: AUC < 0.5 suggests random prediction, an AUC value between 0.5 and 0.7 indicates poor performance, an AUC value between 0.7 and 0.9 indicates moderate performance, and AUC > 0.9 indicates high performance [22,29,58]. Potential species habitat-suitability classes, as explained by Yang et al. [59], were used to display the potential distribution area and to compare the further distribution ranges of the species (Table 2).
A 20,000-background-point value was used. As background points are considered like pseudo-presence data, and we aimed to estimate the potential range of the species, in a range larger than the current distribution area, it is recommended to use a higher background point than presence point [30]. Future projections were performed using each of the 17 climatic models, two scenarios, and two projected periods (2040–2060 and 2060–2080) separately. The averages of the resulting projections and the changes observed between the MaxEnt simulations were used to perform statistical analysis as advised for climatic modeling [41]. The resulting maps of the potential distribution were classified into 5 classes of suitability according to the recommendations of Yi et al. [3]. We used the 0.4 threshold to identify two classes of unsuitable areas (unsuitable and barely suitable classes) and three classes of suitable areas (suitable, highly suitable, and extremely suitable classes; Table 2). For the comparison of the mean values of environmental variables between the different suitability classes, we extracted all the used variables’ values to the presence point layer. All the data analysis and statistics were carried out using the R (x64 4.0.3) software.

3. Results

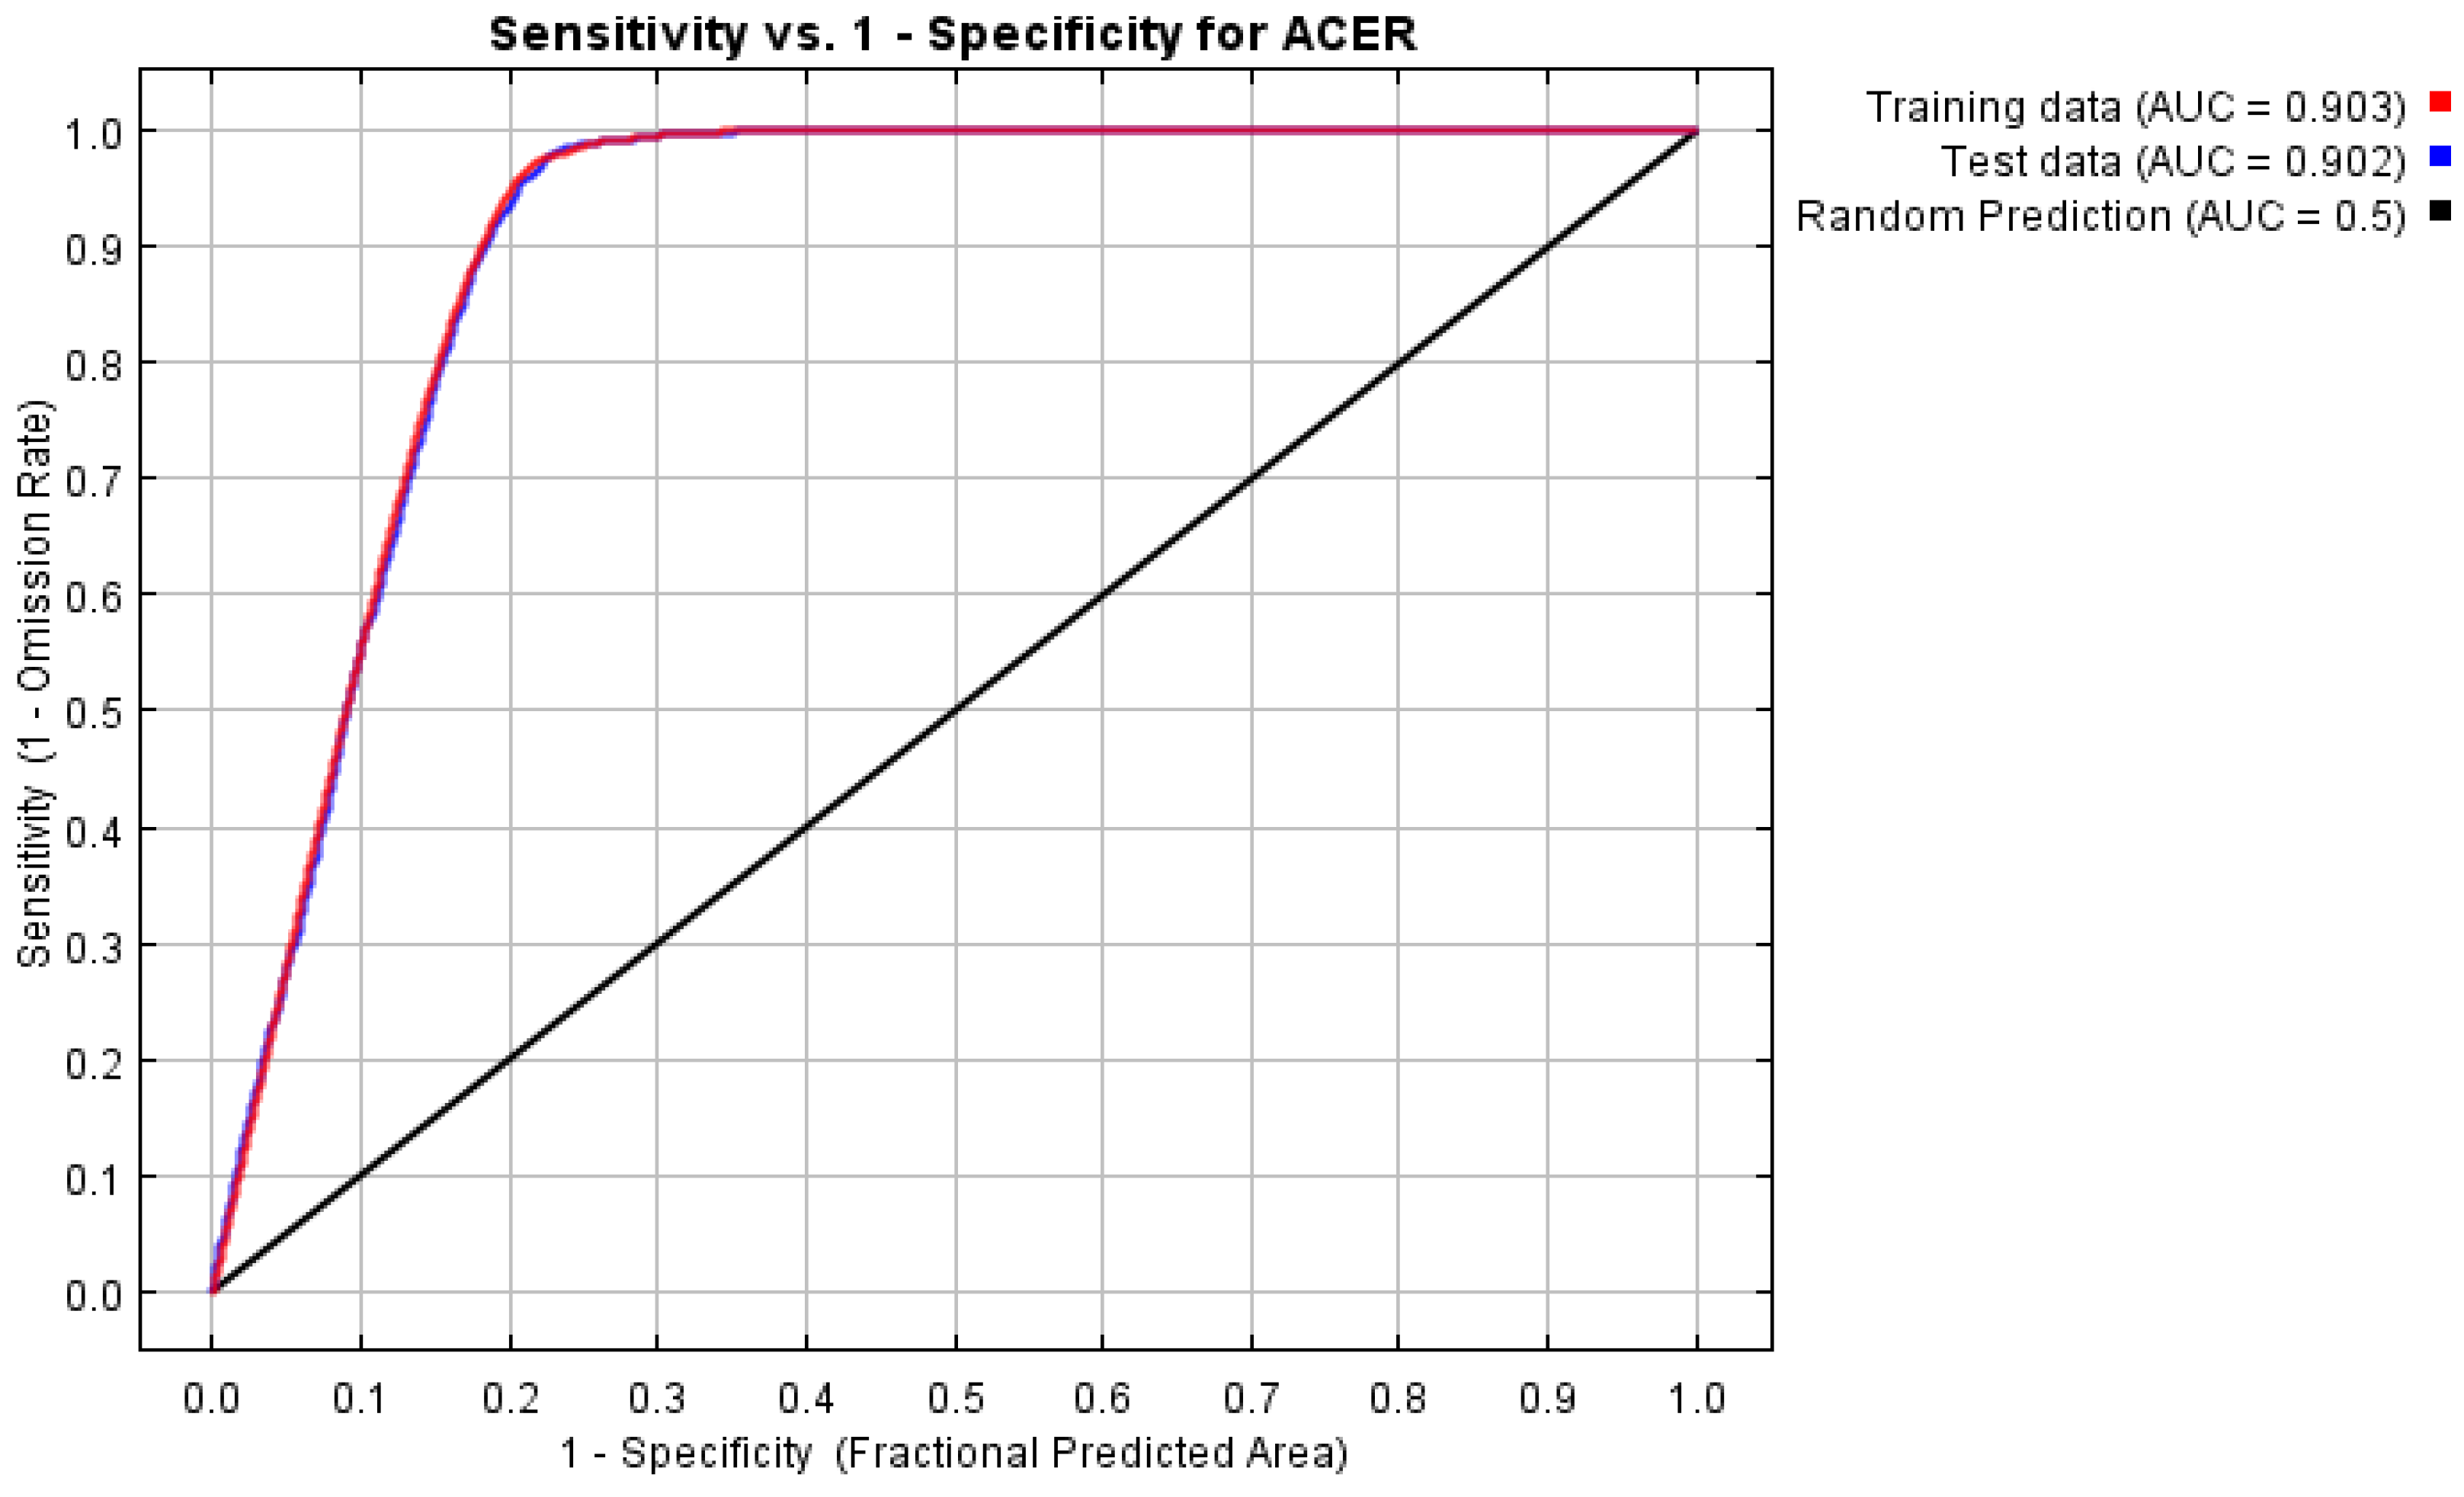
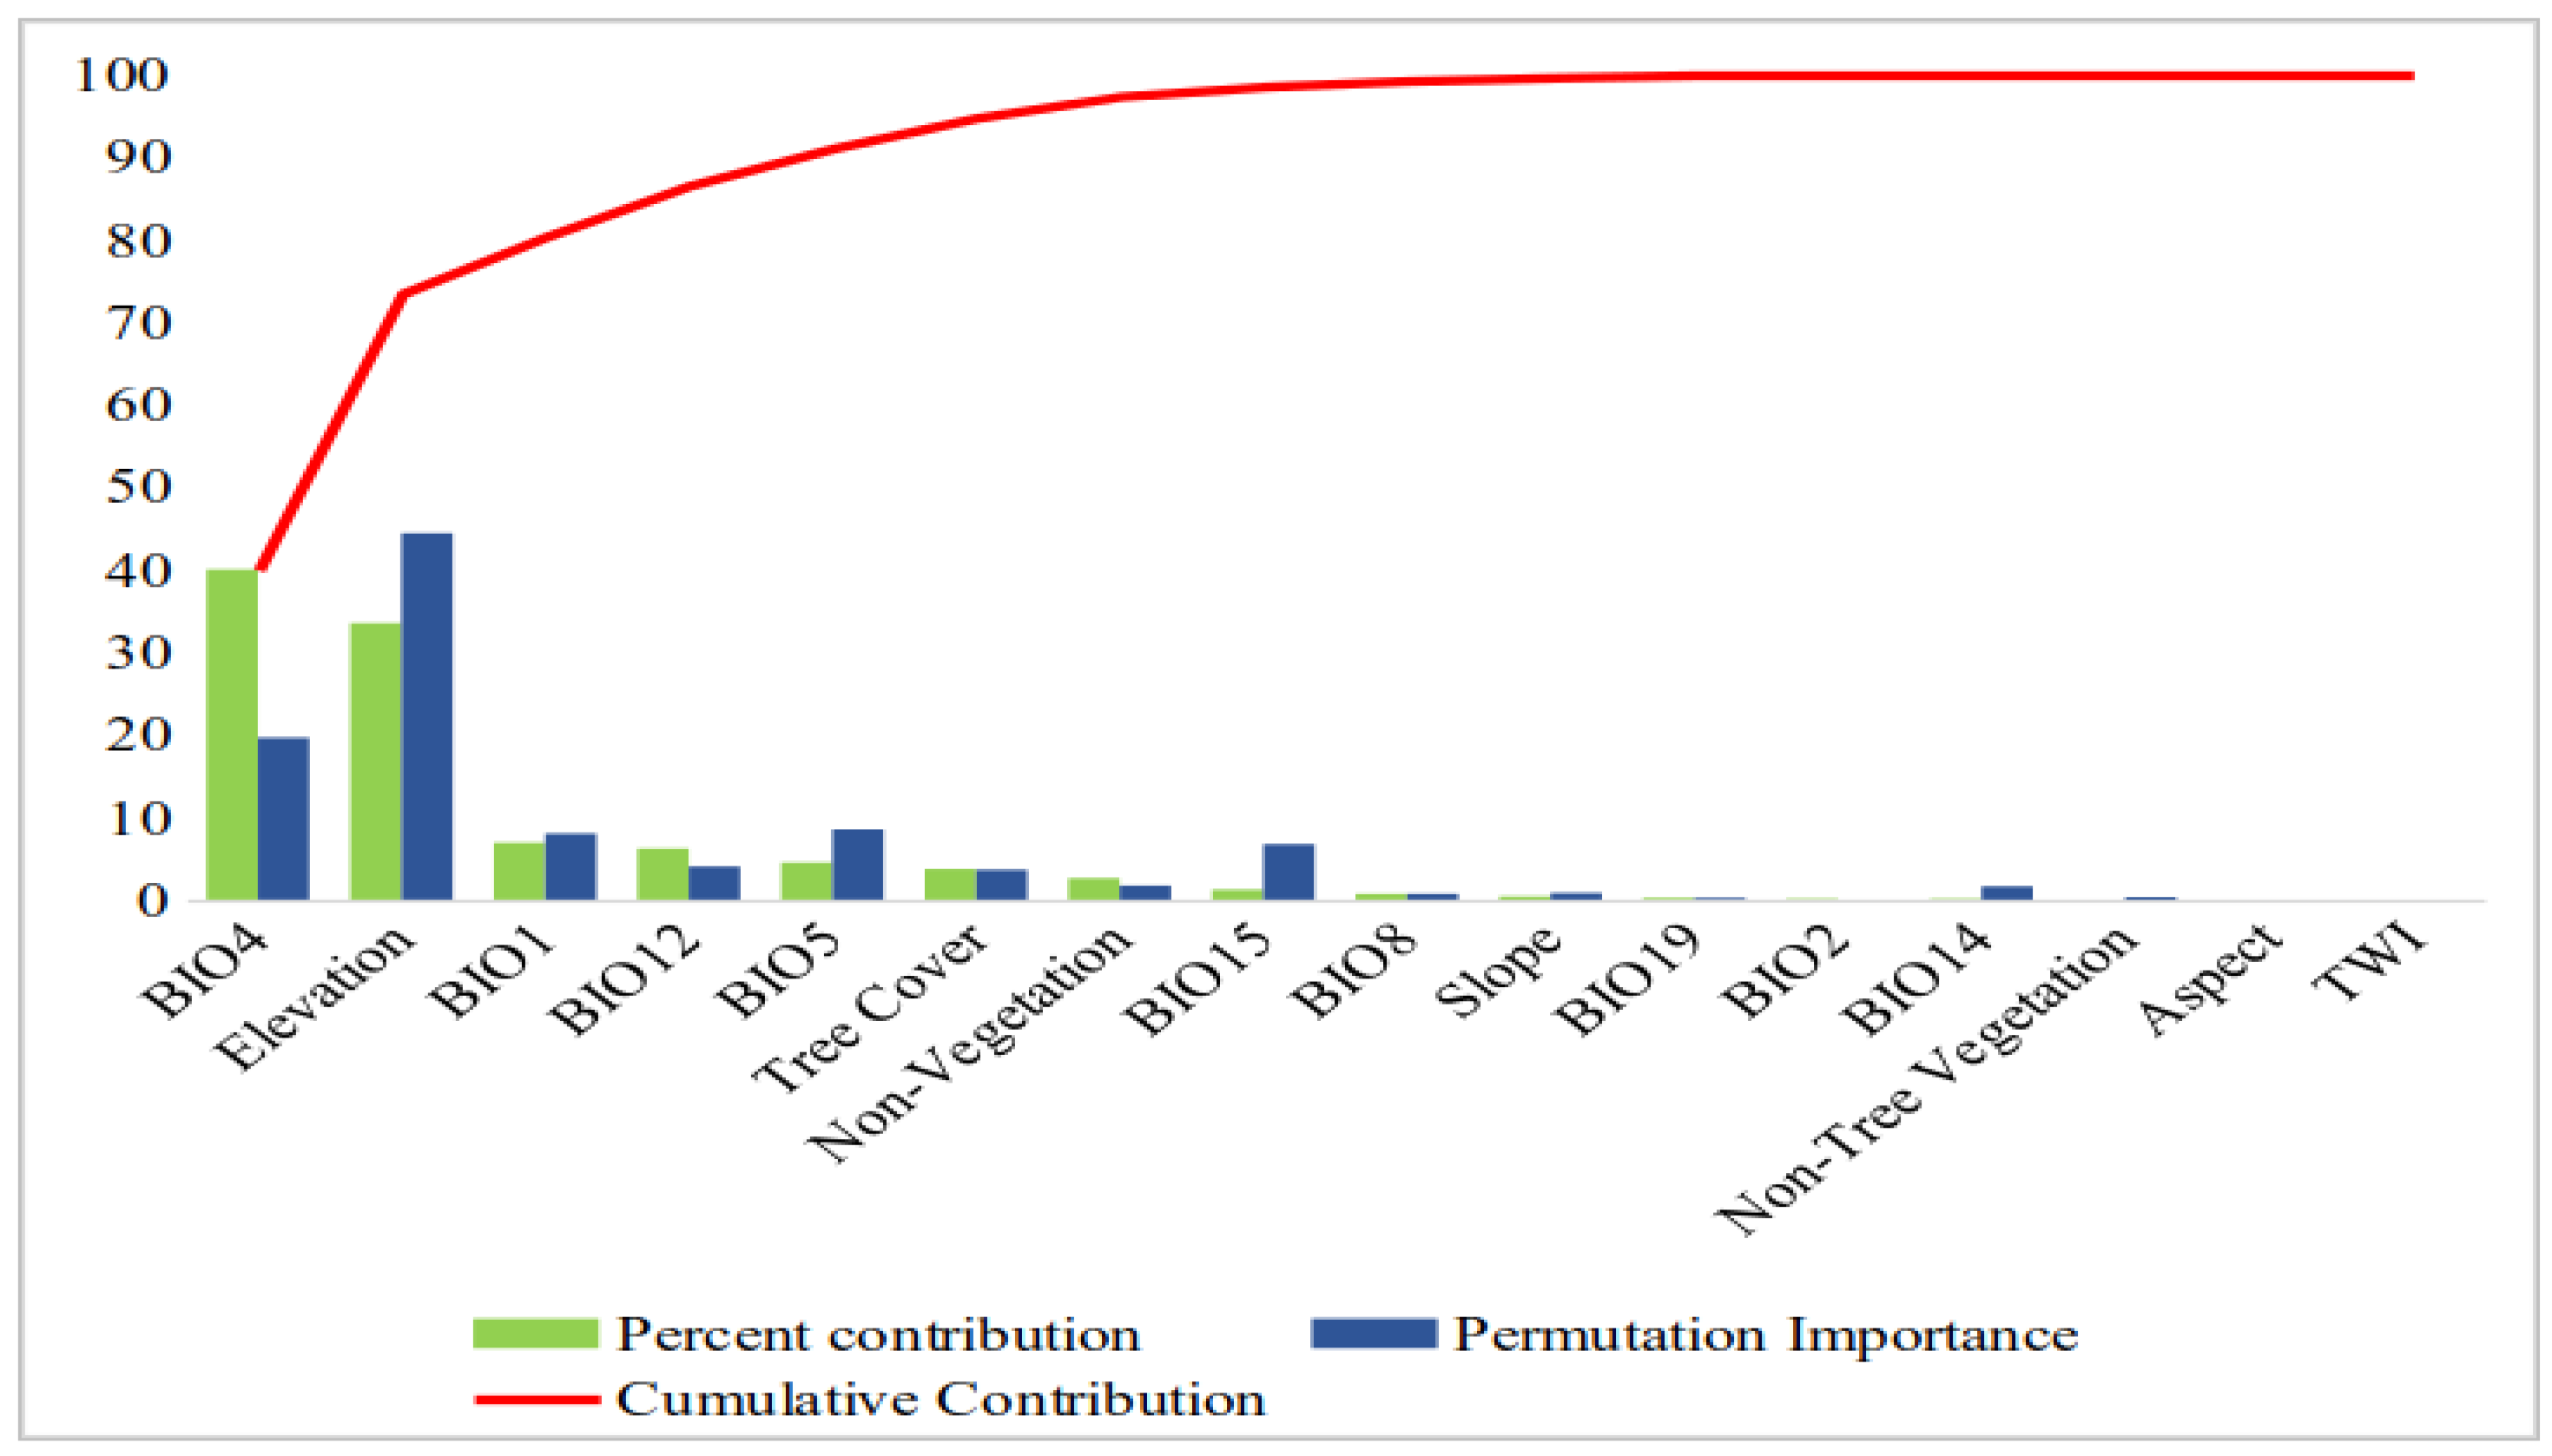
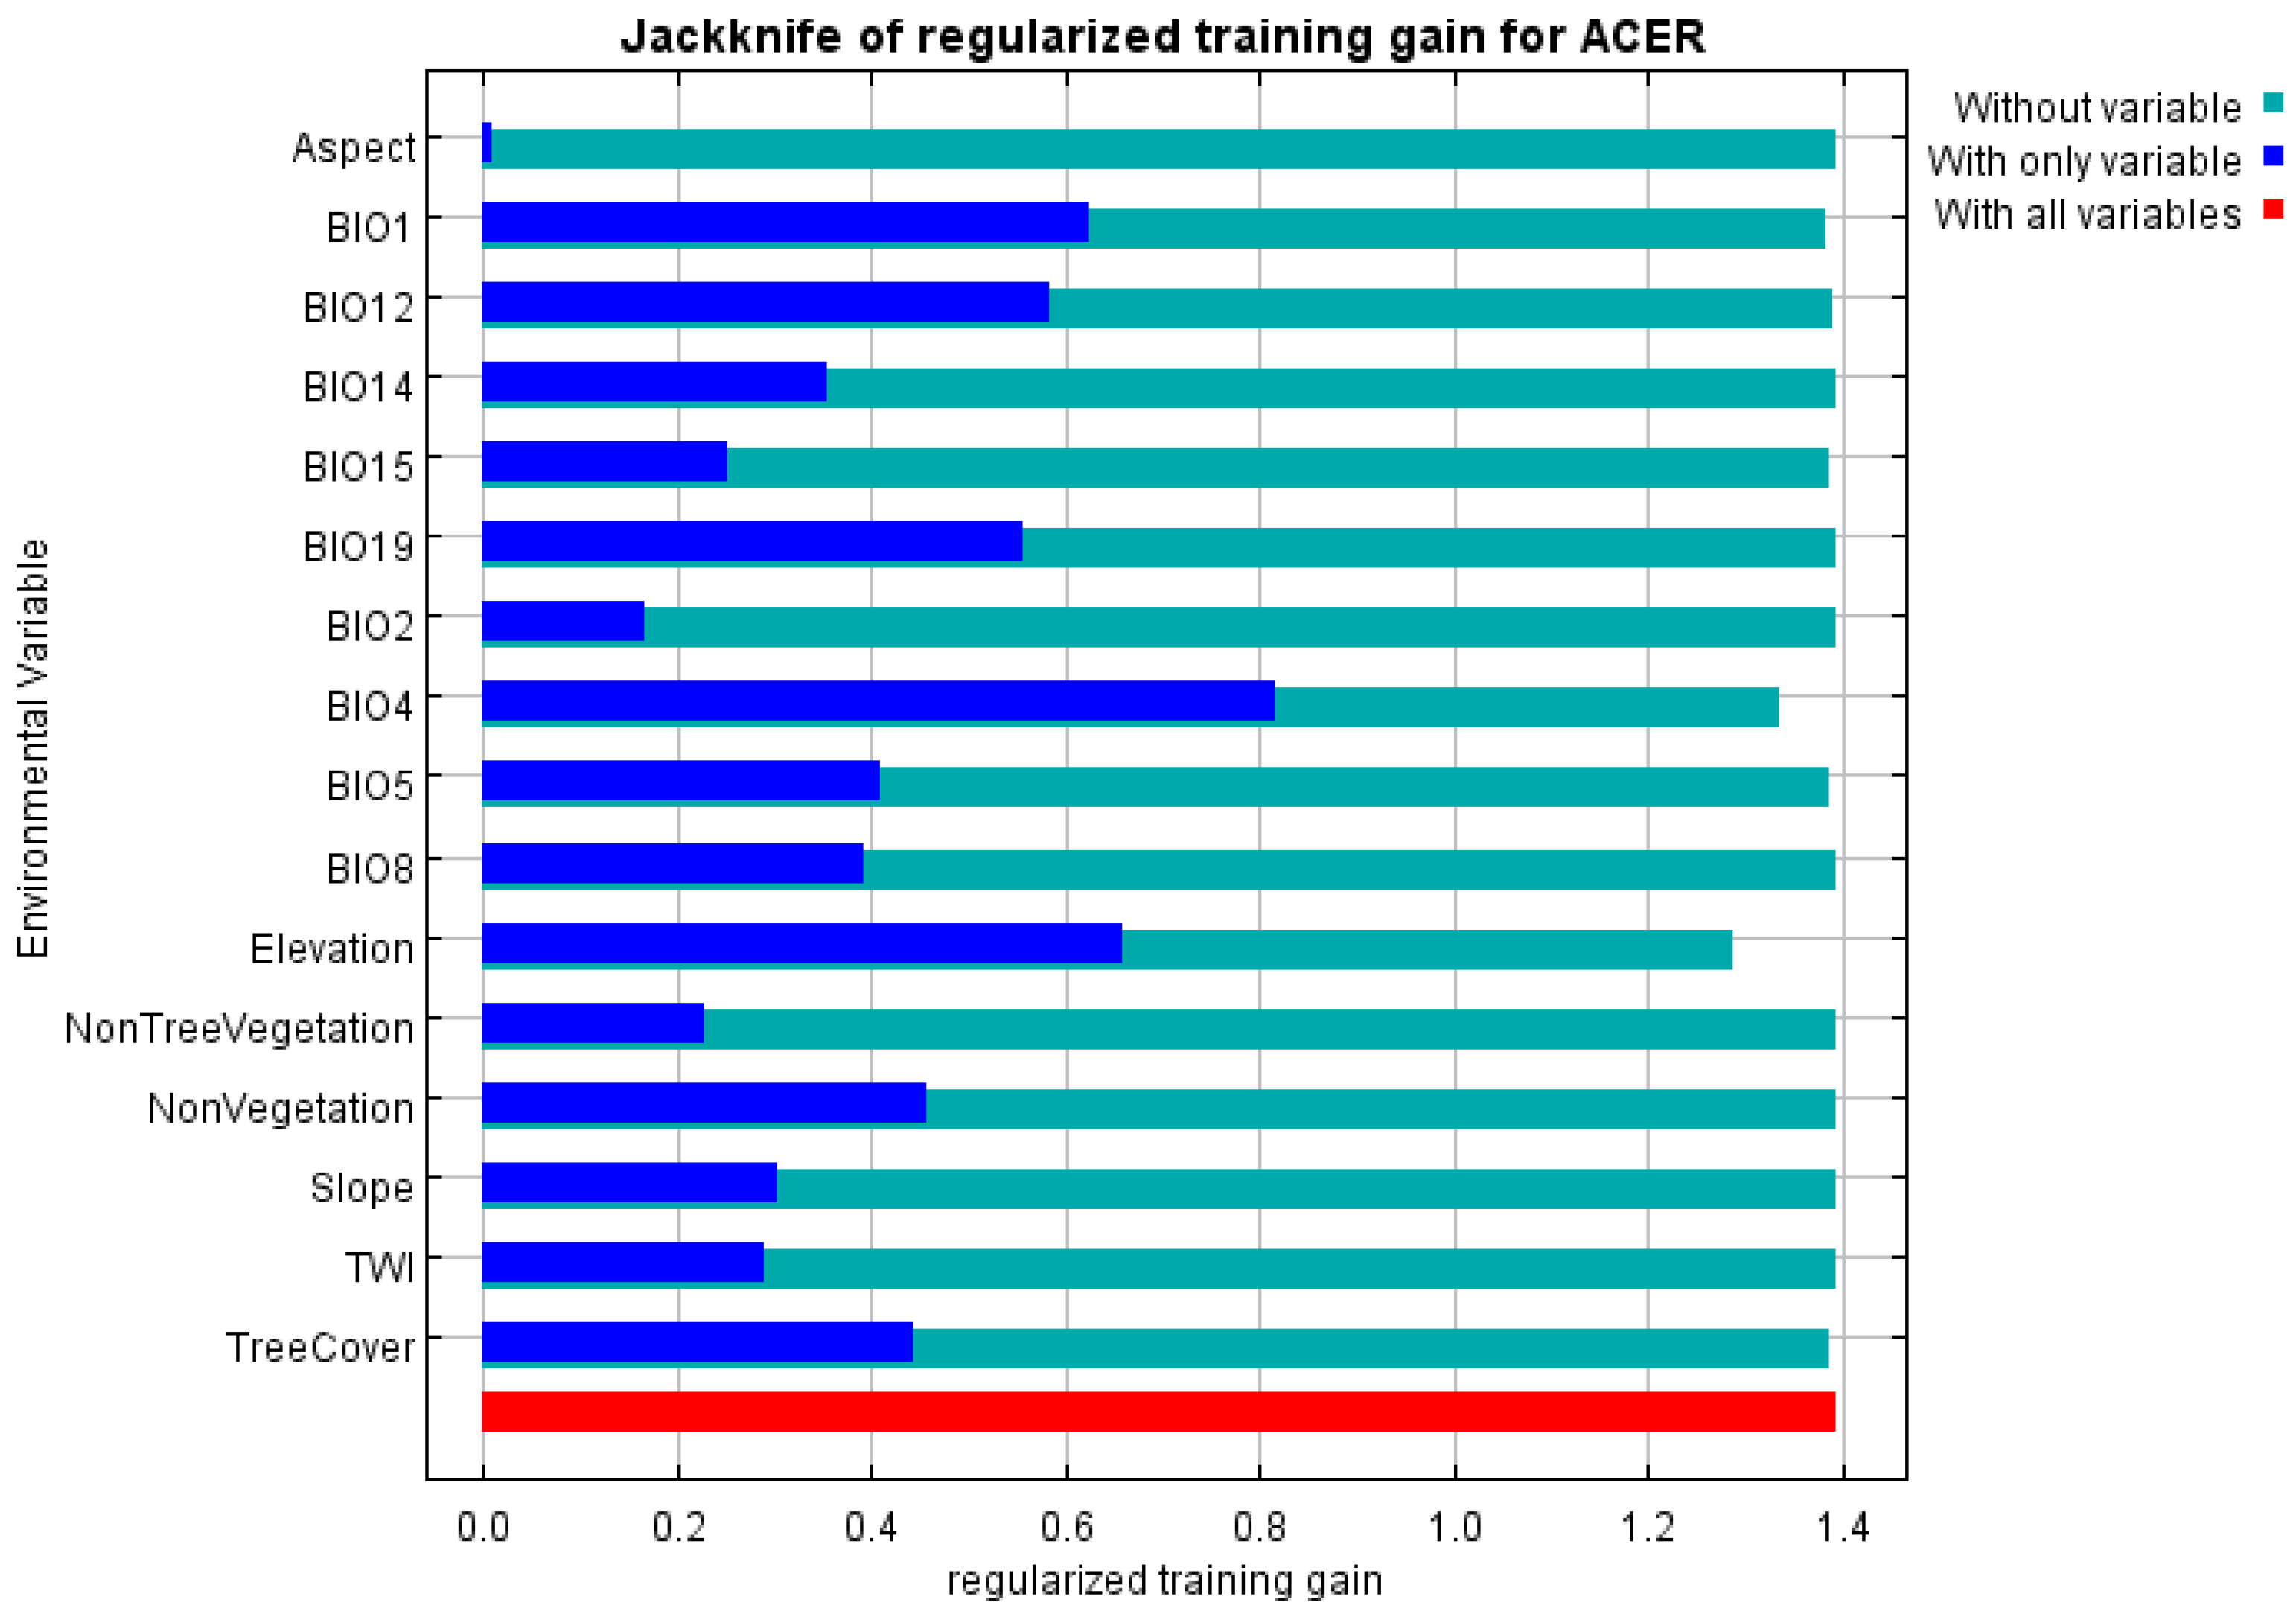
3.1. Model Fitting Results

Our model showed high predictive accuracy with an AUC value above 0.9, indicating that the model is highly reliable as it is significantly higher than a random prediction. It performs better than random models in predicting the habitat suitability of the Montpellier Maple (Figure 4).
The model was then used to compare the current distribution to the projected predictions of climate change. Temperature seasonality (BIO4) makes the greatest contribution to the model, followed by elevation, annual mean temperature (BIO1), annual precipitation (BIO12), and max temperature of the warmest month (BIO5). These factors have a cumulative contribution rate of greater than 90% (Figure 5).
Considering the importance of the contribution of each parameter on the species distribution, the permutation percentage, as explained by Elith et al. [54] and Merow et al. [30], reveals the amount of data contained in one parameter and not explained by the other parameters. The MaxEnt model shows that the temperature seasonality and elevation effects on the modeling of the Montpellier Maple distribution are the most remarkable. The modeling results showed that elevation explains almost the majority of the species distribution with a permutation importance of about 44.4%. This can be explained by the selected threshold of the species distribution elevation, which varies from 300 to 1800 m. Considering the potential parameters revealed by our model, studying the distribution of these parameters regarding the field’s current distribution could reveal for us the species’ preferences. The jack-knife test (Figure 6) also demonstrates the importance of each variable on the training gain of the species distribution modeling.

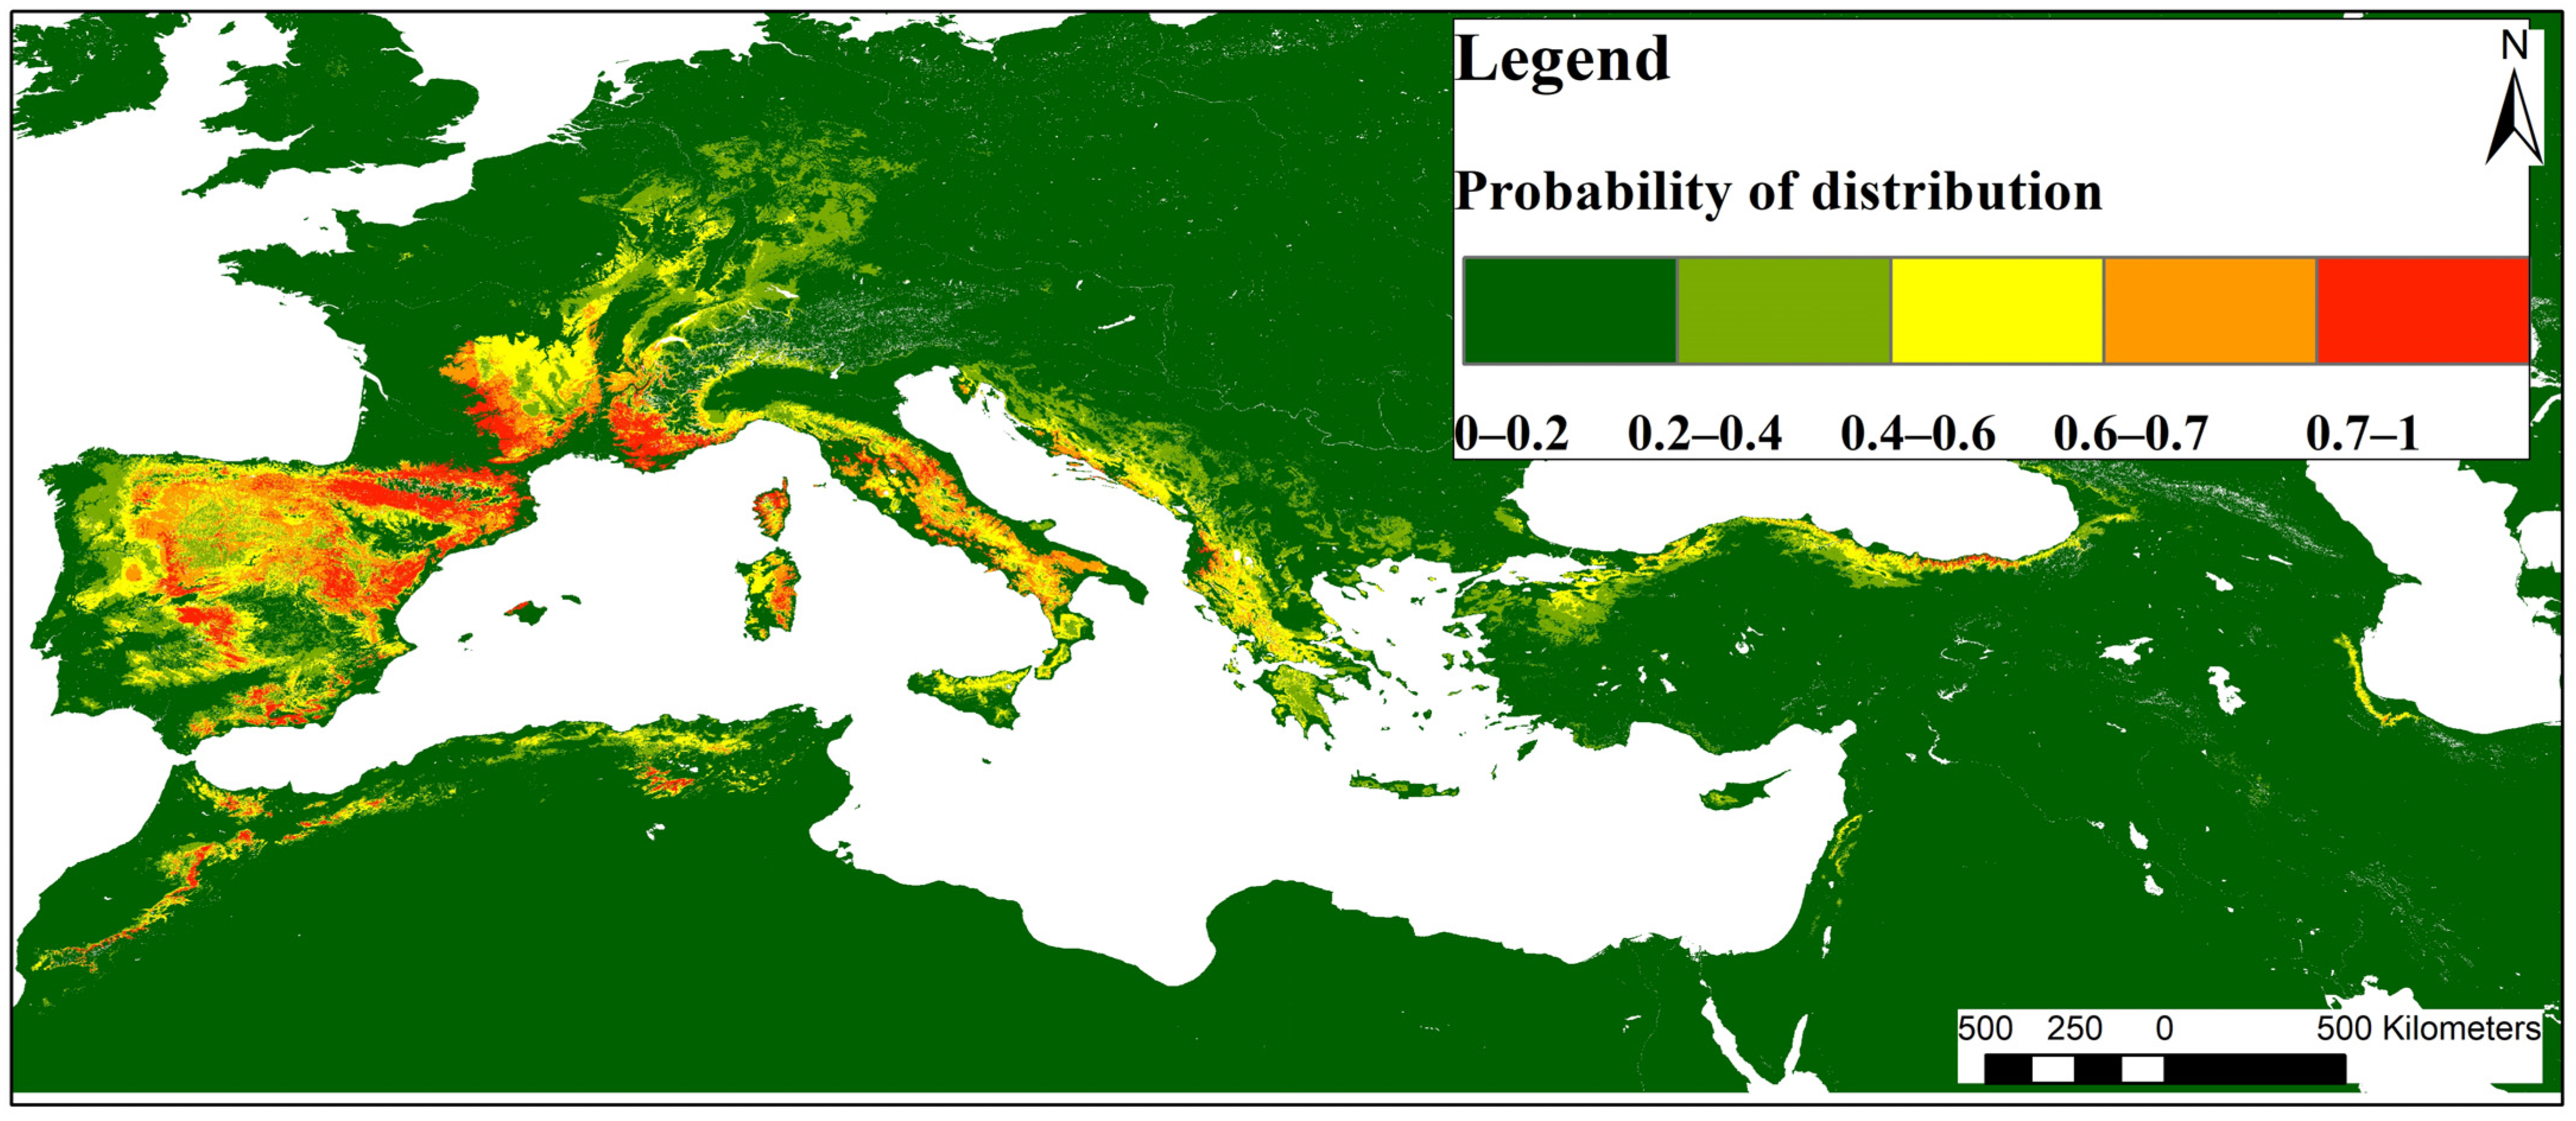
3.2. Current Potential Distribution

The current habitats of the Montpellier Maple and its current suitable potential distribution area were predicted for the current bioclimatic conditions (Figure 2 and Figure 7).
Using the 0.4 threshold (Table 2) to identify the potentially suitable areas, the model predictions resulted in less than five percent of the studied territory as being suitable areas (4.8%). These areas are distributed on suitable, highly suitable, and extremely suitable areas of 478,832, 293,429, and 176,846 km2, respectively. In contrast, the largest predicted area is classified as unsuitable (91.8%) and barely suitable (3.45%). The suitable areas are mainly located in the central and eastern Iberian Peninsula, the Pyrenees Mountains, southern France, central Italy, Sicily, and the edges of the Adriatic and Aegean Seas. For the North African region, the mainly suitable areas are located in the Rif and Atlas Mountains in Morocco, between the Tell and the Auras Mountains in Algeria, and in the Dorsal and Kroumerie Mountains in Tunisia. In the Middle East, the most suitable areas are located in the northern edges of Turkey, the Lebanon Mountains, and the southwestern edge of the Caspian Sea. As expected, the main species’ suitable habitats are mountainous areas.
To verify the significance of differences between the different suitability classes of the current Montpellier Maple potential distribution, a Student’s t-test was run to perform a means comparison. Our results reveal highly significant differences (p < 0.001) between the distribution suitability classes, except for the tree cover, non-vegetation, slope, and longitude, which showed significant (p < 0.01) and non-significant differences. These low and non-significances indicate the little importance of these parameters in the modeling of the species distribution, with a cumulative contribution lower than 5%. A matrix comparing the mean values of environmental parameters of the observed distribution and the modeled suitability classes was derived to verify the sensitivity of our model in estimating each parameter (Table 3).
Considering the 0.4 threshold to define the suitable classes, the most influencing environmental conditions estimated by the MaxEnt model were analyzed. The elevation range for all classes is between 466.4 and 799.4 m, with a mean of 489.8 m and an optimum range higher than 764.5 m. For the suitable classes, the elevation was about 776.6 m, with higher values for the extremely suitable area, whereas the estimated elevation for the unsuitable classes remains below the observed values. The estimated mean annual temperature (BIO1) varies between 2.16 and 14.5 °C, with an optimal range between 9.7 and 14.5 °C and a mean of 12.92 °C. Based on the model estimation, the preferred temperature seasonality (BIO4) range for all the classes is between 614.6 and 852.6, with an optimum range between 614.6 and 629.4 and a mean of 621.6 for suitable classes. The temperature seasonality variability means for suitable classes fit remarkably within the temperature seasonality range of observed point. For the annual precipitation (BIO12) and the maximum temperature of the warmest month (BIO5), the model estimates a mean of 459.2 mm and 30.27 °C, respectively, with a range between 428.7 and 825.7 mm for BIO 12 and between 26.4 and 30.6 °C for BIO5. The optimum values are between 727.6 and 772.3 mm for BIO12 and 26.8 and 27.5 °C for BIO5.

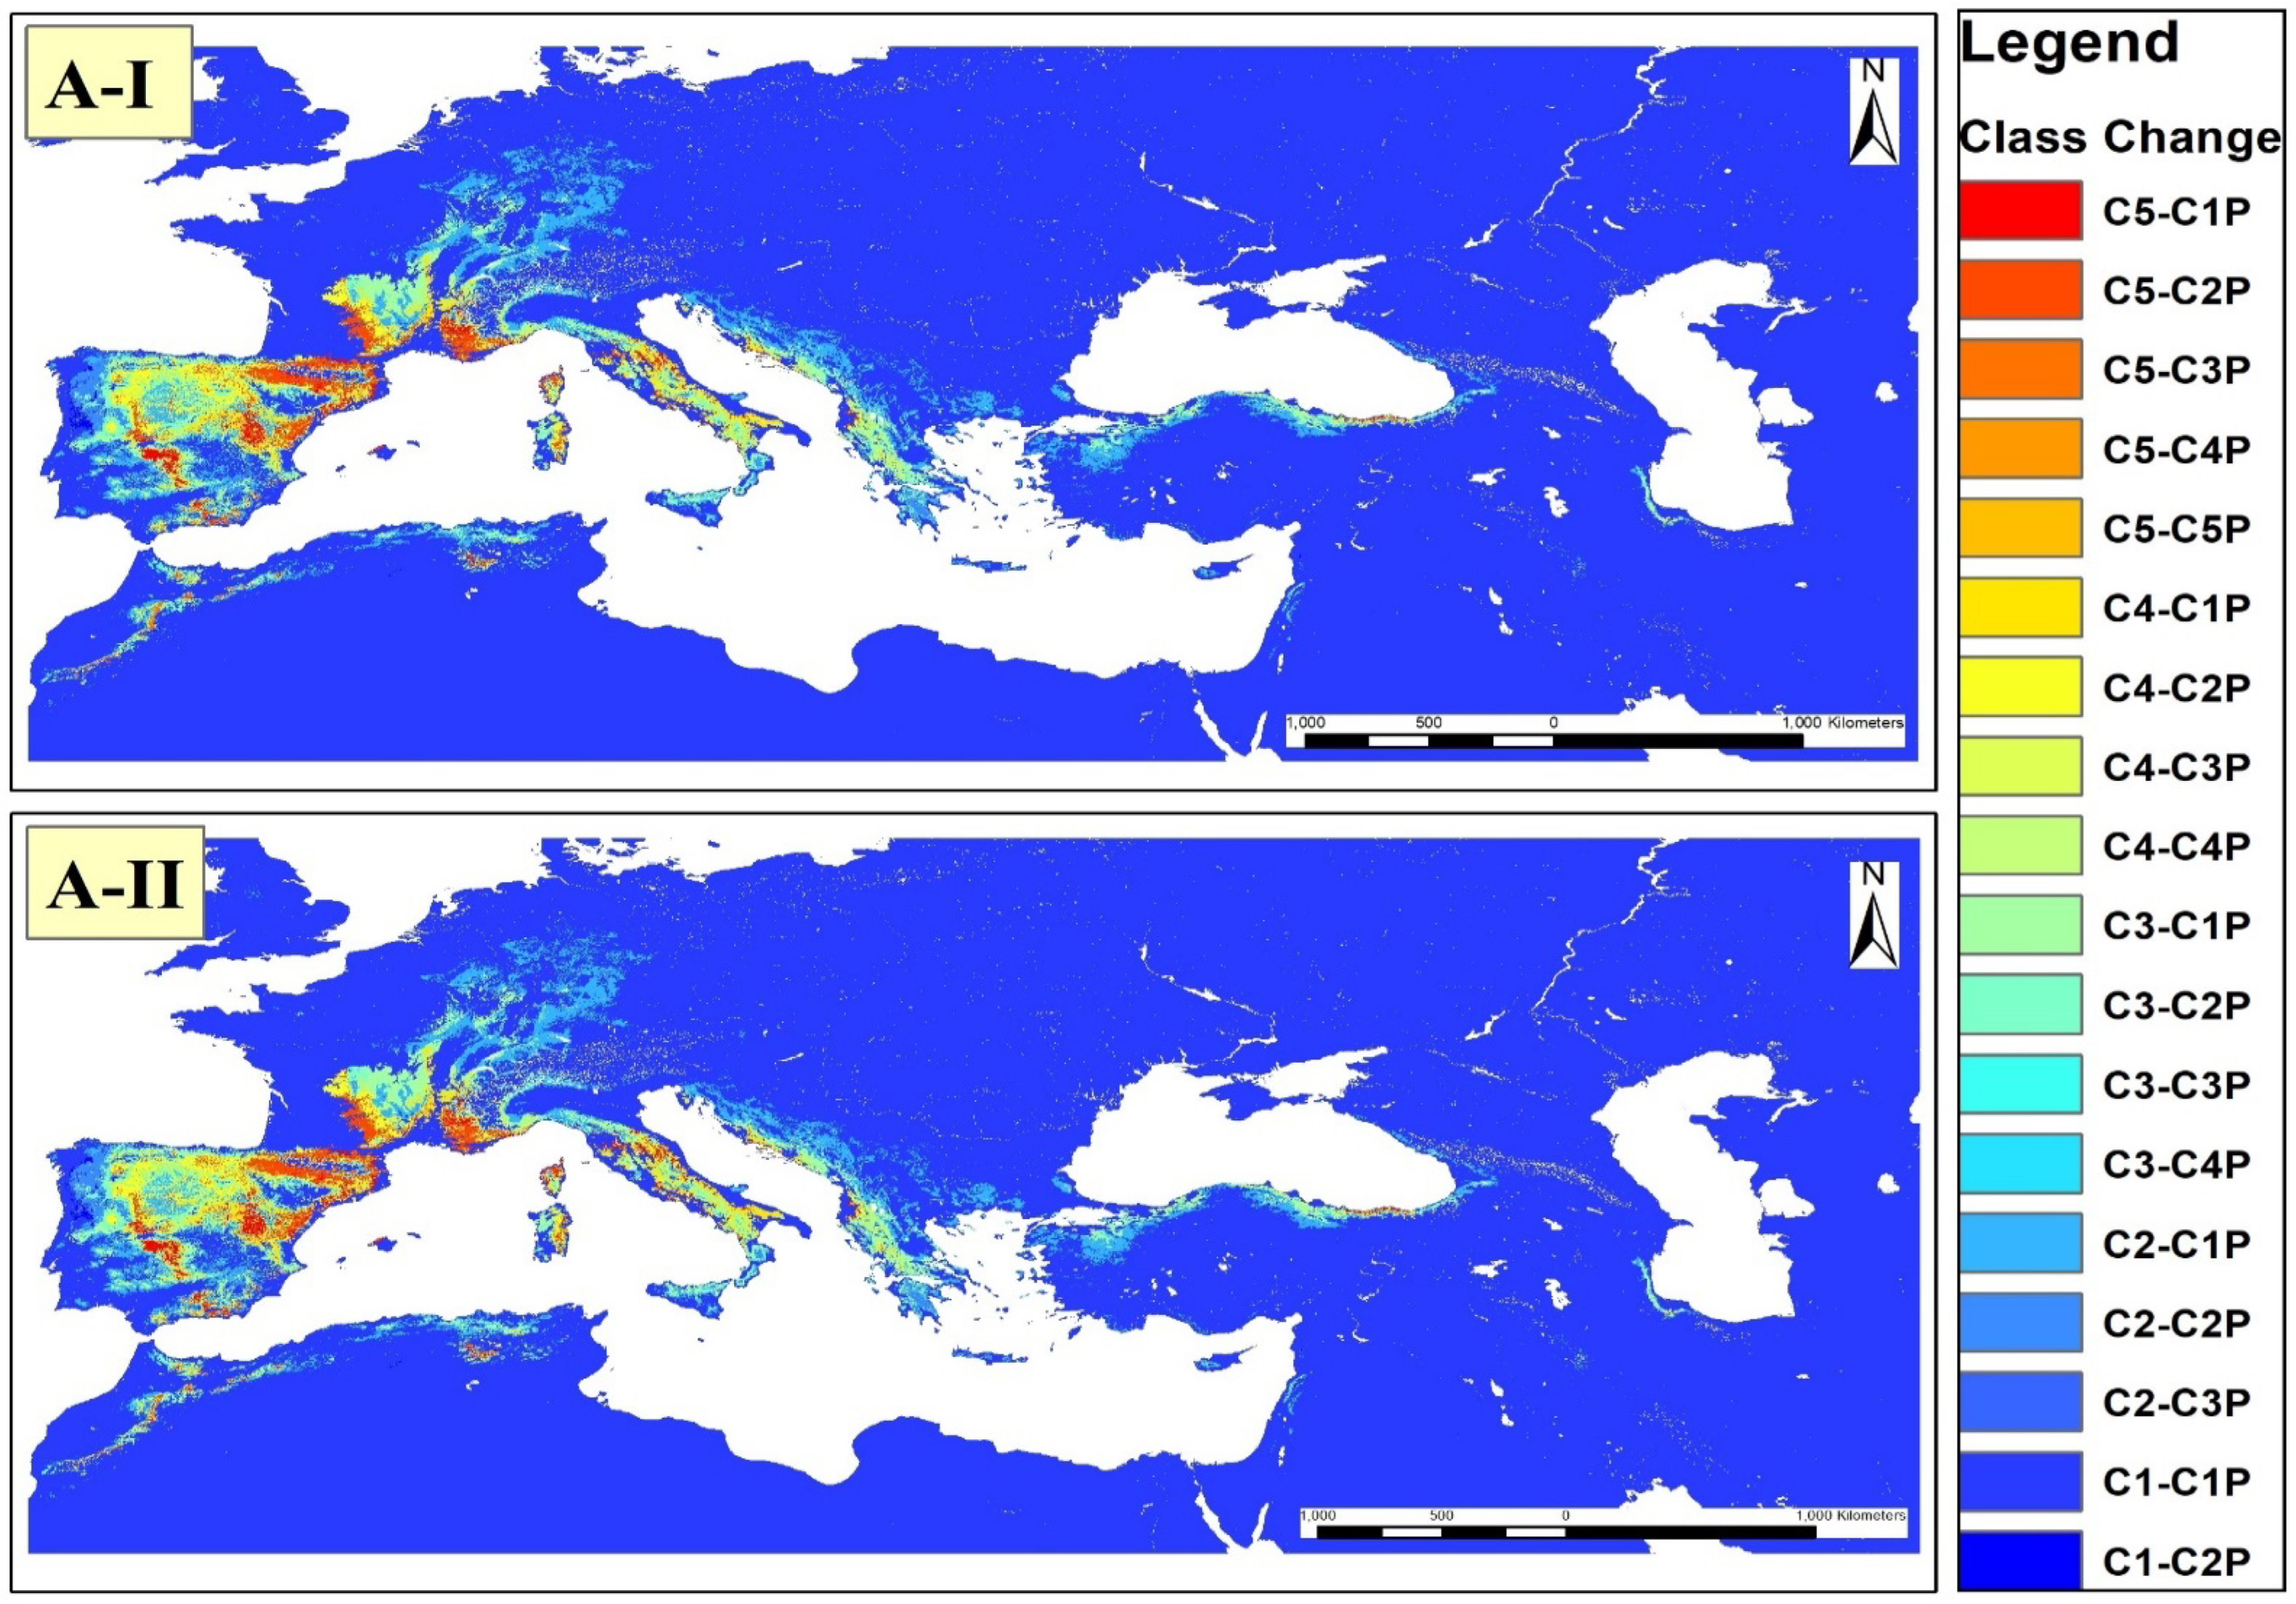
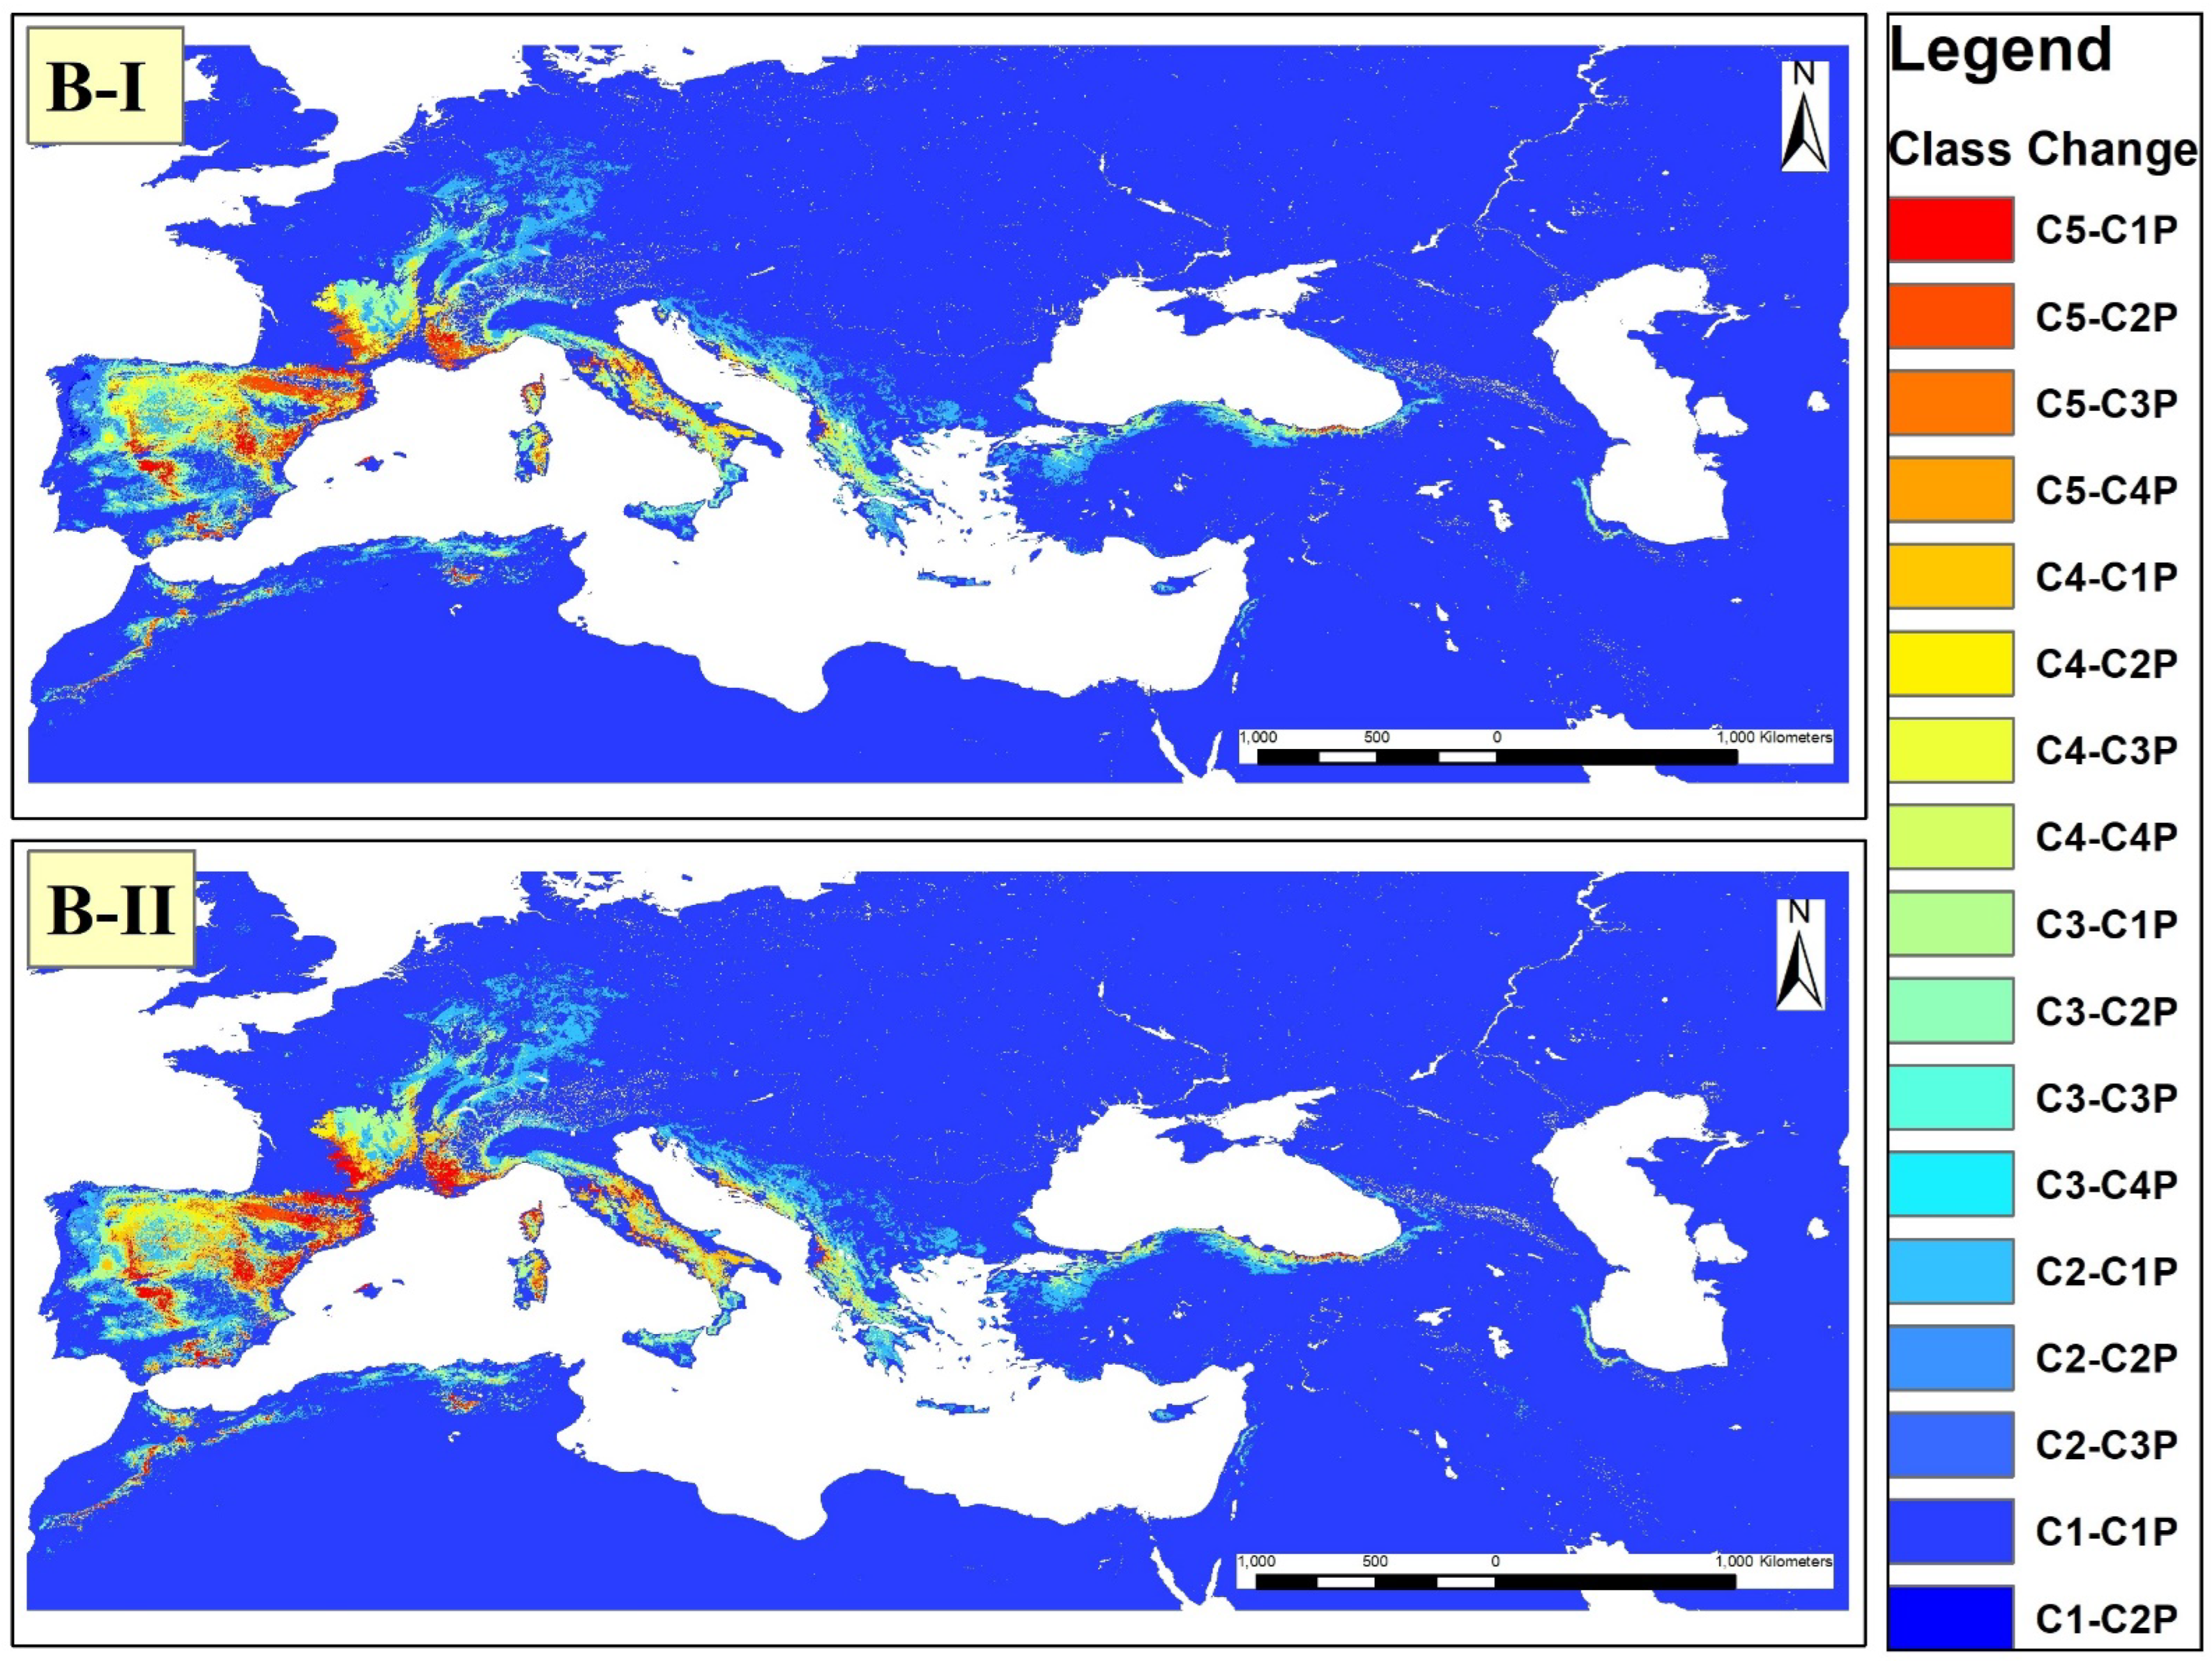
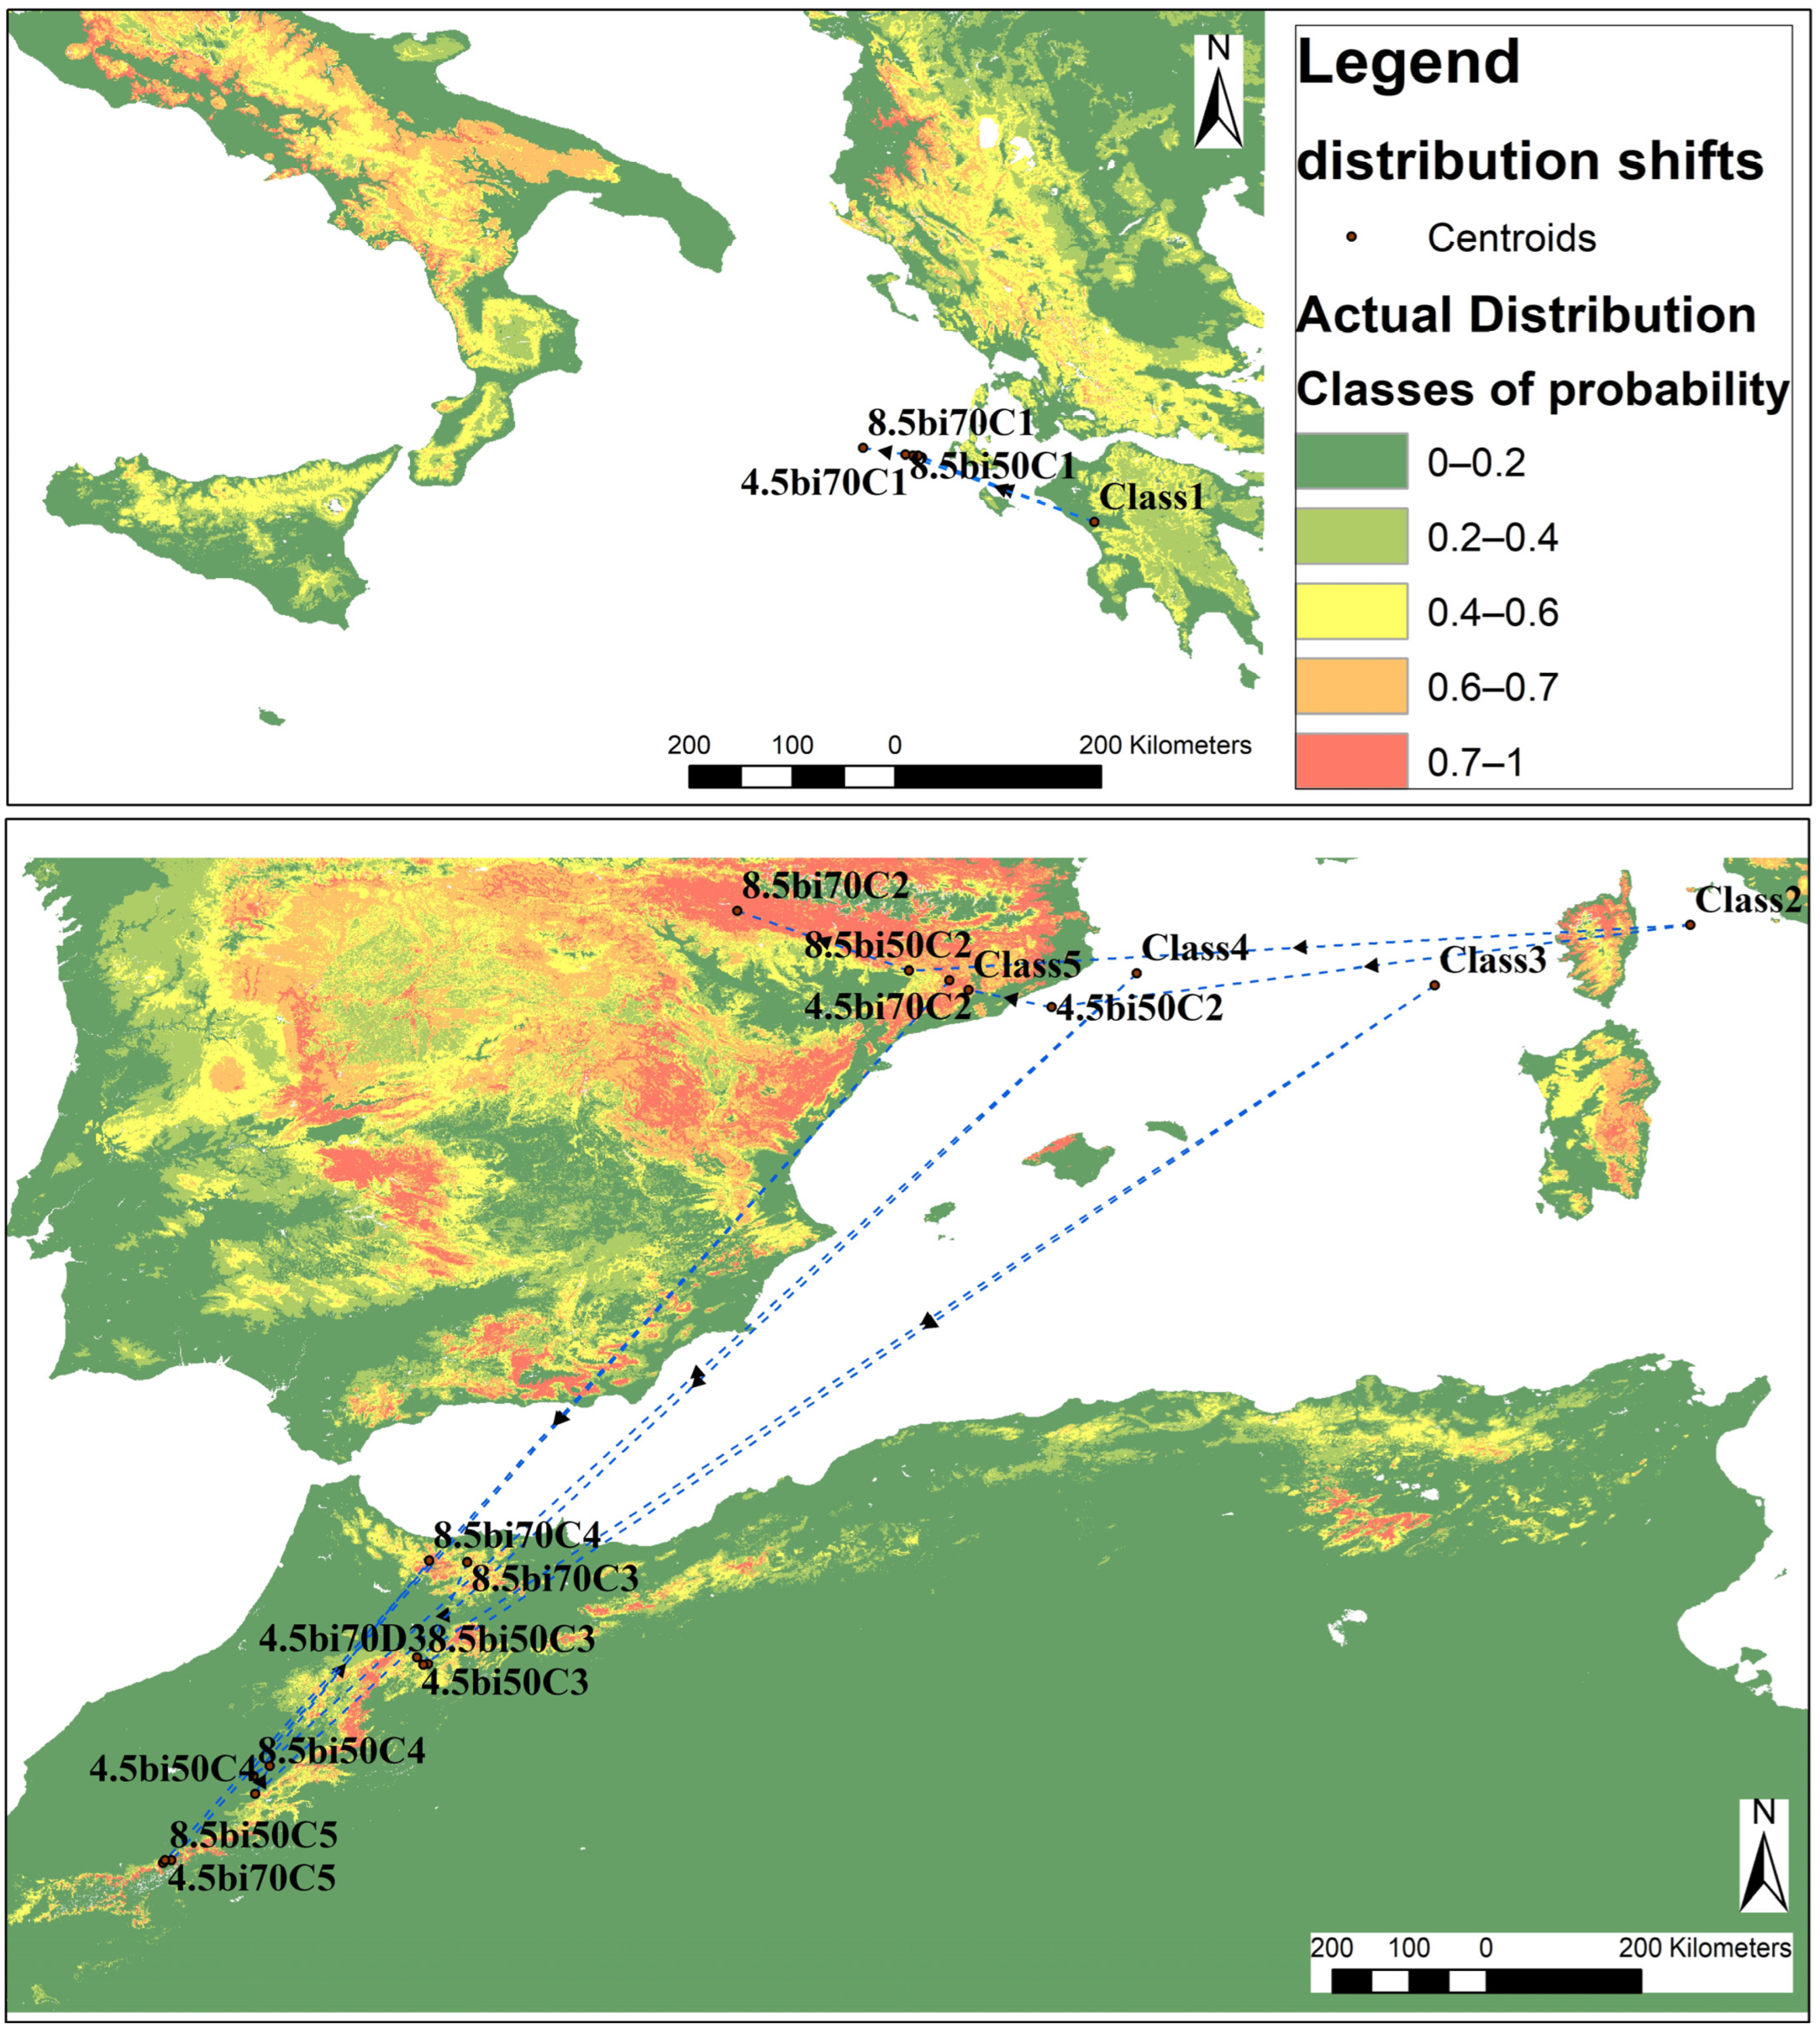
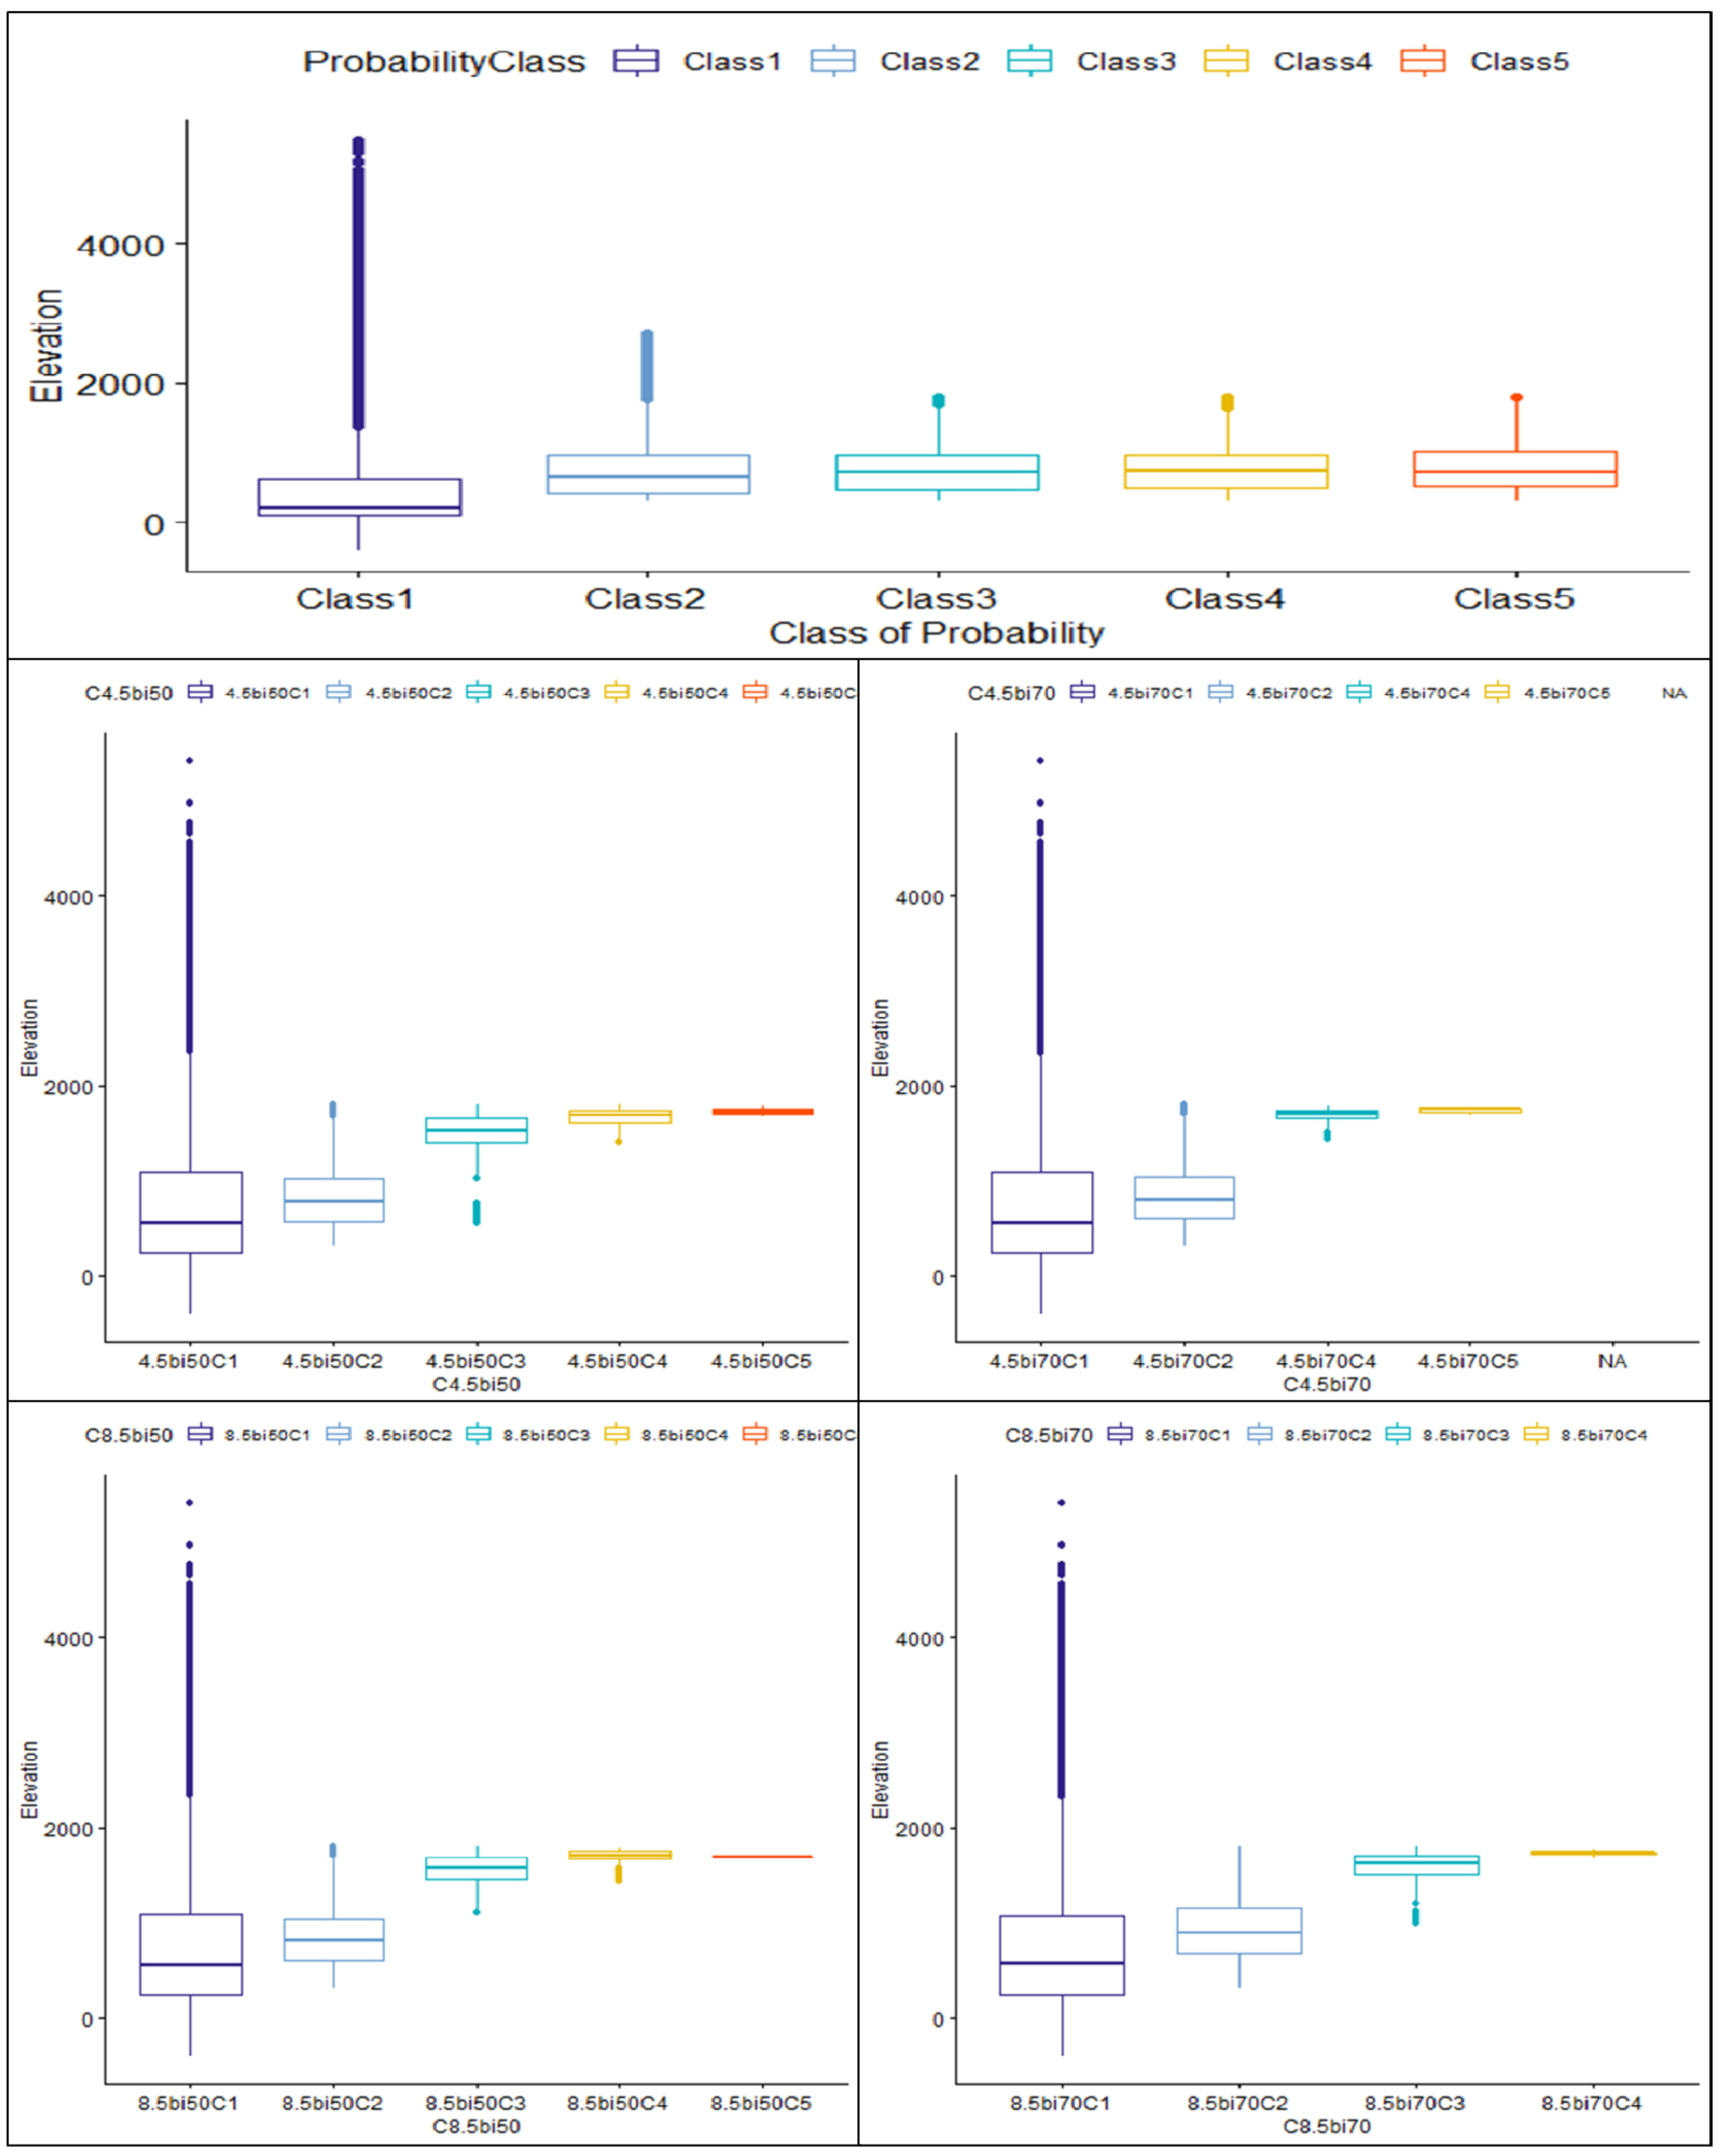
3.3. Suitability Distribution in the Future

Shallow projected potential suitable areas for Montpellier Maple are expected to remain under future climate conditions regardless of the climate scenario and the studied time periods (Table 4).
Under the moderate RCP4.5 scenario, 99.91% of the currently suitable areas are expected to disappear, while this percentage is expected to reach 99.95% under the extreme RCP8.5 scenario by the end of the 21st century (2060–2080 period). The highly and extremely suitable classes are expected to completely disappear in the future (less than 0.1%). For example, from the current 176,846 km2 of extremely suitable area for the species distribution, only 850.4 km2 remains considering the RCP 4.5 climatic scenario for the 2040–2060 period, whereas this area will be restricted to only 129.6 km2 under the RCP 8.5 climatic scenario for the 2060–2080 period. Results in Table 4 show that only some pixels have gained suitability status by changing into higher suitability classes. These changes are very minor and are more remarkable for RCP 4.5 than RCP 8.5, and for the 2040–2060 period than the 2060–2080 period. Regarding suitability class changes (Figure 8, Table 4), migrations from one class to another are predicted to be the same regardless of the climatic scenario and the chosen period, although some slight differences occur, especially for the number of unchanged pixels (Table 4); as an example, only 0.05% to 0.33% of the extremely suitable class will persist under future projections.
Remarkably, the suitability loss will become more effective under the RCP 8.5 scenario and more for the 2060–2080 period than the 2040–2060 period. The results show that the majority of suitable classes will change to the unsuitable class, except for some cases where they change to the barely suitable class. Moreover, Table 4 shows that some suitable classes will gain some areas from the lower suitability classes, but always at a slow change rate.
As a result of the above-described changes under the projected climate conditions, the centroids of the different suitability classes are expected to show important spatial shifts (Figure 8 and Figure 9).
Modeling shows a migration of suitable classes of species distribution from the north-west of the Mediterranean Sea to the Rif and Atlas Mountain chains in Morocco, and a migration of unsuitable classes to Northeastern Spain. The few extremely suitable areas expected to remain will migrate from north-eastern Spain to the High Atlas Mountains, regardless of the projections. The class of highly suitable areas will migrate to a restricted location between the Middle and the High Atlas Mountains, except for the RCP 8.5 scenario under the 2060–2080 period where it will migrate to the northern edges of the Rif Mountains. For the suitable class of distribution, it will migrate to an area between the Rif and the Middle Atlas Mountains. The barely suitable class centroid is predicted to migrate from north-eastern Italy to north-western Spain and more to the western parts of Spain for the RCP 8.5 scenario, while the unsuitable class centroid will persist in the central Mediterranean area (Figure 8).

4. Discussion

4.1. Current Potential Distribution

The relationship between species and the environment is an important aspect of studying ecological needs and spatial distribution of species [3]. With a suitability range higher than 0.4 as an optimum, considering the environmental variables and classes observed in Figure 7, the optimum elevation range is higher than 764.5 m, which is close to the observed values. Moreover, the estimated optimal slope range between 9.7° and 14.5° is highly consistent with the observed conditions, where the majority of trees are observed to be in a slope range between 0 to 20 degrees. The optimum temperature seasonality (BIO4) ranges between 614.6 and 629.4, with an observed mean of 623. For the annual precipitation (BIO12), the optimum values are between 727.6 and 772.3 mm, and the majority of observed habitats are located in the range of 700 and 900 mm, with a mean of observed precipitation of about 778 mm. The optimum range of the BIO5 climatic variable is estimated between 26.8 and 27.5 °C, which is consistent with the observed range between 26 and 27 °C. This observed accordance between the estimated distribution of the species and the observed field parameters confirms the quality and the capacity of the model in estimating the distribution of the Montpellier Maple in its natural range. By analyzing the species distribution compared to field parameters, we found that the majority of tree stands are located in areas with a maximum of 20% bare soil and with a predominance of shrub lands. Moreover, the species occurrence decreases with higher tree cover areas. Those analyses can be validated by the fact that the Montpellier Maple prefers shrublands and forest edges areas with good light exposure [60]; however, our model predicts that vegetation parameters have a very minor influence on the distribution of the species, considering that the contribution to the used model does not exceed 5% of all variables. Our results also show that there is no significant effect of vegetation parameters on the current predictions of the Montpellier Maple suitable areas or on the differences between classes of suitability.

4.2. Suitability Distribution in the Future

Under different climate scenarios, the location of the suitable distribution areas for the species is predicted to shift from south-eastern Europe to the North Africa region, especially the Rif and Atlas Mountains in Morocco. Regarding the jack-knife test results (Figure 6), the distribution of the species is revealed to be mainly influenced by the elevation and the temperature seasonality, with a 73.5% cumulative contribution to the species distribution. Results in Figure 6 show that temperature seasonality contributes to 40% of the species distribution and elevation is the most influencing parameter on the species modeling, since it has a permutation value of 44.4%. Our results showed that the species prefers areas with moderate to low deviations in temperature, which could explain its future spatial restriction concerning the potential climate changes of the Mediterranean region [37]. Regarding elevation range variation within the future climate change scenario, our study revealed an increase in the optimum range between the current and future conditions. The suitable areas for species will be higher and more restricted. As an example, the species’ highly suitable areas will be limited to an elevation range between 1677 and 1784 m under the RCP4.5 scenario in the 2060–2080 time period (Figure 10), while its predicted optimum mean elevation for the current conditions ranges around 799.4 ± 350 m. The results of this study are consistent with those of other studies showing that climate warming causes species to migrate to higher altitudes [3,13,32,61,62]. Although the species-suitable area will be limited to higher altitudes, it is observed to be restricted to the elevation threshold of the actual species range. Those results are in accordance with the work of He et al. [63], who predicted that suitable areas for alpine vegetation will shift from the lowest and highest elevations and be limited to a suitable range between 4500 and 5000 m. Moreover, Jiang et al. [56] found that the future potential distribution of three Fritillaria species will shift towards higher altitudes without exceeding the actual optimum elevation range of the species.
The Montpellier Maple suitable area is predicted to lose more than 99% of its value, decreasing from 4.76% to 0.05% of the total study area under the RCP 8.5 scenario for the 2060–2080 time period. According to, Khan et al. [55] future suitable areas of Pinus gerardiana Wall. will shrink by more than 94% under the RCP 8.5 scenario for the 2060–2080 period. Moreover, Fyllas et al. [64] predicted the loss of suitable areas of several tree species in Greece under future climate conditions, with the highest suitability loss estimated under the RCP 8.5 scenario. They predicted that Fagus sylvatica L. will lose more than 93% of its suitable area in future conditions.
The estimated changes in the potential distribution of the species are more revealed in the RCP 8.5 scenarios than the RCP 4.5 scenarios and for the 2060–2080 time period than in the 2040–2060 time period. Those changes have the same tendency as the bioclimatic parameters’ changes in the Mediterranean region, as revealed by Ducrocq et al. [16]. The changing climate conditions are revealed as the main conditions causing the restriction of suitable areas for many species all over the world, and especially in the Mediterranean area, which is considered a hotspot regarding biodiversity loss [65]. Wei et al. [35] highlight the effects of climatic conditions on the decrease in suitable areas for the propagation of caterpillar fungus in China. Highly suitable areas for Quercus libani Oliv. in Turkey are predicted to decrease from 4.1% to 1.4% of the total study area for the period 2060–2080 under the RCP 8.5 scenario [4]. The analysis of the suitability class migration in space based on the changes in class centroids showed that the species suitability will be restricted from the center and eastern Mediterranean region towards the south-western limits of the considered area (Figure 8). Several studies on species distribution modeling mentioned shifting of the suitable areas of different species in the future [34,66]. Although the results show some differences with our study between the future localities of classes’ centroids, a global trend of shifting in species suitable areas should be underlined. The suitable areas with a probability of distribution (Class 3, 4, and 5) above 0.4 will migrate in a south-western direction, while the barely suitable and unsuitable classes’ centroids will move to the south.
Our study reveals a larger climatically suitable area for the Montpellier Maple than the observed distribution in the current period, which suggests the possibility of introducing the species to these areas. The only parameters considered to estimate the future potential distribution of the Montpellier Maple are those related to climate change. Future changes in topographic and vegetation variables were not considered, although they may have a significant effect on the potential distribution area of the species. Therefore, it is important to consider other parameters, such as anthropic, ecosystemic, geographic, and geo-morphologic factors, in future work. However, we should also pay more attention to the credible expression of more variables to improve the prediction accuracy of species modeling distribution [15,57,67].

5. Conclusions

The MaxEnt model shows a high level of performance with an AUC superior to 0.9. The most important parameters were the temperature seasonality, elevation, mean annual temperature, annual precipitation, and maximum temperature of the warmest month. These factors have a cumulative contribution rate of more than 90%. The model results showed that the species prefers mountainous areas with sub-humid to humid climates. The MaxEnt model shows a decline in species suitability in relation to climate change. Shifting in suitable areas of the species to the Atlas and Rif Mountain chains indicates the vulnerability of the species to climate change. This work shows the effects of climate change on the global distribution of the Montpellier Maple habitat, but more investigations should be undertaken to highlight the effects of other biotic and abiotic factors on future specie distribution.

Author Contributions

Conceptualization, H.A., H.M. and I.T.; methodology, H.A. and H.M.; software, H.A.; validation, H.A., H.M. and I.T.; formal analysis, H.A.; investigation, H.A.; resources, H.A. and H.M.; data curation, H.A.; writing—original draft preparation, H.A.; writing—review and editing, H.M., I.T., J.B. and A.K.; visualization, H.A.; supervision, H.M., J.B. and A.K.; project administration, J.B. and A.K.; funding acquisition, I.T., H.M. and J.B. All authors have read and agreed to the published version of the manuscript.

Funding

Funding support for this research was provided by the project titled “Eating the wild: Improving the value-chain of Mediterranean Wild Food Products (WFP)”—WildFood (Reference Number: 2019-SECTION2-29) and the project: HYDROMED (PID-2019-111332RB-C21). Hassane Moutahir is supported by the Generalitat Valenciana and the European Social Fund (APOSTD20/2019-7956).

Data Availability Statement

The data used in this research was obtained from free data sources that are available and free of charge. The sources of the data are cited in the manuscript.

Acknowledgments

This research was supported by the National Research Institute for Rural Engineering, Waters, and Forestry-INRGREF. Laboratory of Management and Valorization of Forest Resources, Tunisia. This research was done based on the cooperation between the National Research Institute for Rural Engineering, Waters, and Forestry-INRGREF and the University of Alicante. We thank Santiago Soliveres Codina and Aymen Moghli from the University of Alicante for their help and support.

Conflicts of Interest

The authors declare no conflict of interest. The funders had no role in the design of the study; in the collection, analyses, or interpretation of data; in the writing of the manuscript, or in the decision to publish the results.

References

  1. Milligan, S.R.; Holt, W.V.; Lloyd, R. Impacts of Climate Change and Environmental Factors on Reproduction and Development in Wildlife. Phil. Trans. R. Soc. B 2009, 364, 3313–3319. [Google Scholar] [CrossRef] [Green Version]
  2. Mott, C.L. Environmental Constraints to the Geographic Expansion of Plant and Animal Species. Nat. Educ. Knowl. 2010, 3, 72. [Google Scholar]
  3. Yi, Y.; Cheng, X.; Yang, Z.-F.; Zhang, S.-H. Maxent Modeling for Predicting the Potential Distribution of Endangered Medicinal Plant (H. Riparia Lour) in Yunnan, China. Ecol. Eng. 2016, 92, 260–269. [Google Scholar] [CrossRef]
  4. Çoban, H.O.; Örücü, Ö.K.; Arslan, E.S. MaxEnt Modeling for Predicting the Current and Future Potential Geographical Distribution of Quercus Libani Olivier. Sustainability 2020, 12, 2671. [Google Scholar] [CrossRef] [Green Version]
  5. Clark, J.S.; Iverson, L.; Woodall, C.W.; Allen, C.D.; Bell, D.M.; Bragg, D.C.; D’Amato, A.W.; Davis, F.W.; Hersh, M.H.; Ibanez, I.; et al. The Impacts of Increasing Drought on Forest Dynamics, Structure, and Biodiversity in the United States. Glob. Chang. Biol. 2016, 22, 2329–2352. [Google Scholar] [CrossRef] [Green Version]
  6. Gazol, A.; Camarero, J.J.; Vicente-Serrano, S.M.; Sánchez-Salguero, R.; Gutiérrez, E.; de Luis, M.; Sangüesa-Barreda, G.; Novak, K.; Rozas, V.; Tíscar, P.A.; et al. Forest Resilience to Drought Varies across Biomes. Glob. Chang. Biol. 2018, 24, 2143–2158. [Google Scholar] [CrossRef]
  7. Okin, G.S.; Dong, C.; Willis, K.S.; Gillespie, T.W.; MacDonald, G.M. The Impact of Drought on Native Southern California Vegetation: Remote Sensing Analysis Using MODIS-Derived Time Series. J. Geophys. Res. Biogeosciences 2018, 123, 1927–1939. [Google Scholar] [CrossRef]
  8. Rodriguez-Caballero, E.; Belnap, J.; Büdel, B.; Crutzen, P.J.; Andreae, M.O.; Pöschl, U.; Weber, B. Dryland Photoautotrophic Soil Surface Communities Endangered by Global Change. Nat. Geosci. 2018, 11, 185–189. [Google Scholar] [CrossRef]
  9. Wieneke, S.; Burkart, A.; Cendrero-Mateo, M.P.; Julitta, T.; Rossini, M.; Schickling, A.; Schmidt, M.; Rascher, U. Linking Photosynthesis and Sun-Induced Fluorescence at Sub-Daily to Seasonal Scales. Remote Sens. Environ. 2018, 219, 247–258. [Google Scholar] [CrossRef]
  10. Guimarães, P.R. The Structure of Ecological Networks Across Levels of Organization. Annu. Rev. Ecol. Evol. Syst. 2020, 51, 433–460. [Google Scholar] [CrossRef]
  11. Bhat, J.A.; Kumar, M.; Pala, N.A.; Shah, S.; Dayal, S.; Gunathilake, C.; Negi, A.K. Influence of Altitude on the Distribution Pattern of Flora in a Protected Area of Western Himalaya. Acta Ecol. Sin. 2020, 40, 30–43. [Google Scholar] [CrossRef]
  12. Bazzaz, F.A. The Response of Natural Ecosystems to the Rising Global CO2 Levels. Annu. Rev. Ecol. Syst. 1990, 21, 167–196. [Google Scholar] [CrossRef]
  13. Malcolm, J.R.; Markham, A.; Neilson, R.P.; Garaci, M. Estimated Migration Rates under Scenarios of Global Climate Change. J. Biogeogr. 2002, 29, 835–849. [Google Scholar] [CrossRef] [Green Version]
  14. Malcolm, J.R.; Liu, C.; Neilson, R.P.; Hansen, L.; Hannah, L. Global Warming and Extinctions of Endemic Species from Biodiversity Hotspots. Conserv. Biol. 2006, 20, 538–548. [Google Scholar] [CrossRef]
  15. Dawson, T.P.; Jackson, S.T.; House, J.I.; Prentice, I.C.; Mace, G.M. Beyond Predictions: Biodiversity Conservation in a Changing Climate. Science 2011, 332, 53–58. [Google Scholar] [CrossRef] [Green Version]
  16. Ducrocq, V.; Drobinski, P.; Lambert, D.; Molinié, G.; Llasat, C. Preface: Forecast and Projection in Climate Scenario of Mediterranean Intense Events: Uncertainties and Propagation on Environment (the MEDUP Project). Nat. Hazards Earth Syst. Sci. 2013, 13, 3043–3047. [Google Scholar] [CrossRef] [Green Version]
  17. Kim, G.-U.; Seo, K.-H.; Chen, D. Climate Change over the Mediterranean and Current Destruction of Marine Ecosystem. Sci. Rep. 2019, 9, 18813. [Google Scholar] [CrossRef] [Green Version]
  18. Angert, A.L.; Bontrager, M.G.; Ågren, J. What Do We Really Know About Adaptation at Range Edges? Annu. Rev. Ecol. Evol. Syst. 2020, 51, 341–361. [Google Scholar] [CrossRef]
  19. Martínez-López, J.; Bagstad, K.J.; Balbi, S.; Magrach, A.; Voigt, B.; Athanasiadis, I.; Pascual, M.; Willcock, S.; Villa, F. Towards Globally Customizable Ecosystem Service Models. Sci. Total Environ. 2019, 650, 2325–2336. [Google Scholar] [CrossRef]
  20. Vilà-Cabrera, A.; Premoli, A.C.; Jump, A.S. Refining Predictions of Population Decline at Species’ Rear Edges. Glob. Chang. Biol. 2019, 25, 1549–1560. [Google Scholar] [CrossRef] [Green Version]
  21. Valladares, F.; Matesanz, S.; Guilhaumon, F.; Araújo, M.B.; Balaguer, L.; Benito-Garzón, M.; Cornwell, W.; Gianoli, E.; Kleunen, M.; Naya, D.E.; et al. The Effects of Phenotypic Plasticity and Local Adaptation on Forecasts of Species Range Shifts under Climate Change. Ecol. Lett. 2014, 17, 1351–1364. [Google Scholar] [CrossRef] [PubMed]
  22. Phillips, S.J.; Anderson, R.P.; Schapire, R.E. Maximum Entropy Modeling of Species Geographic Distributions. Ecol. Model. 2006, 190, 231–259. [Google Scholar] [CrossRef] [Green Version]
  23. Kumar, S.; Stohlgren, T.J. Maxent Modeling for Predicting Suitable Habitat for Threatened and Endangered Tree Canacomyrica Monticola in New Caledonia. J. Ecol. Nat. Environ. 2009, 1, 94–98. [Google Scholar]
  24. Gebrewahid, Y.; Abrehe, S.; Meresa, E.; Eyasu, G.; Abay, K.; Gebreab, G.; Kidanemariam, K.; Adissu, G.; Abreha, G.; Darcha, G. Current and Future Predicting Potential Areas of Oxytenanthera Abyssinica (A. Richard) Using MaxEnt Model under Climate Change in Northern Ethiopia. Ecol. Process. 2020, 9, 6. [Google Scholar] [CrossRef] [Green Version]
  25. Hemati, T.; Pourebrahim, S.; Monavari, M.; Baghvand, A. Species-Specific Nature Conservation Prioritization (a Combination of MaxEnt, Co$ting Nature and DINAMICA EGO Modeling Approaches). Ecol. Model. 2020, 429, 109093. [Google Scholar] [CrossRef]
  26. Mahatara, D.; Acharya, A.; Dhakal, B.; Sharma, D.; Ulak, S.; Paudel, P. Maxent Modelling for Habitat Suitability of Vulnerable Tree Dalbergia Latifolia in Nepal. Silva Fennica 2021, 55. [Google Scholar] [CrossRef]
  27. Spatial Modeling in Forest Resources Management; Shit, P.K.; Pourghasemi, H.R.; Das, P.; Bhunia, G.S. (Eds.) Environmental Science and Engineering; Springer International Publishing: Cham, Switzerland, 2021; ISBN 978-3-030-56541-1. [Google Scholar]
  28. Wei, Y.; Zhang, L.; Wang, J.; Wang, W.; Niyati, N.; Guo, Y.; Wang, X. Chinese Caterpillar Fungus (Ophiocordyceps Sinensis) in China: Current Distribution, Trading, and Futures under Climate Change and Overexploitation. Sci. Total Environ. 2021, 755, 142548. [Google Scholar] [CrossRef]
  29. Fielding, A.H.; Bell, J.F. A Review of Methods for the Assessment of Prediction Errors in Conservation Presence/Absence Models. Environ. Conserv. 1997, 24, 38–49. [Google Scholar] [CrossRef]
  30. Merow, C.; Smith, M.J.; Silander, J.A. A Practical Guide to MaxEnt for Modeling Species’ Distributions: What It Does, and Why Inputs and Settings Matter. Ecography 2013, 36, 1058–1069. [Google Scholar] [CrossRef]
  31. Qin, A.; Liu, B.; Guo, Q.; Bussmann, R.W.; Ma, F.; Jian, Z.; Xu, G.; Pei, S. Maxent Modeling for Predicting Impacts of Climate Change on the Potential Distribution of Thuja Sutchuenensis Franch., an Extremely Endangered Conifer from Southwestern China. Glob. Ecol. Conserv. 2017, 10, 139–146. [Google Scholar] [CrossRef]
  32. Abdelaal, M.; Fois, M.; Fenu, G.; Bacchetta, G. Using MaxEnt Modeling to Predict the Potential Distribution of the Endemic Plant Rosa Arabica Crép. in Egypt. Ecol. Inform. 2019, 50, 68–75. [Google Scholar] [CrossRef]
  33. Zhang, K.; Sun, L.; Tao, J. Impact of Climate Change on the Distribution of Euscaphis Japonica (Staphyleaceae) Trees. Forests 2020, 11, 525. [Google Scholar] [CrossRef]
  34. Du, Z.; He, Y.; Wang, H.; Wang, C.; Duan, Y. Potential Geographical Distribution and Habitat Shift of the Genus Ammopiptanthus in China under Current and Future Climate Change Based on the MaxEnt Model. J. Arid Environ. 2021, 184, 104328. [Google Scholar] [CrossRef]
  35. Wei, B.; Wang, R.; Hou, K.; Wang, X.; Wu, W. Predicting the Current and Future Cultivation Regions of Carthamus Tinctorius L. Using MaxEnt Model under Climate Change in China. Glob. Ecol. Conserv. 2018, 16, e00477. [Google Scholar] [CrossRef]
  36. Willcock, S.; Hooftman, D.A.P.; Balbi, S.; Blanchard, R.; Dawson, T.P.; O’Farrell, P.J.; Hickler, T.; Hudson, M.D.; Lindeskog, M.; Martinez-Lopez, J.; et al. A Continental-Scale Validation of Ecosystem Service Models. Ecosystems 2019, 22, 1902–1917. [Google Scholar] [CrossRef] [Green Version]
  37. IPCC Climate Change 2021: The Physical Science Basis. Contribution of Working Group I to the Sixth Assessment Report of the Intergovernmental Panel on Climate Change; Cambridge University Press: Cambridge, UK, 2021. [Google Scholar]
  38. Crowley, D.; Rivers, M.C.; Barstow, M. 2018. Acer Monspessulanum (Errata Version Published in 2018). The IUCN Red List of Threatened Species: 2018, e.T193835A135202094. Available online: https://dx.doi.org/10.2305/IUCN.UK.2018-1.RLTS.T193835A124731677.en (accessed on 10 January 2021).
  39. Lionello, P.; Planton, S.; Rodo, X. Preface: Trends and Climate Change in the Mediterranean Region. Glob. Planet. Chang. 2008, 63, 87–89. [Google Scholar] [CrossRef]
  40. Lionello, P.; Abrantes, F.; Gacic, M.; Planton, S.; Trigo, R.; Ulbrich, U. The Climate of the Mediterranean Region: Research Progress and Climate Change Impacts. Reg. Environ. Chang. 2014, 14, 1679–1684. [Google Scholar] [CrossRef]
  41. Planton, S.; Driouech, F.; Rhaz, K.E.; Lionello, P. Sub-Chapter 1.2.2. The Climate of the Mediterranean Regions in the Future Climate Projections. In The Mediterranean Region under Climate Change, IRD ed.; Recherche pour le Développement or IRD: Marseille, France, 2016; pp. 83–91. [Google Scholar]
  42. DGF Filière Des Semences Forestières et Pastorales En Tunisie. Projet de Gestion Intégrée des Forêts (Phase II); DGF: Tunis, Tunisia, 2015. [Google Scholar]
  43. Van Gelderen, D.M.; Oterdoom, H.J.; de Jong, P.C. Maples of the World; Timber Press: Portland, OR, USA, 1995; Volume 32. [Google Scholar]
  44. D’Ambrosio, C. La Biosistematica Molecolare Del Genere Acer: Applicazione Del Método Barcoding Alle Specie Italiane. Ph.D. Thesis, Università degli Studi della Tuscia di Viterbo, Viterbo, Italy, 2009. [Google Scholar]
  45. Coombes, A.J.; Debreczy, Z. Arbres:L’encyclopedie Des 600 Plus Beaux Arbres Du Monde; Flammarion: Paris, France, 2011. [Google Scholar]
  46. Zare, A. A Study of Different Treatment Effect on Seed Germination Characteristics and Seedling Survival Montpellier Maple (Acer Menspessolanum Subsp. Turcomanicum Rech. F.). Indian J. Fundam. Appl. Life Sci. 2014, 4, 455–464. [Google Scholar]
  47. Wieczorek, K.; Kanturski, M.; Junkiert, Ł.; Bugaj-Nawrocka, A. A Comparative Morphometric Study of the Genus Drepanosiphoniella Davatchi, Hille Ris Lambers and Remaudière (Hemiptera: Aphididae: Drepanosiphinae). Zool. Anz. A J. Comp. Zool. 2015, 257, 39–53. [Google Scholar] [CrossRef]
  48. Pottier-Alapetite, G. Flore De La Tunisie: Angiospermes-Dicotyledones: * Apetales-Dialypetales; Le Ministère de l’Enseignement Supérieur et de la Recherche Scientifique et le Ministère de l’Agriculture: Tunis, Tunisia, 1979. [Google Scholar]
  49. Bi, W.; Gao, Y.; Shen, J.; He, C.; Liu, H.; Peng, Y.; Zhang, C.; Xiao, P. Traditional Uses, Phytochemistry, and Pharmacology of the Genus Acer (Maple): A Review. J. Ethnopharmacol. 2016, 189, 31–60. [Google Scholar] [CrossRef]
  50. Zhang, K.; Zhang, Y.; Jia, D.; Tao, J. Species Distribution Modeling of Sassafras Tzumu and Implications for Forest Management. Sustainability 2020, 12, 4132. [Google Scholar] [CrossRef]
  51. Fick, S.E.; Hijmans, R.J. WorldClim 2: New 1-km Spatial Resolution Climate Surfaces for Global Land Areas. Int. J. Climatol. 2017, 37, 4302–4315. [Google Scholar] [CrossRef]
  52. FAO. Harmonized World Soil Database (Version 1.1); FAO: Rome, Italy, 2009. [Google Scholar]
  53. Kopecký, M.; Macek, M.; Wild, J. Topographic Wetness Index Calculation Guidelines Based on Measured Soil Moisture and Plant Species Composition. Sci. Total Environ. 2021, 757, 143785. [Google Scholar] [CrossRef]
  54. Elith, J.; Phillips, S.J.; Hastie, T.; Dudík, M.; Chee, Y.E.; Yates, C.J. A Statistical Explanation of MaxEnt for Ecologists. Divers. Distrib. 2011, 17, 43–57. [Google Scholar] [CrossRef]
  55. Khan, A.M.; Li, Q.; Saqib, Z.; Khan, N.; Habib, T.; Khalid, N.; Majeed, M.; Tariq, A. MaxEnt Modelling and Impact of Climate Change on Habitat Suitability Variations of Economically Important Chilgoza Pine (Pinus gerardiana Wall.) in South Asia. Forests 2022, 13, 715. [Google Scholar] [CrossRef]
  56. Jiang, R.; Zou, M.; Qin, Y.; Tan, G.; Huang, S.; Quan, H.; Zhou, J.; Liao, H. Modeling of the potential geographical distribution of three Fritillaria species under climate change. Front. Plant Sci. 2021, 12, 749838. [Google Scholar] [CrossRef]
  57. Phillips, S.J.; Dudík, M. Modeling of Species Distributions with Maxent: New Extensions and a Comprehensive Evaluation. Ecography 2008, 31, 161–175. [Google Scholar] [CrossRef]
  58. Swets, J. Measuring the Accuracy of Diagnostic Systems. Science 1988, 240, 1285–1293. [Google Scholar] [CrossRef] [Green Version]
  59. Yang, X.-Q.; Kushwaha, S.P.S.; Saran, S.; Xu, J.; Roy, P.S. Maxent Modeling for Predicting the Potential Distribution of Medicinal Plant, Justicia Adhatoda L. in Lesser Himalayan Foothills. Ecol. Eng. 2013, 51, 83–87. [Google Scholar] [CrossRef]
  60. Meddour, R.; Meddour-Sahar, O.; Derridj, A.; Géhu, J.-M. Synopsis Commenté Des Groupements Végétaux Forestiers et Préforestiers de La Kabylie Djurdjuréenne (Algérie). Rev. For. Française 2010, 62, 295–308. [Google Scholar] [CrossRef] [Green Version]
  61. Klausmeyer, K.R.; Shaw, M.R. Climate Change, Habitat Loss, Protected Areas and the Climate Adaptation Potential of Species in Mediterranean Ecosystems Worldwide. PLoS ONE 2009, 4, e6392. [Google Scholar] [CrossRef] [PubMed] [Green Version]
  62. Li, Y.; Li, M.; Li, C.; Liu, Z. Optimized Maxent Model Predictions of Climate Change Impacts on the Suitable Distribution of Cunninghamia Lanceolata in China. Forests 2020, 11, 302. [Google Scholar] [CrossRef] [Green Version]
  63. He, Y.; Xiong, Q.; Yu, L.; Yan, W.; Qu, X. Impact of Climate Change on Potential Distribution Patterns of Alpine Vegetation in the Hengduan Mountains Region, China. Mt. Res. Dev. 2020, 40, R48–R54. Available online: https://www.jstor.org/stable/27003481 (accessed on 14 February 2021). [CrossRef]
  64. Fyllas, N.M.; Koufaki, T.; Sazeides, C.I.; Spyroglou, G.; Theodorou, K. Potential Impacts of Climate Change on the Habitat Suitability of the Dominant Tree Species in Greece. Plants 2022, 11, 1616. [Google Scholar] [CrossRef] [PubMed]
  65. Cuttelod, A.; Garcia, N.; Malak, D.A.; Temple, H.J.; Katarya, V. The Mediterranean: A Biodiversity Hotspot under Threat. In Wildlife in a Changing World: An Analysis of the 2008 IUCN Red List of Threatened Species; IUCN: Gland, Switzerland, 2009; Volume 89. [Google Scholar]
  66. Portilla Cabrera, C.V.; Selvaraj, J.J. Geographic Shifts in the Bioclimatic Suitability for Aedes Aegypti under Climate Change Scenarios in Colombia. Heliyon 2020, 6, e03101. [Google Scholar] [CrossRef] [PubMed] [Green Version]
  67. Sillero, N.; Barbosa, A.M. Common Mistakes in Ecological Niche Models. Int. J. Geogr. Inf. Sci. 2021, 35, 213–226. [Google Scholar] [CrossRef]
Figure 1. The Montpellier Maple (Acer monspessulanum) in its natural habitat: (A) whole tree; (B) samara fruits; (C) leaves; and (D) bark aspect. Photos were taken by Hamdi Aouinti in Djebel Serj, Tunisia.
Forests 13 02049 g001
Figure 2. Study area: distribution area and presence points of the Montpellier Maple.
Forests 13 02049 g002
Figure 3. Correlation matrix of the used environmental variables of the reference period. See Table 1 for the description of the variables.
Forests 13 02049 g003
Figure 4. MaxEnt model performance for the Montpellier Maple (the Area Under Curve (AUC) parameters show an excellent performance with a value higher than 0.9).
Forests 13 02049 g004
Figure 5. Importance of the considered environmental parameters on the performance of the MaxEnt model.
Forests 13 02049 g005
Figure 6. Jack-knife test for measuring the importance of each environmental parameter on the predicted distribution of the Montpellier Maple using MaxEnt.
Forests 13 02049 g006
Figure 7. The current predicted distribution of the Montpellier Maple by class of suitability.
Forests 13 02049 g007
Figure 8. Changes in each suitability class in the future climatic conditions considering the 2 RCP scenarios 4.5 (A) and 8.5 (B) and the 2 time periods 2040/2060 (I) and 2060/2070 (II). C1, C2, C3, C4, and C5 are the suitability classes of the actual distribution. C1P, C2P, C3P, C4P, and C5P are the suitability classes for future distribution. Changes from classes C3, C4, and C5 to C1P and C2P show suitability losses.
Forests 13 02049 g008aForests 13 02049 g008b
Figure 9. Shifting in the centroids of suitability classes of Acer monspessulanum between actual and future predictions (the shifting direction is explained by the sense of the arrows and the dotted lines).
Forests 13 02049 g009
Figure 10. Changes in the altitude range of modeled actual and future distribution by class of suitability. C represents classes of suitability; 4.5 and 8.5 represent RCP 4.5 and RCP 8.5, respectively; bi 50 represents the bioclimatic condition of the period 2040–2060; bi 70 represents the bioclimatic condition of the period 2060–2080; and C1, C2, C3, C4, C5 represent class 1, class 2, class 3, class 4, class 5 of suitability.
Forests 13 02049 g010
Table 1. Selected environmental parameters used to run the MaxEnt model: source, abbreviations, and units.
Data Source and CategoryVariableDescriptionUnit
FAO global Harmonized World Soil Database
Topographic data
ElevationElevationm
SlopeSlopeDegree
AspectAspectDegree
TWITopographic Wetness Index
MODIS
Vegetation data
TCTree Cover%
NTCNon-Tree Vegetation%
NVNon-Vegetation%
Worldclim
Bioclimatic data
BIO1Annual Mean Temperature°C
BIO2Mean Diurnal Range (Mean of monthly (max temp–min temp))°C
BIO4Temperature Seasonality (standard deviation × 100)
BIO5Max Temperature of the Warmest Month°C
BIO8Mean Temperature of the Wettest Quarter°C
BIO12Annual Precipitationmm
BIO14Precipitation of the Driest Monthmm
BIO15Precipitation Seasonality (Coefficient of Variation)mm
BIO19Precipitation of Coldest Quartermm
Table 2. Classes of habitat suitability used to identify the potential and future species’ probability of distribution, based on the recommendations of Yi et al. [3].
Habitat Suitability ClassProbability of DistributionCombined Classes
Class 1: Unsuitable[0.0–0.2]Unsuitable classes
Class 2: Barely suitable[0.2–0.4]
Class 3: Suitable[0.4–0.6]Suitable classes
Class 4: Highly suitable[0.6–0.7]
Class 5: Extremely suitable[0.7–1.0]
Table 3. Matrix of means environmental parameters based on the observed data, the predicted actual distribution, and the suitability classes.
MeanObserved DistributionMean of Unsuitable ClassesMean of Suitable ClassesClass 1Class 2Class 3Class 4Class 5
X2.9 ± 6.719.5 ± 134.2 ± 2.828.7 ± 19.310.2 ± 13.37.1 ± 12.63.7 ± 9.541.7 ± 6.47
Y42.6 ± 2.542 ± 0.641.7 ± 0.141.5 ± 8.8242.3 ± 4.6241.6 ± 3.4141.7 ± 2.4941.5 ± 2.72
Elevation739.3 ± 327601.1 ± 190.4776.6 ± 19.7466.4 ± 566735.7 ± 355764.5 ± 335766 ± 310799.4 ± 350
Slope14.8 ± 225 ± 410.7 ± 3.42.1 ± 10.27.8 ± 17.79.7 ± 19.77.8 ± 17.714.5 ± 21.9
Aspect180.2 ± 103177.6 ± 5.1181.8 ± 2.5173.9 ± 107181.1 ± 108181.6 ± 107179.3 ± 105184.3 ± 101
TWI11.6 ± 3.413.7 ± 1.112.4 ± 0.814.4 ± 2.2312.9 ± 3.0712.6 ± 3.2712.9 ± 3.1111.5 ± 3.37
TC28.2 ± 18.918.9 ± 11.624.7 ± 1.610.6 ± 17.227 ± 23.424.9 ± 21.723.1 ± 1926.2 ± 18.2
NTV55.6 ± 1646.4 ± 9.158 ± 239.9 ± 28.852.7 ± 20.156 ± 18.359.9 ± 16.358 ± 15.1
NV16 ± 11.734.8 ± 20.717.2 ± 1.749.4 ± 3520.1 ± 16.419 ± 13.916.9 ± 1115.7 ± 10.7
BIO111.3 ± 1.811.9 ± 1.311.6 ± 0.112.8 ± 6.3810.9 ± 3.0511.5 ± 2.2711.6 ± 1.711.7 ± 1.63
BIO210 ± 1.610.5 ± 0.810.1 ± 0.311 ± 2.559.8 ± 1.819.8 ± 1.7810 ± 1.7910.4 ± 1.74
BIO4623 ± 56751.3 ± 143.3621.6 ± 7.4852.6 ± 224649.9 ± 65.1629.4 ± 55620.8 ± 44.9614.6 ± 43.9
BIO526.8 ± 2.628.5 ± 327.2 ± 0.330.6 ± 7.1526.3 ± 4.2726.8 ± 3.4727.1 ± 2.627.4 ± 2.49
BIO89.8 ± 3.211 ± 3.29.5 ± 0.413.2 ± 5.498.7 ± 4.489.1 ± 3.839.4 ± 3.189.9 ± 2.83
BIO12778.4 ± 215627.2 ± 280.7741.3 ± 26.9428.7 ± 314825.7 ± 323772.3 ± 269723.9 ± 222727.6 ± 202
BIO1434.8 ± 18.426.5 ± 11.930.8 ± 0.418.1 ± 19.334.9 ± 26.130.4 ± 20.330.7 ± 17.331.3 ± 17.7
BIO1528.8 ± 1340.6 ± 7.532.3 ± 2.645.8 ± 25.235.2 ± 19.335.1 ± 15.131.7 ± 11.829.9 ± 12.3
BIO19205.7 ± 70.4180.7 ± 94.5209.2 ± 17.8113.8 ± 89.3247.5 ± 116229.3 ± 99202.9 ± 75.9195.3 ± 61
Table 4. Matrix of percentages of suitability class distribution and changes in suitability in the actual distribution classes to the projected distribution classes under the future climatic conditions. The heading 4.5bi50 is the RCP 4.5 scenario for the 2040–2060 time period; 4.5bi70 is the RCP 4.5 scenario for the 2060–2080 time period; 8.5bi50 is the RCP 8.5 scenario for the 2040–2060 time period; 8.5bi70 is the RCP 8.5 scenario for the 2060–2080 time period.
Suitability Class (%)History45bi5045bi7085bi5085bi70
Class 1 % of the total area91.8097.27 ± 0.6597.41 ± 0.9297.64 ± 0.8198.24 ± 1.09
Class 2 % of the total area3.452.65 ± 0.632.51 ± 0.882.29 ± 0.781.71 ± 1.08
Class 3 % of the total area2.400.07 ± 0.030.07 ± 0.050.06 ± 0.030.05 ± 0.04
Class 4 % of the total area1.470.01 ± 0.000.01 ± 0.000.01 ± 0.000.00 ± 0.00
Class 5 % of the total area0.890.00 ± 0.000.00 ± 0.000.00 ± 0.000.00 ± 0.00
Remaining Suitable areas (%)0.09 ± 0.020.08 ± 0.020.07 ± 0.010.05 ± 0.01
Total Suitability loss (%) 99.91 ± 0.6499.92 ± 0.9099.93 ± 0.0099.95 ± 1.08
Changes (%)
Class 1 to Projected class 1 99.91 ± 0.1099.92 ± 0.0599.93 ± 0.0599.85 ± 0.23
Class 1 to Projected class 2 0.09 ± 0.100.08 ± 0.050.07 ± 0.050.14 ± 0.23
Class 1 to Projected class 3 0.00 ± 0.000.00 ± 0.000.00 ± 0.000.00 ± 0.00
Class 1 to Projected class 4 0.00 ± 0.000.00 ± 0.000.00 ± 0.000.00 ± 0.00
Class 1 to Projected class 5 0.00 ± 0.000.00 ± 0.000.00 ± 0.000.00 ± 0.00
Class 2 to Projected class 1 87.39 ± 4.1187.79 ± 5.2988.67 ± 5.0590.13 ± 7.78
Class 2 to Projected class 2 12.43 ± 4.0712.05 ± 5.2111.20 ± 4.999.70 ± 7.79
Class 2 to Projected class 3 0.18 ± 0.110.16 ± 0.140.12 ± 0.110.17 ± 0.17
Class 2 to Projected class 4 0.00 ± 0.010.00 ± 0.000.00 ± 0.000.00 ± 0.00
Class 2 to Projected class 5 0.00 ± 0.000.00 ± 0.000.00 ± 0.000.00 ± 0.00
Class 3 to Projected class 1 66.82 ± 8.7967.89 ± 12.3071.43 ± 10.9678.88 ± 12.4
Class 3 to Projected class 2 32.24 ± 8.6131.25 ± 11.9427.87 ± 10.6620.50 ± 12.38
Class 3 to Projected class 3 0.87 ± 0.410.79 ± 0.490.64 ± 0.370.59 ± 0.47
Class 3 to Projected class 4 0.05 ± 0.050.05 ± 0.040.05 ± 0.040.02 ± 0.03
Class 3 to Projected class 5 0.02 ± 0.050.02 ± 0.040.01 ± 0.020.00 ± 0.01
Class 4 to Projected class 1 43.33 ± 13.3646.93 ± 18.8552.04 ± 15.8968.71 ± 18.56
Class 4 to Projected class 2 55.05 ± 12.8751.49 ± 18.2046.74 ± 15.3130.24 ± 18.57
Class 4 to Projected class 3 1.41 ± 0.541.37 ± 1.311.04 ± 0.590.98 ± 1.1
Class 4 to Projected class 4 0.16 ± 0.110.16 ± 0.090.13 ± 0.090.05 ± 0.07
Class 4 to Projected class 5 0.06 ± 0.090.06 ± 0.080.05 ± 0.070.01 ± 0.02
Class 5 to Projected class 1 33.16 ± 12.8537.51 ± 20.5641.85 ± 17.3963.95 ± 23.28
Class 5 to Projected class 2 63.05 ± 11.8158.96 ± 19.1455.21 ± 16.0534.58 ± 22.44
Class 5 to Projected class 3 2.93 ± 0.882.78 ± 1.682.31 ± 1.091.26 ± 1.01
Class 5 to Projected class 4 0.53 ± 0.240.48 ± 0.250.40 ± 0.220.17 ± 0.20
Class 5 to Projected class 5 0.33 ± 0.250.28 ± 0.270.23 ± 0.280.05 ± 0.10
Loss
Gain
Remaining
Publisher’s Note: MDPI stays neutral with regard to jurisdictional claims in published maps and institutional affiliations.

