Article

Effects of Forest Gap on Soil Microbial Communities in an Evergreen Broad-Leaved Secondary Forest

1
Research Institute of Forestry, Chinese Academy of Forestry, Beijing 100091, China
2
Anhui Academy of Forestry, Hefei 230031, China
3
Huitong Experimental Station of Forest Ecology, CAS Key Laboratory of Forest Ecology and Management, Institute of Applied Ecology, Shenyang 110016, China
*
Author to whom correspondence should be addressed.
Forests 2022, 13(12), 2015; https://doi.org/10.3390/f13122015
Submission received: 21 September 2022 / Revised: 17 November 2022 / Accepted: 28 November 2022 / Published: 29 November 2022
(This article belongs to the Special Issue Maintenance of Forest Biodiversity)

Abstract

:
Forest gaps play a crucial role in community succession and assembly in forest ecosystems; therefore, they have recently been recognized and implemented as effective forest management practice all over the world. Forest gaps are commonly created as small disturbances in secondary forests to improve forest regeneration, nutrient cycling, ecosystem functioning, and biodiversity. The objective of this study was to investigate the responses of the physico-chemical and biological properties and microbial communities in soil to different sizes of forest gaps—including small gaps (60–80 m2), medium gaps (130–160 m2), and large gaps (270–300 m2)—and to examine the driving factors that influence soil microbial community structure and composition. The results show that Gram-positive bacteria, Gram-negative bacteria, fungi, arbuscular mycorrhizal fungi (AMF), and actinomycetes were mainly aggregated in the gaps, and the structural diversity of soil microbial communities was related to the gap size (p < 0.05). The soil microbial community diversity increased and then decreased with an increase in gap size. Moreover, the effects of the available phosphorus, soil pH, soil water content, available potassium, nitrate nitrogen and ammonium nitrogen on changes in microbial biomass were significant (p < 0.05). The gap area and gap position and their combined interactions also had significant effects on soil nutrients, which impacts the soil microbial community. Medium gaps (130–160 m2) always significantly improved the availability of soil nutrients, and good management practices in secondary forests can provide effective microenvironments for soil microbes.

1. Introduction

Forest gaps are important places for plant and soil community succession and assembly, which play a crucial role in forest ecology [1]. In forest ecosystems, human activities (e.g., cutting and thinning) and natural disasters accelerate the formation of forest gaps, creating a heterogeneous environment for plants, animals, and soil microorganisms to grow [2,3,4]. The artificial creation of forest gaps as an effective forest management practice has recently been recognized and is increasingly implemented all over the world. Artificial gaps play an important role in changing the structure of forest stands and renewing forests [3]. For example, the felling of trees to create forest gaps is considered a sustainable practice, accelerating seedling height growth for indigenous trees or accelerating forest restoration within exotic Pinus radiata plantations [5,6,7]. Gap size is an important feature, reflecting the magnitude of disturbance and degree of environmental change [8,9]. Environmental factors, such as temperature, solar radiation, and moisture, are all strongly affected by the size of the forest gaps [6,10]. Moreover, microclimatic changes induced by forest gaps significantly influence local biogeochemical cycling [11,12].
Forest soil responds dramatically to microclimatic changes caused by forest gaps because nutrients are actively recycled and many soil fauna or microorganisms live in the soil [13]. Previous studies concentrated on carbon, nitrogen, and phosphorus cycles and the release of nutrients from the surface soil at sites with different-sized gaps [14,15,16]. Some studies reported distinctly different soil organic matter decomposition and nutrient release at sites with gaps compared to sites with closed canopies, as well as varying rates of humification at sites with different-sized gaps [17,18,19]. Compared to undisturbed closed forests, the amount of labile carbon reduced, and the rate of soil respiration slowed as the gap size increased. At the same time, soil nitrogen and phosphorus fractions appeared to increase due to the gaps [15,20,21,22].
The soil microbial community is one of the most important components of the forest ecosystem and plays an important role in aboveground and underground biological processes related to carbon, nitrogen, and phosphorus cycles and nutrient release [23,24,25]. The soil microbial community quickly reacts to the development of forest gap vegetation and the changes in environmental conditions [26,27,28]. The effects of forest gaps on soil microbial communities are poorly understood due to their relative complexity. The formation of forest gaps may improve understory vegetation and change soil microclimates, which may be beneficial for microbial communities [29,30]. However, this may sometimes have a negative impact on microorganisms [31,32]. Several studies reported that the gap sizes dramatically affect soil microbial biomass and the soil microbial community [27,28]. It has been observed that small gaps enhance soil beta-glucosidase and L-leucineaminopeptidase, microbial biomass, and enzyme activity, indicating the beneficial impact of small gaps (40–50 m2) on microbial communities [33]. Soil microbial biomass and soil respiration decreased with the increased size of gaps [34]. Moreover, gap location is another important factor affecting soil microbial communities [35]. It was observed that the beta diversity of the fungal community increased from the gap center to the closed canopy [36]. Gap locations had a positive effect on bacterial population abundance [2,33].
Evergreen broad-leaved forests are a zonal type of vegetation found in subtropical areas [36,37] and are crucial for climate regulation, biodiversity protection, and soil and water conservation [36,38]. Many evergreen broad-leaved forests were recently destroyed, and thus a larger area of evergreen broad-leaved secondary forests formed over time. Evergreen broad-leaved secondary forests generally have low-efficiency forest sand. How to manage evergreen broad-leaved secondary forests is a great international challenge. Previous studies on forest gaps mainly focused on the impact of the physical and chemical properties of soil, including the growth of seedlings under evergreen broad-leaved secondary forests [33,39,40]. However, few studies reported the effects of forest gaps on the soil microbial community structure in evergreen broad-leaved secondary forests. The main objective of the present study was to examine how soil microbial communities respond to the formation of forest gaps with different sizes in the short term. We hypothesized that, (1) due to an improved light environment and hydrothermal condition in the evergreen broad-leaved secondary forest, soil properties would react differently in the sites with forest gaps and in the understory, and (2) the microbial community structure shift would have a strong relationship with changes in soil chemical properties caused by different-sized gaps.

2. Materials and Methods

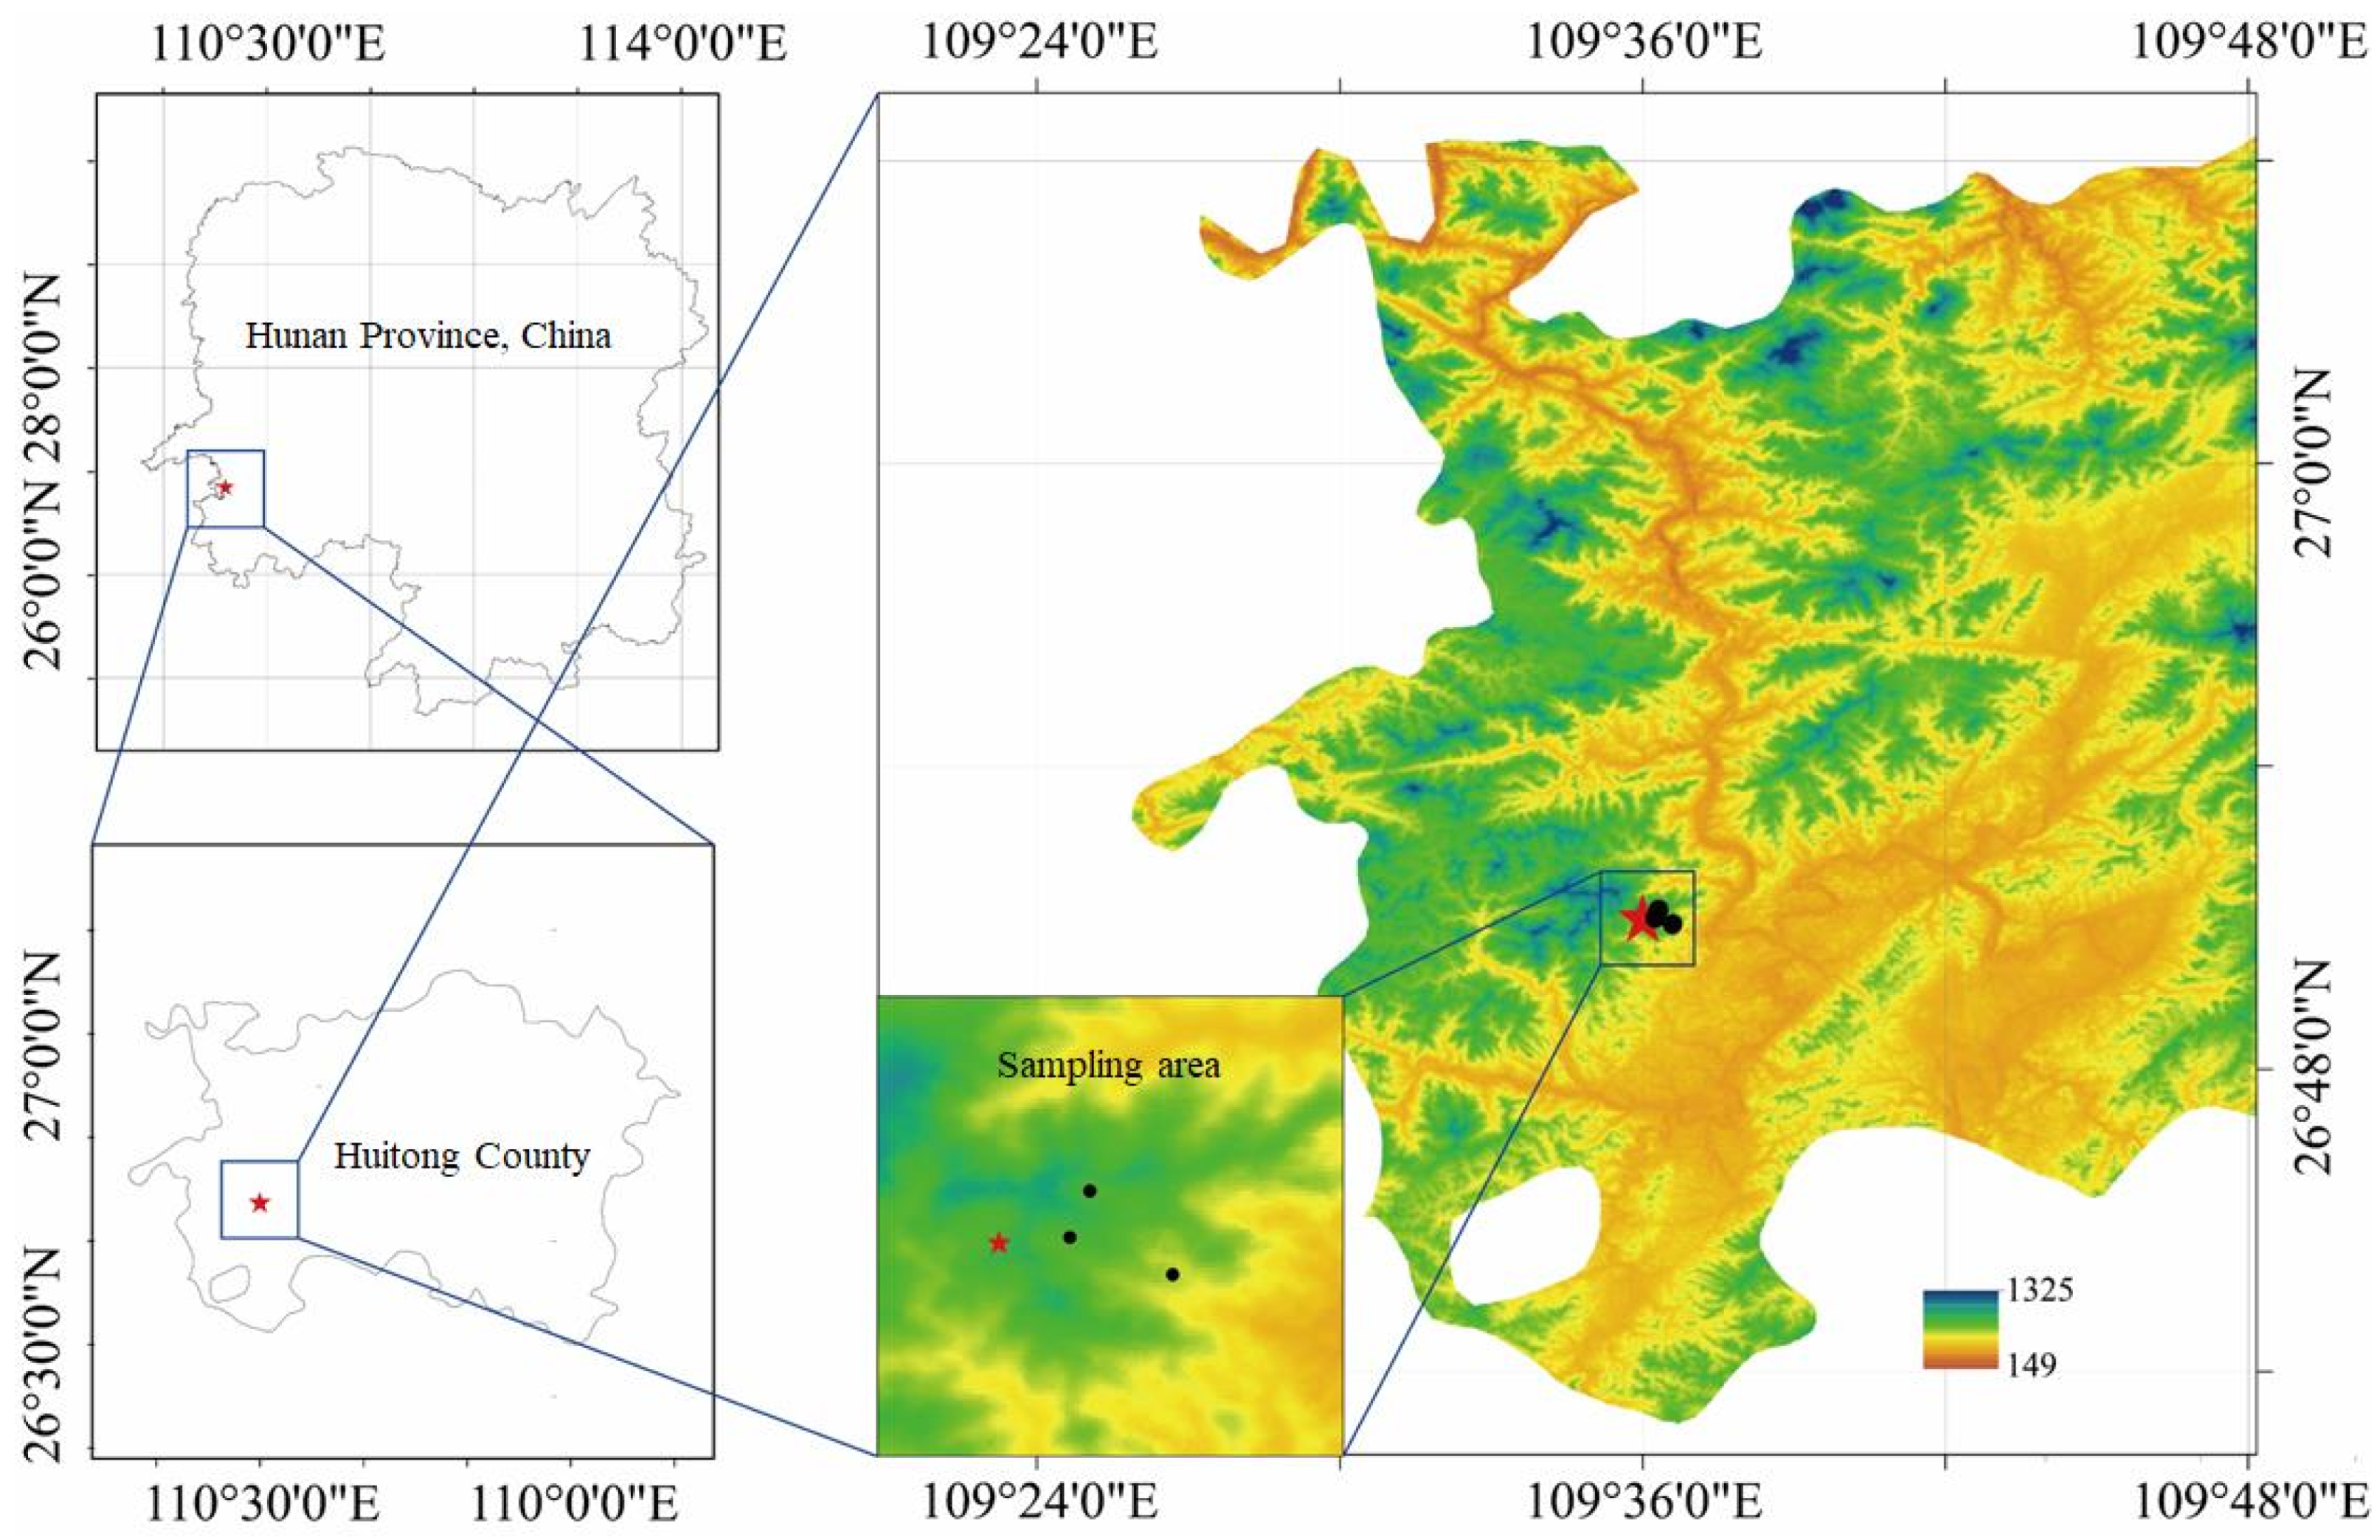
2.1. Site Description

This study was conducted at Huitong Forest Ecological Experimental Station of Chinese Academy of Sciences in Huaihua City, Hunan Province (109°30′ E, 26°48′ N) (Figure 1). The study areas were located in low mountains and hilly landforms with an approximate altitude range of 200~500 m [41]. The study area has a typical subtropical, warm, humid, monsoon climate with an average annual temperature of 16.5 °C, an extreme maximum temperature of 36.4 °C, and minimum temperature of −4.4 °C, respectively. The average annual rainfall was 1200–1400 mm, and the average annual relative humidity exceeded 80% [42]. Red–yellow soil is a typical soil type in this study area, and was equal to alliti-udic ferrosols according to the World Reference Base for Soil Resources [43]. Evergreen broad-leaved secondary forests developed due to artificial disturbances of the original evergreen broad-leaved forest after more than 30 years of natural succession. The dominant tree species are mainly from the following families and genera: Lauraceae, Fagaceae, Hamamelisaceae, Luteaceae cyclobalanopsis, Castanopsis, Machilus, Liquidambar, etc. The common tree species are Castanopsis hystrix, Cyclobalanopsis glauca, and Machilus pauhoi, and other species are present in typical subtropical evergreen broadleaved secondary forests (the pioneering community that originates after secondary succession of human disturbance).

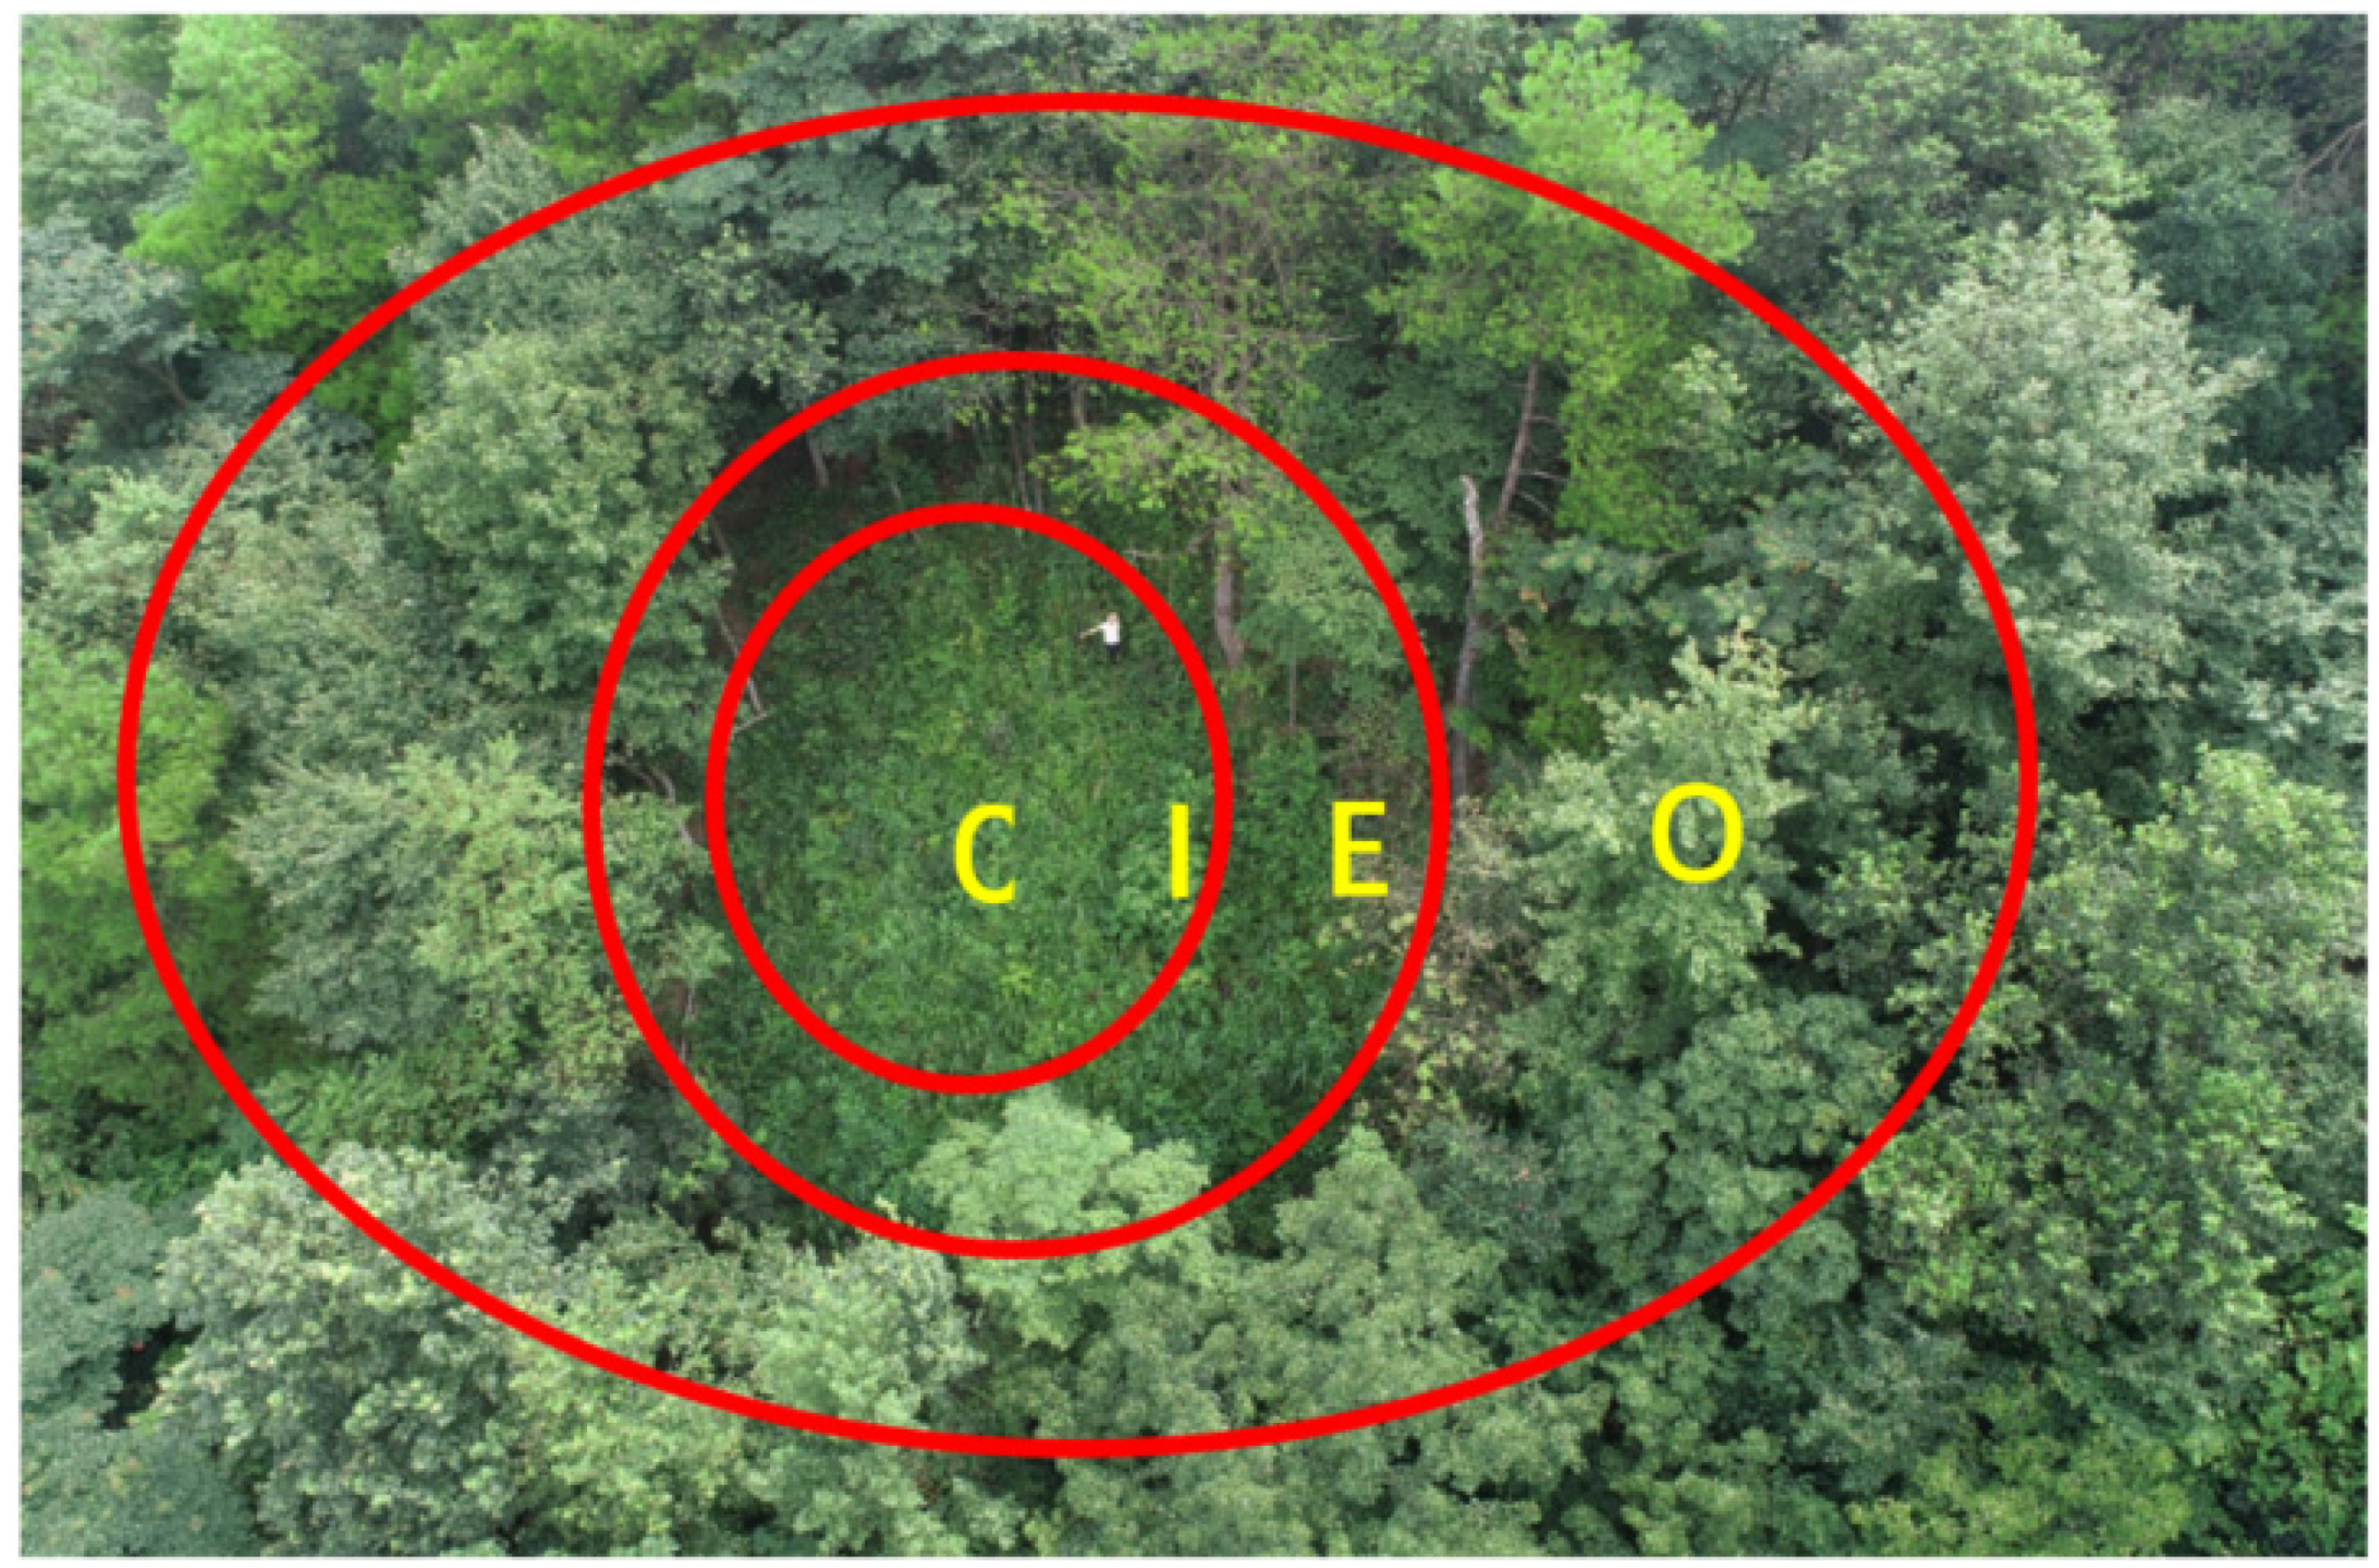
2.2. Experimental Design

Study plots with a similar topography, elevation, slope, aspect, and soil type were established in a middle-age evergreen broad-leaved secondary forest, which had an average tree height of 12 m and stand density of 3200 trees /hm2. Canopy density was about 0.9, and grass coverage was 25%. The red–yellow soil is the typical soil type in this study area. Forest gap sizes were defined using the ratios of D/H (D means gap diameter; H means stand height) [44,45]. In this study, three types of nearly circular forest gaps were created by artificial cutting, including (1) small-size forest gaps with a D/H ratio of 0.3 and an area of 60–80 m2, (2) medium-size forest gaps with a D/H ratio of 1.3 and an area of 130–160 m2, and (3) large size forest gaps with a D/H ratio of 2.3 and an area of 270–300 m2. Each type of forest gap (small-, medium-, or large) had three replications, with nine individual forest gaps in total (G1–G9), which were arranged in the forest using the randomized complete-block design.). In addition, three control plots (10 m × 10 m) under the ambient closed canopy were established as controls. In this study, nine individual forest gaps and three control plots were used (Table 1). After the creation of the forest gaps, we artificially removed branches, trunks, and other residue, which remained untreated.
Soil samples were collected from a depth of 0–10 cm at different sampling locations (the center to the understory) within each of the three different-sized gaps in October 2019. In each location, four soil cores were selected by the “Circular sampling” method and dug to a depth of 10 cm by a stainless-steel cylindrical driller with a diameter of 5 cm (Figure 2). The composite soil samples were used to test soil physico-chemical properties. There are three repetitions for each location because three same-size gaps were formed. A total of 39 soil samples were collected, including the control sample. They were kept at 4 °C, transported to the laboratory, and passed through a 2 mm mesh sieve before analyses.

2.3. Analysis Methods

2.3.1. Basic Chemical Properties of Soil

The soil pH was measured in air-dried <2 mm sieved soil with a glass electrode in a soil:water suspension (1:5) with 0.2 M KCl to determine the characteristics of the sorption complex. The total C (TC) contents were determined using an elemental analyzer (Vario Macro cube, Elementar, Germany). The total nitrogen (TN) was assayed by the Kjeldahl method and analyzed on a Kjeltec Analyzer Unit (Kjeltec 2300, FOSS, Denmark). The total P was determined using the molybdenum colorimetric method. We assayed alkaline available nitrogen (AN), available phosphorus (AP), and available potassium by extracting air-dried soils (Institute of Soil Science, Chinese Academy of Sciences 1978). The determination of AP and available potassium were analyzed on an ICP (AA-7000, Kleve, Germany). Ammonium and nitrate were extracted from fresh soil samples by shaking for 1 h with 1 mol L−1 KCl (soil: solution ratio of 1:10). The extracts were filtered, and then, the analytes were determined using a continuous-flow analyzer (AA3, SEAL, Germany). For the determination of soil-available potassium, air-dried soil samples were extracted by shaking for 30 min with 1 mol·L−1 CH3COONH4 (soil: solution ratio of 1:10), and then, the available potassium content of the filtrate was determined using a continuous-flow analyzer (AA3, Germany). Soil samples were sampled on site using an aluminum box and brought back to the laboratory to be dried at 105 °C in an oven until the soil moisture was measured at constant weight.
Soil Moisture Measurement = [(Wet soil weight − dry soil weight)/dry soil weight] × 100%

2.3.2. Soil Microbial Community Structure

Phospholipid fatty acids (PLFA) were used to characterize the microbial community structure. PLFAs were extracted from 2 g of lyophilized soil, separated, and methylated. The resulting fatty acid methyl esters (FAMEs) [46] were separated by gas chromatography using an Agilent 7890 A GC System equipped with a HP-ULTRA 2 column and a flame ionization detector [46]. The individual FAME peaks were identified and quantified with the software Sherlock™ PLFA Method and Analysis Package. Specific PLFAs were used as biomarkers to quantify the relative abundances (mol%) of particular microbial groups (Table 2). The internal standard 19:0 phosphatidylcholine was used for the quantification of FAMEs. Although most bacterial PLFAs have acyl chain lengths between 14 and 20 carbons, there are fatty acids longer than 20 carbons that predominantly originate from bacteria or micro-eukaryotes, such as 21:0, 22:0, 22:5 ω3, 22:6 ω3, and 24:0. This software was designed to detect such fatty acids in soil samples; therefore, they were also taken into account in our study. The viable microbial biomass was calculated by summing PLFAs concentrations and reported as nanomoles of PLFA per gram of soil. Several PLFAs may have various sources. Fatty acids indicating arbuscular mycorrhizae fungi (AMF) were summed as total fungal biomass. Bacterial biomass was calculated from the residual fatty acids that could be assigned to the bacterial groups. Biomass was expressed relative to dry weight of the freeze-dried soil. The ratios of fungal/bacterial (18:2ω6 for fungi) and Gram-positive(G+)/Gram-negative (G) bacterial markers were also obtained. The absolute amount of PLFA was calculated by the area normalization method using the following formula ([47,48]):
Phospholipid   Fatty   Acids   ( PLFA ) = ( 19:0   concentration   ×   total   area ) / 19:0   molarmass Actual   weight   of   soil × Response   area   of   a Response   area   of   19:0  

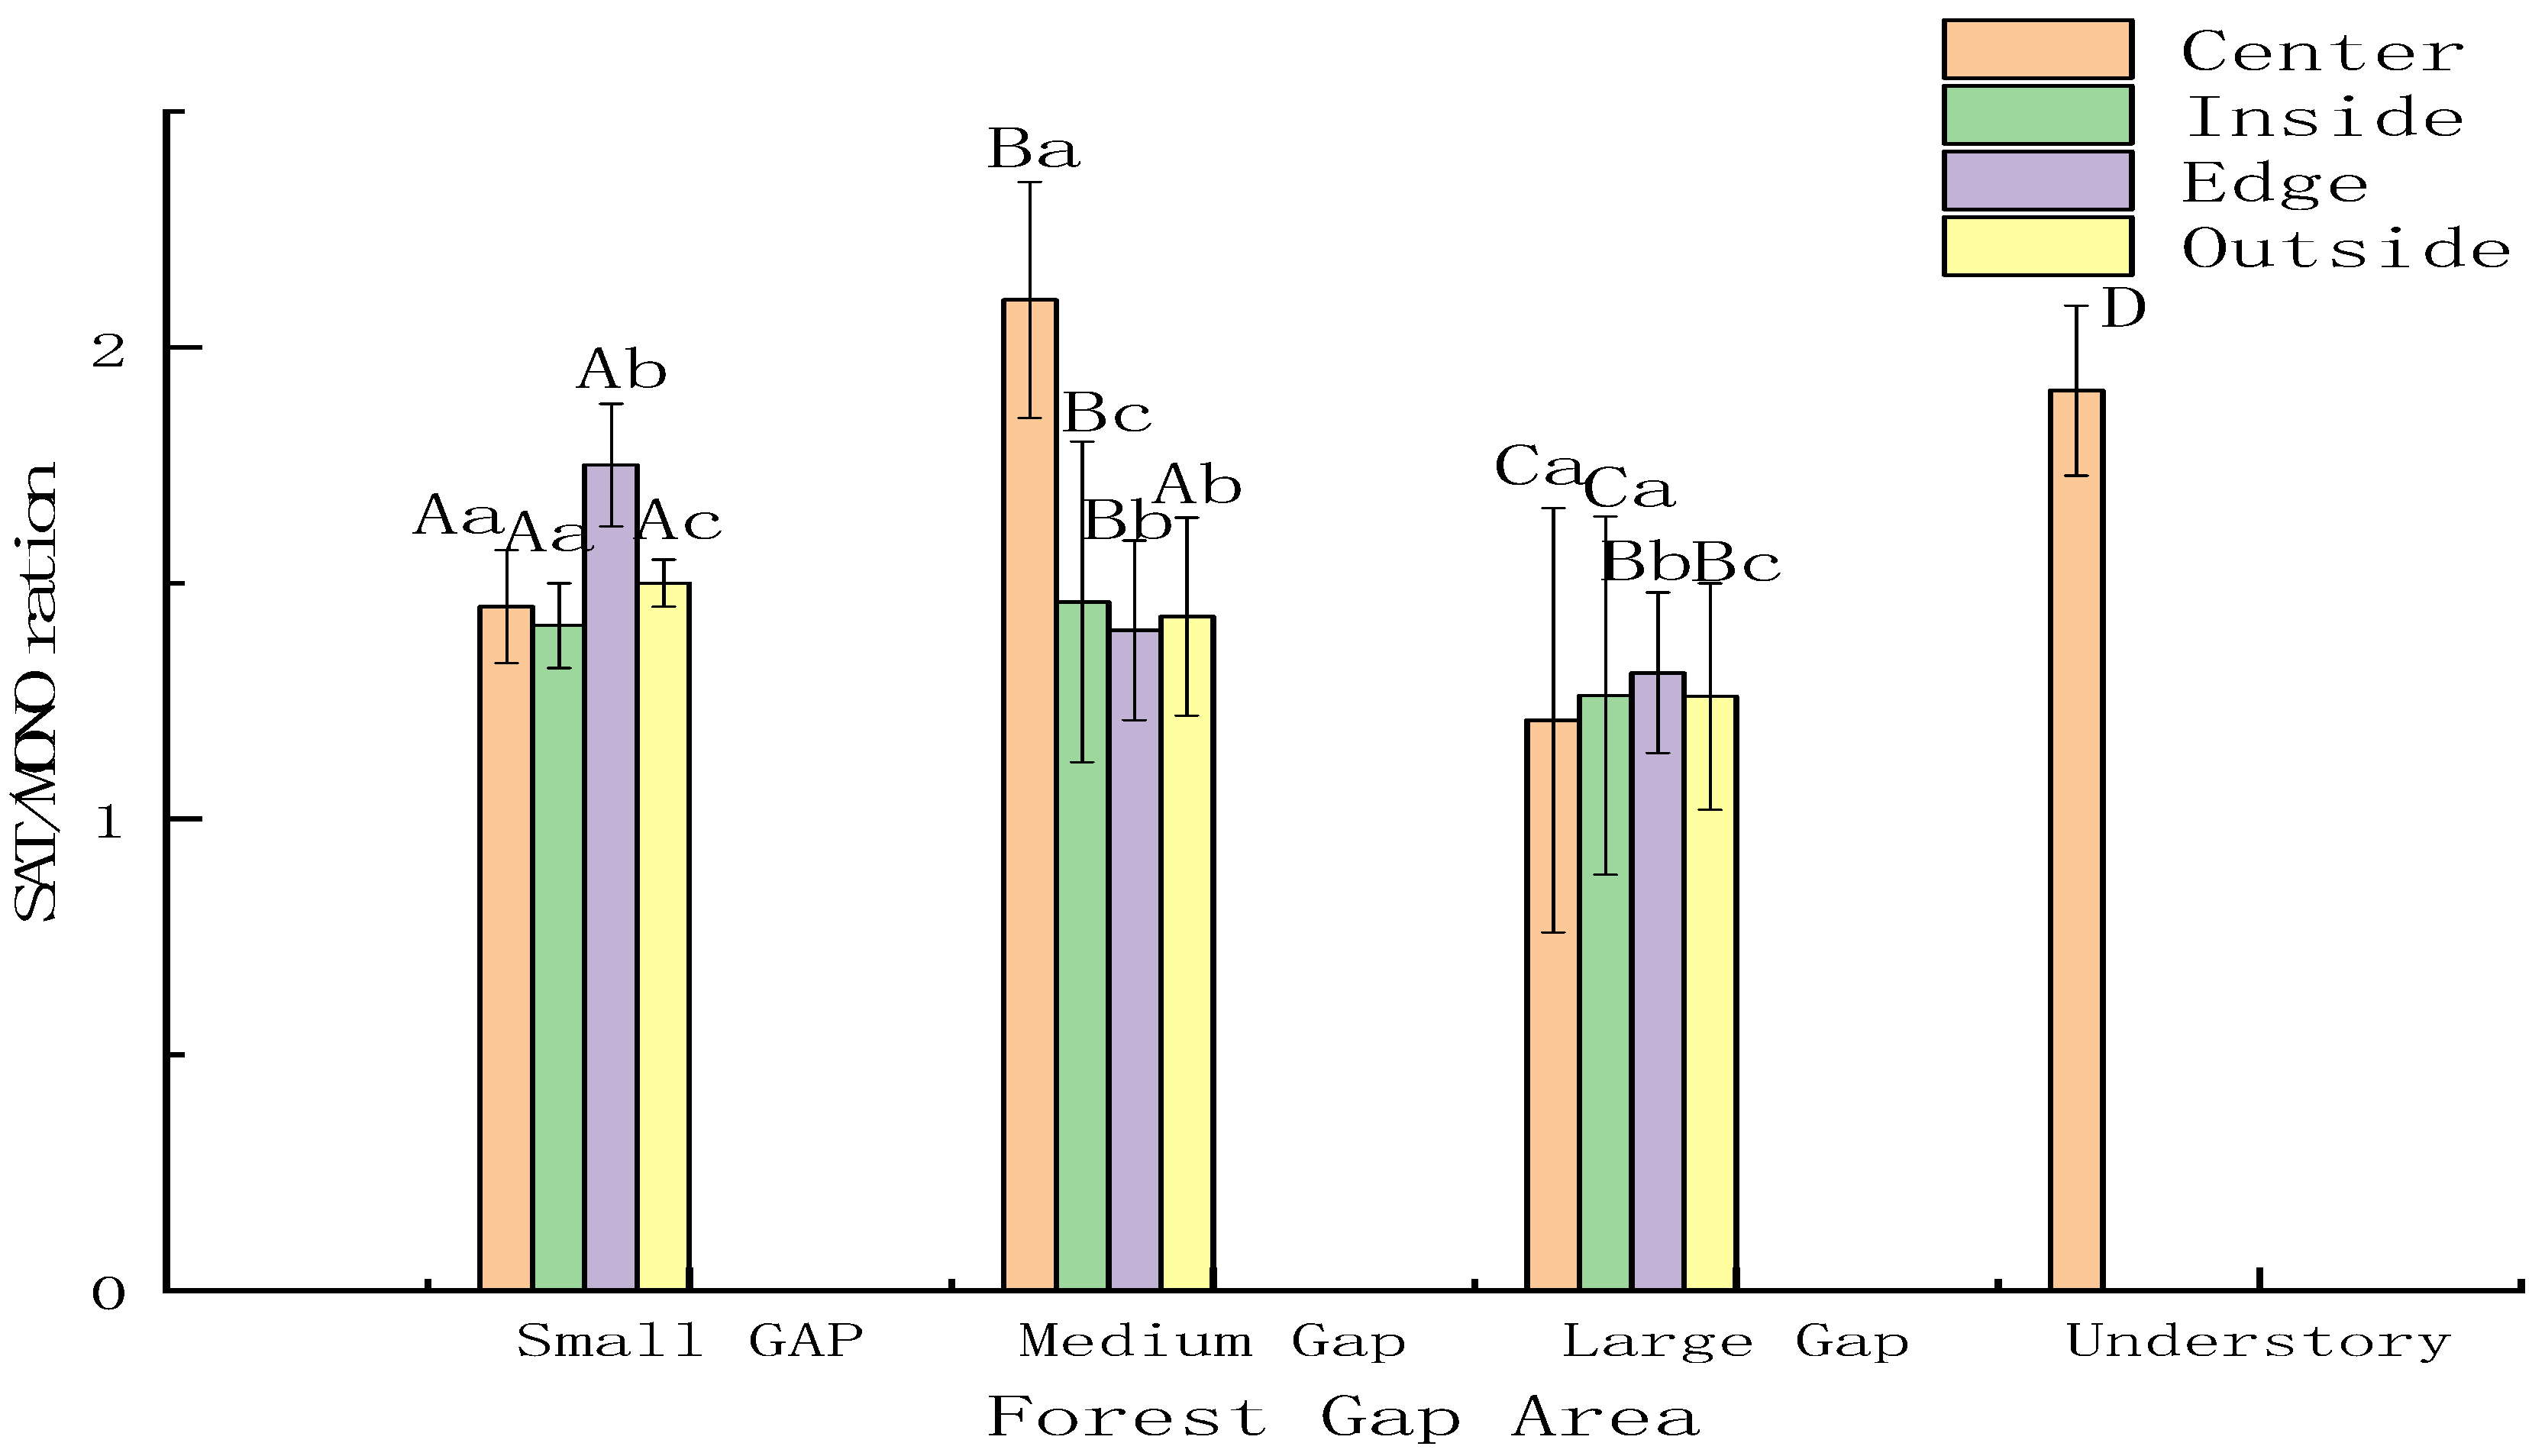
2.3.3. Saturated Fatty Acids/Monounsaturated Characteristics

SAT/MONO (Saturated fatty acids/monounsaturated) usually indicates environmental stress in soil microorganisms [49].
SAT/MONO = Saturated fatty acids/monounsaturated

2.4. Statistical Analysis

We conducted a two-way analysis of variance (ANOVA) using the General Linear Models package in SPSS 21.0 (IBM Corp., Armonk, NY, USA) to test the interaction between the forest gap size and soil position in the available phosphorus and potassium, nitrate nitrogen and ammonium nitrogen concentrations, soil water content, and soil pH. Additionally, a redundancy analysis (RDA) was performed using the Canoco 4.5 software. Six soil microbial community structures (eukaryote, fungi, actinomycetes, Gram-positive and Gram-negative bacteria, and AM fungi) and six soil chemical properties were analyzed to determine the relationship between microbial community and environmental outcomes. The experimental effects on soil microbial communities in forest gaps were assessed using a generalized linear model (GLM), applying the binomial family and default logit link function. Post hoc pairwise comparisons of significance were carried out for GLMs using a Least Significance Difference Method. All the differences were tested with a significance level of p = 0.05. Graphics were generated in Origin (version 2018, Origin Lab).

3. Results

3.1. Response of Soil Microbial Community Structure to Forest Gap

A total of 92 different PLFAs were detected from all the samples. For G− (Gram-negative) bacteria and G+ (Gram-positive) bacteria, fungi, actinomycetes, and AM fungal PLFAs, all the markers varied significantly in different-sized forest gaps. The different percentages of specific biomarkers of the PLFAS in forest gaps are shown in Figure 3.
Compared to forest gap, the contents of PLFAs (10:03OH,13:0iso,14:02OH;15:1w6c,16:1w9c,18:1w5c,19:1w8c,20:1w8c,21:1w3c,22:5w6c,24:1w3c) were not detected. The contents of PLFAs varied with forest gap size. The PLFAS of 16:0,19:0 cyclo w7c,15:0 iso,18:1 w7c,16:0 10-methyl,18:1 w9c,17:1 iso w9c,18:0,16:0 iso,15:0 anteiso,18:0 10-methyll17:1 w7c 10-methyll17:0 isol16:1 w7c,19:0l17:0 anteiso,16:1 w5cl18:2 w6cl17:0 cyclo w7c and18:1 w5c ranked differently, as shown in Figure 2. In three gaps and the forest understory, the total amount of PLFAs was quite different, medium gap (101.73 nmol/g) > large gap (95.75 nmol/g) > small gap (94.35 nmol/g) > understory (92.36 nmol/g) in Table 3.
As shown in Figure 4, the SAT/MONO ratios were the highest in the medium gap, but the lowest in the large gap (p < 0.001). The SAT/MONO ratios showed no differences in different positions within the large gap, but distinct differences in the small gap, medium gap, and the understory. The SAT/MONO ratio decreased in the small gap and large gap in comparison to the understory. The medium gap was consistent with understory in the SAT/MONO ratio. Overall, the changes in environment deeply affected the soil microbial communities.

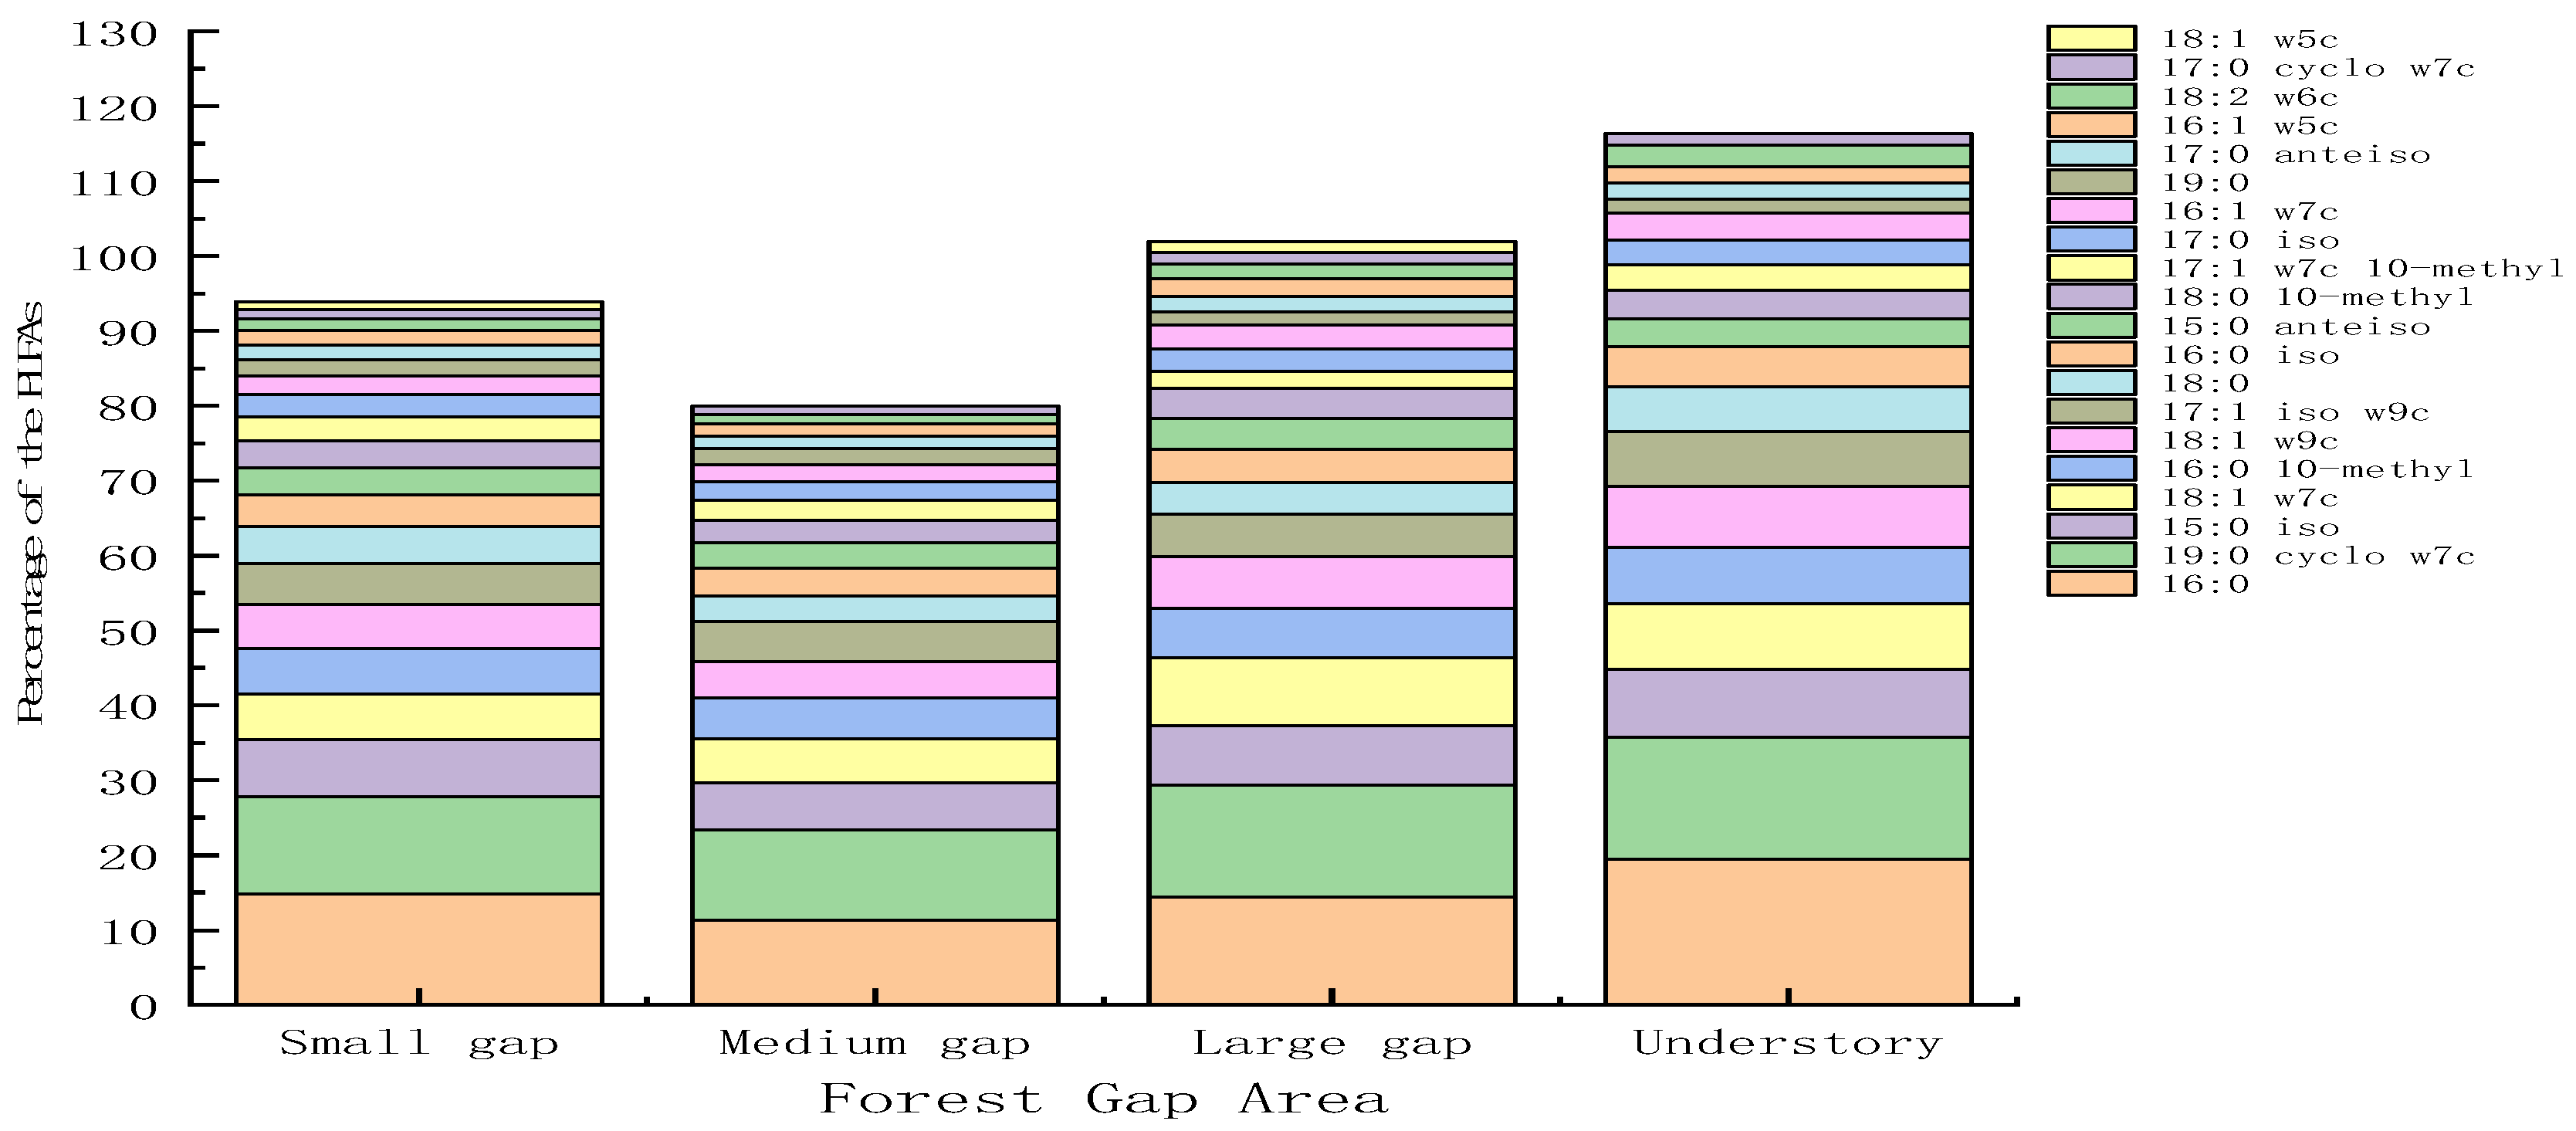
3.2. Response of Soil Microbial Community Composition to Forest Gap

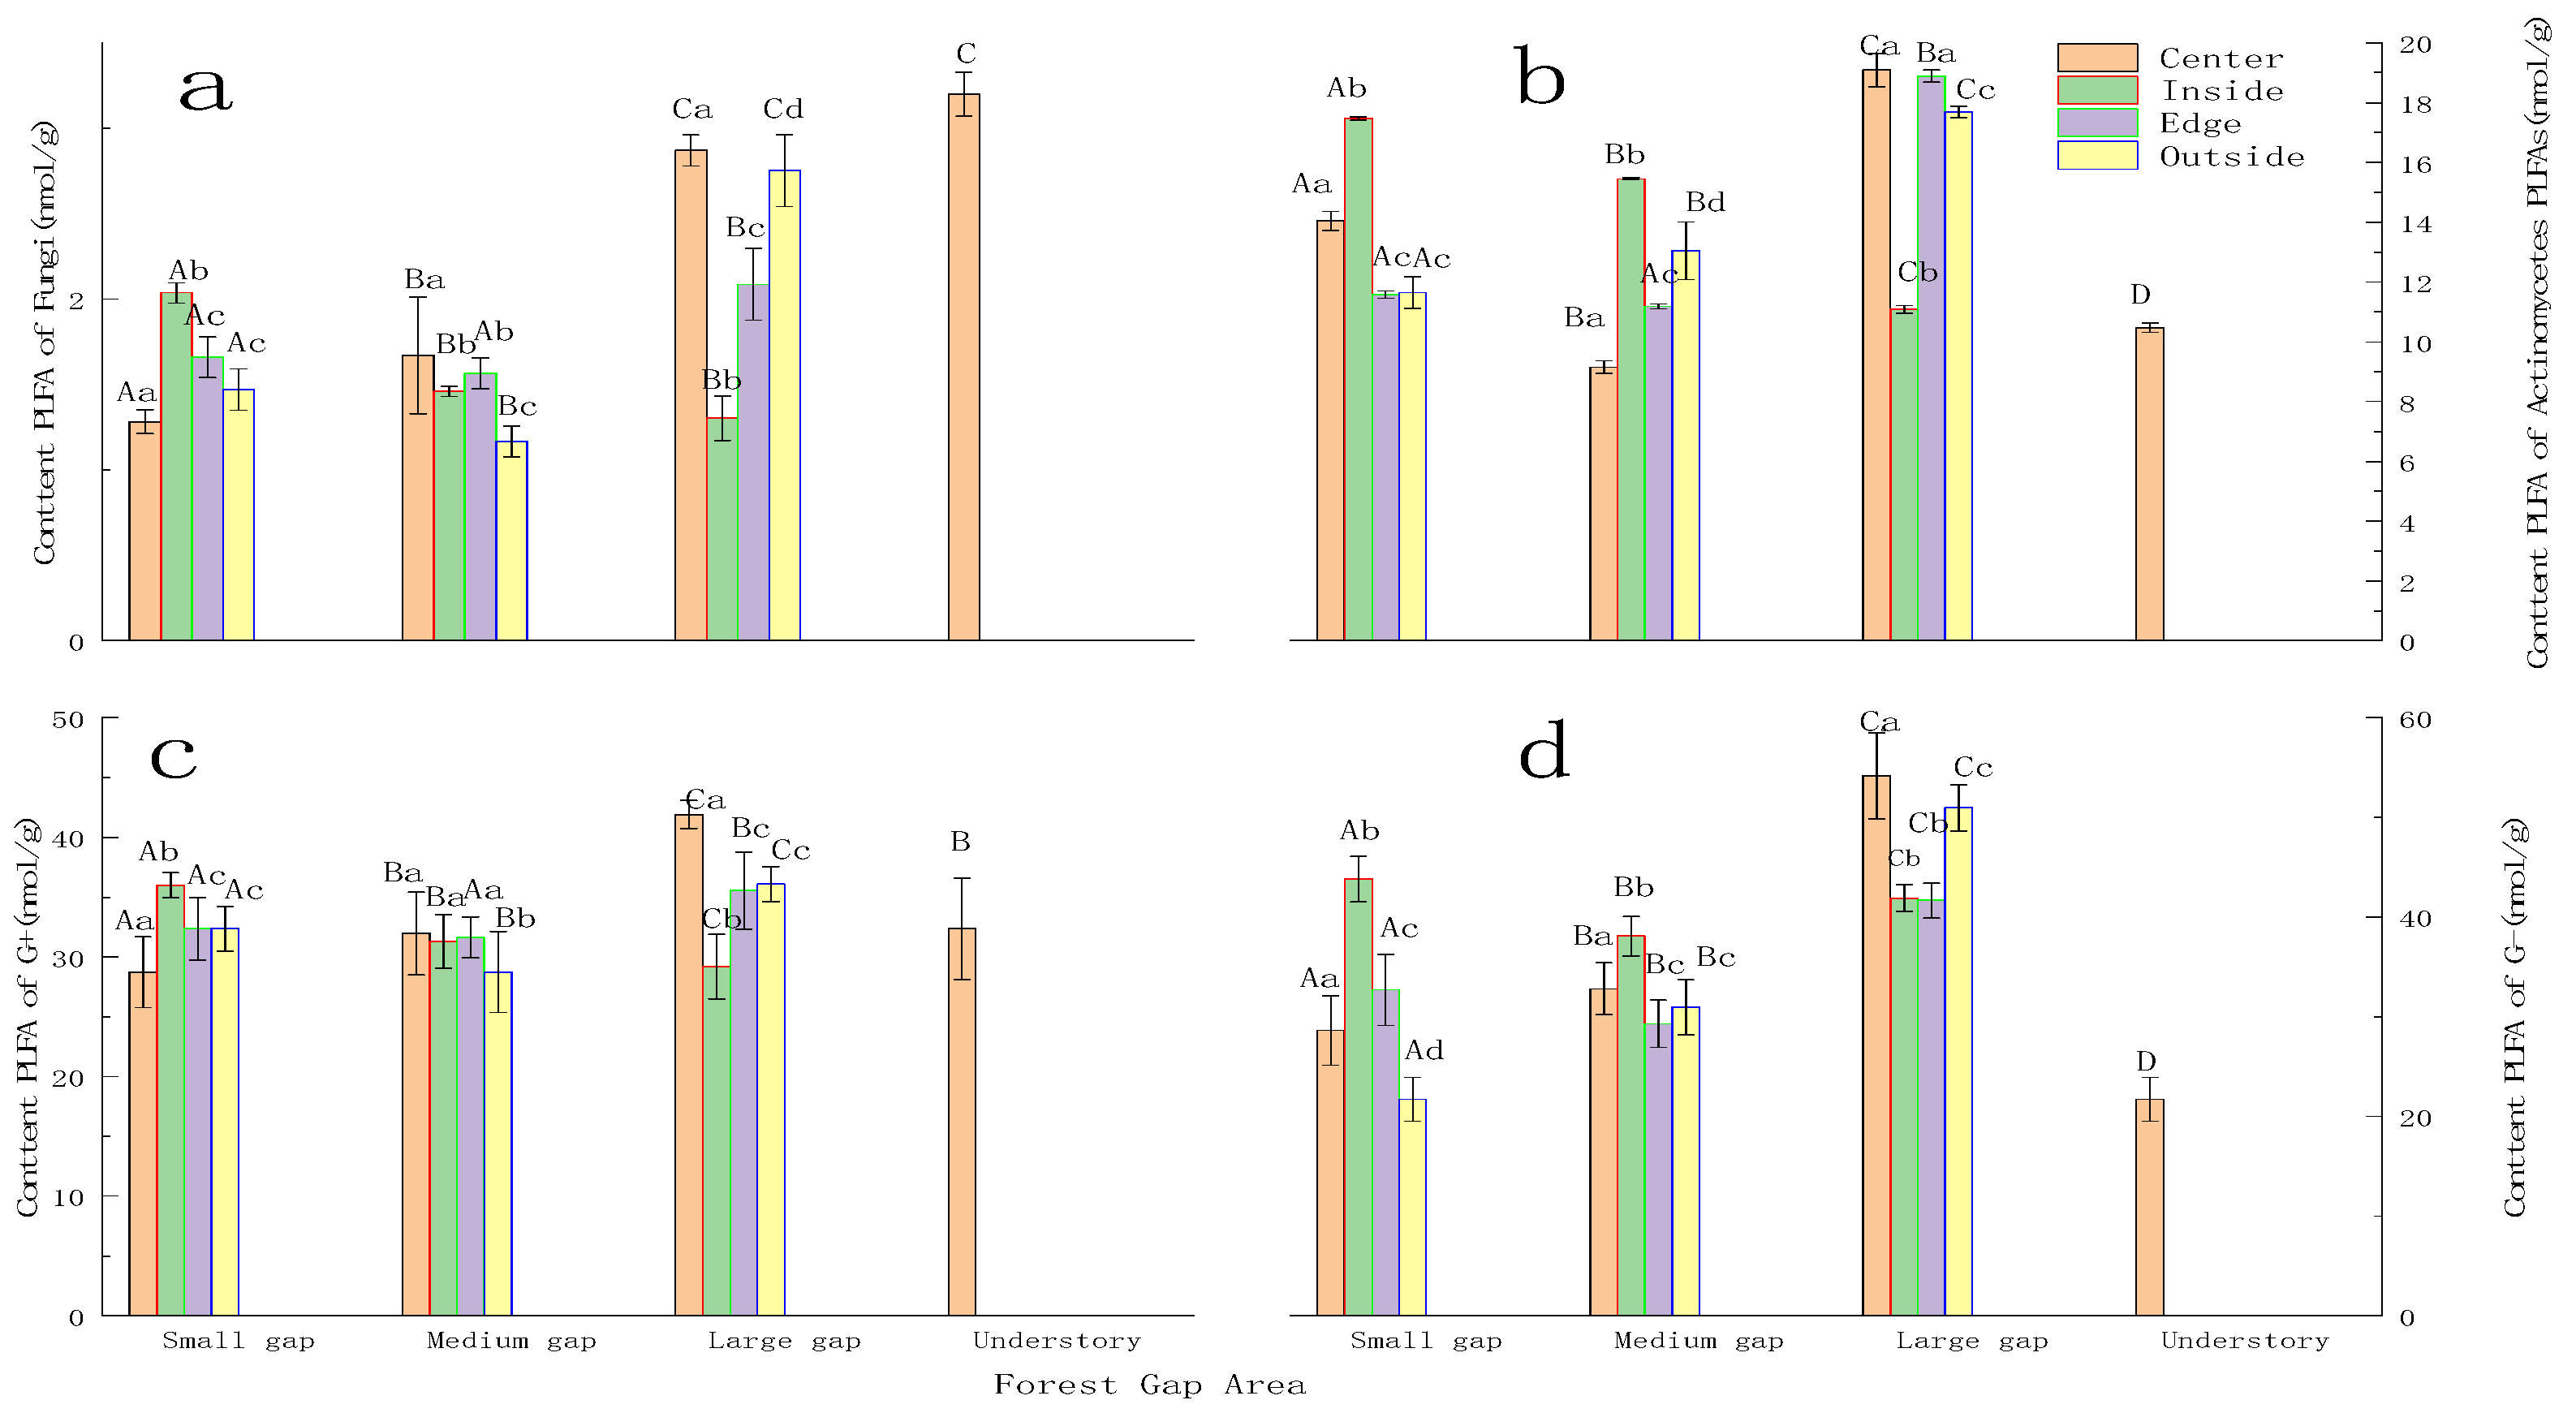
3.2.1. Soil Fungi, Actinomycetes, G+ Bacteria, and G− Bacteria Response to Gap Size

The PLFA contents in fungi in different forest gaps ranged from 1.86 to 9.01 nmol g−1: large gap > small gap > medium gap > understory. From the center of gap to the understory, the fungal PLFA ranged from 1.28 to 3.45 nmol g−1. Across different positions within the same gap, quite different variations were shown. Soil fungi in the center and edge of the gap responded more strictly to the forest gap than the understory (Figure 5a).
Actinomycetes were most in the forest gap in comparison with the understory. From the understory to the gaps, the order was: understory (11.06 nmol g−1), small gap (12.21 nmol g−1), medium gap (13.68 nmol g−1), large gap (16.9 nmol g−1) (p < 0.01). The PLFA contents of actinomycetes in the same forest gap varied with the position in the gaps. Inside of the forest gap, the PLFA contents of actinomycetes were highest; however, the PLFA contents of actinomycetes at the edge of the forest gap. Overall, the surface aggregation of actinomycetes was significantly affected by the forest gap sizes and position (Figure 5b).
The large gap (270–300 m2) was the most active habitat of G+ bacteria, and the G+ bacterial contents at the top soil (0–10 cm) were significantly higher than those in the understory. However, there were no significant changes in the small gaps (60–80 m2) and medium gaps (130–160 m2). The content of G+ bacteria in the center of the gap was significantly higher than that in the same gap size at a different position. Additionally, variations in G+ bacteria differed in the same positions with different sizes (p < 0.05 (Figure 5c).
The gap size difference in the PLFA contents of G− bacteria was more complex. The PLFA levels in the same gap size were dramatically altered in the four sites, and changes in the gap center and outside of the gap were substantial between the small gap and large gap. Compared to the understory, the number of medium gaps (130–160 m2) was relatively stable, and there were no significant changes in the center, inside, edge and outside areas. In the forest gaps, variations in G− bacterial PLFA contents were not clear. However, at the center and outside of the gap, a peak was observed as gap size increased (Figure 5d).

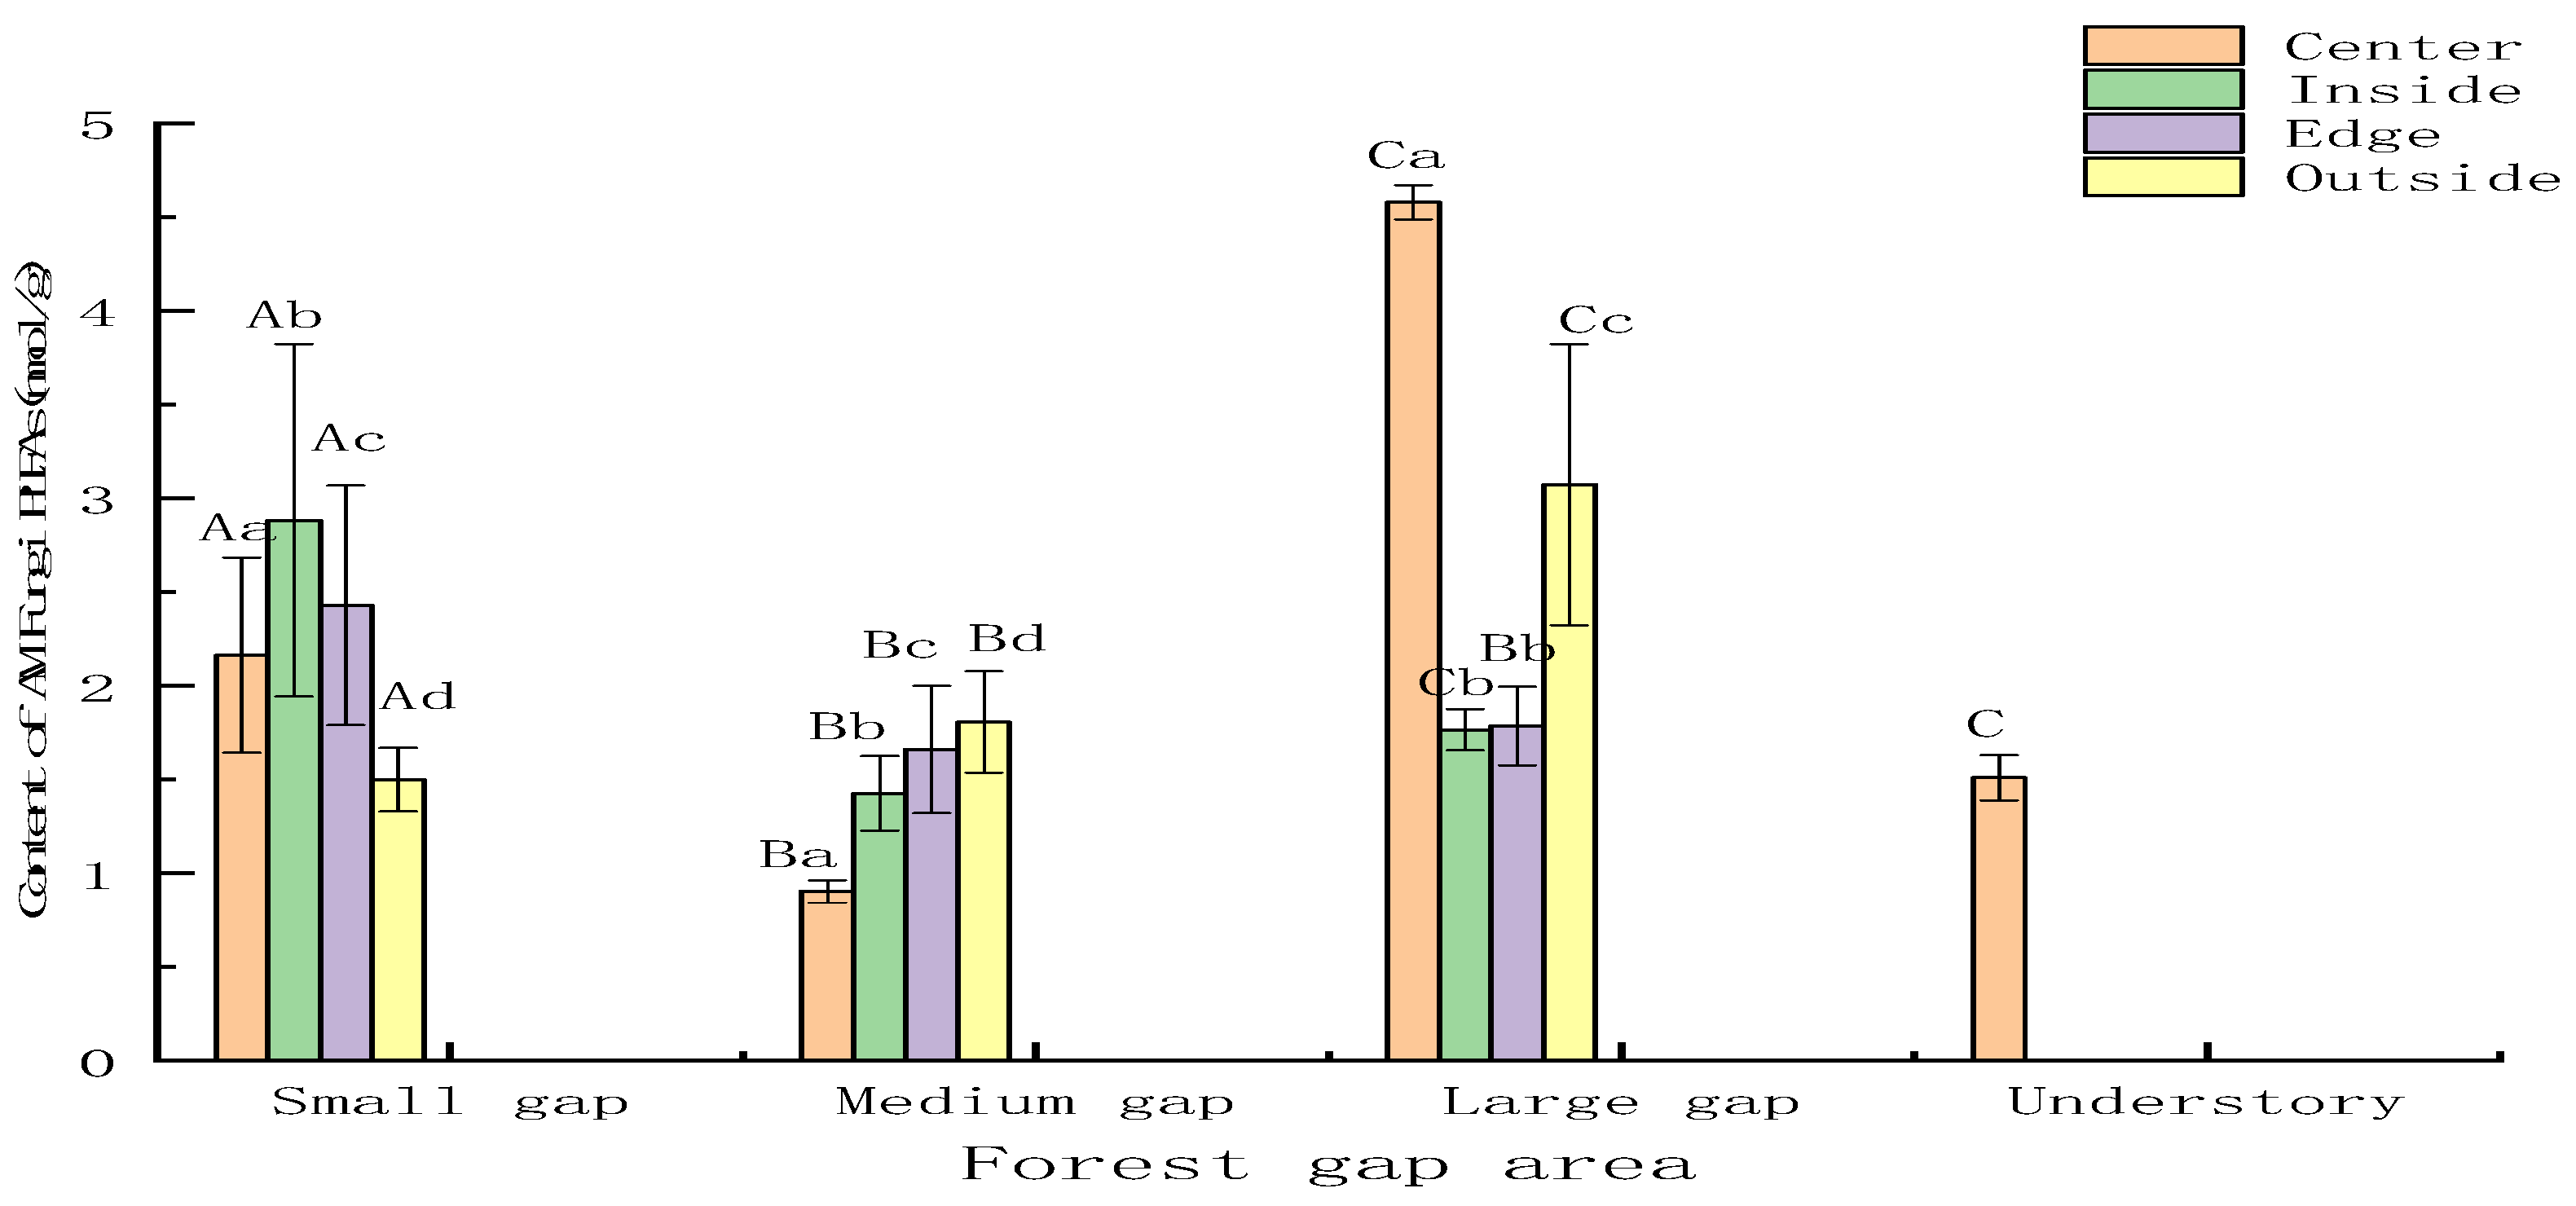
3.2.2. Soil AM Fungi and Anaerobic Response to Forest Gap

The gap size altered the surface aggregation of AM fungi in the gap and understory (Figure 6). The AM fungal PLFA content in the forest gap was similar to the PLFA contents of fungi, large gap (270–300 m2) > small gap (60–80 m2) > medium gap (130–160 m2) > understory (p < 0.01). The PLFA contents of AM fungi ranged from 1.45 to 2.80 nmol g−1 (Figure 4). The PLFA contents of AM fungi were highest in the small gap; however, the large gap and medium gap reached a peak outside of the forest gap. Overall, the forest gap significantly affected the surface aggregation of AM fungi.
The anaerobic bacterial community occupies a large proportion in the structure of the anaerobic microbial community in the forest gap. From all of the samples, phospholipid fatty acids that can be used to characterize anaerobic bacteria, such as 18:1 w7c, 15:0 a, 15:0 i, 16:0 i, 17:0 i, 19:0 cy, etc., were detected. The PLFA content of the anaerobic in the small gap and the large gap accounted for 8%–11% and 4%–10%, respectively. Anaerobic bacterial PLFA content was significantly higher than those in the small gap and large gap, accounting for 22%–34%. More interestingly, no anaerobic PLFA makers were detected in the sample collected from the medium gap. This gap had a strong effect on the anaerobic microbial community.

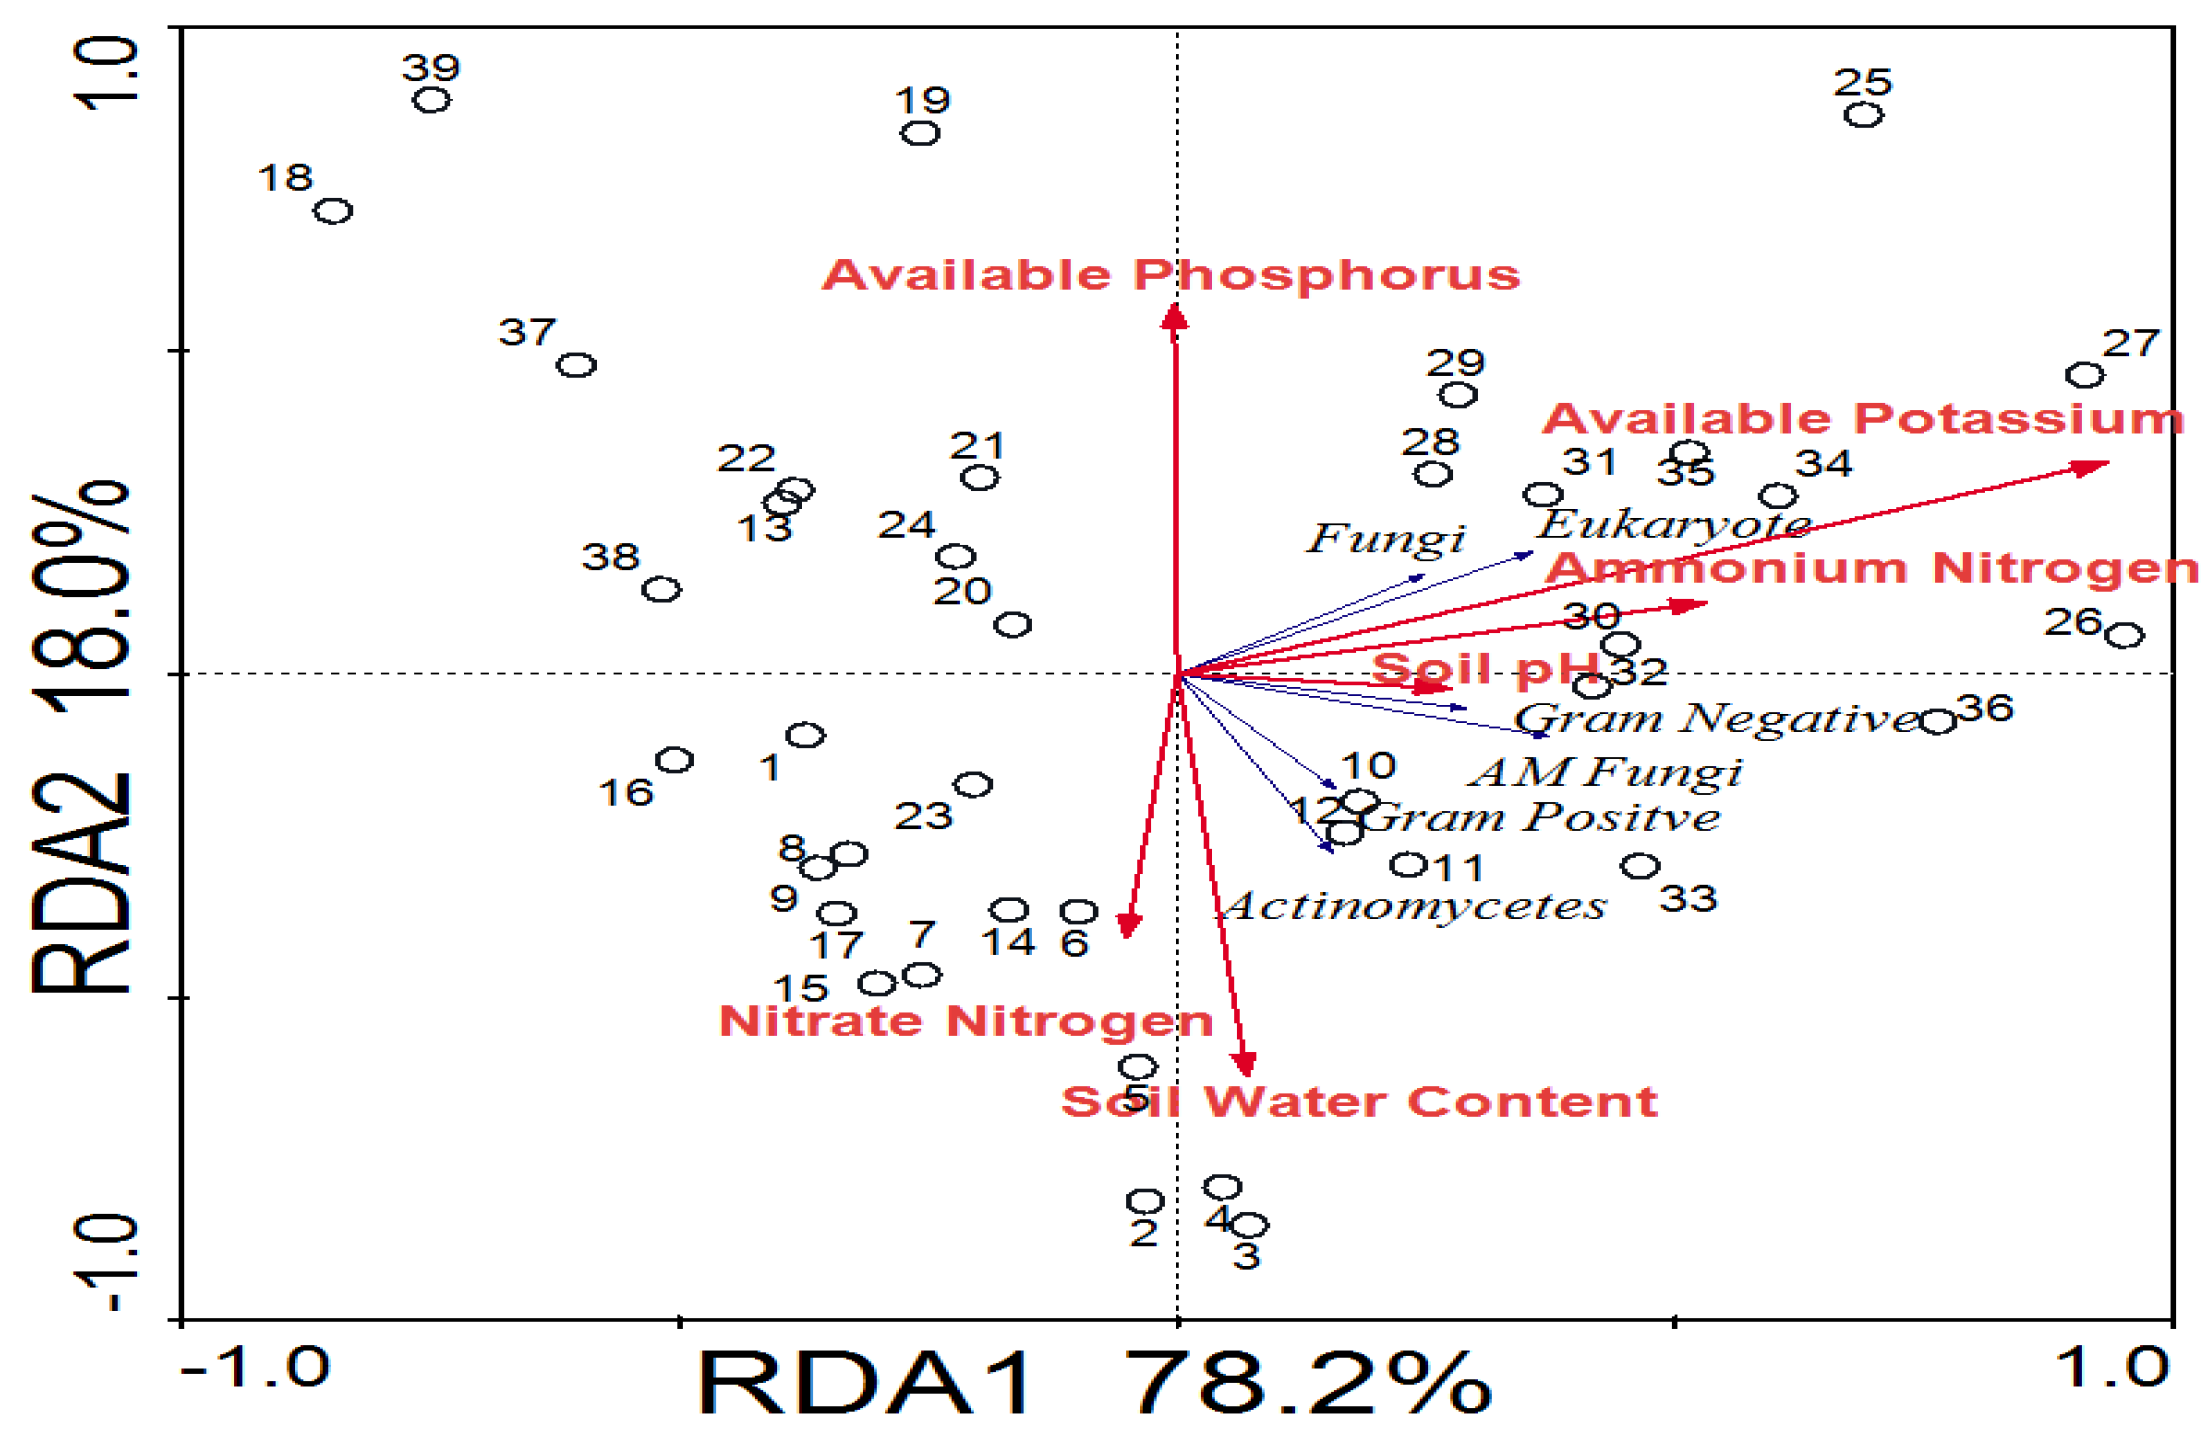
3.3. Soil Factors Driving Soil Microbial Community Shift

The gap area of evergreen broad-leaved secondary forest influenced the physical properties of the soil (Table 4). The value of available phosphorus in the four habitats followed the order medium gap > large gap > small gap > understory, and the value of available phosphorus in the medium gap was significantly higher than that in the small gap, large gap, and understory (p < 0.01). The value of nitrate nitrogen in the forest gap was similar to the value of available phosphorus (p < 0.05). The value of available phosphorus potassium and ammonium nitrogen in the four habitats followed the order medium large gap > small gap > medium gap > understory. The gap area of evergreen broad-leaved secondary forest significantly affected the value of soil water content, as the soil water content decreased from the understory to the forest gap. Meanwhile, the differences in soil pH among the three gaps and understory were not significant (p > 0.05).
The results show that the differences in soil water, nitrate nitrogen, ammonium nitrogen, available potassium, and available phosphorus between center and edge and between the outside and center were significant (p < 0.05). Environmental outcomes evidently contribute to the size of the forest gaps. Compared to the understory, the differences in soil pH among the center, edge, and outside of the gaps were not significant (p > 0.05).
Furthermore, the two-way ANOVA results show that forest gaps significantly affected all the chemical properties of soil (p < 0.05) (Table 5). Gap area, gap position, and their combined interactions also had significant effects on available phosphorus, nitrate nitrogen, ammonium nitrogen, and soil water content.
The redundancy analysis (RDA) demonstrated that soil chemical properties significantly affected the soil community structures in evergreen broad-leaved secondary forest gaps. The analysis results show that 96.2% of the soil microbial community structure information could be explained by the six selected soil chemical property indicators, among which axis 1 and axis 2 explained 78.2% and 18.0% of the variation information, respectively (Figure 7). Among all the tested environment factors, ammonium nitrogen, available potassium, and pH value had significant positive correlations with microbial communities, in which available potassium had a stronger effect (longer arrow) on microbial community on microbial community structure. Interestingly, the correlations between the fungi, eukaryote and soil water contents, and nitrate nitrogen were negative and significant. Moreover, the soil pH was not the main environmental factor affecting the soil microbial community composition.

4. Discussion

Significant differences were identified in the physical properties of soil among different-sized forest gaps and the understory, indicating differences in the sensitivity of soil properties and the mineralization process in forest gaps of different sizes. The value of available phosphorus in the four habitats followed the order medium gap > large gap > small gap > understory (p < 0.01). The available phosphorus content in the top soil layer of middle gaps in secondary forests was significantly increased, which may be due to the accumulated rich litter and root biomass in soil [15], increasing its phosphorus content. In addition, the phosphorus in the soil is easily fixed by soil clay [19], and the vegetation and litter layer in middle forest gaps can easily intercept rainfall, resulting in a small amount of phosphorus leaching loss [50]. Wei (2021) conducted a study on the influence of forest gaps on the available nitrogen of soil in a Pinus massoniana plantation. It was found that the larger forest gap areas corresponded to higher concentrations of ammonium nitrogen and nitrate nitrogen, and both were more concentrated in gap areas than in the understory [51]. Interestingly, congruent changes in ammonium nitrogen were found upon analyzing the value of ammonium nitrogen in large gaps, medium gaps, small gaps, and the understory, with the following order: large gap > small gap > medium gap > understory (p < 0.05). In contrast, different changes in nitrate nitrogen were observed upon analyzing the value of nitrate nitrogen in large gaps, medium gaps, small gaps, and the understory. The values of nitrate nitrogen in medium gaps were significantly higher than those in the small gaps, large gaps, and understory (p < 0.01), which might be caused by differences in forest gap size and in gap zone, from the understory to the canopy and the expanded gaps. Additionally, we found that the value of available potassium in the four habitats followed the order large gap > small gap > medium gap > understory, which showed that the gaps could contribute to soil nutrient transformation. Forest gaps alter the soil conditions by increasing solar radiation and reducing plant water uptake; consequently, soil surface temperatures and moisture levels in the gaps are different from those of the adjacent closed-canopy forests [12,52,53]. The gap area of evergreen broad-leaved secondary forest significantly affected the value of soil water content, which decreased between the understory and the forest gap, while the differences in soil pH among three gaps and understory were not significant (p > 0.05). This finding is consistent with the previous findings that no significant differences in pH between the gaps and forest canopy were detected [54]. Generally, medium forest gaps may have a region of rich fertility, increasing soil nutrient availability within evergreen broad-leaved secondary forests, which is beneficial to vegetation renewal and biodiversity conservation.
The diversity of soil biota communities generally plays significant roles in mediating plant community attributes, including diversity, plant productivity, community composition, and plant–soil interactions, as well as regulating how plants respond to stress factors. [24,32,55]. Microorganisms are very active in the decomposition of matter and are important factors that influence nutrient availability in plant–soil feedback systems [33,55]. Previous studies found that gap area and gap position are the main reason for the difference in species richness between the gap and within the forest [16,56,57]. The results of our study also demonstrate that forest gap size significantly affects soil community structures and composition in evergreen broad-leaved secondary forest gaps. Among all the sizes of forest gaps, medium gaps had the most significant positive correlation with the microbial communities. A similar finding was also observed in other studies, indicating that the structure and diversity of the soil bacterial community were affected by different forest gap sizes, and the soil bacterial diversity was higher in the medium gap than the small gap [55]. The SAT/MONO ratios were highest in the medium gap, but lowest in the large gap (p < 0.0001). The temperature and humidity under different forest gaps are regulated by environmental factors such as illumination and rainwater, and after entering the gap, these factors are re-regulated by the difference between vegetation types under different forest gaps [58]. This is why the SAT/MONO ratio showed no differences in different positions within the large gap but were quite different in the small gap, medium gap, and understory. Within the first few years following gap creation, the physical and chemical environment of the soil changed. The litter input and the decrease in plant root exudates resulted in insufficient nutrients for microbial metabolism, which inhibited the growth and reproduction of soil microorganisms, and this inhibition effect was more evident with the increase in the gap area [27,33]. Our study had similar findings, where the total amount of PLFAs was quite different: medium gap > large gap > small gap > under-story. The comprehensive effect of gap size and sampling location on the microbial communities is quite significant [35]. The content of G+ bacteria in the center of the gap was significantly higher than that in the same gap with a different position. Interestingly, variations in G- bacterial PLFA contents were not evident in the forest gaps. Moreover, the level in the medium gaps were relatively stable, and there were no significant changes in the center, inside, edge, and outside of the gaps. In this study, due to the same site conditions, the differences between plant community structures in the different-sized gaps may be the main factor for the significant change in soil microbial community structure [52]. Gap locations caused distinct co-occurrence patterns in fungal communities, and the beta diversity of the fungal community increased from the gap center to the closed canopy [35]. Our findings also indicate that the PLFA contents in fungi in different forest gaps ranged from 1.86 to 9.01 nmol g−1: large gap > small gap > medium gap > understory. In contrast, actinomycetes were most active in the forest gap in comparison with the understory, large gap (16.9 nmol g−1) > medium gap (13.68 nmol g−1) > small gap (12.21 nmol g−1) > understory (11.06 nmol g−1). Generally, the forest gap size substantially alters soil properties in the evergreen broad-leaved secondary forest, and alters the soil microbial community structure due to gap formation. The presented results may be strongly biased by the meteorological conditions in that specific moment, so we continued to track them for a long time. Forest gaps have profound effects on the biogeochemical processes of soil in evergreen broad-leaved secondary forests and, thus, the soil carbon pool and plant diversity. Our experiment was short, and forest gaps were shown to affect the availability of soil nutrients and soil microbe communities, driving underground ecological process. Gaps in evergreen broad-leaved secondary forests need to be further studied to understand locally relevant species and structural changes in the gap phase dynamics.

5. Conclusions

In this study, forest gaps significantly affected the soil chemical properties and soil microbial communities of evergreen broad-leaved secondary forests: (1) Forest gaps significantly affected all the chemical properties of soil; the gap area and position and their combined interactions determined the chemical properties and microbial communities of the soil. (2) Gap size was positively related to the community characteristics of soil microbial communities, as the structural quantity of soil microbial communities of the evergreen broad-leaved secondary first increased and then decreased with the increase in gap size. (3) The SAT/MONO ratio was highest in the medium gaps but lowest in the large gaps (p < 0.001). The SAT/MONO ratio showed no difference in different positions within the large gaps, but was quite different in small gaps, medium gaps, and understory. (4) The soil pH was not the main environmental factor affecting the soil microbial community composition. (5) Medium gaps (130–160 m2) always significantly improved the soil nutrients, and provided a good microenvironment for soil bacteria, fungi, AM fungi, and actinomycetes (p < 0.05). In the practice of secondary forest management, medium gaps may be a good method for secondary forest conservation, biodiversity conservation, and carbon dioxide storage. Although we provide important insights into the changes in soil microbial community structure and soil nutrients driven by forest gaps, the results need to be validated in the evergreen broad-leaved secondary forest within a few years following the gap creation.

Author Contributions

Conceptualization, S.C., C.J. (Chunqian Jiang) and Y.B.; methodology, S.C. and C.J. (Chunqian Jiang); software, Y.B. and S.Z.; validation, C.J. (Chunwu Jiang); formal analysis, L.G.; investigation, S.W.; resources, K.H.; writing—original draft preparation, S.C.; writing—review and editing, S.C. and C.J. (Chunqian Jiang); visualization, H.W. and S.Z.; supervision, C.J. (Chunqian Jiang). All authors have read and agreed to the published version of the manuscript.

Funding

This research was funded by the National Key Research and Development Program of China (2022YFF1303000) (2022YFF1303005).

Data Availability Statement

Not applicable.

Acknowledgments

We feel grateful to the facilities made available by Wang Silong at the Huitong National Research Station of Forest Ecosystem. Additionally, Yu Xiaojun, Huang Ke, Zhang Xiuyong, Qi Mengjuan, Shi Shuorong and Wang Shuren spent plenty of time assisting with the experiments. We have been very appreciative of their support.

Conflicts of Interest

The authors declare that they have no known competing financial interests or personal relationships that could have appeared to influence the work reported in this paper.

References

  1. Mantovani, M.T.W. Gap-phase regeneration in a tropical montane forest the effects of gap structure and bamboo species. Plant Ecol. 2000, 148, 149–155. [Google Scholar]
  2. Muscolo, A.; Bagnato, S.; Sidari, M.; Mercurio, R. A review of the roles of forest canopy gaps. J. For. Res. 2014, 25, 725–736. [Google Scholar] [CrossRef]
  3. Thompson, J.; Proctor, J.; Scott, D.A.; Fraser, P.J.; Marrs, R.H.; Miller, R.P.; Viana, V. Rain forest on Maracá Island Roraima Brazil artificial gaps and plant response to them. For. Ecol. Manag. 1998, 102, 305–321. [Google Scholar] [CrossRef]
  4. Orman, O.; Dobrowolska, D. Gap dynamics in the Western Carpathian mixed beech old-growth forests affected by spruce bark beetle outbreak. Eur. J. For. Res. 2017, 136, 571–581. [Google Scholar] [CrossRef]
  5. Forbes, A.S.; Norton, D.A.; Carswell, F.E. Artificial canopy gaps accelerate restoration within an exotic Pinus radiata plantation. Restor. Ecol. 2016, 24, 336–345. [Google Scholar] [CrossRef]
  6. Zhu, J.; Matsuzaki, T.; Lee, F.-Q.; Gonda, Y. Effect of gap size created by thinning on seedling emergency, survival and establishment in a coastal pine forest. For. Ecol. Manag. 2003, 182, 339–354. [Google Scholar] [CrossRef]
  7. Keram, A.; Halik, Ü.; Keyimu, M.; Aishan, T.; Mamat, Z.; Rouzi, A. Gap dynamics of natural Populus euphratica floodplain forests affected by hydrological alteration along the Tarim River: Implications for restoration of the riparian forests. For. Ecol. Manag. 2019, 438, 103–113. [Google Scholar] [CrossRef]
  8. Gálhidy, L.; Mihók, B.; Hagyó, A.; Rajkai, K.; Standovár, T. Effects of gap size and associated changes in light and soil moisture on the understorey vegetation of a Hungarian beech forest. Plant Ecol. 2005, 183, 133–145. [Google Scholar] [CrossRef]
  9. Zhao, Q.; Pang, X.; Bao, W.; He, Q. Effects of gap-model thinning intensity on the radial growth of gap-edge trees with distinct crown classes in a spruce plantation. Trees 2015, 29, 1861–1870. [Google Scholar] [CrossRef]
  10. Schliemann, S.A.B.; James, G. Methods for studying treefall gaps: A review. For. Ecol. Manag. 2011, 261, 1143–1151. [Google Scholar] [CrossRef]
  11. Vajari, K.A. The influece of forest gaps on some properties of humus in a managed beech forest, northern Iran. Eurasian Soil Sci. 2015, 48, 1131–1135. [Google Scholar] [CrossRef]
  12. Ritter, E.; Dalsgaard, L.; Einhorn, K.S. Light, temperature and soil moisture regimes following gap formation in a semi-natural beech-dominated forest in Denmark. For. Ecol. Manag. 2005, 206, 15–33. [Google Scholar] [CrossRef]
  13. Barreiro, A.; Martín, A.; Carballas, T.; Díaz-Raviña, M. Response of soil microbial communities to fire and fire-fighting chemicals. Sci. Total Environ. 2010, 408, 6172–6178. [Google Scholar] [CrossRef] [PubMed]
  14. Baena, C.W.; Andrés-Abellán, M.; Lucas-Borja, M.E.; Martínez-García, E.; García-Morote, F.A.; Rubio, E.; López-Serrano, F.R. Thinning and recovery effects on soil properties in two sites of a Mediterranean forest, in Cuenca Mountain (South-eastern of Spain). For. Ecol. Manag. 2013, 308, 223–230. [Google Scholar] [CrossRef]
  15. Hu, B.; Yang, B.; Pang, X.; Bao, W.; Tian, G. Responses of soil phosphorus fractions to gap size in a reforested spruce forest. Geoderma 2016, 279, 61–69. [Google Scholar] [CrossRef]
  16. Gray, A.N.; Spies, T.A.; Easter, M.J. Microclimatic and soil moisture responses to gap formation in coastal Douglas-fir forests. Can. J. For. Res. 2002, 32, 332–343. [Google Scholar] [CrossRef] [Green Version]
  17. Ni, X.; Yang, W.; Tan, B.; Li, H.; He, J.; Xu, L.; Wu, F. Forest gaps slow the sequestration of soil organic matter: A humification experiment with six foliar litters in an alpine forest. Sci. Rep. 2016, 6, 19744. [Google Scholar] [CrossRef] [Green Version]
  18. Bauhus, J.; Bartsch, N. Mechanisms for carbon and nutrient release and retention in beech forest gaps. Plant Soil 1995, 168, 579–584. [Google Scholar] [CrossRef]
  19. Zhang, C.; Zhao, X. Soil properties in forest gaps and under canopy in broad-leaved Pinus koraiensis forests in Changbai Mountainous Region, China. Front. For. China 2007, 2, 60–65. [Google Scholar] [CrossRef]
  20. Achat, D.L.; Augusto, L.; Bakker, M.R.; Gallet-Budynek, A.; Morel, C. Microbial processes controlling P availability in forest spodosols as affected by soil depth and soil properties. Soil Biol. Biochem. 2012, 44, 39–48. [Google Scholar] [CrossRef]
  21. Wu, Q.; Wu, F.; Tan, B.; Yang, W.; Ni, X.; Yang, Y. Carbon, nitrogen and phosphorus stocks in soil organic layer as affected by forest gaps in the alpine forest of the eastern Tibet Plateau. Russ. J. Ecol. 2015, 46, 246–251. [Google Scholar] [CrossRef]
  22. Han, M.; Tang, M.; Shi, B.; Jin, G. Effect of canopy gap size on soil respiration in a mixed broadleaved-Korean pine forest: Evidence from biotic and abiotic factors. Eur. J. Soil Biol. 2020, 99, 103194. [Google Scholar] [CrossRef]
  23. Bååth, E.; Díaz-Raviña, M.; Bakken, L.R. Microbial Biomass, Community Structure and Metal Tolerance of a Naturally Pb-Enriched Forest Soil. Microb. Ecol. 2005, 50, 496–505. [Google Scholar] [CrossRef]
  24. Banning, N.C.; Murphy, D.V. Effect of heat-induced disturbance on microbial biomass and activity in forest soil and the relationship between disturbance effects and microbial community structure. Appl. Soil Ecol. 2008, 40, 109–119. [Google Scholar] [CrossRef]
  25. Bhardwaj, Y.; Sharma, M.P.; Pandey, J.; Dubey, S.K. Variations in microbial community in a tropical dry deciduous forest across the season and topographical gradient assessed through signature fatty acid biomarkers. Ecol. Res. 2020, 35, 139–153. [Google Scholar] [CrossRef]
  26. Berg, E.C.; Zarnoch, S.J.; McNab, W.H. Twenty-year survivorship of tree seedlings in wind-created gaps in an upland hardwood forest in the eastern US. New For. 2019, 50, 323–344. [Google Scholar] [CrossRef]
  27. Shen, Y.; Yang, W.; Zhang, J.; Xu, Z.; Liu, Y.; Li, H.; You, C.; Tan, B. Forest Gap Size Alters the Functional Diversity of Soil Nematode Communities in Alpine Forest Ecosystems. Forests 2019, 10, 806. [Google Scholar] [CrossRef] [Green Version]
  28. Mogilewsky, M.; Vasey, N.; Andriamahaihavana, M.A.; Rakotomalala, Z. Contribution of tree-fall canopy gaps to variation in nitrogen content of fruits and leaves from Varecia and Eulemur food trees in northeastern Madagascar. Am. J. Phys. Anthropol. 2019, 168, 167–168. [Google Scholar]
  29. Dietz, L.; Collet, C.; Dupouey, J.; Lacombe, E.; Laurent, L.; Gégout, J. Windstorm-induced canopy openings accelerate temperate forest adaptation to global warming. Glob. Ecol. Biogeogr. 2020, 29, 2067–2077. [Google Scholar] [CrossRef]
  30. Herault, B.; Ouallet, J.; Blanc, L.; Wagner, F.; Baraloto, C. Growth responses of neotropical trees to logging gaps. J. Appl. Ecol. 2010, 47, 821–831. [Google Scholar] [CrossRef]
  31. Scharenbroch, B.C.; Bockheim, J.G. Impacts of forest gaps on soil properties and processes in old growth northern hardwood-hemlock forests. Plant Soil 2007, 294, 219–233. [Google Scholar] [CrossRef]
  32. Kushwaha, P.; Neilson, J.W.; Barberán, A.; Chen, Y.; Fontana, C.G.; Butterfield, B.J.; Maier, R.M. Arid Ecosystem Vegetation Canopy-Gap Dichotomy: Influence on Soil Microbial Composition and Nutrient Cycling Functional Potential. Appl. Environ. Microbiol. 2021, 87, e02780-20. [Google Scholar] [CrossRef] [PubMed]
  33. Yang, Y.; Geng, Y.; Zhou, H.; Zhao, G.; Wang, L. Effects of gaps in the forest canopy on soil microbial communities and enzyme activity in a Chinese pine forest. Pedobiologia 2017, 61, 51–60. [Google Scholar] [CrossRef]
  34. Yang, B.; Pang, X.; Hu, B.; Bao, W.; Tian, G. Does thinning-induced gap size result in altered soil microbial community in pine plantation in eastern Tibetan Plateau? Ecol. Evol. 2017, 7, 2986–2993. [Google Scholar] [CrossRef]
  35. Han, W.; Wang, G.; Liu, J.; Ni, J. Effects of vegetation type, season, and soil properties on soil microbial community in subtropical forests. Appl. Soil Ecol. 2021, 158, 103813. [Google Scholar] [CrossRef]
  36. Li, D.; Li, X.; Su, Y.; Li, X.; Yin, H.; Li, X.; Guo, M.; He, Y. Forest gaps influence fungal community assembly in a weeping cypress forest. Appl. Microbiol. Biotechnol. 2019, 103, 3215–3224. [Google Scholar] [CrossRef] [PubMed]
  37. Kisanuki, H.; Nakasu, M.; Nakai, A.; Yurugi, Y. Predicting the population dynamics of three understory broad-leaved evergreen species under the influence of Sika deer in primary and secondary forests of mid-western Japan. J. For. Res. 2008, 13, 52–58. [Google Scholar] [CrossRef]
  38. Li, X.; Wilson, S.; Song, Y. Secondary succession in two subtropical forests. Plant Ecol. 1999, 143, 13–21. [Google Scholar] [CrossRef]
  39. Pang, X.; Bao, W.; Zhu, B.; Cheng, W. Responses of soil respiration and its temperature sensitivity to thinning in a pine plantation. Agric. For. Meteorol. 2013, 171–172, 57–64. [Google Scholar] [CrossRef]
  40. Bolat, I. The effect of thinning on microbial biomass C, N and basal respiration in black pine forest soils in Mudurnu, Turkey. Eur. J. For. Res. 2013, 133, 131–139. [Google Scholar] [CrossRef]
  41. Xiao, F. Mensuration of respiration amount in the community of secondary evergreen broadleaved forests in Huitong County, Hu’nan Province. J. Beijing For. Univ. 2006, 28, 40–44. [Google Scholar]
  42. Yan, S.; Wang, S.; Hu, Y.; Gao, H.; Zhang, X. A comparative study on soil fauna in native secondary evergreen broad-leaved forest and Chinese fir plantation forests in subtropics. Chin. J. Appl. Ecol. 2004, 15, 1792–1796. [Google Scholar]
  43. Wang, J.; Zhang, Y.; Ma, Y.; Liu, Y.; Li, Y.; Duan, W. Linear character of the sunshine of the gap in the artifical forest in Xishuangbanna. J. Plant Resour. Environ. 2000, 9, 27–30. [Google Scholar]
  44. IUSS Working Group WRB. World Reference Base for Soil Resources 2014, Update 2015. In International Soil Classification System for Naming Soils and Creating Legends for Soil Maps, World Soil Resources Reports No. 106; FAO: Rome, Italy, 2015. [Google Scholar]
  45. Runkle, J.R. Patterns of Disturbance in Some Old-Growth Mesic Forests of Eastern North America. Ecology 1982, 63, 1533–1546. [Google Scholar] [CrossRef] [Green Version]
  46. Amir, A.A.D.; Norman, C. Distinct characteristics of canopy gaps in the subtropical mangroves of Moreton Bay, Australia. Estuar. Coast. Shelf Sci. 2019, 222, 66–80. [Google Scholar] [CrossRef]
  47. Jiménez, J.J.; Igual, J.M.; Villar, L.; Benito-Alonso, J.L.; Abadias-Ullod, J. Hierarchical drivers of soil microbial community structure variability in “Monte Perdido” Massif (Central Pyrenees). Sci. Rep. 2019, 9, 8768. [Google Scholar] [CrossRef] [Green Version]
  48. Qiao, H.; Luan, Y.; Wang, B.; Dai, W.; Zhao, M. Analysis of spatiotemporal variations in the characteristics of soil microbial communities in Castanopsis fargesii forests. J. For. Res. 2019, 31, 1975–1984. [Google Scholar] [CrossRef] [Green Version]
  49. Pollierer, M.M.; Ferlian, O.; Scheu, S. Temporal dynamics and variation with forest type of phospholipid fatty acids in litter and soil of temperate forests across regions. Soil Biol. Biochem. 2015, 91, 248–257. [Google Scholar] [CrossRef]
  50. Ou, J.; Liu, Y.; Zhang, J.; Zhang, J.; Cui, N.; Deng, C.; Ji, T.; He, R. Early influence of forest gap harvesting on soil phosphorus in Pinus massoniana plantation in a hilly area of the reaches of Yangtze River. Chin. J. Ecol. 2014, 33, 592–601. [Google Scholar]
  51. Wei, Q. Infuence of forest gaps on the available nitrogen of soil in a pinus massoniaan plantation. J. For. Environ. 2021, 41, 124–131. [Google Scholar]
  52. Zhu, J.-J.; Tan, H.; Li, F.-Q.; Chen, M.; Zhang, J.-X. Microclimate regimes following gap formation in a montane secondary forest of eastern Liaoning Province, China. J. For. Res. 2007, 18, 167–173. [Google Scholar] [CrossRef]
  53. Wang, Q.; Pieristè, M.; Liu, C.; Kenta, T.; Robson, T.M.; Kurokawa, H. The contribution of photodegradation to litter decomposition in a temperate forest gap and understorey. New Phytol. 2021, 229, 2625–2636. [Google Scholar] [CrossRef] [PubMed]
  54. Zhou, Y.-G.; Hao, K.-J.; Li, X.-W.; Fan, C.; Chen, Y.-L.; Liu, Y.-K.; Wang, X. Effects of forest gap on seasonal dynamics of soil organic carbon and microbial biomass car- bon in Picea asperata forest in Miyaluo of Western Sichuan, Southwest China. Chin. J. Appl. Ecol. 2014, 25, 2469–2476. [Google Scholar]
  55. Wang, X.; Liu, J.; He, Z.; Xing, C.; Zhu, D. Forest gaps mediate the structure and function of the soil microbial community in a castanopsis kawakamii forest. Ecol. Indic. 2021, 122, 107288. [Google Scholar] [CrossRef]
  56. Chen, L.; Han, W.; Liu, D.; Liu, G. How forest gaps shaped plant diversity along an elevational gradient in Wolong National Nature Reserve? J. Geogr. Sci. 2019, 29, 1081–1097. [Google Scholar] [CrossRef] [Green Version]
  57. Tang, C.Q.; Han, P.-B.; Li, S.; Shen, L.-Q.; Huang, D.-S.; Li, Y.-F.; Peng, M.-C.; Wang, C.-Y.; Li, X.-S.; Li, W.; et al. Species richness, forest types and regeneration of Schima in the subtropical forest ecosystem of Yunnan, southwestern China. For. Ecosyst. 2020, 7, 35. [Google Scholar] [CrossRef]
  58. Modrow, T.; Kuehne, C.; Saha, S.; Bauhus, J.; Pyttel, P.L. Photosynthetic performance, height growth, and dominance of naturally regenerated sessile oak (Quercus petraea Mattuschka Liebl.) seedlings in small-scale canopy openings of varying sizes. Eur. J. For. Res. 2020, 139, 41–52. [Google Scholar] [CrossRef]
Figure 1. Study area showing location of the sample plots in an evergreen broad-leaved secondary forest of China.
Forests 13 02015 g001
Figure 2. Soil samples from different sampling locations within the forest gaps. For sampling locations, C represents the center of forest gaps, I represents the location away from the center at 0.5 R distance, E represents the location at the edge of forest gaps, and O represents the location away from the center at 1.5 R distance (R, means gap radius).
Forests 13 02015 g002
Figure 3. The percentage of PLFAS charactering microbes in forest gaps of different sizes.
Forests 13 02015 g003
Figure 4. Comparison of SAT/MONO ratios in different gap positions (mean ± SE, 95% CI). Note: A, B, C, and D indicate differences in the same gap position with different sizes; a, b, and c show differences in different positions within the same gap (p < 0.05).
Forests 13 02015 g004
Figure 5. (ad) Differences in the contents of the soil microbial community in forest gaps (mean ± SE, 95% CI). Note: A, B, C, and D indicate differences in the same gap positions with different sizes; a, b, c, and d show differences in different positions within the same gap (p < 0.05).
Forests 13 02015 g005
Figure 6. Contents of AM Fungi PLFAs in the different forest gap area (mean ± SE, 95% CI). Note: A, B, C, and D indicate differences in the same gap position with different sizes; a, b, c, and d show differences in a different position within the same gap (p < 0.05).
Forests 13 02015 g006
Figure 7. Redundancy analysis (RDA) of relationships between microbial community structures, physcochemical properties, and environmental factors. The variations in the cumulative interpretation of the first and second axes were 96.2%. The first axis indicates the variables in 78.2%, and the second axis explains the variables in 18.0%.
Forests 13 02015 g007
Table 1. General information of the forest gaps and control plots (understory) in this study.
Forest GapD/HArea/m2Slope DirectionGeographic PositionFormation
G10.360East109°36′6″ E 26°51′11″ NCutting
G21.3130Northeast109°36′8″ E 26°51′13″ NCutting
G32.3270East109°36′7″ E 26°51′09″ NCutting
G40.373Southeast109°36′9″ E 26°51′12″ NCutting
G51.3149Southeast109°36′9″ E 26°51′07″ NCutting
G62.3286Northeast109°36′10″ E 26°47′10″ NCutting
G70.380East109°36′10″ E 26°50′15″ NCutting
G81.3160Northeast109°36′11″ E 26°52′14″ NCutting
G92.3300East109°36′15″ E 26°51′14″ NCutting
Understory100Southeast109°36′16″ E 26°49′14″ NNatural
Understory100Northeast109°36′18″ E 26°46′14″ NNatural
Understory100East109°36′17″ E 26°50′14″ NNatural
Notes: D/H represents the ratios of gap diameter to stand height; G1, G4, and G7, represent small gaps; G2, G5, and G8 represent medium gaps; and G3, G6, and G9 represent large gaps.
Table 2. Phospholipid fatty acid (PLFA) profiling of soil microbial communities.
Microbial GroupPhospholipids Fatty Acids Signatures
Actinomycetes16:0 10-methyl; 17:0 10-methyl; 17:1 w7c 10-methyl; 18:0 10-methyl; 18:1 w7c 10-methyl etc.
G+ bacteria11:0 anteiso; 11:0 iso; 12:0 anteiso; 12:0 iso; 13:0 anteiso; 13:0 iso; 14:0 anteiso; 14:0 iso; 14:1 iso w7c; 15:0 anteiso; 15:0 iso; 15:1 anteiso w9c; 15:1 iso w6c; 15:1 iso w9c; 16:0 anteiso; 16:0 iso; 17:0 anteiso; 17:0 iso; 17:1 iso w9c; 18:0 iso; 19:0 anteiso; 19:0 iso; 20:0 iso; 22:0 iso
G− bacteria13:1 w5c; 14:0 2OH; 14:1 w8c; 14:1 w9c; 15:1 w7c; 15:1 w8c; 5:1 w9c; 16:0 2OH; 17:0 cyclo w7c; 17:1 w3c; 21:1 w3c; 21:1 w4c; 21:1 w5c; 21:1 w6c; 21:1 w8c; 22:1 w6c; 22:1 w8c; 22:1 w9c; 24:1 w7c
Eukaryote15:3 w3c; 15:4 w3c; 16:3 w6c; 16:4 w3c; 18:3 w6c; 19:3 w3c; 19:3 w6c; 19:4 w6c; 20:2 w6c; 20:3 w6c; 20:4 w6c; 20:5 w3c; 21:3 w3c; 21:3 w6c; 22:2 w6c; 22:4 w6c
22:5 w3c; 22:5 w6c; 22:6 w3c; 23:1 w4c; 23:1 w5c; 23:3 w3c; 23:3 w6c; 23:4 w6c; 24:1 w3c; 24:3 w3c; 24:3 w6c; 24:4 w6c
AM Fungi18:2 w6c
Fungi16:1 w5c
Table 3. Total amount of soil microbial PLFAs under the forest gap area (mean ± SE, 95% CI).
Gap TypeGap Position
CenterInsideEdgeOutsideTotal
Small gap100.82 ± 2.21 Aa95.71.41 ± 1.19 Bb94.25 ± 2.4 Cb90.08 ± 2.58 Dd94.35 ± 3.12 a
Medium gap108.93 ± 3.81 Ba105.00 ± 3.34 Bb98.48 ± 4.45 Bc95.00 ± 3.81 Dc101.73 ± 1.10 b
Large gap86.75 ± 2.63 Ca95.27 ± 1.63 Bb116.73 ± 2.83 Cc86.08 ± 1.41 Ba95.75 ± 2.06 c
Understory90.43 ± 3.62 C 90.43 ± 3.62 a
Note: A, B, C, and D indicate differences in the same gap position with different sizes; a, b, c, and d show differences in the different positions within the same gap (p < 0.05).
Table 4. Effect of different sizes of forest gaps on soil chemical properties (mean ± SE, 95% CI).
Gap SizeAvailable PhosphorusAvailable
Potassium
Nitrate
Nitrogen
Ammonium
Nitrogen
Soil Water
Content
Soil
pH
Small gap1.83 ± 0.07 A44.10 ± 5.23 A2.1 ± 1.09 A8.57 ± 1.18 A0.38 ± 0.03 A4.28 ± 0.02 A
Medium gap2.09 ± 0.09 B43.88 ± 3.91 A2.48 ± 0.71 B8.93 ± 0.88 B0.37 ± 0.02 A4.37 ± 0.11 A
Large gap2.07 ± 0.09 C69.50 ± 7.09 B1.58 ± 0.62 C9.85 ± 4.43 C0.34 ± 0.01 B4.44 ± 0.08 A
Understory1.98 ± 0.06 A36.59 ± 0.3.7 C0.37 ± 0.01 D8.27 ± 0.04 A0.32 ± 0.05 C4.31 ± 0.04 A
Note: A, B, C, and D indicate differences in the forest gap with different sizes.
Table 5. Two-way analysis of variance (ANOVA) for the effects of gap size and location on soil basic chemical properties in evergreen broad-leaved secondary forest.
FactordfAvailable
Phosphorus
Available
Potassium
Nitrate
Nitrogen
Ammonium
Nitrogen
Soil Water ContentSoil pH
Gap area3<0.01<0.05<0.05<0.05<0.05<0.05
Gap position3<0.05<0.05<0.01<0.01<0.010.679
Gap area × gap position9<0.050.269<0.01<0.01<0.050.963
Publisher’s Note: MDPI stays neutral with regard to jurisdictional claims in published maps and institutional affiliations.

