Article

Spatial-Coherent Dynamics and Climatic Signals in the Radial Growth of Siberian Stone Pine (Pinus sibirica Du Tour) in Subalpine Stands along the Western Sayan Mountains

by
Dina F. Zhirnova
1,
Liliana V. Belokopytova
1,*,
Konstantin V. Krutovsky
2,3,4,5,6,
Yulia A. Kholdaenko
1,
Elena A. Babushkina
1 and
Eugene A. Vaganov
7,8
1
Khakass Technical Institute, Siberian Federal University, 655017 Abakan, Russia
2
Department of Forest Genetics and Forest Tree Breeding, Georg-August University of Göttingen, D-37077 Göttingen, Germany
3
Center for Integrated Breeding Research (CiBreed), Georg-August University of Göttingen, D-37075 Göttingen, Germany
4
Laboratory of Population Genetics, N. I. Vavilov Institute of General Genetics, Russian Academy of Sciences, 119333 Moscow, Russia
5
Laboratory of Forest Genomics, Genome Research and Education Center, Department of Genomics and Bioinformatics, Institute of Fundamental Biology and Biotechnology, Siberian Federal University, 660036 Krasnoyarsk, Russia
6
Scientific and Methodological Center, G. F. Morozov Voronezh State University of Forestry and Technologies, 394036 Voronezh, Russia
7
Institute of Ecology and Geography, Siberian Federal University, 660036 Krasnoyarsk, Russia
8
Department of Dendroecology, V.N. Sukachev Institute of Forest, Siberian Branch of the Russian Academy of Science, 660036 Krasnoyarsk, Russia
*
Author to whom correspondence should be addressed.
Forests 2022, 13(12), 1994; https://doi.org/10.3390/f13121994
Submission received: 1 November 2022 / Revised: 23 November 2022 / Accepted: 23 November 2022 / Published: 25 November 2022
(This article belongs to the Special Issue Climate-Smart Forestry: Problems, Priorities and Prospects)

Abstract

:
Siberian stone pine (Pinus sibirica Du Tour) is one of the keystone conifers in Siberian taiga, but its radial growth is complacent and thus rarely investigated. We studied its growth in subalpine stands near the upper timberline along the Western Sayan Mountains, Southern Siberia, because climatic responses of trees growing on the boundaries of species distribution help us better understand their performance and prospects under climate change. We performed dendroclimatic analysis for six tree-ring width chronologies with significant between-site correlations at distances up to 270 km (r = 0.57–0.84, p < 0.05). We used ERA-20C (European Reanalysis of the Twentieth Century) daily climatic series to reveal weak but spatially coherent responses of tree growth to temperature and precipitation. Temperature stably stimulated growth during the period from the previous July–August to current August, except for an adverse effect in April. Precipitation suppressed growth during periods from the previous July–September to December (with reaction gradually strengthening) and from the current April to August (weakening), while the snowfall impact in January–March was neutral or positive. Weather extremes probably caused formation of wide tree rings in 1968 and 2002, but narrow rings in 1938, 1947, 1967, 1988, and 1997. A subtle increase in the climatic sensitivity of mature trees was observed for all significant seasonal climatic variables except for the temperature in the previous October–January. The current winter warming trend is supposedly advantageous for young pine trees based on their climatic response and observed elevational advance.

1. Introduction

The current global warming has contributed to a shift in the timeframe of the vegetation season and its heat supply [1,2,3]. Plant species-specific physiological traits and adaptability to new conditions sometimes lead to ambiguous or contradictory reactions to climatic fluctuations and significant changes in growth patterns [4,5,6]. Therefore, it is crucial to understand the climatic response of woody vegetation as an important part in the planetary carbon cycle [7,8,9,10,11]. Forest ecosystems can react most acutely to altered conditions at the outskirts of their distribution, where severe stress often pushes trees toward the limit of their physiological endurance and survival [12,13,14,15]. Under such extremely difficult conditions for plants, particularly at the upper limit of growth in mountains, responses to ongoing climate change can include both expansion and reduction of the distribution areas [4,16,17,18,19,20].
The Siberian stone pine (Pinus sibirica Du Tour) occupies immense area in the taiga of continental Siberia, being also one of the keystone species of mountain forests [21,22,23,24,25,26,27]. Therefore, the reaction of this species to climate change can make a significant contribution in the vegetation dynamics on the upper forest line of this large region. However, despite this, P. sibirica is often insufficiently studied due to the rather complacent radial growth (see [28], pp. 11, 74 for explaining complacent vs. sensitive growth patterns) and weak, often ambiguous climatic signal in comparison to other conifers [29,30,31]. There may be several reasons for such weak reactions to external influences. For example, the weak growth response of P. sibirica to low temperatures in high altitude conditions may be associated with a huge genome size of 28.96 × 10⁹ base pairs [32,33,34], that is larger than in most tree species (compare with 12.05 × 10⁹ base pairs in genome of Larix sibirica Ledeb., a co-habiting species that has much more climate-sensitive radial growth). The low annual growth variability in P. sibirica may also reflect a high degree of adaptation to cold environments and a strategy to accumulate and expend resources slowly under these conditions [35,36]. There are also other closely related (Korean and European stone pines) and more distant (e.g., sequoia) conifer species using this strategy [37,38,39,40]. In any case, the uncertainty of the climatic signal in the growth of P. sibirica left the following questions open: does this species have a problem with adaptation to climate warming; will it be replaced with other species; does it have a “prosperous” future?
Studies of climatic influence on trees are also complicated by the fact that intensity of climatic reaction is modulated by a whole spectrum of external and internal factors from local conditions to ontogenetic or phenotypic characteristics [6,41,42,43,44]. Moreover, the impact of these factors can also be ambiguous. For example, there is evidence of increasing as well as decreasing climatic responses of trees with age [45,46,47,48,49,50,51]. In high mountain conditions, nutrient availability [52,53], distribution and redistribution of humidity [54] and snow cover [55,56,57,58,59] across complex terrains and other local factors also significantly affect tree growth. Among many variables determining tree growth, the main limiting factor in mountain forest ecosystems is temperature [13,38]. The spatial field of temperature, despite topographical microclimatic heterogeneity, exhibits coherent fluctuations over quite long distances [60,61,62,63]. Therefore, we assume that at the upper limit of growth, response to temperature of trees of the same species should be rather synchronous over a wide spatial range [64] (cf. large-scale tree-ring based temperature reconstructions [65,66]).
In this study, we (i) analyzed the dynamics of the P. sibirica radial growth in high mountain forest stands along the Western Sayan Mountains in Southern Siberia, (ii) estimated degrees of spatial synchrony and temporal stability in its climatic response, and (iii) assessed the contribution of local conditions and tree age to its variations.

2. Materials and Methods

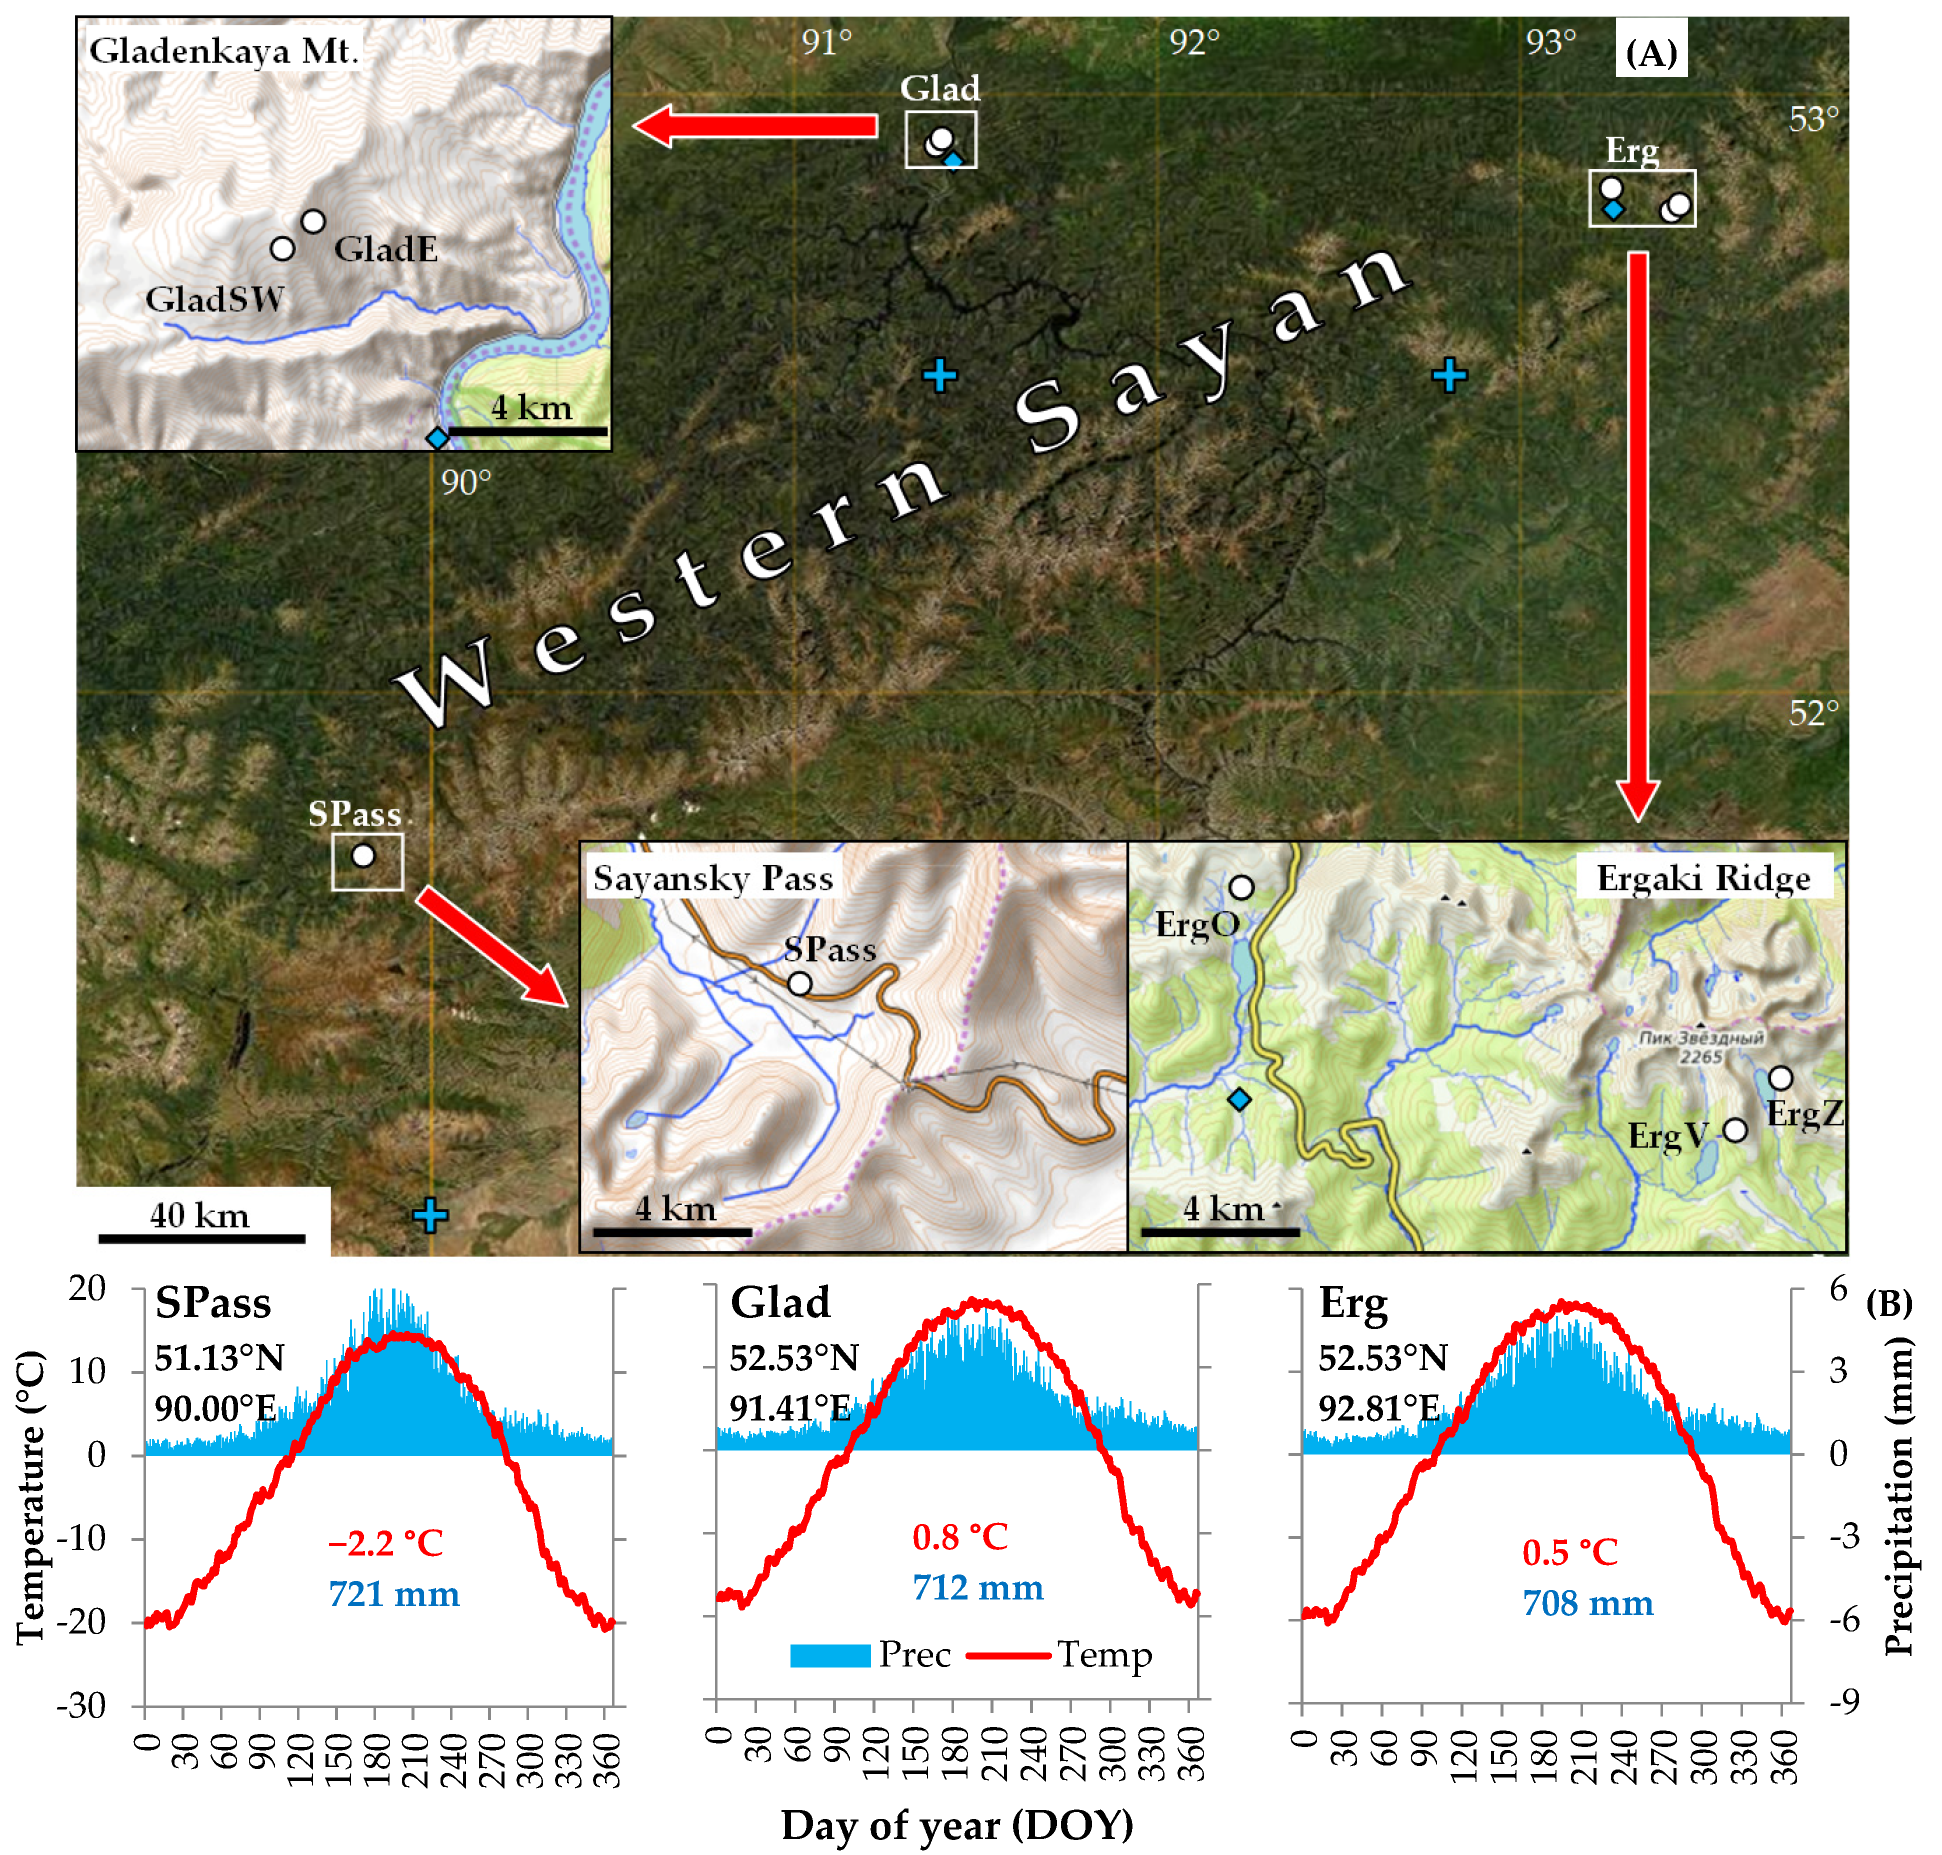
2.1. Study Area and Sampling Sites

The study of the radial growth of P. sibirica was carried out in the subalpine taiga forests of the Western Sayan Mountains, near the upper timberline (Figure 1A). In the southwest of the mountain system, one sampling site (SPass) was located on the southeastern slope in the forest stand of P. sibirica with an admixture of Larix sibirica near the Sayan Pass (Table 1). In the north-center of the Western Sayan Mts., samples were taken near the top of Gladenkaya Mt. in sparse clamps of P. sibirica trees on the eastern slope (GladE), and a closed forest stand of P. sibirica and Abies sibirica Ledeb. on the southwestern slope (GladSW). In the north-east of the mountain system, samples were collected in the Nature Park “Ergaki” along the eponymous ridge, from sampling sites located in the mixed P. sibirica and Abies sibirica stands on south-to-western slopes near Lake Oiskoe (ErgO), Lake Zolotarnoye (ErgZ), and on Vidovka Mt. (ErgV).
The upper limit of tree growth (timberline area and trees between timberline and treeline) across Western Sayan Mts. is represented by saplings and young trees less than 100 years old, so the sampling sites were selected below the timberline by 50–100 m, where the forest stand includes a substantial proportion of mature and old trees. On the gentler slopes of SPass, GladSW, ErgV and the lower part of ErgO site, the soil is completely covered with moss or herbaceous-moss cover. On the steeper slopes of the GladE, ErgZ and upper part of ErgO site, the ground includes a lot of rocks, with patches of soil covered with herbs or mosses between them.
The climate across the Western Sayan Mts. is sharply continental, with large daily and seasonal variations of temperature (Figure 1B, [67]). Both precipitation and temperatures reach a maximum in July and a minimum in January. The main source of climate data in this study was the spatially distributed ERA-20C daily series with grid cells of 1.4° latitude and longitude [68]. Series available in the KNMI Climate Explorer open database (https://climexp.knmi.nl/selectdailyfield2.cgi; accessed on 1 November 2022) cover the period 1900–2010, but due to a change in precipitation measurement approach and a sharp increase in the number of state meteorological stations in 1936 in the territory of Russia [69], climate instrumental series are less reliable before 1936, as well as interpolations based on them. Therefore, in this study, only data for the period of 1936–2010 were used.
According to the ERA-20C series, the mean annual temperature for the study areas during the period 1936–2010 varied from −2.2 °C to +0.8 °C; the annual sum of precipitation was 708–721 mm. However, these values were averaged for large areas with a wide range of elevations, so climatic gradients should be taken into account. For Western Sayan Mts., a decrease in temperature by 0.4–0.6 °C depending on the season and an increase in annual precipitation by 100–200 mm are observed per 100 m of increase in elevation, as well as increasing portion of annual precipitation falling during the cold season [70,71]. For example, at 1400 m a.s.l. in the National Park “Ergaki” (station Olenya Rechka, 52.80 °N, 93.24 °E, 1927–2015) the mean annual temperature was −3.1 °C, and the sum of precipitation was 1230 mm, with 25% of this amount occurring from November to March. At the same time, near the Gladenkaya Mt. at 330 m a.s.l. (station Cheryomushki, 52.87 °N, 91.42 °E, 1951–2017), the annual values of temperature and precipitation were +3.4 °C and 534 mm, respectively, with only 14% of precipitation occurring in November–March. Therefore, we assumed that temperatures were below and total precipitation was above the average ERA-20C values for subalpine sampling sites. Thus, the timberline of the Western Sayan Mts. has a cold and humid climate with long, frosty and snowy winters and short, cool and rainy summers.

2.2. Tree-Ring Width Chronologies and Statistical Analysis

Wood cores were collected in 2017–2020 using incremental borers at a height of ~1.3 m in the direction across the slope (parallel to the elevation isolines) from living adult trees of P. sibirica without mechanical damage and skipping close neighbors. Collection, transportation, storage and preparation of the wood cores for measurement were carried out by classical methods of dendrochronology [72]. Tree-ring width (TRW) measurements, cross-dating of individual series, and the development of local indexed chronologies were carried out using the LINTAB tool and the specialized programs TSAPwin, COFECHA, and ARSTAN [73,74,75]. During indexation, the age-related trends were described by smoothing cubic splines with a 50% frequency response at 67% of the series length. Standard (std) TRW indexes were calculated as a ratio of actual measurements to trend values. Then, the autocorrelation component was removed from the individual TRW, gaining residual (res) series. Finally, the individual series at each sampling site were averaged with the bi-weighted mean to obtain local chronologies. For each chronology, we calculated the following statistics: standard deviation (SD), mean inter-series correlation coefficient (r-bar) and mean sensitivity coefficient (sens, the absolute value of the difference between two consecutive values of the TRW index divided by their mean and averaged along all chronology length). For the cover period of climatic series, 1936–2010, all local chronologies had sufficient values of the expressed population signal (EPS) above 0.85 [76] (Figure S1). Residual TRW chronologies were used in this study because they have higher dendroclimatic correlations than standard chronologies (data not presented).
Dendroclimatic correlation analysis was carried out over the 1936–2010 period for residual local chronologies with moving series of average temperature and total precipitation, generalized with an intra-seasonal window of 21 days and a 1-day step from daily series of the corresponding grid cells in the ERA-20C field (Figure 1). Particular seasons were named in accordance with approximate average temperatures in the study areas during these time intervals: cold season of negative temperatures, lasting about from November to March; vegetation season of secondary tree growth at temperatures above +5 °C, usually beginning in May and ending in September; early spring season with temperatures rising from 0 to +5 °C, occurring approximately in April. Since direct observations of P. sibirica seasonal growth have not been performed in the study region, estimations of a temperature threshold of about +5 °C on average [77,78] were used for the vegetation season. After identifying tentatively seasonal intervals of a homogeneous climatic response, their boundaries were adjusted with daily precision to maximize dendroclimatic correlations. The temporal stability of climatic responses was estimated for these seasonal climatic series using 30-year moving correlations. Time series (TRW chronologies and climatic series) were used in the correlation analysis per se (i.e., without further processing). These series were also separated into low-frequency (>5 years) and high-frequency domains, and correlations for each domain were calculated separately. A simple smoothing filter by the 5 year moving average was applied for the low-frequency domain. Difference between the initial series and smoothed one was used to estimate high-frequency fluctuations.
The spatial coherence of the climatic fields and the applicability of the ERA-20C series for dendroclimatic correlation analysis were supported by significant positive correlations of the 21 day series for the considered geographic grid cells among themselves (0.88–0.99 for temperatures and 0.35–0.99 for precipitation, p < 0.05) and with the series from nearest meteostations (0.73–0.96 for temperatures, p < 0.05; 0.11–0.90 for precipitation, p < 0.05 for 97.5% of the intra-seasonal intervals). It can be concluded that the interannual dynamics of the regional temperature field had an extremely high coherence with the dynamics of actual temperatures at the sampling sites. For precipitation, spatial synchronization was expectedly weaker, and the results of dendroclimatic analysis should be interpreted and applied with caution.
The spatial synchronicity in the pine growth, besides correlations between local chronologies per se and between their components after separation into high and low frequencies, was also assessed using hierarchical cluster analysis [79]. We used the following distance measures:
(i)
(1—r), where r is a correlation coefficient between two chronologies or their groups (clusters) over the 1936–2010 period (coherence in growth dynamics);
(ii)
Euclidean distance, where the coordinates are correlations of chronologies with seasonal climatic variables (coherence in sign and intensity of climatic response);
(iii)
Euclidean distance, where the coordinates are the start and end dates of the maximum seasonal climatic responses (coherence in seasonality of climatic response).
To estimate the distance between clusters of chronologies, the method of full linkage was used. The variance analysis was applied to assess the significance of differences between particular clusters of chronologies in terms of intensity and seasonality of the climatic response.
Pointer years of the regional scale over the 1936–2010 period were defined as years when all six local TRW chronologies simultaneously have deviations below meanSD (negative) or above mean + SD (positive). To assess the climatic patterns of each pointer year, we calculated the relative anomalies of temperature and precipitation for the period from the previous July to the current August. For that purpose, each 21-day moving climatic series for the 1936–2010 period was converted by linear transformation to Z-scores (mean = 0 and SD = 1). In the transformed series, for example, the value +2 for the temperature on the date of 11 May means that, in the given year, the interval of 1–21 May was warmer than the average temperature of this intra-seasonal interval by two standard deviations.
To identify possible age-related alterations of the climatic response, the most extensive samples at the SPass site (52 trees) were divided into three groups with cambial ages of less than 100 years (young), 100–200 years (middle-aged), and more than 200 years (old) in 2010 (19, 17, and 16 trees, respectively). Respective residual age-group chronologies for SPassY, SPassM, and SPassO were constructed and their 21 day climatic response was calculated the same way as for the local chronology SPass.

3. Results

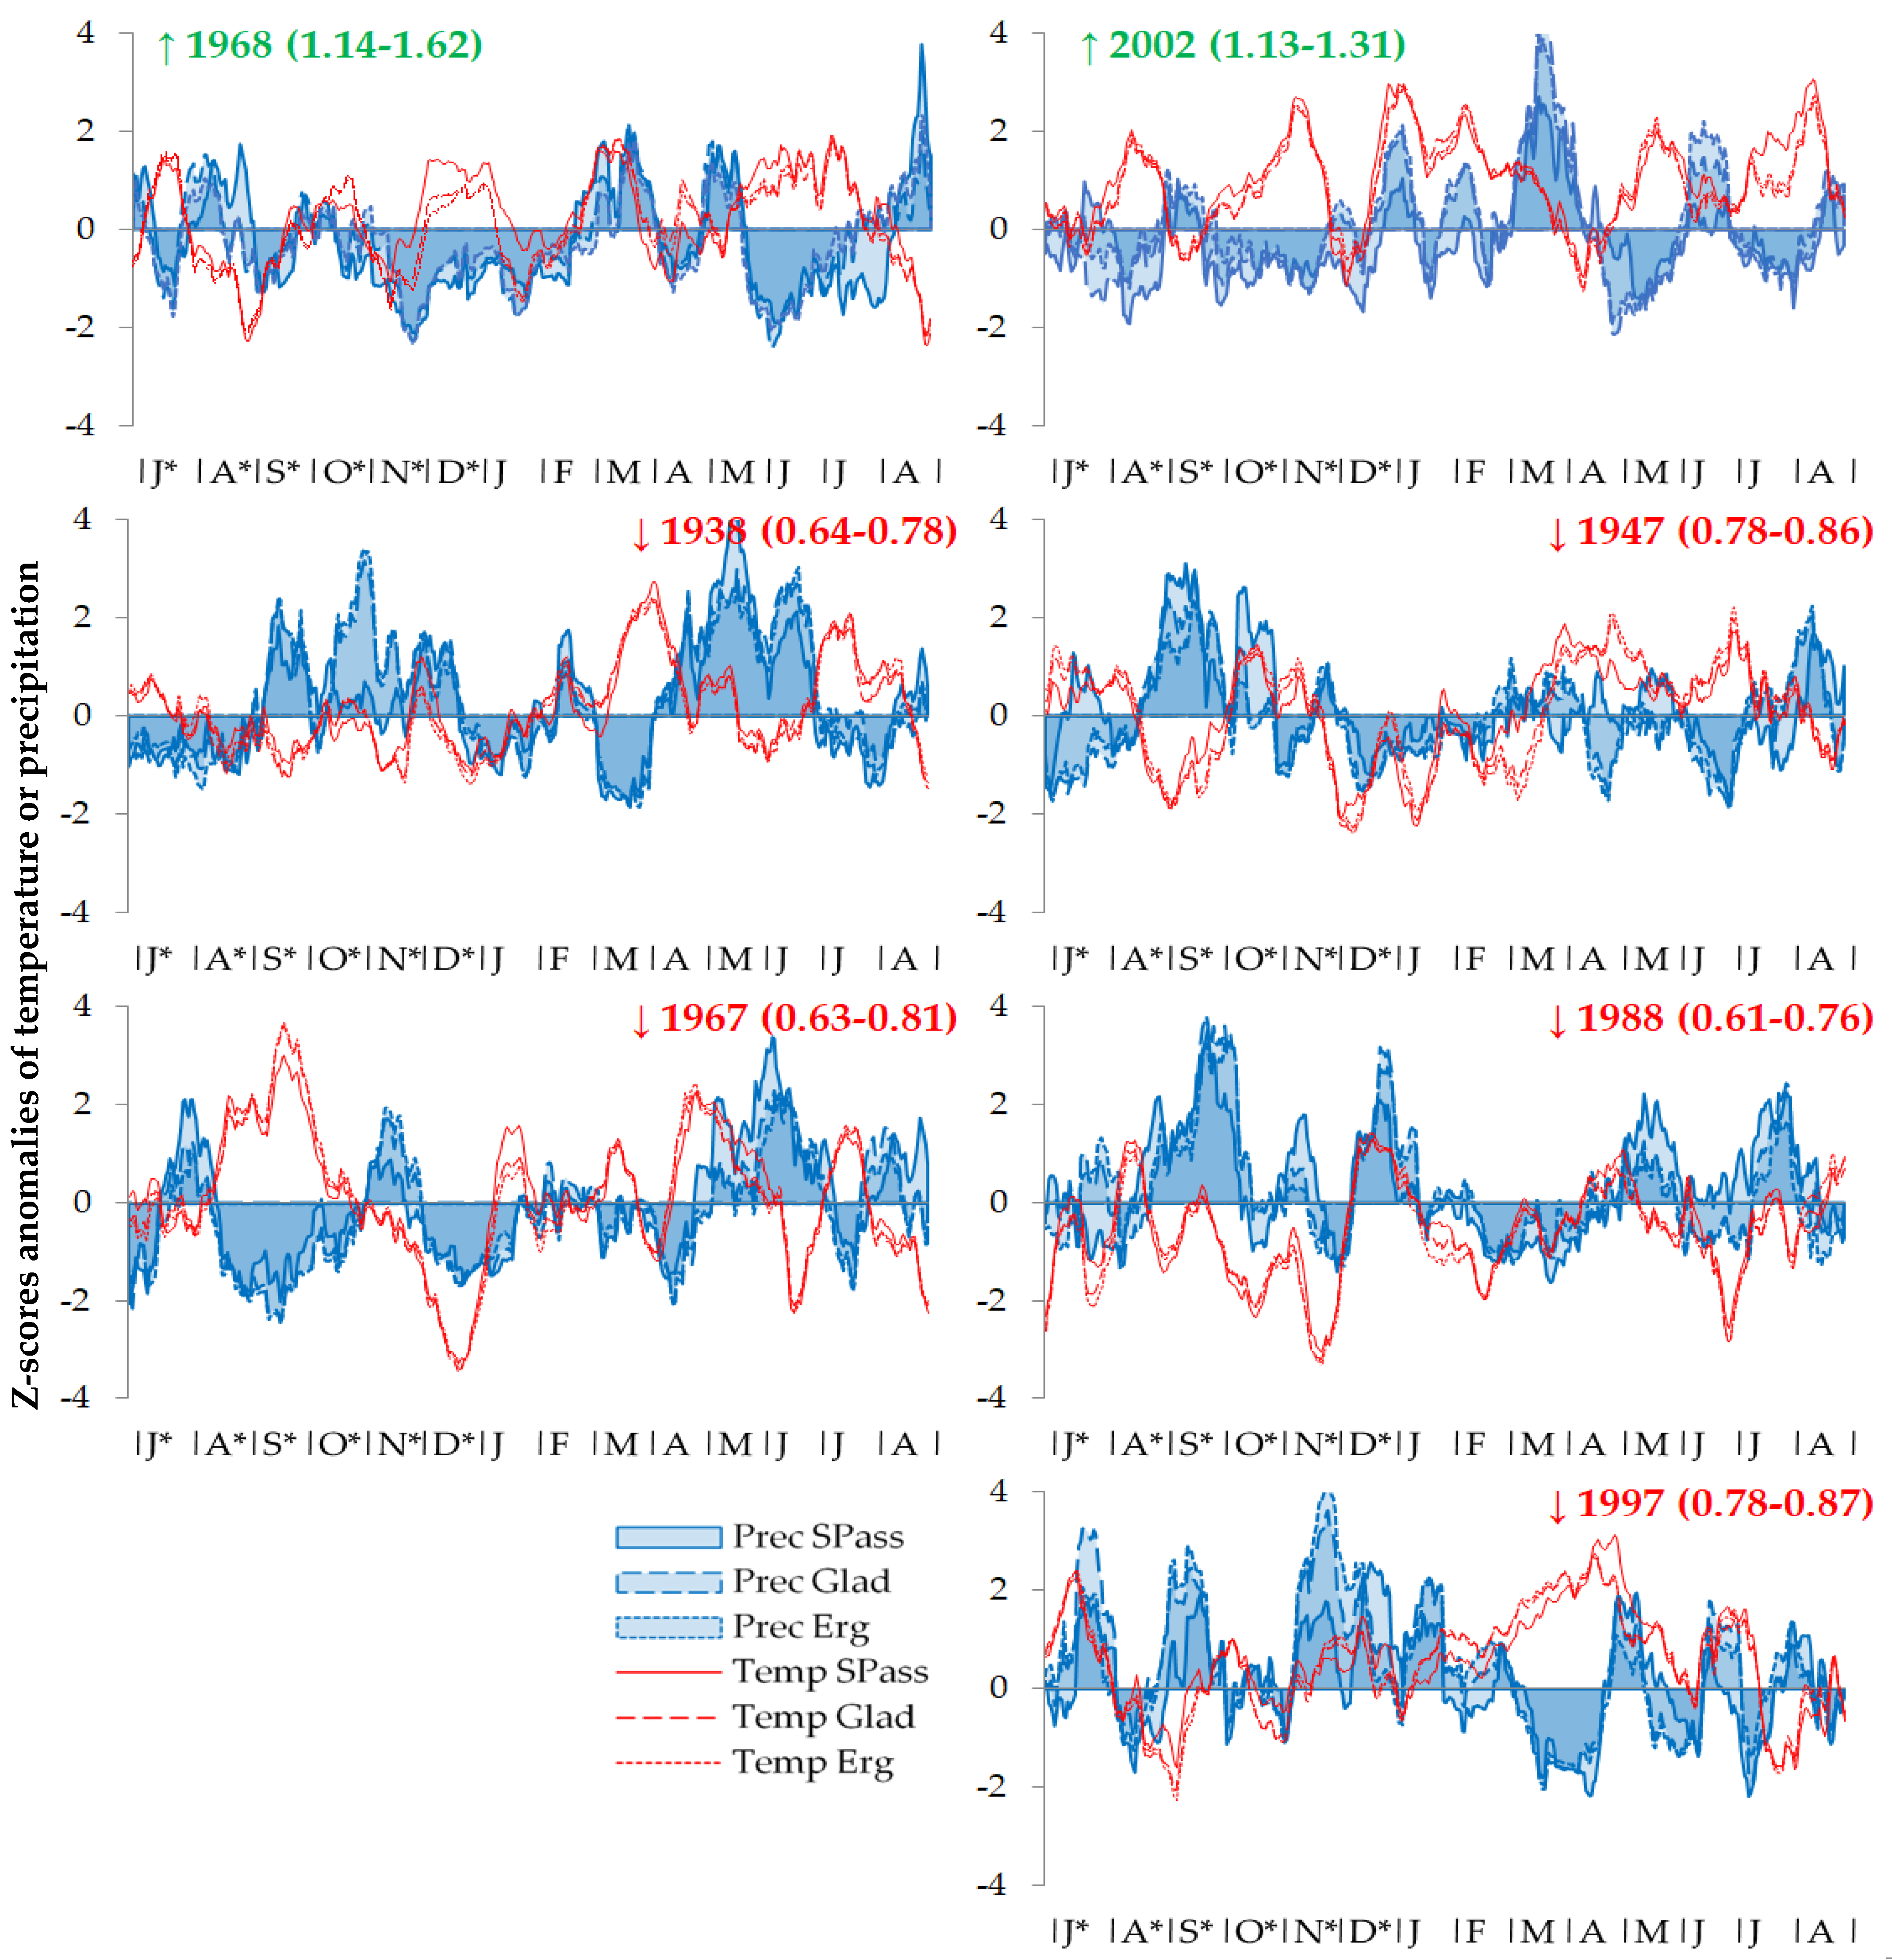
3.1. TRW Chronologies and Their Spatial Coherence

Developed residual local TRW chronologies of P. sibirica (Figure S1) had a length of 231–496 years, while the maximum cambial age exceeded 370 years in all three study areas. After excluding age-related and autocorrelation components, the residual growth variability was low, being in the range of 0.14–0.16 at most sites (Table 1). Its inter-annual component (sensitivity coefficient) was also low (0.15–0.22). Inter-series correlation coefficients were in the range of 0.28–0.51, which is sufficient to develop chronologies containing a common external signal. Correlations between the chronologies of different sites within the same area were r = 0.66–0.84, and those between study areas at distances of 120–270 km were slightly lower: r = 0.57–0.75 (Table 2).
The separation of high- and low-frequency components shows that spatial coherence was preserved in both domains, but was slightly higher in high-frequency domain: correlations between high-frequency components of chronologies are 0.73–0.87 within each sampling area and 0.56–0.78 between areas; correlations between low-frequency ones are 0.60–0.73 and 0.41–0.72 within and between areas, respectively.
It should be noted that correlations between chronologies from different study areas did not lessen with the distance, regardless of the frequency domain. A generalization of relationships between chronologies using cluster analysis showed that the maximum similarity was observed between chronologies from different slopes on Gladenkaya Mt., then between chronologies from the ErgO and ErgV sites of the Ergaki Ridge, while the chronology at the Sayan Pass was most similar to that at the ErgZ site (Figure S2A).

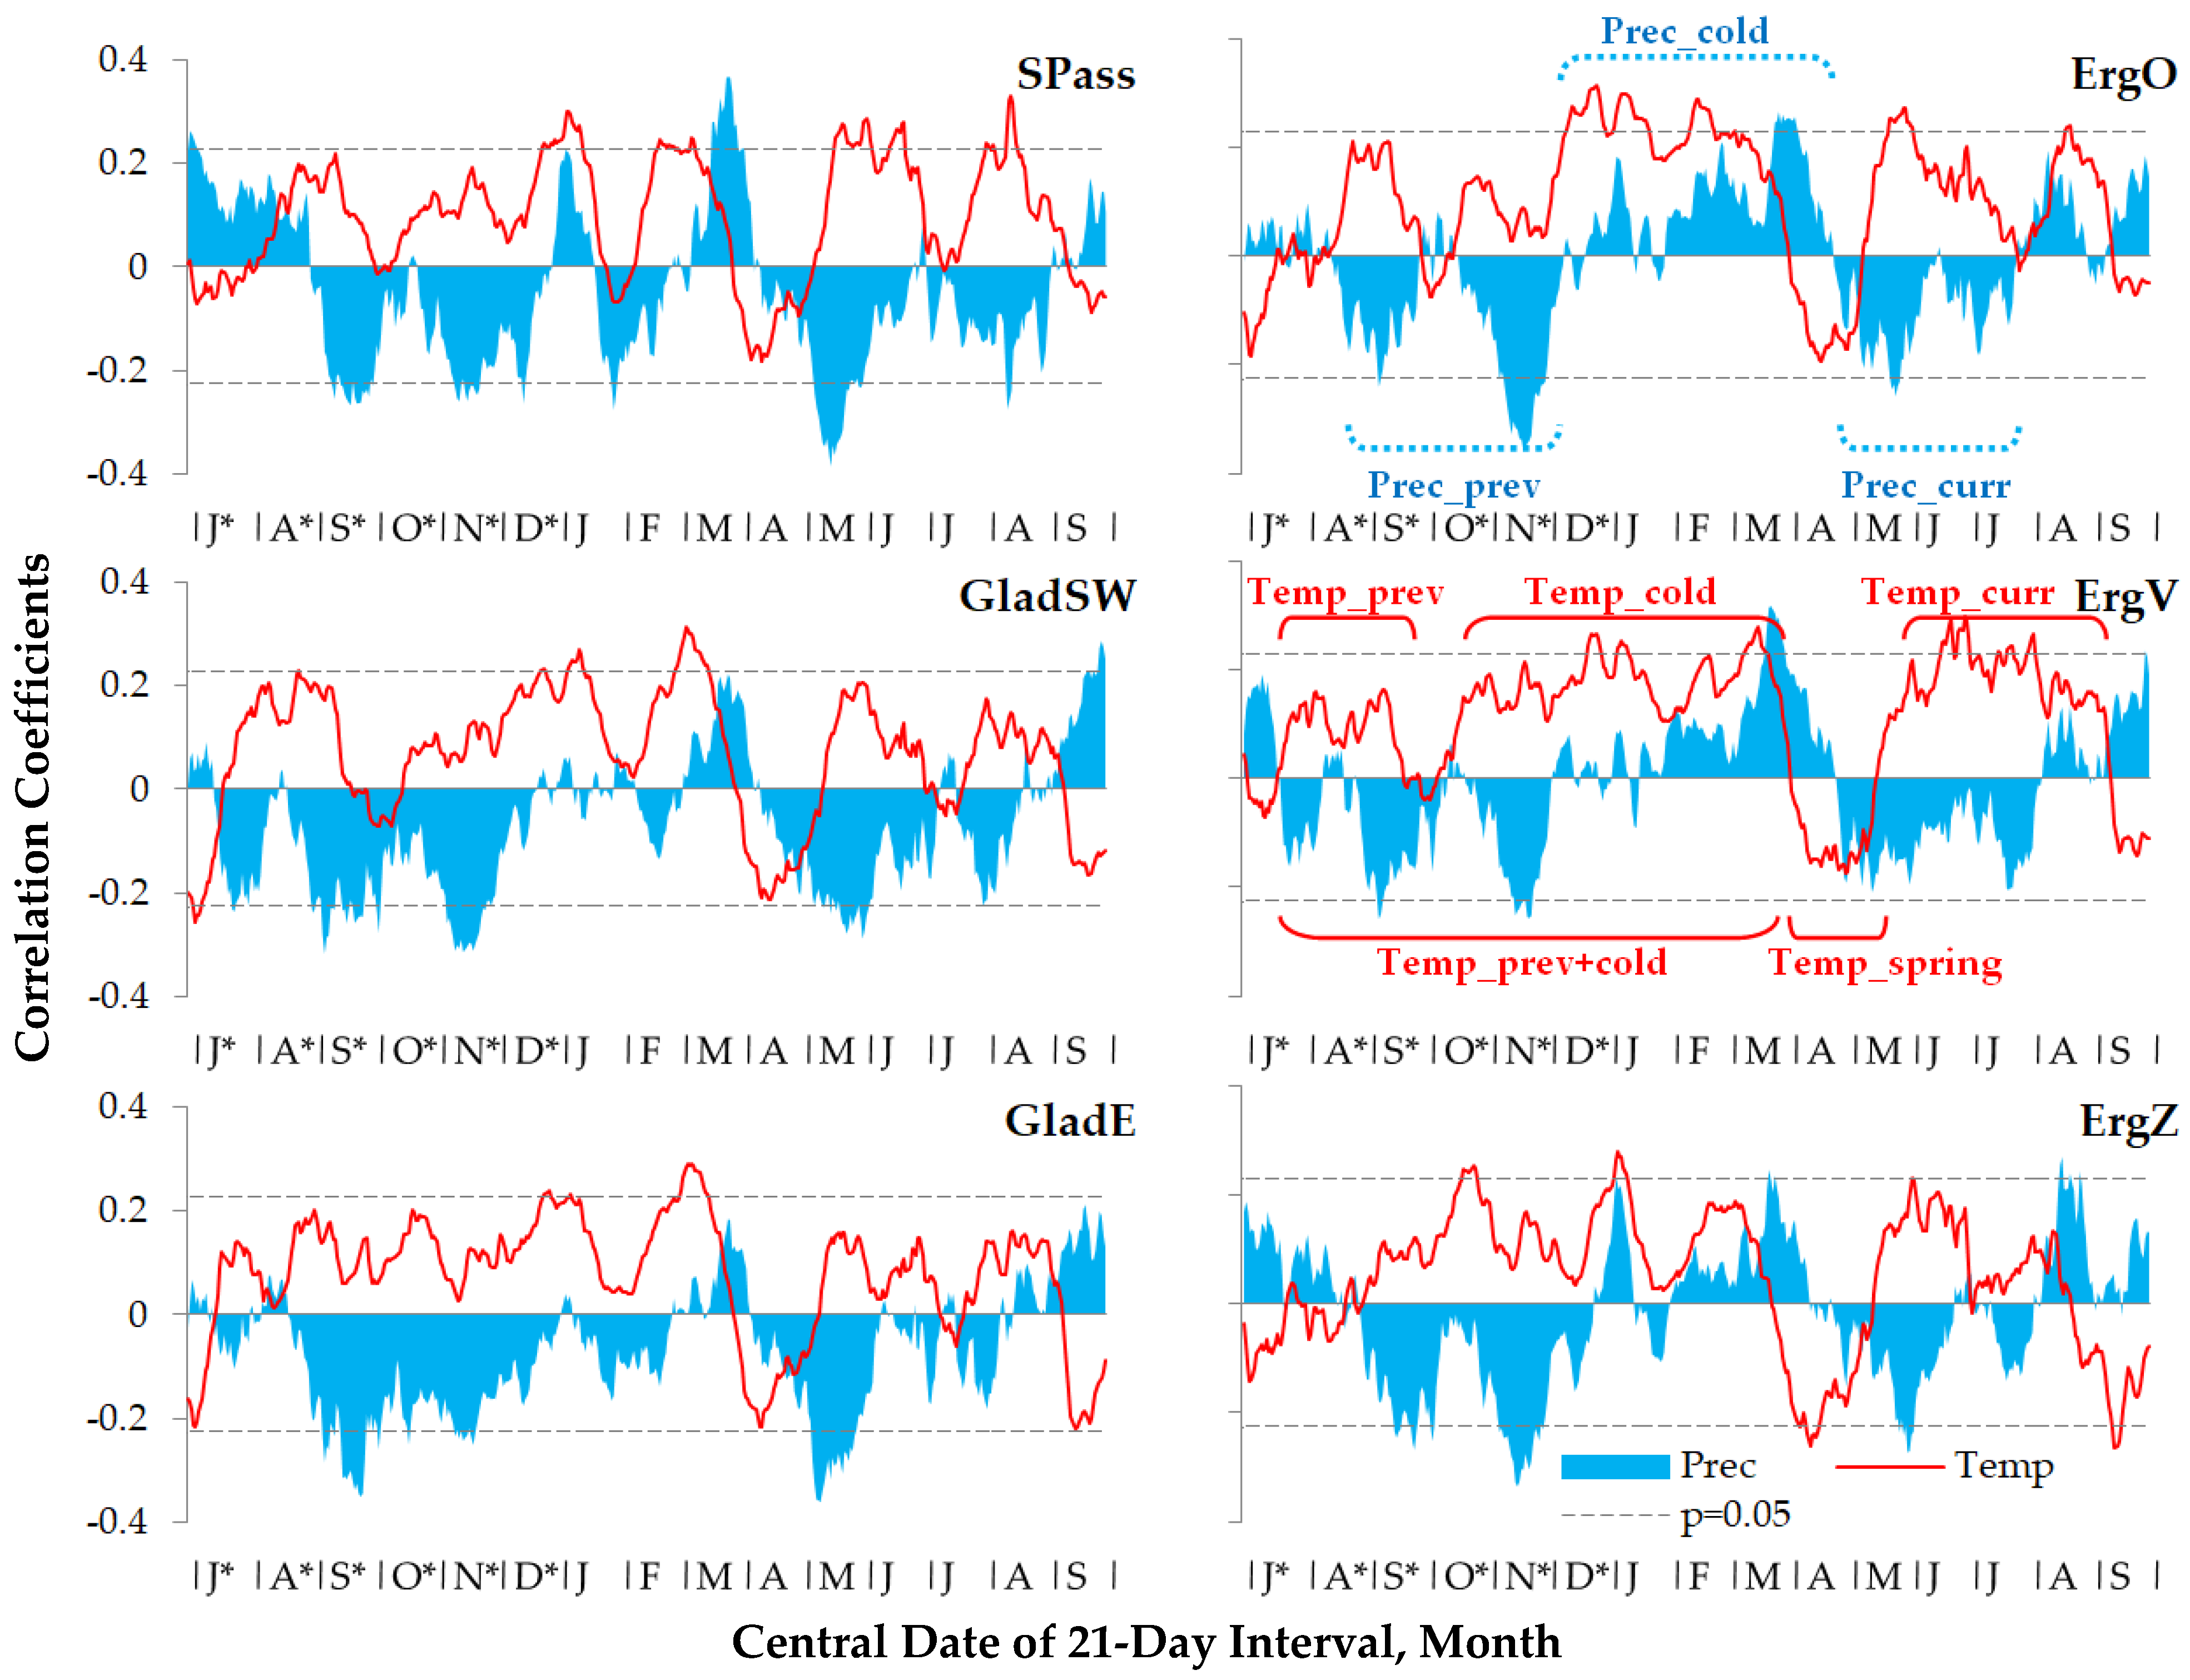
3.2. Climatic Response of Siberian Stone Pine Radial Growth

As shown by the correlation coefficients of local TRW chronologies with 21-day moving temperature and precipitation series (Figure 2), the climatic response of pine radial growth near the upper timberline was relatively weak (|r| < 0.4), but spatially stable in terms of direction. At all six sampling sites, a positive reaction of pine growth to temperatures from the previous July–August to the current August was observed, with the exception of April, when the response was negative. The influence of precipitation was less pronounced, but there were trends towards a negative response to precipitation in the previous year (from August–September to November) and the current vegetation season (May–August), and a positive or neutral response to precipitation from December to April.
The generalization of the climatic response of P. sibirica within the seasonal timeframes is presented in Table 3. The maximum positive effect of temperature on the pine growth was in the range of r = 0.11–0.44 for three intervals (Table 3): the second half of the previous vegetation season (probably, after the end of cambial activity), the cold season, and the current vegetation season. During the previous vegetation season, the temperature impact began on 18 July to 15 August and ended on 11 September to 4 October. The temperatures of the cold season most strongly affected pine growth in the interval from 10 November–12 December to 18–26 March. In the current vegetation season, the maximum impact of temperatures lasted from 12–24 May to 13 August–3 September. The negative impact of early spring temperatures began on 28 March–12 April and ended on 3–11 May, being in the range from −0.17 to −0.25. The most spatially stable and significant at all sites is the effect of the cold season temperature on its own or in combination with the previous vegetation season.
The response to precipitation from the previous season was also significant for all chronologies (from −0.24 to −0.37). The positive impact of winter precipitation was significant only for sites from the Ergaki Ridge (0.25), and was absent at other sites (0.04–0.13). The effect of precipitation of the current vegetation season was more pronounced; it was significant at four sampling sites from all three areas (−0.25 to −0.32), and negative but not significant at the sites ErgO (−0.21) and ErgZ (−0.19). In terms of the response seasonality, the beginning of the negative impact of the previous season’s precipitation between sites varied from 13 July to 8 September. The transition from the negative impact of the previous season’s precipitation to the neutral–positive impact of the winter precipitation varied from 30 November to 25 December, the ending of the influence of winter precipitation varied from 30 March to 20 April. The negative impact of precipitation during the current vegetation season started on 5–28 April and ended on 21 July–28 August. It should be noted that according to the data from the meteostation Olenya Rechka (Ergaki Ridge, 1400 m a.s.l.) located slightly 120–300 m below the sampling sites, precipitation during the vegetation season can reach more than 300 mm per month (with average monthly precipitation 180 and 170 mm in July and August, respectively); the maximum daily rainfall throughout the year also occurs in summer and ranges from 40 to 80 mm.
It should be noted that despite differing intra-seasonal timeframes, the series of temperature and precipitation having the maximum effect on the pine growth usually correlated with each other significantly at p < 0.05 for the previous (from −0.46 to −0.56) and the current (from −0.17 to −0.33) vegetation seasons. In winter, the correlations between temperature and precipitation were positive, but not significant (0.04–0.22).
In terms of the seasonality of climatic response, the similarity between chronologies did not coincide with their spatial distribution, as shown by the results of cluster analysis (Figure S2B). The sampling sites SPass, ErgO, and ErgZ showed a statistically significantly (p < 0.05) earlier onset of the impact of temperature and precipitation during previous vegetation season, than the ErgV, GladSW, and GladE sites. With regards to the intensity of climatic response, the TRW chronologies of the P. sibirica on the Sayan Pass and the Gladenkaya Mt. were more similar (Figure S2C). In contrast to the chronologies from the Ergaki Ridge, they did not have a significant reaction to winter precipitation and had a more pronounced negative reaction to precipitation of the current vegetation season.
The separation of the time series into high-frequency (less than 5 years) and low-frequency (over 5 years) components (Table 3) demonstrated that radial growth of P. sibirica reflects long-term fluctuations in precipitation and temperature of the cold season, as well as the temperature of the vegetation season. The impact of temperatures during early spring and precipitation during vegetative season is expressed mostly in the high-frequency domain.
The temporal dynamics in the climatic response of P. sibirica has common patterns (Figure 3). The TRW responses to the temperatures during vegetation and cold seasons were the most stable. Nevertheless, it is worth noting more pronounced fluctuations in the response to the temperature during current vegetation season, especially at the Gladenkaya Mt. and the ErgZ site. The negative response to the temperature during early spring has intensified in the last two to three decades at four out of six sites across all three study areas. Throughout the region, there was a gradual increase in the response of pine growth to the precipitation of the previous season, but a weakening of the response to the precipitation during current vegetative season. In recent decades, the positive response of pine growth to winter precipitation in the Sayan Pass and the Ergaki Ridge has also begun to increase.
During the cover period 1936–2010 of the climatic series, seven pointer years were identified with a deviation of the P. sibirica growth indices at all six sampling sites beyond the range of mean ± SD: two years with the fast growth (1968 and 2002) and five years with the slow growth (1938, 1947, 1967, 1988, and 1997) (Figure 4). An analysis of the climatic dynamics throughout the Western Sayan Mts. for these years showed significant differences in temperatures and precipitation from the long-term average curves (presented in Figure 1B), with some short intervals even exceeding 3·SD. Years with fast pine growth are characterized by relatively warm winters, warm and dry vegetation seasons, and early spring conditions close to the long-term average. For 2002, warm and dry conditions were also recorded in August and autumn of the previous year. The suppression of pine growth on a regional scale was associated with a variety of climatic deviations. In 1938, a very high amount of precipitation was observed at the end of the previous vegetation season and first half of the current one, as well as high early spring temperatures. The year 1947 was characterized by cold and a wet previous August–September, frosty winter, and warm April, despite warm and dry conditions of the vegetation season. In 1967, the favorable end of the previous vegetation season was followed by severe frosts in December; high temperatures were also observed in the second half of April, and a large amount of precipitation occurred in May–June. Cold and wet conditions of the previous autumn and the current May–July were recorded in 1988. In 1997, the second half of the previous vegetation season was wet, aggravated by a cold August–September and warm April against the background of low precipitation, although the winter was snowy and warm.
Figure 3. Temporal stability of the P. sibirica climatic response: 30 year moving correlations between residual TRW chronologies and series of temperature (left column) and precipitation (right column) over respective intra-seasonal intervals (see Table 3; prev, second part of previous vegetation season; cold, cold season; spring, early spring season; curr, first part of current vegetation season). Significance level p = 0.05 for 30-year interval is depicted by the horizontal dashed lines.
Forests 13 01994 g003
Figure 4. Weather during pointer years for P. sibirica: relative deviations of a 21-day window with 1-day step temperature (Temp, red lines) and precipitation (Prec, blue areas) series from average values over the 1936–2010 period calculated from the Z-scores (mean = 0, SD = 1) over a period from previous July to current August for years when TRW > mean + SD (positive pointer years, marked with up arrow ‘↑’) or TRW < meanSD (negative pointer years, marked with down arrow ‘↓’) in res chronologies from all six sampling sites. Numbers in brackets after each year are ranges of the res TRW indexes.
Forests 13 01994 g004

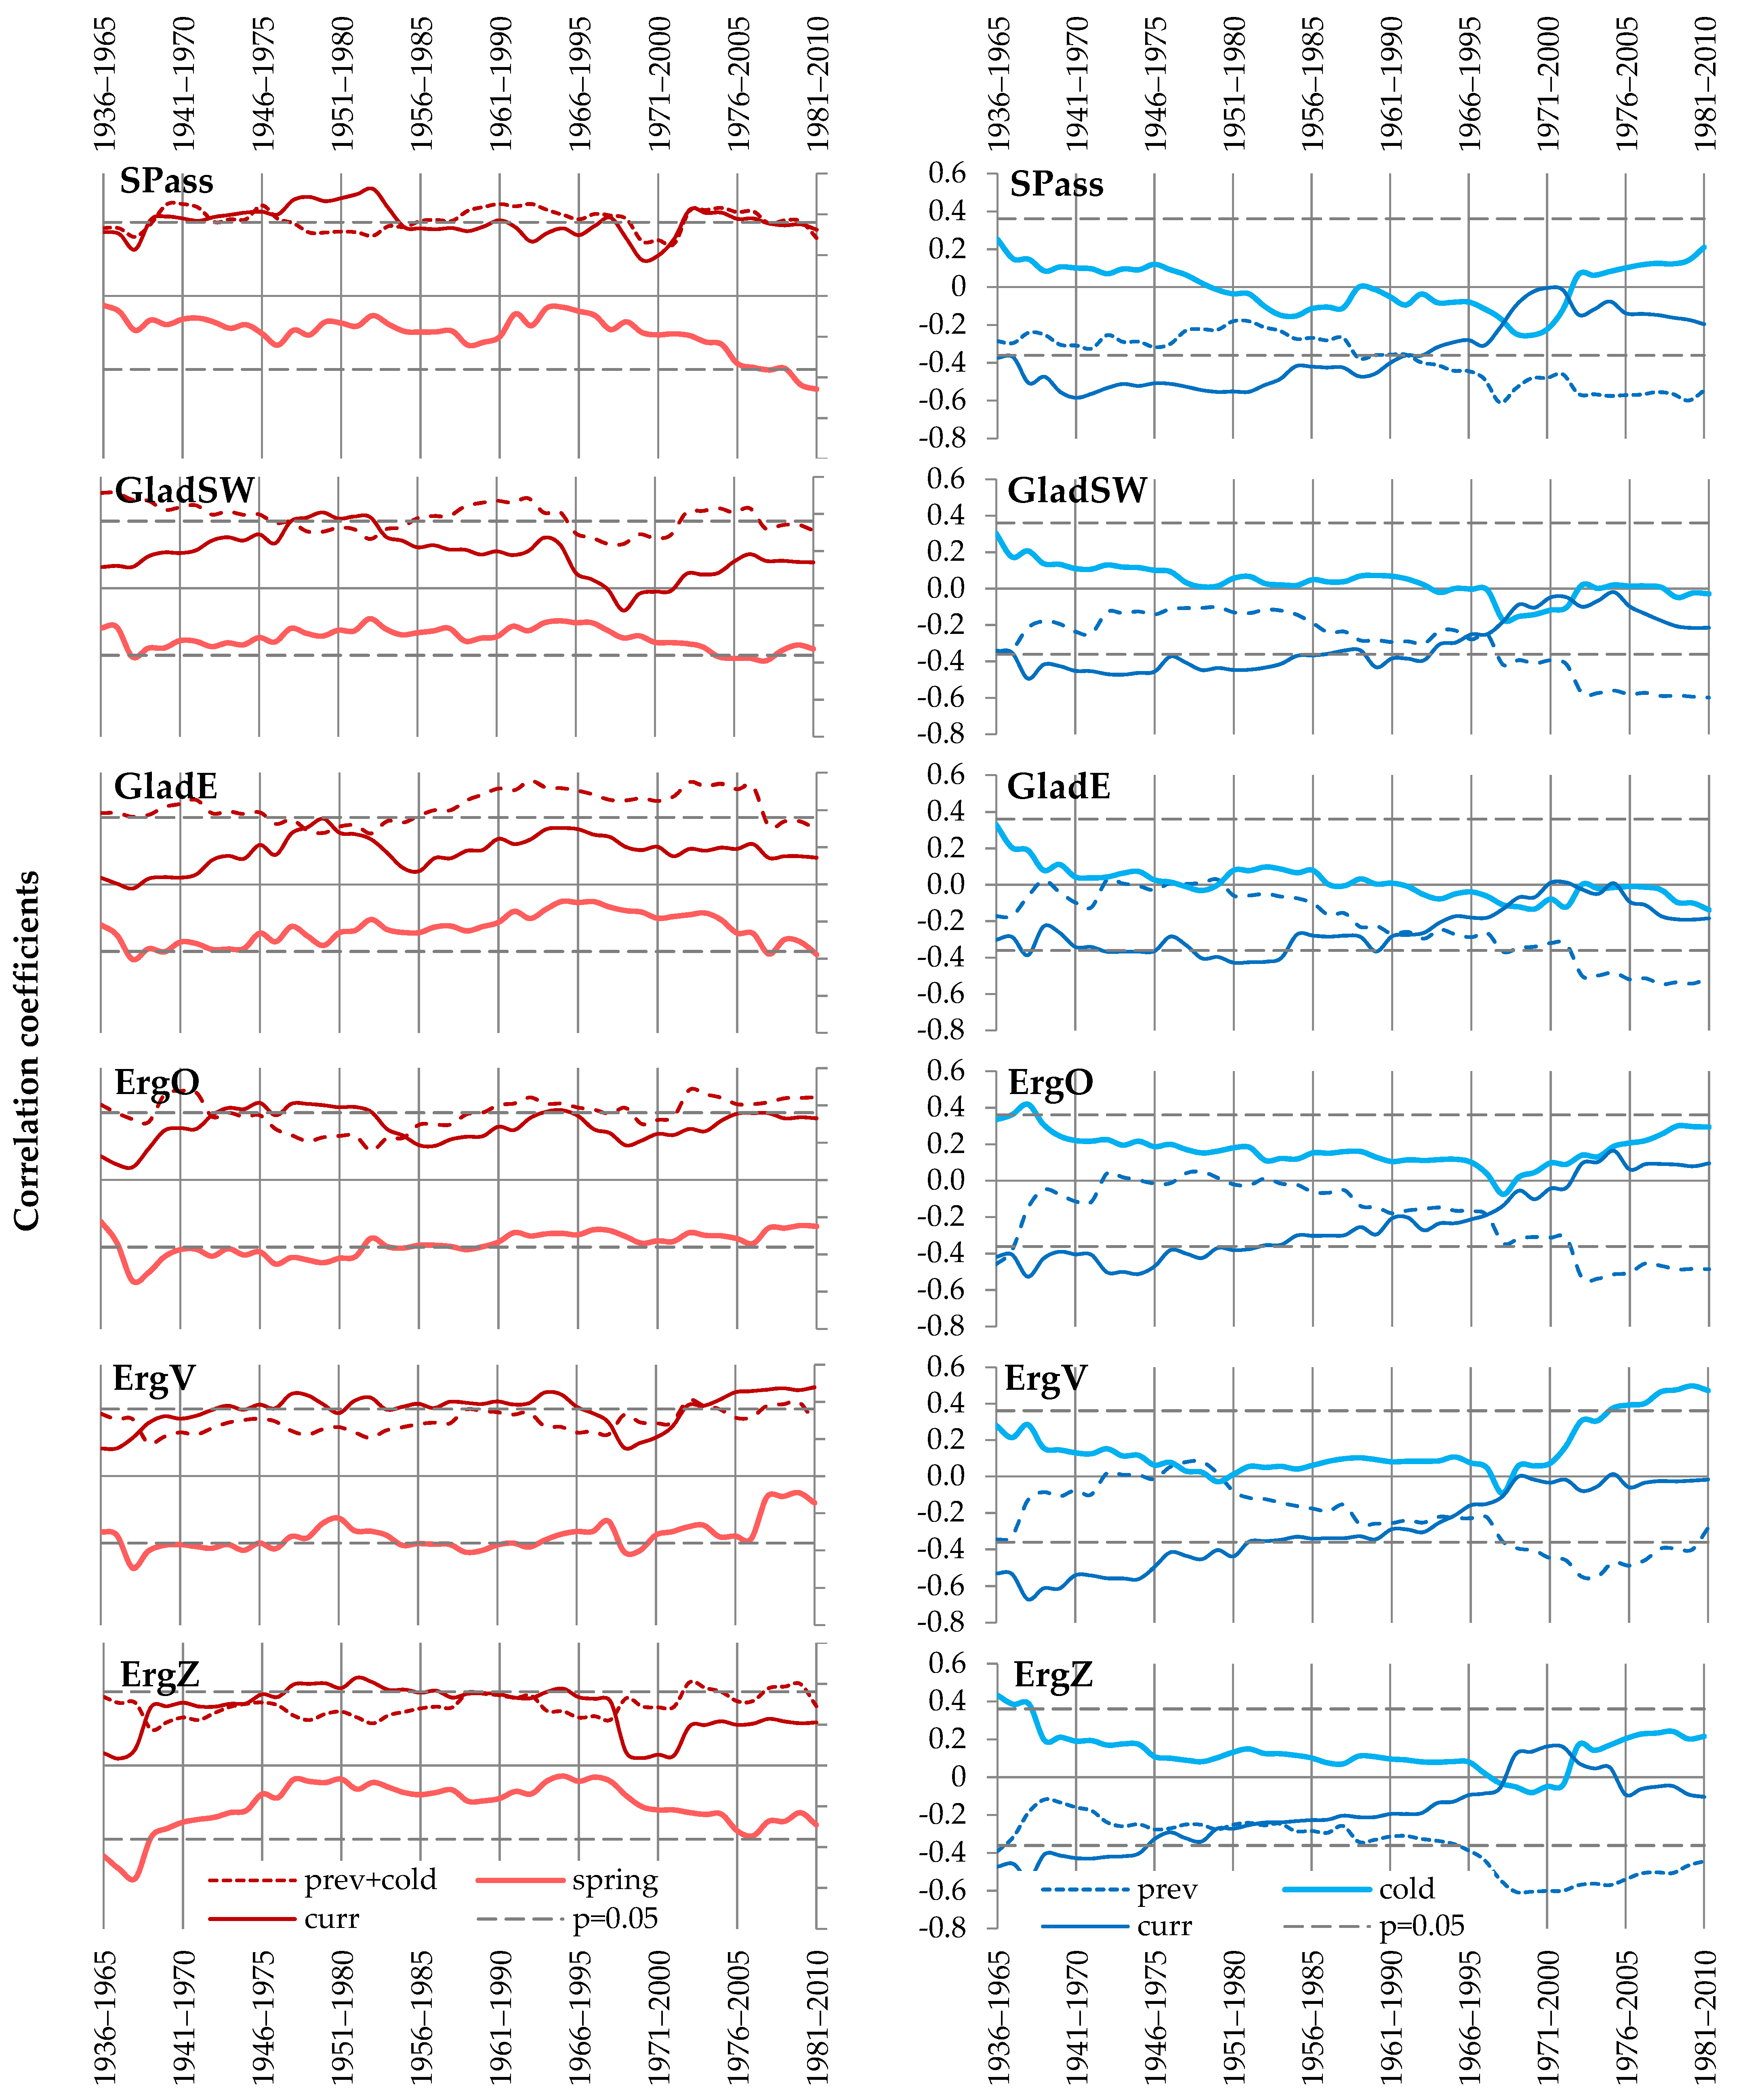
3.3. Age-Related Patterns of Siberian Stone Pine Growth Dynamics and Its Climatic Response

At the SPass site, the sample size was sufficient to obtain representative TRW chronologies (16–19 trees, 21–38 cores) for three different age categories (Table 1): young trees up to 100 years old, middle-aged trees of 101–200 years old, and old trees of more than 200 years old. All ages were calculated in 2010 (end of climate series coverage). The coherency of tree growth within each age category (r-bar = 0.35–0.41) was higher than for the total local sample (0.30). Growth variability and its inter-annual component were maximum for middle-aged trees, and minimum for young trees. Correlations between these three chronologies were all significant, but the chronology of young trees more differed from others, having correlations of 0.61 with chronology of middle-aged trees, 0.69 with chronology of old trees, and 0.81 with the total sample chronology. Middle-aged and old trees had more similar growth dynamics among themselves (0.84) and with the total sample (0.93 and 0.92, respectively).
The climatic responses of all three age categories coincided in terms of direction (positive or negative), but their intensities were different (Figure 5). With age, the positive response of pine growth to the temperatures in October–January weakened, while the response to the temperatures in the end of winter, spring and the vegetation seasons (both previous and current) intensified. The negative response of the growth to the precipitation in the previous autumn and the current vegetation season was more pronounced in middle-aged and especially in old trees compared to young ones. The response to winter precipitation was generally unstable at this sampling site. Finally, the curve of climatic response for the middle-aged trees was closest to the response of the total sample.

4. Discussion

4.1. Developed TRW Chronologies, Their Characteristics and Spatial Patterns

The low variability observed for the obtained TRW chronologies, including the inter-annual component (sensitivity coefficient), is typical for P. sibirica and closely related Strobus pines [31,37,39,80,81]. This limitation, on the one hand, may be related to the common ecophysiological characteristics of dark-needle conifers. For example, low TRW sensitivity in the subalpine zone was also recorded for spruce and fir [82,83]. On the other hand, higher variability and sensitivity of radial growth were observed for P. sibirica and Picea schrenkiana in semiarid conditions, being similar to ones of light-needle Pinus sylvestris and Larix sibirica [31,84,85]. Therefore, it can be assumed that the low inter-annual variability in the growth of P. sibirica in the study region reflects the physiological strategy of the slow accumulation and expenditure of resources under cold conditions [35,36]. This is consistent with the noted competitive advantage of the P. sibirica in the mesic and humid mountain forests of Siberia [4,22,86].
The high spatial coherence of the TRW chronologies across several hundred kilometers indicates the presence of a common external signal in them, probably due to the temperature, as the most spatially synchronous environmental factor. A high similarity between chronologies of P. sibirica at distance of about 100 km was also observed in Central Altai [87]. It is notable that the large-scale coherence of growth observed for P. sibirica in the Altai–Sayan Mountain complex is substantially higher than for P. cembra and several other conifers near timberline in European Alps [88,89]. Since the network of chronologies in the Alps proved to be a successful climate proxy, this gives us a hope for the applicability of the P. sibirica chronologies obtained in this study for similar purposes. Close correlations between neighboring chronologies despite varying local conditions indicate a sufficient commonality of pine climatic response within the framework of the forest stands on the sunlit slopes near the upper timberline.
Figure 5. Climatic response of P. sibirica trees at the SPass sampling site for various ages: correlations between 21-day temperature (Temp, red) and precipitation (Prec, blue) series (1936–2010) and residual chronologies of young (SPassY, dashed color line), middle-aged (SPassM, solid color line), and old (SPassO, solid black line) tree groups, and total sample (SPass, shaded area). Asterisks mark months of previous year. Dashed thin horizontal lines represent significance level p = 0.05.
Forests 13 01994 g005

4.2. Influence of Climatic Factors on the Radial Growth of Siberian Stone Pine

For high-mountain forest stands of stone pines, correlations of TRW chronologies with monthly temperatures and precipitation barely reach the threshold of significance. This concerns not only P. sibirica in the Altai–Sayan Mountain complex [30,31], but also P. koraiensis in northeastern China [5,38] and P. cembra in the Alps [55]. Other possible drawbacks of using monthly climatic data are the discrepancy between the actual seasonality of the response with boundaries of calendar months, as well as modification of the climatic response by diverse local conditions in mountains [90,91,92]. Therefore, for a more detailed analysis and comparison of climatic reactions in the growth of P. sibirica from six sites, it was proposed here to use a moving 21-day series of temperature and precipitation. It allowed us to estimate the start and ending dates for each consequent reaction of tree-ring chronology to the particular climatic factor, resulting in the intervals of the maximum influence of this factor with a daily accuracy.
Positive correlations with temperatures for most of the year are consistent with the observed coherence between growth dynamics of P. sibirica and average annual temperature from August to July observed on the timberline in Mongolia [29,93]. Similar to those works, pine tree rings in the current study also register long-term temperature fluctuations better than short-term ones. During the period of active wood development, warm conditions promote allocation of photosynthesized carbohydrates, including growth processes [13,94,95]. Later, in August–September, heat has a positive effect on the amount of nutrients stored for the next season, on the maturation of cuticles and formation of cold hardiness in needles and buds [96,97,98]. Positive correlations with temperature during winter dormancy (and severe frosts in some pointer years) may indicate tissue damage by freezing, which leads to subsequent consumption of nutrient reserves for reparation of injuries and a decrease in the efficiency of damaged tissues and organs [13,15]. The negative reaction to the temperatures at the end of winter and early spring in this and other dark-needle evergreen conifers is usually explained by damage to the needles and water-conducting tissues. This phenomenon occurs when photosynthetic activity is intensified by warmed air and overheating of the needles, but water uptake by roots is low in the frozen soil before the snowmelt (frost-drought effect [98,99]). In addition, the early start of the warm season is fraught with the return of cold weather and damage to activated tissues that have lost cold hardiness [100].
The negative impact of precipitation during the vegetation season (both of the current and the previous year) may be due to negative relationship between precipitation and temperature through a decreased insolation on rainy days and cooling of surfaces by subsequent evaporation, as well as due to a decrease in transpiration by waterlogging during heavy rains [101,102]. Some researchers also explain the negative effect of precipitation on the growth of dark-needle conifers in taiga by acid rain [27,103], but this hypothesis has not been proven for the Western Sayan Mts. territory. In October–November, when air temperatures fluctuate around 0 °C, the balance of temperature and precipitation, and their impact on the health and subsequent growth of P. sibirica are especially delicate. On the one hand, freeze–thaw cycles can damage immature tissues, especially if the vegetation season was too short [97,98]. On the other hand, high moisture at the beginning of soil freezing negatively affects the condition of fine roots [104]. This may explain the negative effect of precipitation and the lack of a positive effect of temperature during this period. The positive effect of winter precipitation after the establishment of a stable snow cover in cold climate can be explained by the heat-insulating properties of snow [105]. However, this positive effect may be more or less counterbalanced, since deep snow cover in spring delays soil thawing and the start of active vegetation [106,107,108], exacerbating the frost-drought effect. The importance of this last factor for pine growth is emphasized by the high temperatures in April observed in the region for most of negative pointer years.

4.3. Spatiotemporal Stability of the Climate Response

A significant positive effect of snow cover on pine growth was observed everywhere on the Ergaki Ridge, but was absent on the Gladenkaya Mt. and the Sayansky Pass. Such a spatial distribution shows that this impact does not depend on the local conditions (soil-landscape complex, understory vegetation, closeness to water bodies), but is rather associated with meso-scale conditions. As seen on the topographic inset maps in Figure 1, landscape of the Ergaki Ridge is more dissected compared to other two areas, which can affect the local spatial patterns of snow fall and transport [109,110]. The reverse pattern for precipitation during vegetation season (weaker response on the Ergaki Ridge) does not contradict this hypothesis, since the circulation regime and wind field patterns can differ significantly between warm and cold seasons [111]. Another factor that takes into account the large-scale spatial differences in the response to precipitation for both seasons is the influence of westerlies, prevailing in the region [112], whose gradual moisture loss along the Western Sayan Mts. can provide longitudinal gradient of precipitation. As a result, the amount of precipitation at the elevation of the upper timberline may be closer to the optimum for P. sibirica on the Ergaki Ridge.
All sampling sites are located near the upper timberline, which is primarily determined by the limitation of temperature during the vegetation season [15,113]. In fact, the sites were selected according to the maximum elevation where Siberian stone pine trees over 200 years old are found. Taking into account the modern advance of the forest up the slope, such a site location approximately corresponds to the historical position of the timberline. A similar location relative to the timberline, representing trees of the same P. sibirica provenance, and common seasonal climatic dynamics along the Western Sayan Mts. means that the actual heat supply (sum of active temperatures) is probably similar at all sites. Indeed, the higher elevation of the sampling site at the Sayan Pass probably compensates for the latitudinal temperature gradient, while the sites in two other areas at the same latitude are located in a narrower range of elevations. This explains why differences in the seasonality of climatic response do not represent any gradient between areas or elevations. Significant differences between two clusters of chronologies in the beginning dates of exposure to the conditions of the previous season may be associated with the moisture regime, since near-lake ErgO and ErgZ sites are grouped with the SPass, where abundant thick moss cover indicates higher humidity. Since temperature and precipitation during the warm season are negatively correlated for the study region, humidity may be associated with lower local temperatures, and hence with a later ending of cambial activity and subsequent shift of the climatic signal registration to the next ring.
Taking into account the stable threshold temperature for conifer xylogenesis in cold climates revealed by Rossi et al. [77,78], the relationship of the xylogenesis phenology primarily with temperature in the study region is undoubted. A severe lack of precipitation could directly delay the onset or accelerate the completion of tree ring formation even in the subalpine zone (for example, on the Tibetan Plateau [114,115]). However, in much more humid conditions of the study region, on the contrary, impact of the excessive precipitation on the seasonal kinetics of xylogenesis can be expected, especially during the seasonal maximum of rain in July–August. We assume here indirect mechanisms of the precipitation’s impact, which manifest through a decrease in temperatures.
Over the past decades, the most significant climate change in the study region has been a temperature increase in the cold season ([116,117,118], Figure S3), so we can expect a shift in the onset of xylogenesis to earlier dates. It means that the maximal radial growth rate, occurring in the first half of the vegetation season, has gradually shifted to interval with less precipitation. This phenological shift also increased the duration of the period from the onset of xylogenesis to the summer solstice, when the processes of slowing and cessation of primary and secondary growth are initiated [119,120,121]. Increased length of this period means a higher sum of active temperatures, less stressful for tree growth. Alterations of both heat supply and humidity of current vegetation season to more favorable values comprise a possible reason for their decreasing influence on the tree growth. On the other hand, the combination of xylogenesis shifted to earlier dates and a later temperature drop in autumn increases the duration of the interval used by trees for nutrient storage, which may be the reason for the increased exposition to precipitation from this period as a factor limiting pine growth.

4.4. Age-Related Patterns of Climate Response

Published data about age impact on the climate sensitivity of trees are ambiguous. Many researchers have provided evidence of climatic response and sensitivity to stress events strengthening with age in trees of various species and in natural zones from semiarid to boreal [47,48,51,122,123,124]. However, there are some observations of a more pronounced climatic response in younger trees [49,50] and even statements about the same climatic signal for trees of different ages [46]. Apparently, this is a sufficiently complex phenomenon to be investigated at the scale of particular species and environments. The situation is also complicated by the non-linear age dynamics of tree allometry. An increase in tree height (and hydraulic resistance) and the development of crown and root systems occur rapidly in young trees, but then gradually slow down in mature trees [45,125]. Later, various damages can even decrease sizes of tree parts. Thus, non-linear dynamics is also possible for variability of tree-ring chronologies and the intensity of their climatic response, which can be overlooked when comparing only two age groups. The maximum of the variability statistics observed in this study for the middle-age trees probably can be associated with the allometric parameters of trees.
The directions of differences between age groups in the climatic response intensity observed for P. sibirica in the study region vary depending on the season. However, they all still can be related to the increase in tree size. Increasing the sensitivity of tree growth to the precipitation and temperature of the vegetation season may be associated with the tree reaching its maximum height but with a continuing increase in respiration costs (maintaining the growing crown and root system). An increase in both temperature and precipitation during the vegetation season probably leads to balanced impacts of these trends on the pine growth in the long term.
On the contrary, trees that have not reached the century age are more sensitive to winter conditions. Observations of frost damage to shoots and xylem and of the winter frost effect on radial growth indicate a greater vulnerability of young trees due to thinner bark (protective layer) and the smaller storage of nutrients for recovery after damage [100,126,127]. In this light, the increasing winter temperature of the study region is advantageous to the survival of seedlings and young trees, as is supported by observed advance of pines upward.

5. Conclusions

Analysis of correlations between the short-term (21-day) moving climatic series and tree-ring chronologies allowed us to reveal complex climatic signals in the radial growth of P. sibirica near the upper timberline. We found spatial coherency in the dynamics of the pine growth and the direction of climatic response along the Western Sayan Mts. However, seasonality and intensity of maximal dendroclimatic reactions are modified by habitat diversity and the longitudinal gradient of precipitation along the mountain system. Age-related shifts in climatic sensitivity led to the positive impact of winter warming predominantly on the young trees, while the impact of climate change on the mature trees is more balanced. Under continuing warming, we expect further upward shift of the species distribution and stable growth of existing subalpine forests of P. sibirica in the Western Sayan Mts.

Supplementary Materials

The following supporting information can be downloaded at: https://www.mdpi.com/article/10.3390/f13121994/s1, Figure S1: Tree-ring width of P. sibirica; Figure S2: Hierarchical classification of local residual TRW chronologies; Figure S3: Long-term dynamics of seasonal climatic factors aggregated from respective grid cell series of ERA-20C daily field (1936–2010) according to the calendar dates in Table 3 for the SPass, GladE, and ErgZ sampling sites.

Author Contributions

Conceptualization, D.F.Z.; methodology, D.F.Z. and L.V.B.; validation, K.V.K. and E.A.V.; formal analysis, L.V.B.; investigation, D.F.Z. and Y.A.K.; resources, D.F.Z. and E.A.B.; data curation, Y.A.K.; writing—original draft preparation, all authors; writing—review and editing, L.V.B. and K.V.K.; visualization, L.V.B.; supervision, E.A.B.; project administration, K.V.K. and E.A.V.; funding acquisition, K.V.K. All authors have read and agreed to the published version of the manuscript.

Funding

This research was funded by the Russian Science Foundation grant number 22-14-00083.

Data Availability Statement

The data presented in this study are available on request from the corresponding author.

Acknowledgments

The authors are grateful to the administration of the Natural Park “Ergaki” for granting permission to conduct research in the protected area and for their assistance in conducting field works. We thank two anonymous reviewers for their very valuable comments and recommendations that greatly helped us improve the manuscript.

Conflicts of Interest

The authors declare no conflict of interest. The funder had no role in the design of the study; in the collection, analyses, or interpretation of data; in the writing of the manuscript, or in the decision to publish the results.

References

  1. White, A.; Cannell, M.G.; Friend, A.D. CO2 stabilization, climate change and the terrestrial carbon sink. Glob. Chang. Biol. 2000, 6, 817–833. [Google Scholar] [CrossRef]
  2. Menzel, A.; Sparks, T.H.; Estrella, N.; Koch, E.; Aasa, A.; Ahas, R.; Alm-Kübler, K.; Bissolli, P.; Braslavská, O.; Briede, A.; et al. European phenological response to climate change matches the warming pattern. Glob. Chang. Biol. 2006, 12, 1969–1976. [Google Scholar] [CrossRef]
  3. Parilova, T.A.; Kastrikin, V.A.; Bondar’, E.A. Longterm trends in phenological events under influence of climate change: A case study for the Khingansky State Nature Reserve in the Lower Amur Region. In Climate Change Impact on Ecosystems of the Amur River Basin; Darman, Y.A., Kokorin, A.O., Minin, A.A., Eds.; WWF˗Russia: Moscow, Russia, 2006; pp. 47–51. (In Russian) [Google Scholar]
  4. Kharuk, V.I.; Ranson, K.J.; Im, S.T.; Dvinskaya, M.L. Response of Pinus sibirica and Larix sibirica to climate change in southern Siberian alpine forest–tundra ecotone. Scand. J. For. Res. 2009, 24, 130–139. [Google Scholar] [CrossRef]
  5. Li, G.Q.; Bai, F.; Sang, W.G. Different responses of radial growth to climate warming in Pinus koraiensis and Picea jezoensis var. komarovii at their upper elevational limits in Changbai Mountain, China. Chin. J. Plant. Ecol. 2011, 35, 500–511. [Google Scholar] [CrossRef]
  6. Lett, S.; Dorrepaal, E. Global drivers of tree seedling establishment at alpine treelines in a changing climate. Funct. Ecol. 2018, 32, 1666–1680. [Google Scholar] [CrossRef] [Green Version]
  7. Lindner, M.; Maroschek, M.; Netherer, S.; Kremer, A.; Barbati, A.; Garcia-Gonzalo, J.; Seidl, R.; Delzon, S.; Cornona, P.; Kolström, M.; et al. Climate change impacts, adaptive capacity, and vulnerability of European forest ecosystems. For. Ecol. Manag. 2010, 259, 698–709. [Google Scholar] [CrossRef]
  8. Parks, C.G.; Bernier, P. Adaptation of forests and forest management to changing climate with emphasis on forest health: A review of science, policies and practices. For. Ecol. Manag. 2010, 259, 657–659. [Google Scholar] [CrossRef]
  9. Schimel, D.S. Drylands in the earth system. Science 2010, 327, 418–419. [Google Scholar] [CrossRef]
  10. Gamfeldt, L.; Snäll, T.; Bagchi, R.; Jonsson, M.; Gustafsson, L.; Kjellander, P.; Ruiz-Jaen, M.C.; Fröberg, M.; Stendahl, J.; Philipson, C.D.; et al. Higher levels of multiple ecosystem services are found in forests with more tree species. Nat. Comm. 2013, 4, 1340. [Google Scholar] [CrossRef] [Green Version]
  11. Morin, X.; Fahse, L.; Jactel, H.; Scherer-Lorenzen, M.; García-Valdés, R.; Bugmann, H. Long-term response of forest productivity to climate change is mostly driven by change in tree species composition. Sci. Rep. 2018, 8, 5627. [Google Scholar] [CrossRef]
  12. Körner, C. Alpine Plant Life: Functional Plant Ecology of High Mountain Ecosystems; Springer: Berlin, Germany, 2003. [Google Scholar] [CrossRef]
  13. Körner, C. Alpine Treelines: Functional Ecology of the Global High Elevation Tree Limits; Springer: Berlin, Germany, 2012. [Google Scholar]
  14. Bocharov, A.Y. Climatogenetic radial growth of conifers in the upper forest belt of the Seminsky range (the Central Altai Mountains). J. Sib. Fed. Univ. Biol. 2009, 2, 30–37. (In Russian) [Google Scholar]
  15. Holtmeier, F.K. Mountain Timberlines—Ecology, Patchiness, and Dynamics; Springer: Dordrecht, The Netherlands, 2009. [Google Scholar] [CrossRef] [Green Version]
  16. Harsch, M.A.; Hulme, P.E.; McGlone, M.S.; Duncan, R.P. Are treelines advancing? A global meta-analysis of treeline response to climate warming. Ecol. Lett. 2009, 12, 1040–1049. [Google Scholar] [CrossRef]
  17. Allen, C.D.; Macalady, A.K.; Chenchouni, H.; Bachelet, D.; McDowell, N.; Vennetier, M.; Kitzberger, T.; Rigling, A.; Breshears, D.D.; Hogg (Ted), E.H.; et al. A global overview of drought and heat-induced tree mortality reveals emerging climate change risks for forests. For. Ecol. Manag. 2010, 259, 660–684. [Google Scholar] [CrossRef] [Green Version]
  18. Dyderski, M.K.; Paź, S.; Frelich, L.E.; Jagodziński, A.M. How much does climate change threaten European forest tree species distributions? Glob. Chang. Biol. 2018, 24, 1150–1163. [Google Scholar] [CrossRef]
  19. Fadrique, B.; Báez, S.; Duque, Á.; Malizia, A.; Blundo, C.; Carilla, J.; Osinaga-Acosta, O.; Malizia, L.; Silman, M.; Farfán-Ríos, W.; et al. Widespread but heterogeneous responses of Andean forests to climate change. Nature 2018, 564, 207–212. [Google Scholar] [CrossRef]
  20. McDowell, N.G.; Allen, C.D.; Anderson-Teixeira, K.; Aukema, B.H.; Bond-Lamberty, B.; Chini, L.; Clark, J.S.; Dietze, M.; Grossiord, C.; Hanbury-Brown, A. Pervasive shifts in forest dynamics in a changing world. Science 2020, 368, eaaz9463. [Google Scholar] [CrossRef]
  21. Sedelnikov, V.P. High-Mountain Vegetation of the Altai-Sayan Mountains; Nauka Press: Novosibirsk, Russia, 1988. (In Russian) [Google Scholar]
  22. Chytrý, M.; Danihelka, J.; Kubešová, S.; Lustyk, P.; Ermakov, N.; Hájek, M.; Hájková, P.; Kočí, M.; Otýpková, Z.; Roleček, J.; et al. Diversity of forest vegetation across a strong gradient of climatic continentality: Western Sayan Mountains, southern Siberia. Plant Ecol. 2008, 196, 61–83. [Google Scholar] [CrossRef]
  23. Danchenko, A.M.; Beh, I.A. Cedar Forests of Western Siberia; Tomsk State University: Tomsk, Russia, 2010. (In Russian) [Google Scholar]
  24. Nikolaeva, S.A.; Velisevich, S.N.; Savchuk, D.A. Ontogeny of Siberian stone pine (Pinus sibirica Du Tour) in southeastern West Siberian Plain. J. Sib. Fed. Univ. Biol. 2011, 4, 3–22. (In Russian) [Google Scholar]
  25. Usoltsev, V.A.; Krudyshev, V.V. On the ecology and geography of the Siberian stone pine. Aktualnye Problemy Lesnogo Kompleksa [Actual Probl. For. Complex] 2011, 28, 147–153. (In Russian) [Google Scholar]
  26. Danchenko, A.M.; Danchenko, M.A.; Myasnikov, A.G.; Bekh, I.A. Kedry Rossii [Stone pines of Russia]; Tomsk State Univ. Publ. House: Tomsk, Russia, 2016. (In Russian) [Google Scholar]
  27. Tchebakova, N.M.; Parfenova, E.I.; Bazhina, E.V.; Soja, A.J.; Groisman, P.Y. Droughts are not the likely primary cause for Abies sibirica and Pinus sibirica forest dieback in the South Siberian mountains. Forests 2022, 13, 1378. [Google Scholar] [CrossRef]
  28. Schweingruber, F.H. Tree Rings: Basics and Applications of Dendrochronology; Kluwer Academic Publishers: Dordrecht, The Netherlands, 1988. [Google Scholar] [CrossRef]
  29. D’Arrigo, R.; Frank, D.; Pederson, N.; Cook, E.; Buckley, B.; Nachin, B.; Mijiddorj, R.; Dugarjav, C. 1738 years of Mongolian temperature variability inferred from a tree-ring width chronology of Siberian pine. Geophys. Res. Lett. 2001, 28, 543–546. [Google Scholar] [CrossRef] [Green Version]
  30. Gerasimova, O.V.; Zharnikov, Z.Y.; Knorre, A.A.; Myglan, V.S. Climatically induced dynamic of radial growth of Siberian stone pine and Siberian fir in the mountain taiga belt in “Ergaki” National Park. J. Sib. Fed. Univ. Biol. 2010, 3, 18–29. (In Russian) [Google Scholar]
  31. Shah, S.; Yu, J.; Liu, Q.; Shi, J.; Ahmad, A.; Khan, D.; Mannan, A. Climate growth response of Pinus sibirica (Siberian pine) in the Altai mountains, northwestern China. Pak. J. Bot. 2020, 52, 593–600. [Google Scholar] [CrossRef]
  32. Zonneveld, B.J.M. Conifer genome sizes of 172 species, covering 64 of 67 genera, range from 8 to 72 picogram. Nordic J. Bot. 2012, 30, 490–502. [Google Scholar] [CrossRef]
  33. MacGillivray, C.W.; Grime, J.P. Genome size predicts frost resistance in British herbaceous plants: Implications for rates of vegetation response to global warming. Funct. Ecol. 1995, 9, 320–325. [Google Scholar] [CrossRef]
  34. Pellicer, J.; Leitch, I.J. The Plant DNA C-values database (release 7.1): An updated online repository of plant genome size data for comparative studies. New Phytol. 2020, 226, 301–305. [Google Scholar] [CrossRef] [Green Version]
  35. Reich, P.B. The world-wide ‘fast–slow’ plant economics spectrum: A traits manifesto. J. Ecol. 2014, 102, 275–301. [Google Scholar] [CrossRef]
  36. Ning, Q.R.; Gong, X.W.; Li, M.Y.; Hao, G.Y. Differences in growth pattern and response to climate warming between Larix olgensis and Pinus koraiensis in Northeast China are related to their distinctions in xylem hydraulics. Agric. For. Meteorol. 2022, 312, 108724. [Google Scholar] [CrossRef]
  37. Wang, H.; Shao, X.M.; Jiang, Y.; Fang, X.Q.; Wu, S.H. The impacts of climate change on the radial growth of Pinus koraiensis along elevations of Changbai Mountain in northeastern China. For. Ecol. Manag. 2013, 289, 333–340. [Google Scholar] [CrossRef]
  38. Yu, D.; Liu, J.; Lewis, B.J.; Li, Z.; Zhou, W.; Fang, X.; Wei, Y.; Jiang, S.; Dai, L. Spatial variation and temporal instability in the climate–growth relationship of Korean pine in the Changbai Mountain region of Northeast China. For. Ecol. Manag. 2013, 300, 96–105. [Google Scholar] [CrossRef]
  39. Yang, J.; Zhao, H.; Zhang, Y.; Li, Z.; Wang, X. Climate–growth relationship for different directions of Pinus pumila radial growth at the treeline of northern Daxing’an Mountains, China. Trees 2018, 32, 311–322. [Google Scholar] [CrossRef]
  40. Cerrato, R.; Salvatore, M.C.; Gunnarson, B.E.; Linderholm, H.W.; Carturan, L.; Brunetti, M.; De Blasi, F.; Baroni, C. A Pinus cembra L. tree-ring record for late spring to late summer temperature in the Rhaetian Alps, Italy. Dendrochronologia 2019, 53, 22–31. [Google Scholar] [CrossRef]
  41. Brubaker, L.B. Responses of tree populations to climatic change. Vegetatio 1986, 67, 119–130. [Google Scholar] [CrossRef]
  42. Wieser, G.; Holtmeier, F.K.; Smith, W.K. Treelines in a changing global environment. In Trees in a Changing Environment; Tausz, M., Grulke, N., Eds.; Springer: Dordrecht, The Netherlands, 2014; pp. 221–263. [Google Scholar] [CrossRef]
  43. Malanson, G.P. Mixed signals in trends of variance in high-elevation tree ring chronologies. J. Mt. Sci. 2017, 14, 1961–1968. [Google Scholar] [CrossRef]
  44. Anderson-Teixeira, K.J.; Herrmann, V.; Rollinson, C.R.; Gonzalez, B.; Gonzalez-Akre, E.B.; Pederson, N.; Alexander, M.R.; Allen, C.D.; Alfaro-Sánchez, R.; Awada, T.; et al. Joint effects of climate, tree size, and year on annual tree growth derived from tree-ring records of ten globally distributed forests. Glob. Chang. Biol. 2022, 28, 245–266. [Google Scholar] [CrossRef]
  45. Carrer, M.; Urbinati, C. Age-dependent tree-ring growth responses to climate in Larix decidua and Pinus cembra. Ecology 2004, 85, 730–740. [Google Scholar] [CrossRef]
  46. Esper, J.; Niederer, R.; Bebi, P.; Frank, D. Climate signal age effects—Evidence from young and old trees in the Swiss Engadin. For. Ecol. Manag. 2008, 255, 3783–3789. [Google Scholar] [CrossRef]
  47. Martínez-Vilalta, J.; López, B.C.; Loepfe, L.; Lloret, F. Stand-and tree-level determinants of the drought response of Scots pine radial growth. Oecologia 2012, 168, 877–888. [Google Scholar] [CrossRef]
  48. Linares, J.C.; Taïqui, L.; Sangüesa-Barreda, G.; Seco, J.I.; Camarero, J.J. Age-related drought sensitivity of Atlas cedar (Cedrus atlantica) in the Moroccan Middle Atlas forests. Dendrochronologia 2013, 31, 88–96. [Google Scholar] [CrossRef] [Green Version]
  49. Konter, O.; Büntgen, U.; Carrer, M.; Timonen, M.; Esper, J. Climate signal age effects in boreal tree-rings: Lessons to be learned for paleoclimatic reconstructions. Quat. Sci. Rev. 2016, 142, 164–172. [Google Scholar] [CrossRef]
  50. Pompa-García, M.; Hadad, M.A. Sensitivity of pines in Mexico to temperature varies with age. Atmósfera 2016, 29, 209–219. [Google Scholar] [CrossRef] [Green Version]
  51. Jiao, L.; Jiang, Y.; Wang, M.; Zhang, W.; Zhang, Y. Age-effect radial growth responses of Picea schrenkiana to climate change in the eastern Tianshan Mountains, Northwest China. Forests 2017, 8, 294. [Google Scholar] [CrossRef] [Green Version]
  52. Van Wijk, M.T.; Clemmensen, K.E.; Shaver, G.R.; Williams, M.; Callaghan, T.V.; Chapin, F.S., III; Cornelissen, J.H.C.; Gough, L.; Hobbie, S.E.; Jonasson, S.; et al. Long-term ecosystem level experiments at Toolik Lake, Alaska, and at Abisko, Northern Sweden: Generalizations and differences in ecosystem and plant type responses to global change. Glob. Chang. Biol. 2003, 10, 105–123. [Google Scholar] [CrossRef]
  53. Sullivan, P.F.; Ellison, S.B.Z.; McNown, R.W.; Brownlee, A.H.; Sveinbjörnsson, B. Evidence of soil nutrient availability as the proximate constraint on growth of treeline trees in northwest Alaska. Ecology 2015, 96, 716–727. [Google Scholar] [CrossRef]
  54. Moyes, A.B.; Germino, M.J.; Kueppers, L.M. Moisture rivals temperature in limiting photosynthesis by trees establishing beyond their cold-edge range limit under ambient and warmed conditions. New Phytol. 2015, 207, 1005–1014. [Google Scholar] [CrossRef]
  55. Oberhuber, W. Influence of climate on radial growth of Pinus cembra within the alpine timberline ecotone. Tree Physiol. 2004, 24, 291–301. [Google Scholar] [CrossRef]
  56. Vorobev, V.N. (Ed.) Pine Forests: Utilization of Its Products; CRC Press: Boca Raton, CA, USA, 2006. [Google Scholar]
  57. Hallinger, M.; Manthey, M.; Wilmking, M. Establishing a missing link: Warm summers and winter snow cover promote shrub expansion into alpine tundra in Scandinavia. New Phytol. 2010, 186, 890–899. [Google Scholar] [CrossRef]
  58. Kirdyanov, A.V.; Hagedorn, F.; Knorre, A.A.; Fedotova, E.V.; Vaganov, E.A.; Naurzbaev, M.M.; Moiseev, P.A.; Rigling, A. 20th century tree-line advance and vegetation changes along an altitudinal transect in the Putorana Mountains, northern Siberia. Boreas 2012, 41, 56–67. [Google Scholar] [CrossRef]
  59. Hagedorn, F.; Shiyatov, S.G.; Mazepa, V.S.; Devi, N.M.; Grigor’ev, A.A.; Bartish, A.A.; Fomin, V.V.; Kapralov, D.S.; Moiseev, P.A. Treeline advances along the Urals mountain range—Driven by improved winter conditions? Glob. Chang. Biol. 2014, 20, 3530–3543. [Google Scholar] [CrossRef]
  60. Dan Moore, R.; Spittlehouse, D.; Story, A. Riparian microclimate and stream temperature response to forest harvesting: A review. Am. Water Resour. Assoc. 2005, 41, 813–834. [Google Scholar] [CrossRef]
  61. Monnier, Y.; Prévosto, B.; Ripert, C.; Corbani, A.C.; Fernandez, C. Forest microhabitats differentially influence seedling phenology of two co-existing Mediterranean oak species. J. Veg. Sci. 2012, 23, 260–270. [Google Scholar] [CrossRef]
  62. Holtmeier, F.K.; Broll, G. Treelines—Approaches at different scales. Sustainability 2017, 9, 808. [Google Scholar] [CrossRef] [Green Version]
  63. Albrich, K.; Rammer, W.; Seidl, R. Climate change causes critical transitions and irreversible alterations of mountain forests. Glob. Chang. Biol. 2020, 26, 4013–4027. [Google Scholar] [CrossRef]
  64. Harvey, J.E.; Smiljanić, M.; Scharnweber, T.; Buras, A.; Cedro, A.; Cruz-García, R.; Drobyshev, I.; Janecka, K.; Jansons, Ā.; Kaczka, R.; et al. Tree growth influenced by warming winter climate and summer moisture availability in northern temperate forests. Glob. Chang. Biol. 2020, 26, 2505–2518. [Google Scholar] [CrossRef]
  65. Christiansen, B.; Ljungqvist, F.C. Challenges and perspectives for large-scale temperature reconstructions of the past two millennia. Rev. Geophys. 2017, 55, 40–96. [Google Scholar] [CrossRef]
  66. Esper, J.; George, S.S.; Anchukaitis, K.; D’Arrigo, R.; Ljungqvist, F.C.; Luterbacher, J.; Schneider, L.; Stoffel, M.; Wilson, R.; Büntgen, U. Large-scale, millennial-length temperature reconstructions from tree-rings. Dendrochronologia 2018, 50, 81–90. [Google Scholar] [CrossRef] [Green Version]
  67. Alisov, B.P. Climate of the USSR; Moscow State University: Moscow, Russia, 1956. (In Russian) [Google Scholar]
  68. Compo, G.P.; Whitaker, J.S.; Sardeshmukh, P.D.; Matsui, N.; Allan, R.J.; Yin, X.; Gleason, B.E.; Vose, R.S.; Rutledge, G.; Bessemoulin, P.; et al. The Twentieth Century Reanalysis Project. Q. J. R. Meteorol. Soc. 2011, 137, 1–28. [Google Scholar] [CrossRef] [Green Version]
  69. Groisman, P.Y.; Rankova, E.Y. Precipitation trends over the Russian permafrost-free zone: Removing the artifacts of pre-processing. Int. J. Climatol. J. R. Meteorol. Soc. 2001, 21, 657–678. [Google Scholar] [CrossRef]
  70. Polikarpov, N.P.; Nazimova, D.I. The dark coniferous forests of the northern part of the west Siberian mountains. In Forestry Research in the Forests of Siberia; Institute for Forests and Wood: Krasnoyarsk, Russia, 1963; pp. 103–147. (In Russian) [Google Scholar]
  71. Monserud, R.A.; Tchebakova, N.M. A vegetation model for the Sayan Mountains, southern Siberia. Can. J. For. Res. 1996, 26, 1055–1068. [Google Scholar] [CrossRef]
  72. Cook, E.R.; Kairiukstis, L.A. Methods of Dendrochronology: Applications in the Environmental Sciences; Kluwer Academic Publishers: Dordrecht, The Netherlands, 1990. [Google Scholar] [CrossRef]
  73. Holmes, R.L. Computer-assisted quality control in tree-ring dating and measurement. Tree-Ring Bull. 1983, 43, 68–78. [Google Scholar]
  74. Rinn, F. TSAP-Win: Time Series Analysis and Presentation for Dendrochronology and Related Applications: User Reference; RINNTECH: Heidelberg, Germany, 2003. [Google Scholar]
  75. Cook, E.R.; Krusic, P.J. Program ARSTAN: A Tree-ring Standardization Program Based on Detrending and Autoregressive Time Series Modeling, with Interactive Graphics; Lamont-Doherty Earth Observatory, Columbia University: Palisades, LA, USA, 2005. [Google Scholar]
  76. Wigley, T.M.L.; Briffa, K.R.; Jones, P.D. On the average value of correlated time series, with applications in dendroclimatology and hydrometeorology. J. Appl. Meteorol. Climatol. 1984, 23, 201–213. [Google Scholar] [CrossRef]
  77. Rossi, S.; Deslauriers, A.; Anfodillo, T.; Carraro, V. Evidence of threshold temperatures for xylogenesis in conifers at high altitudes. Oecologia 2007, 152, 1–12. [Google Scholar] [CrossRef]
  78. Rossi, S.; Deslauriers, A.; Griçar, J.; Seo, J.W.; Rathgeber, C.B.; Anfodillo, T.; Morin, H.; Levanic, T.; Oven, P.; Jalkanen, R. Critical temperatures for xylogenesis in conifers of cold climates. Glob. Ecol. Biogeogr. 2008, 17, 696–707. [Google Scholar] [CrossRef]
  79. Wilks, D.S. Statistical Methods in the Atmospheric Sciences, 4th ed.; Elsevier: Cambridge, UK, 2019. [Google Scholar]
  80. Vittoz, P.; Rulence, B.; Largey, T.; Freléchoux, F. Effects of climate and land-use change on the establishment and growth of Cembran pine (Pinus cembra L.) over the altitudinal treeline ecotone in the Central Swiss Alps. Arct. Antarct. Alp. Res. 2008, 40, 225–232. [Google Scholar] [CrossRef] [Green Version]
  81. Petrov, I.A.; Shushpanov, A.S.; Golyukov, A.S.; Kharuk, V.I. Pinus sibirica Du Tour response to climate change in the forests of the Kuznetsk Alatau Mountains. Sibirskij Lesnoj Zurnal [Sib. J. For. Sci.] 2019, 5, 43–53. [Google Scholar]
  82. Treml, V.; Ponocná, T.; Büntgen, U. Growth trends and temperature responses of treeline Norway spruce in the Czech-Polish Sudetes Mountains. Clim. Res. 2012, 55, 91–103. [Google Scholar] [CrossRef] [Green Version]
  83. Chhetri, P.K.; Cairns, D.M. Dendroclimatic response of Abies spectabilis at treeline ecotone of Barun Valley, eastern Nepal Himalaya. J. For. Res. 2016, 27, 1163–1170. [Google Scholar] [CrossRef]
  84. Wang, T.; Ren, H.; Ma, K. Climatic signals in tree ring of Picea schrenkiana along an altitudinal gradient in the central Tianshan Mountains, northwestern China. Trees 2005, 19, 736–742. [Google Scholar] [CrossRef]
  85. De Grandpré, L.; Tardif, J.C.; Hessl, A.; Pederson, N.; Conciatori, F.; Green, T.R.; Oyunsanaa, B.; Baatarbileg, N. Seasonal shift in the climate responses of Pinus sibirica, Pinus sylvestris and Larix sibirica trees from semi-arid, north-central Mongolia. Can. J. For. Res. 2011, 41, 1242–1255. [Google Scholar] [CrossRef]
  86. Timoshok, E.E.; Timoshok, E.N.; Skorokhodov, S.N. Ecology of Siberian stone pine (Pinus sibirica Du Tour) and Siberian larch (Larix sibirica Ledeb.) in the Altai mountain glacial basins. Russ. J. Ecol. 2014, 45, 194–200. [Google Scholar] [CrossRef]
  87. Nazarov, A.N.; Myglan, V.S. The possibility of construction of the 6000-year chronology for Siberian pine in the Central Altai. J. Sib. Fed. Univ. Biol. 2012, 5, 70–88. (In Russian) [Google Scholar]
  88. Rolland, C. Decreasing teleconnections with inter-site distance in monthly climatic data and tree-ring width networks in a mountainous Alpine area. Theor. Appl. Climatol. 2002, 71, 63–75. [Google Scholar] [CrossRef]
  89. Frank, D.; Esper, J. Characterization and climate response patterns of a high-elevation, multi-species tree-ring network in the European Alps. Dendrochronologia 2005, 22, 107–121. [Google Scholar] [CrossRef]
  90. Li, M.H.; Yang, J.; Kräuchi, N. Growth responses of Picea abies and Larix decidua to elevation in subalpine areas of Tyrol, Austria. Can. J. For. Res. 2003, 33, 653–662. [Google Scholar] [CrossRef]
  91. Danek, M.; Chuchro, M.; Walanus, A. Tree-ring growth of Larch (Larix decidua Mill.) in the Polish Sudetes—The influence of altitude and site-related factors on the climate-growth relationship. Forests 2018, 9, 663. [Google Scholar] [CrossRef] [Green Version]
  92. Carnicer, J.; Vives-Ingla, M.; Blanquer, L.; Méndez-Camps, X.; Rosell, C.; Sabaté, S.; Gutiérrez, E.; Sauras, T.; Peñuelas, J.; Barbeta, A. Forest resilience to global warming is strongly modulated by local-scale topographic, microclimatic and biotic conditions. J. Ecol. 2021, 109, 3322–3339. [Google Scholar] [CrossRef]
  93. Jacoby, G.C.; D’Arrigo, R.D.; Davaajamts, T. Mongolian tree rings and 20th-century warming. Science 1996, 273, 771–773. [Google Scholar] [CrossRef]
  94. Shi, P.; Körner, C.; Hoch, G. A test of the growth-limitation theory for alpine tree line formation in evergreen and deciduous taxa of the eastern Himalayas. Funct. Ecol. 2008, 22, 213–220. [Google Scholar] [CrossRef]
  95. Lenz, A.; Hoch, G.; Körner, C. Early season temperature controls cambial activity and total tree ring width at the alpine treeline. Plant Ecol. Divers. 2013, 6, 365–375. [Google Scholar] [CrossRef]
  96. Lange, O.L.; Schulze, E.D. Untersuchungen über die Dickenentwicklung der kutikularen Zellwandschichten bei der Fichtennadel. Forstwissenschaftliches Centralblatt 1966, 85, 27–38. (In Germany) [Google Scholar] [CrossRef]
  97. Tranquillini, W. Physiological Ecology of the Alpine Timberline. Tree Existence in High Altitudes with Special Reference to the European Alps; Springer: Berlin, Germany, 1979. [Google Scholar]
  98. Mayr, S. Limits in water relations. In Trees at their Upper Limit; Wieser, G., Tausz, M., Eds.; Springer: Dordrecht, The Netherlands, 2007; pp. 145–162. [Google Scholar]
  99. Mayr, S.; Hacke, U.; Schmid, P.; Schwienbacher, F.; Gruber, A. Frost drought in conifers at the alpine timberline: Xylem dysfunction and adaptations. Ecology 2006, 87, 3175–3185. [Google Scholar] [CrossRef] [Green Version]
  100. Man, R.; Kayahara, G.J.; Dang, Q.L.; Rice, J.A. A case of severe frost damage prior to budbreak in young conifers in Northeastern Ontario: Consequence of climate change? For. Chron. 2009, 85, 453–462. [Google Scholar] [CrossRef]
  101. Yin, D.; Xu, D.; Tian, K.; Xiao, D.; Zhang, W.; Sun, D.; Sun, H.; Zhang, Y. Radial growth response of Abies georgei to climate at the upper timberlines in central Hengduan Mountains, Southwestern China. Forests 2018, 9, 606. [Google Scholar] [CrossRef] [Green Version]
  102. Kang, J.; Jiang, S.; Tardif, J.C.; Liang, H.; Zhang, S.; Li, J.; Yu, B.; Bergeron, Y.; Rossi, S.; Wang, Z. Radial growth responses of two dominant conifers to climate in the Altai Mountains, Central Asia. Agric. For. Meteorol. 2021, 298–299, 108297. [Google Scholar] [CrossRef]
  103. Wason, J.W.; Beier, C.M.; Battles, J.J.; Dovciak, M. Acidic deposition and climate warming as drivers of tree growth in high-elevation spruce-fir forests of the Northeastern US. Front. For. Glob. Chang. 2019, 2, 63. [Google Scholar] [CrossRef] [Green Version]
  104. Roitto, M.; Sutinen, S.; Wang, A.F.; Domisch, T.; Lehto, T.; Repo, T. Waterlogging and soil freezing during dormancy affected root and shoot phenology and growth of Scots pine saplings. Tree Physiol. 2019, 39, 805–818. [Google Scholar] [CrossRef]
  105. Sutinen, M.L.; Holappa, T.; Ritari, A.; Kujala, K. Seasonal changes in soil temperature and snow-cover under different simulated winter conditions: Comparison with frost hardiness of Scots pine (Pinus sylvestris) roots. Chemos.-Glob. Chang. Sci. 1999, 1, 485–492. [Google Scholar] [CrossRef]
  106. Kirdyanov, A.; Hughes, M.; Vaganov, E.; Schweingruber, F.; Silkin, P. The importance of early summer temperature and date of snow melt for tree growth in the Siberian Subarctic. Trees 2003, 17, 61–69. [Google Scholar] [CrossRef]
  107. Repo, T.; Lehto, T.; Finér, L. Delayed soil thawing affects root and shoot functioning and growth in Scots pine. Tree Physiol. 2008, 28, 1583–1591. [Google Scholar] [CrossRef] [Green Version]
  108. Sanmiguel-Vallelado, A.; Camarero, J.J.; Morán-Tejeda, E.; Gazol, A.; Colangelo, M.; Alonso-González, E.; Lopez-Moreno, J.I. Snow dynamics influence tree growth by controlling soil temperature in mountain pine forests. Agric. For. Meteorol. 2021, 296, 108205. [Google Scholar] [CrossRef]
  109. Pomeroy, J.W.; Marsh, P.; Gray, D.M. Application of a distributed blowing snow model to the Arctic. Hydrol. Process. 1997, 11, 1451–1464. [Google Scholar] [CrossRef]
  110. Cosma, S.; Richard, E.; Miniscloux, F. The role of small-scale orographic features in the spatial distribution of precipitation. Q. J. R. Meteorol. Soc. 2002, 128, 75–92. [Google Scholar] [CrossRef]
  111. Konrad, C.E. Maximum precipitation rates in the southern Blue Ridge Mountains of the southeastern United States. Clim. Res. 1995, 5, 159–166. [Google Scholar] [CrossRef]
  112. Kurita, N. Modern isotope climatology of Russia: A first assessment. J. Geophys. Res. 2004, 109. [Google Scholar] [CrossRef]
  113. Körner, C.; Paulsen, J. A world-wide study of high altitude treeline temperatures. J. Biogeogr. 2004, 31, 713–732. [Google Scholar] [CrossRef]
  114. Ren, P.; Rossi, S.; Camarero, J.J.; Ellison, A.M.; Liang, E.; Peñuelas, J. Critical temperature and precipitation thresholds for the onset of xylogenesis of Juniperus przewalskii in a semi-arid area of the north-eastern Tibetan Plateau. Ann. Bot. 2018, 121, 617–624. [Google Scholar] [CrossRef]
  115. Zhang, J.; Gou, X.; Manzanedo, R.D.; Zhang, F.; Pederson, N. Cambial phenology and xylogenesis of Juniperus przewalskii over a climatic gradient is influenced by both temperature and drought. Agric. For. Meteorol. 2018, 260, 165–175. [Google Scholar] [CrossRef]
  116. Rogers, J.C.; Mosley-Thompson, E. Atlantic Arctic cyclones and the mild Siberian winters of the 1980s. Geophys. Res. Lett. 1995, 22, 799–802. [Google Scholar] [CrossRef] [Green Version]
  117. Chen, F.; Wang, J.; Jin, L.; Zhang, Q.; Li, J.; Chen, J. Rapid warming in mid-latitude central Asia for the past 100 years. Front. Earth Sci. China 2009, 3, 42–50. [Google Scholar] [CrossRef]
  118. Tchebakova, N.M.; Rehfeldt, G.E.; Parfenova, E.I. From vegetation zones to climatypes: Effects of climate warming on Siberian ecosystems. In Permafrost Ecosystems; Osawa, A., Zyryanova, O., Matsuura, Y., Kajimoto, T., Wein, R., Eds.; Springer: Dordrecht, The Netherlands, 2010; pp. 427–446. [Google Scholar] [CrossRef]
  119. Asante, D.K.; Yakovlev, I.A.; Fossdal, C.G.; Holefors, A.; Opseth, L.; Olsen, J.E.; Junttila, O.; Johnsen, Ø. Gene expression changes during short day induced terminal bud formation in Norway spruce. Plant. Cell. Environ. 2011, 34, 332–346. [Google Scholar] [CrossRef]
  120. Jyske, T.; Mäkinen, H.; Kalliokoski, T.; Nöjd, P. Intra-annual tracheid production of Norway spruce and Scots pine across a latitudinal gradient in Finland. Agric. For. Meteorol. 2014, 194, 241–254. [Google Scholar] [CrossRef]
  121. Rathgeber, C.B.; Pérez-de-Lis, G.; Fernández-de-Uña, L.; Fonti, P.; Rossi, S.; Treydte, K.; Gessler, A.; Deslauriers, A.; Fonti, M.V.; Ponton, S. Anatomical, developmental and physiological bases of tree-ring formation in relation to environmental factors. In Stable Isotopes in Tree Rings; Siegwolf, R.T.W., Brooks, J.R., Roden, J., Saurer, M., Eds.; Springer: Cham, Switzerland, 2022; pp. 61–99. [Google Scholar] [CrossRef]
  122. Szeicz, J.M.; MacDonald, G.M. Age-dependent tree-ring growth responses of subarctic white spruce to climate. Can. J. For. Res. 1994, 24, 120–132. [Google Scholar] [CrossRef]
  123. Schuster, R.; Oberhuber, W. Age-dependent climate–growth relationships and regeneration of Picea abies in a drought-prone mixed-coniferous forest in the Alps. Can. J. For. Res. 2013, 43, 609–618. [Google Scholar] [CrossRef] [Green Version]
  124. Primicia, I.; Camarero, J.J.; Janda, P.; Čada, V.; Morrissey, R.C.; Trotsiuk, V.; Bače, R.; Teodosiu, M.; Svoboda, M. Age, competition, disturbance and elevation effects on tree and stand growth response of primary Picea abies forest to climate. For. Ecol. Manag. 2015, 354, 77–86. [Google Scholar] [CrossRef]
  125. Wang, X.; Zhang, Y.; McRae, D.J. Spatial and age-dependent tree-ring growth responses of Larix gmelinii to climate in northeastern China. Trees 2009, 23, 875–885. [Google Scholar] [CrossRef]
  126. Gurskaya, M.A.; Shiyatov, S.G. Distribution of frost injuries in the wood of conifers. Russ. J. Ecol. 2006, 37, 7–12. [Google Scholar] [CrossRef]
  127. Tuovinen, M.; Jalkanen, R.; MccArroll, D. The effect of severe ground frost on Scots pine (Pinus sylvestris) trees in northern Finland and implications for palaeoclimate reconstruction. Fennia 2005, 183, 109–117. [Google Scholar]
Figure 1. The study region: (A) satellite map (© ArcGIS) of the Western Sayan Mts. in Southern Siberia with locations of sampling sites (white circles), meteorological stations (blue diamonds), ERA-20C grid points closest to sampling sites (blue plus signs), and inserts depicting enlarged topographic maps of the study areas; (B) climatic diagrams of daily temperature (Temp, red lines) and precipitation (Prec, blue bars) averaged over the 1936–2010 period for the ERA-20C grid points closest to the sampling sites (coordinates are included in labels).
Forests 13 01994 g001
Figure 2. Climatic response of P. sibirica radial growth: correlations of residual TRW chronologies SPass, GladSW, GladE, ErgO, ErgV, and ErgZ with 21 day moving series of temperature (Temp, red line) and precipitation (Prec, blue area) over the 1936–2010 period. Asterisks (*) mark months of the previous year; dashed horizontal lines mark the significance level p = 0.05. Brackets mark seasons of unidirectional responses (prev, previous vegetation season; cold, cold season; spring, early spring season; curr, current vegetation season).
Forests 13 01994 g002
Table 1. Characteristics of sampling sites, samples and tree-ring width (TRW) chronologies (SD, standard deviation; r-bar, mean inter-series correlation coefficient; sens, mean sensitivity coefficient).
LocationSite
Code
°N°ERange of Elevation, m a.s.l.SlopeSampleChronology
No. of
Trees/Cores
Cover Period,
Years
Length,
Years
Mean TRW, mmSDr-barsens
Sayansky Pass 1SPass51.7189.861970–2020SSW52/801524–20194960.580.140.300.16
SPassY19/381912–20191081.080.120.350.15
SPassM17/211778–20192420.620.170.350.18
SPassO16/211524–20194960.500.150.410.16
Gladenkaya Mt.GladSW52.9191.361600–1640SW27/301633–20173850.630.150.350.16
GladE52.9291.371530–1570E27/271786–20172320.900.140.280.15
Ergaki Ridge, Lake Oyskoe ErgO52.8693.251520–1600S22/221688–20183310.940.150.400.17
Ergaki Ridge, Vidovka Mt.ErgV52.8093.431600–1680SSW22/231642–20203790.850.160.510.18
Ergaki Ridge, Lake Zolotarnoe ErgZ52.8293.441700–1780WSW16/161790–20202310.560.210.370.22
1 For the SPass site, sample was separated into three groups of trees with cambial ages of ≤100, 101–200, and >200 years in 2010, and chronologies were developed for full sample (SPass), young (SPassY), middle-aged (SPassM), and old (SPassO) trees.
Table 2. Correlations between P. sibirica residual TRW chronologies over the 1936–2010 period of dendroclimatic analysis.
Chronologies per seHigh-Frequency (below Diagonal) and Low-Frequency (above Diagonal) Components Separated with a 5-Year Smoothing Filter
SiteSPassGladSWGladEErgOErgVSPassGladSWGladEErgOErgVErgZ
SPass 0.660.550.720.680.48
GladSW0.70 0.72 0.73 0.680.670.59
GladE0.660.84 0.680.87 0.690.450.41
ErgO0.670.750.73 0.690.780.74 0.66 0.60
ErgV0.690.720.580.76 0.710.700.560.80 0.61
ErgZ0.700.650.570.66 0.74 0.740.670.580.73 0.80
All correlation coefficients were significant at p < 0.05. Correlations within the same sampling area.
Table 3. Maximal seasonal responses of P. sibirica residual TRW chronologies to temperature and precipitation over the 1936–2010 period: maximal correlations and respective seasonal intervals with daily resolution (prev, second part of previous vegetation season with addition of period until early winter for precipitation; cold, cold season; spring, early spring season; curr, first part of current vegetation season).
Climatic VariableChronology
SPassGladSWGladEErgOErgVErgZ
Seasonality (beginning and ending dates)
Temperature
prev15 Aug. *–23 Sep. *25 Jul. *–11 Sep. *18 Jul. *–23 Sep. *15 Aug. *–22 Sep. *25 Jul. *–20 Sep. *14 Aug. *–4 Oct. *
cold10 Nov. *–26 Mar.12 Dec. *–26 Mar.24 Nov. *–26 Mar.10 Dec. *–26 Mar.19 Nov. *–27 Mar.16 Nov. *–18 Mar.
prev + cold15 Aug. *–26 Mar.25 Jul. *–26 Mar.18 Jul. *–26 Mar.15 Aug. *–26 Mar.25 Jul. *–27 Mar.22 Jul. *–18 Mar.
spring3 Apr.–10 May5 Apr.–3 May3 Apr.–3 May5 Apr.–3 May8 Apr.–11 May28 Mar.–11 May
curr12 May–25 Aug.18 May–31 Aug.13 May–1 Sep.13 May–3 Sep.23 May–2 Sep.24 May–13 Aug.
Precipitation
prev8 Sep. *–25 Dec. *13 Jul. *–1 Dec. *14 Jul. *–25 Dec. *29 Aug. *–30 Nov. *24 Jul. *–1 Dec. *5 Sep. *–25 Dec. *
cold26 Dec. *–30 Mar.2 Dec. *–4 Apr.26 Dec. *–4 Apr.1 Dec. *–20 Apr.2 Dec. *–20 Apr.26 Dec. *–4 Apr.
curr5 Apr.–8 Aug.12 Apr.–10 Aug.5 Apr.–7 Aug.28 Apr.–21 Jul.21 Apr.–10 Aug.20 Apr.–6 Aug.
Correlations between time series per se
Temperature
prev0.260.290.220.260.200.11
cold0.300.350.330.440.380.25
prev + cold0.310.330.350.400.380.27
spring−0.17−0.21−0.19−0.22−0.19−0.25
curr0.370.200.200.310.380.22
Precipitation
prev−0.37−0.37−0.30−0.29−0.24−0.36
cold0.130.070.040.250.250.25
curr−0.28−0.32−0.27−0.21−0.25−0.19
Correlations between time series separated into high-frequency/low-frequency domains with 5-year smoothing filter
Temperature
prev0.22/0.500.23/0.360.20/0.310.07/0.64−0.02/0.590.12/0.40
cold0.33/0.420.37/0.280.32/0.450.42/0.510.43/0.330.35/0.29
prev + cold0.35/0.480.39/0.260.38/0.420.34/0.580.39/0.440.38/0.43
spring−0.21/0.18−0.27/−0.18−0.24/−0.07−0.30/−0.21−0.29/0.04−0.17/0.04
curr0.44/0.360.35/0.070.27/0.200.36/0.350.45/0.460.39/0.47
Precipitation
prev−0.49/−0.22−0.45/−0.31−0.39/−0.01−0.29/−0.11−0.28/−0.16−0.43/0.21
cold0.02/0.13−0.04/0.250.00/−0.180.13/0.360.13/0.420.12/0.35
curr−0.47/0.00−0.41/−0.27−0.37/−0.24−0.31/0.02−0.37/−0.20−0.32/−0.22
Correlation coefficients significant at p < 0.05. are highlighted with bold font. * Months of previous year.
Publisher’s Note: MDPI stays neutral with regard to jurisdictional claims in published maps and institutional affiliations.

