Article

Early Signs of the Effects of Forest Fragmentation on the Genetic Diversity and Structure of the Threatened Ecuadorian Tree Ocotea rotundata (Lauraceae)

1
Forest Research Centre (CEF) & Associate Laboratory TERRA, Instituto Superior de Agronomia (ISA), Universidade de Lisboa, 1349-017 Lisbon, Portugal
2
Center for Ecology, Evolution and Environmental Changes, CHANGE—Global Change and Sustainability Institute, Universidade de Lisboa, 1749-016 Lisbon, Portugal
3
Nova School of Business and Economics, Campus de Carcavelos, 2775-405 Carcavelos, Portugal
4
Facultad de Ciencias Exactas y Naturales, Universidad Tecnica Particular de Loja (UTPL), 110107 Loja, Ecuador
*
Author to whom correspondence should be addressed.
Forests 2022, 13(11), 1940; https://doi.org/10.3390/f13111940
Submission received: 14 September 2022 / Revised: 10 November 2022 / Accepted: 12 November 2022 / Published: 17 November 2022
(This article belongs to the Section Genetics and Molecular Biology)

Abstract

:
The diversity of genetic resources is essential to cope with environmental changes. However, despite forests play a crucial role in mitigating changes, genetic knowledge has scarcely been used for forest conservation. In this study, we used nuclear microsatellites to understand the patterns of genetic diversity and population genetic structure in Ocotea rotundata van der Werff (Lauraceae), an endemic Ecuadorian tree, highly affected by habitat changes and fragmentation. Our results show high levels of genetic diversity, except in one population. The level of genetic differentiation between populations was low and genetic clusters showed no apparent spatial pattern. In fact, a high degree of genetic admixture was found between most populations. Migration rates were asymmetric but overall high, except in one population, where outgoing gene dispersal was limited. Nevertheless, allelic fixation values suggested a general deficit in heterozygotes, probably due to an increase in the levels of mating between close relatives. Although long-lived organisms, such as trees, can often accumulate a surprising amount of genetic diversity, the results found here could be an early sign of a decline in the diversity of O. rotundata. These findings provide baseline information on genetic resources to support future restoration programs to mitigate the impacts of changes in O. rotundata populations.

1. Introduction

Forest trees cover almost 30% of the terrestrial surface of the earth, from boreal to tropical latitudes, being responsible for 3/4 of the terrestrial biomass and crucial to the global carbon cycle [1]. Forests are expected to play an important role in climate change mitigation but their adaptative potential depends on the variability of forest genetic resources [2,3,4]. Understanding how forest trees cope with environmental changes and the impacts that changes might have on their genetic diversity are crucial questions, but they remain largely unexplored and very few conservation strategies have empirically considered genetic information [1,5].
Maintaining the variability in genetic resources is a fundamental issue in the context of changes but this is often a complex subject in long-lived species, since long-distance gene flow between patches might occur, buffering the effects of inbreeding and genetic drift [6,7]. In trees, somatic mutations can also occur, being transmitted to the offspring, and promoting increases in genetic diversity [8]. Consequently, high genetic diversity has been reported in many trees, such as Koompassia malaccensis Maingay ex Benth. [9], Cercis canadensis L. [10], and Shorea leprosula Miq. [11]. Nevertheless, gene flow needs to be recurrent throughout generations or from multiple population sources to maintain adequate levels of genetic diversity and the presence of rare alleles [10,12]. Thus, isolation and small population size can affect genetic diversity, even in the case of wind-pollinated species (e.g., Fagus sylvatica L. [13]; Juniperus communis L. [14]; Polylepis incana Kunth [15]). Unlike ecosystems where community dynamics are relatively fast, these processes might be harder to detect in forests as it takes several generations to reach a critical threshold [16]. The effects of disturbance in the gene flow of tree species are even harder to understand in tropical forests, since they are well under-represented in genomic studies, aside from a few commercially important species [17,18]. Nevertheless, fragmentation and deforestation in neotropical forests due to clearance and land conversion for agriculture are major drivers of biodiversity loss, contributing to global warming [19]. Ecuador is one of the most biodiverse countries in the world but has one of the highest deforestation rates in South America [20,21]. Drivers of deforestation and fragmentation include, predominantly, land conversion to agriculture, but also pastures to livestock, road development and infrastructures, and oil extraction [22,23]. In addition to forest loss, many species occur in small, irregular, and fragmented populations with a decreasing patching size, due to agriculture, development, and mining activities [20,21,24].
In this study, we focused on Ocotea rotundata van der Werff, an endemic Ecuadorian tree. This species has a restricted distribution in the high Andes mountains, with populations occurring in five tropical forest patches, in the South Ecuadorian provinces of Loja and Zamora-Chinchipe [25,26,27,28] (Figure 1). Ocotea species are a wide genus within the Lauraceae family, with 350–400 species distributed in tropical and subtropical areas of the Americas, including the Caribbean and West Indies, but with some species also occurring in Africa, Madagascar, and the Mascarene Islands [26,27,29]. In Ecuador, ca. 48 species of Ocotea have been reported [30], many narrowly distributed in fragmented populations [26]. Ocotea species are often pollinated by insects, such as thrips, which have a limited flight ability, constraining the dispersion of pollen at long distances [31,32]. Species often show low levels of regeneration through seedlings [33], being highly affected by land logging and exploitation [34]. Many Ocotea species, including O. rotundata, are widely used in Ecuador due to the quality of the timber [35]. Several parts of the tree, including bark, fruits, and leaves have aromatic properties [30], being used as a spice and in traditional healing practices [36].
Ocotea rotundata was considered a relatively common species in Ecuador due to the high number of trees per population [27]. However, the species is now included in the IUCN Red List as Vulnerable due to a continuing decline in area, extent, and/or quality of habitat [25]. Deforestation and habitat fragmentation by mining have recently increased forest loss in South Ecuador, especially in indigenous lands where legal and illegal activities often occur [23,37]. Despite the close location to the Podocarpus National Park, a high number of mine concessions operate in the south of Ecuador, where O. rotundata populations occur [38]. The Podocarpus National Park is a known landmark of species conservation, featuring more than 4000 plant species (approximately 40% are endemic) and having a very low level of deforestation within its boundaries [21]. Nevertheless, between 1990 and 2018, at least 4% of deforestation occurred within the boundaries of protected Ecuadorian areas and up to 25.5% in buffer zones [23]. Land changes in this region are also occurring at a fast rate. Between 1975 and 2001, 20% of the forests occurring in the study area were converted into pasture fields, especially patches close to roads [39]. During the same period, fragmentation in the area also increased as forest patches increased from 66 to 581 and the mean forest patch size decreased from 433 to 34 ha [39]. To reduce the high levels of deforestation, Ecuador has recently promoted several initiatives aimed at developing sustainable practices, restoring habitats, and conserving biodiversity [40]. The implementation of conservation measures and the management of fragmented populations should consider the levels of genetic diversity and the genetic structure of populations, but this is unknown for most species.
In this study, we developed nuclear microsatellites (nSSRs) to determine the patterns of genetic diversity, population structure and differentiation, and the level of inbreeding in Ocotea rotundata populations. We specifically asked: (1) Is genetic diversity uniform across the populations of O. rotundata? (2) Is gene flow occurring between populations and do they show any asymmetric patterns in the magnitude and direction of gene flow? (3) How are populations structured genetically and do they show any evidence of spatial structure? The results provide valuable information to assist conservation actions and the establishment of guidelines for the conservation of O. rotundata.

2. Materials and Methods

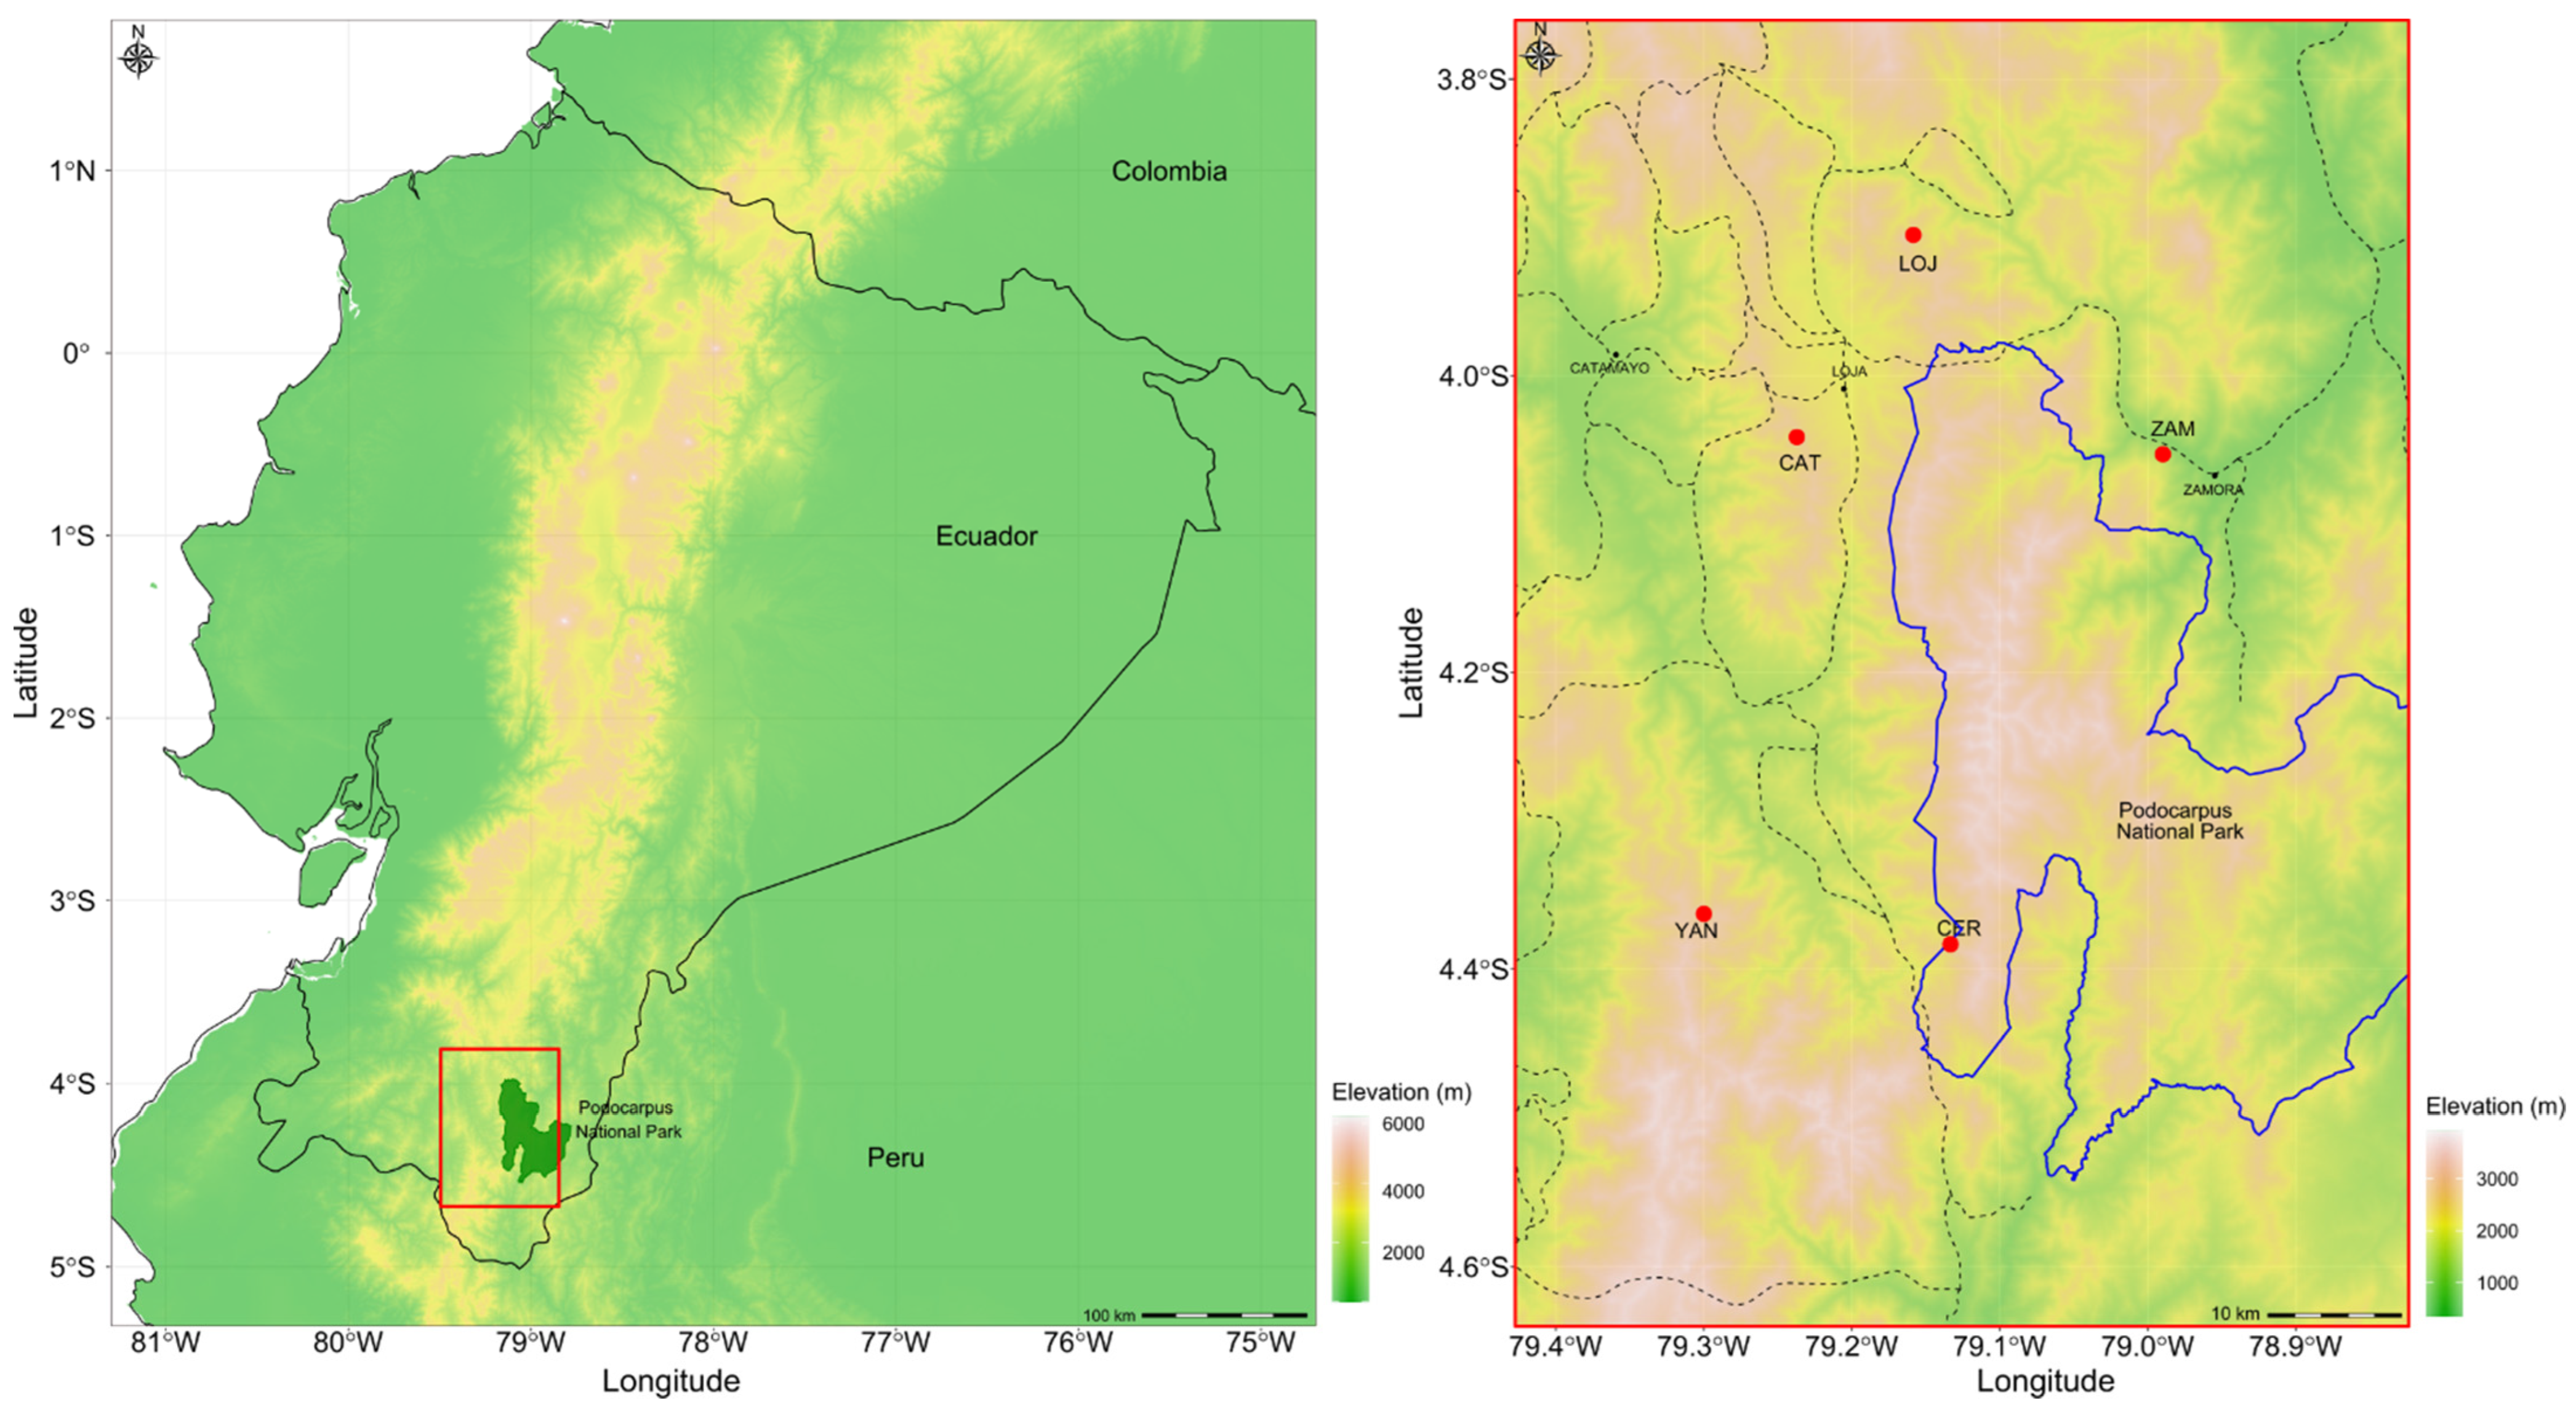
2.1. Population Sampling

Sampling occurred in all the five known populations of Ocotea rotundata van der Werff described for the Southern Ecuadorian provinces of Loja and Zamora-Chinchipe [25,26,27] targeting a total of 140 adult trees (Figure 1). Following [31], individuals with a DBH higher than 5 cm were considered to be adult trees. Leaf samples from 25–30 adult plants were collected in each population representing a sample of all recorded adult trees. Except for the population of ZAM that occurs very close to city roads, the remaining ones occur in apparently well-conserved patches within the tropical forest and one within the buffer zone of the Podocarpus National Park (Figure 1). As part of a general study aimed at understanding the distribution of Ocotea species in Ecuador and status of its populations, we also quantified the number of adult trees in each population. The total number of adult trees recorded in each population was LOJ = 1341, CER = 1336, YAN = 1289, CAT = 2750, and ZAM = 2830. Despite intensive field searches, no other populations of O. rotundata were found. This species differentiates very well from other Ocotea due to its broad leaves that have a ferruginous indument and secondary veins. Flowers are creamy to pale yellow and pubescent, especially when they are young. Fresh leaves were collected in silica gel, brought to the laboratory, and stored at −80 °C until DNA extraction.

2.2. DNA Extraction and Development of nSSRs

Total genomic DNA was extracted using the DNeasy™ Plant Minikit (Qiagen, Hilden, Germany) following the manufacturer’s instructions and stored at −80 °C. Two small, inserted libraries digested with HaeII and RsaI enriched with (CT)n sequences were constructed using the DNA of O. rotundata. DNA fragments were ligated into a p-GEM-T Easy Vector following the manufacturer’s instruction and the plasmids were transformed into Escherichia coli cells (Promega, Madison, WI, USA). The cloned fragments were amplified using the M13 forward and reverse primers from the plasmid DNA of positive clones and PCR sequenced as followed: 3 min at 94 °C, followed by 45 cycles at 94 °C for 1 min, annealing at 53 °C for 1 min, 2 min at 72 °C, and 5 min at 72 °C. A total of 88 clones was isolated from the two libraries (48 from HaeII and 40 from RsaI), from which 68 showed a positive hybridization signal. From those, readable sequences were obtained from 63 clones, all containing the repetitive sequences. Finally, 15 sequences were rejected due to the proximity of the microsatellite at the end of the sequence. Primer 3 [41] was used to develop primers based on the remaining 48 sequences. DNA sequencing was performed in both directions in an Applied Biosystems 3730 DNA Analyzer (Applied Biosystems, Foster, CA, USA).

2.3. nSSR Amplification

We tested the amplification of primers in 10 samples (2 from each population). From these, 18 did not amplify, 10 were not reproducible, and 10 were monomorphic across samples. The remaining 8 primers produced robust, highly polymorphic amplified bands and were, therefore, used to genotype all O. rotundata samples (Table 1). Amplifications were performed in 15 μL reactions containing 1.25U MyTaq DNA polymerase and 1X MyTaq Reaction Buffer (meridian Bioscience, London, UK), 0.4 μM Primer F-FAM and R, and 100 ng of genomic DNA under the following PCR conditions: initial denaturation at 94 °C for 5 min, followed by 35 cycles of denaturation at 94 °C for 1 min, specific annealing temperature for 30 sec, followed by 72 °C for 1 min, and a final extension at 72 °C for 5 min. Genotyping of microsatellite fragments was conducted on AB 3500 Genetic Analyzer (Life Tecnologies Inc., New York, NY, USA). Allele sizes were determined using GeneMarker 3.1. (Softgenetics, State College PA, USA) based on the size standard GS-600 LIZ (Life Tecnologies Inc., NY, USA). All loci were checked for the presence of null alleles using MICRO-CHECKER v.2.2.3 [42]. For each microsatellite locus, genetic diversity was assessed by calculating the mean number of alleles (A), the mean expected heterozygosity (He), and the mean observed heterozygosity (Ho) using GenAlEx v6.51 [43]. Departures from Hardy–Weinberg equilibrium (HWE) were also performed within each locus estimating F values with 900 randomizations using FSTAT 2.9.3.2 [44]. To calculate the extent of linkage disequilibrium between pairs of loci (LD) we set dememorization numbers at 10,000 and performed 100,000 iterations for all permutation tests (exact tests) in Genepop [45]. In all analyses, significant values were corrected for multiple comparisons by Bonferroni correction [46].

2.4. Genetic Diversity and Differentiation

For each population, genetic diversity was assessed by calculating the mean number of alleles (A), the mean number of effective alleles (Ae), the number of private alleles (Apr), the mean expected heterozygosity (He), the mean observed heterozygosity (Ho), and the mean allelic fixation index (F) using GenAlEx v6.51 [43]. Significant differences between populations were tested using an ANOVA followed by a post hoc Tukey’s test (p < 0.05). Departures from Hardy–Weinberg equilibrium (HWE) were also performed within each population estimating F values with 900 randomizations using FSTAT 2.9.3.2 [44]. Significant values were corrected for multiple comparisons by Bonferroni correction [46].
The partitioning of genetic diversity among populations (FST) and within populations (FIS) was analyzed using Wright’s F statistics [47]. To test for significant differences in genetic partitioning among populations, population differentiation (PhiPT) was calculated using GenAlEx 6.51 [43]. We also used an analysis of molecular variance (AMOVA) to quantify the partitioning of genetic variance using Arlequin 3.11 with a significance level of 0.05 after 10,000 permutations [48]. The coefficient of genetic differentiation (Gst) and gene flow (Nm = 0.5(1 − Gst)/Gst) was estimated for total populations using POPGENE 1.32 [49]. Additionally, pairwise relative migration rates were estimated using Alcala’s Nm [50]. The directionality of differentiation was estimated according to [51], using the ‘diveRsity’ package in R [52] and plotted against the map of populations sampled.

2.5. Genetic and Spatial Population Structure

To understand the existence of discrete genetic structure among samples, we used STRUCTURE v.2.3.4 [53] assuming clusters from K = 1 to K = 8, with 10 repetitions per K. Models were run assuming ancestral admixture and correlated allele frequencies using run lengths of 300,000 steps for each K after a burnin of 50,000. The optimum K was determined using STRUCTURE HARVESTER [54], which identifies the optimal K based on both the posterior probability of the data for a given K and the ∆K [55]. The results of the replicates at the best-fit K identified by STRUCTURE were post-processed using CLUMPP 1.1.2 [56]. A principal component analysis (PCoA) was also constructed in GenAlEx 6.51 [43] to detect the genetic relatedness among individuals based on Nei’s genetic distance.
Spatial genetic structure (SGS) was assessed using the spatial autocorrelation and the Sp statistic using SpaGeDi 1.5a [57]. Spatial autocorrelation was computed as a multi-locus kinship coefficient Fij between individuals against their physical distance [58] and averaged for eight distance intervals. To test for the significance of SGS, deviations from the null hypothesis, which assumed no spatial genetic structure, were assessed by 10,000 permutations of spatial distributions. The Sp statistic was calculated as defined by [59].

3. Results

3.1. Diversity between Loci

The mean number of alleles ranged between two in Orot5 and eight in Orot32 (Table 1). For each locus, observed heterozygosity values ranged from 0.13 to 0.62 and expected heterozygosity ranged from 0.11 to 0.145 (respectively, for loci Orot21 and Orot8). Significant departures from HWE were detected in two loci: Orot21 and Orot22. No null alleles were detected. Pairwise comparisons between loci showed no significant disequilibrium (p > 0.05), revealing that all loci were assorted independently at the different loci.

3.2. Genetic Diversity and Differentiation in Ocotea rotundata

An average of 9.84 ± 2.40 alleles was found among 140 O. rotundata samples, with significant differences being found between populations because ZAM showed a very low number of alleles (F = 26.7, p < 0.05; Table 2). The same pattern was found when considering the mean number of effective alleles (F = 14.1, p < 0.05) and the mean number of observed (F = 11.5, p < 0.05) and expected heterozygosity values (F = 13.2, p < 0.05). Diversity values were overall high, except in ZAM, which showed particularly low levels of diversity. Only two private alleles were found in this population while the remaining populations showed a higher number of private alleles (F = 35.1, p < 0.05; Table 2). Mean allelic fixation values were always significantly greater than zero in all populations (p < 0.05).
Genetic differentiation between populations was low (FST = 0.082) but moderate within populations (FIS = 0.351). The coefficient of genetic differentiation among populations (Gst) was 0.161 according to POPGENE. AMOVA revealed that most of the genetic diversity found was explained by variance within populations (83%), the remaining being portioned among populations.
PhiPT and the gene flow (Nm) between populations were 0.104 (p < 0.001) and 1.68, respectively. Pairwise migration rates between most populations were very high (Figure 2). The highest incoming and outgoing rates of exchange were found between neighboring populations, such as YAN and CER and CAT and LOJ. High outgoing migrations were also found from CER to the remaining populations, while a lower incoming rate was recorded from the farthest populations of CAT, LOJ, and ZAM. ZAM exhibited very low outgoing migration rates to all populations, contrary to incoming rates (Figure 2).

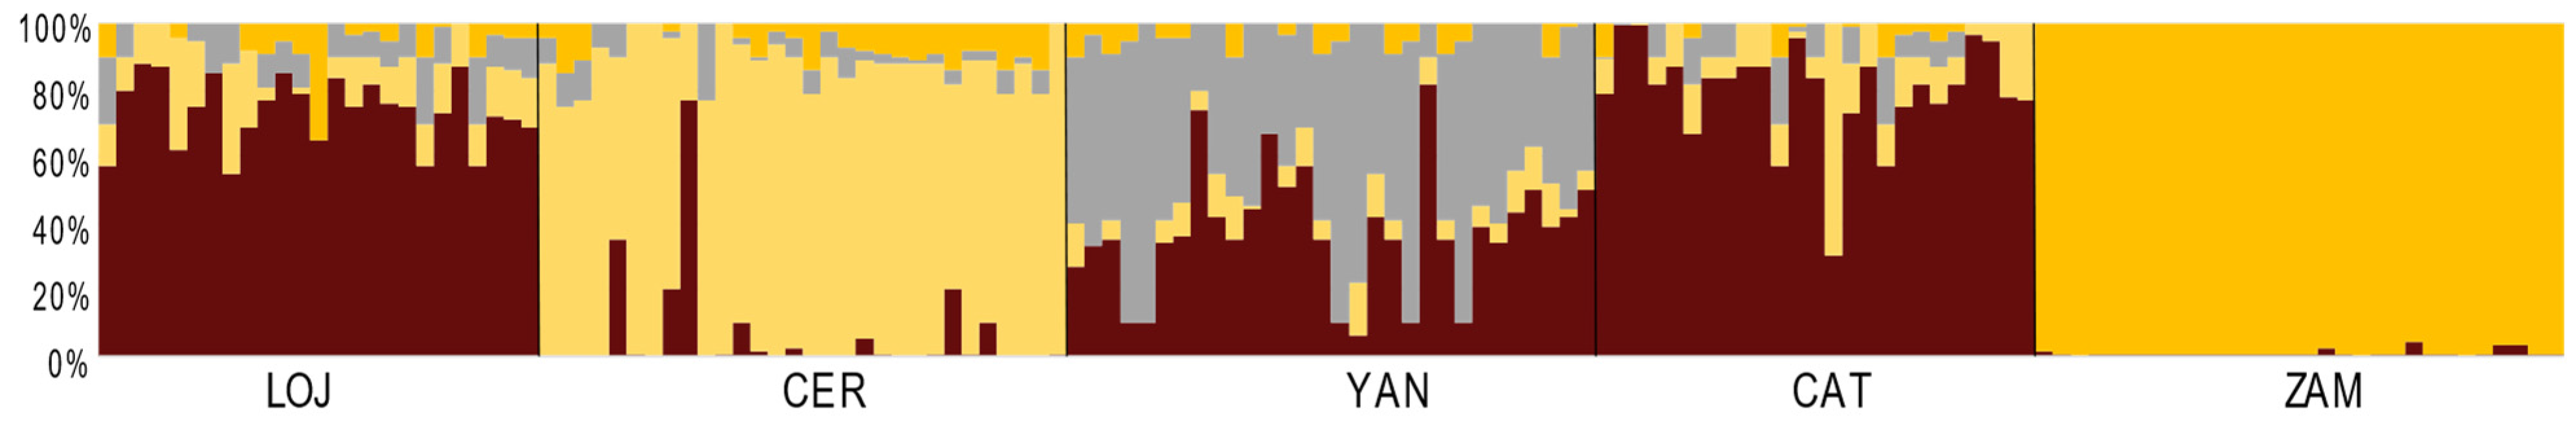
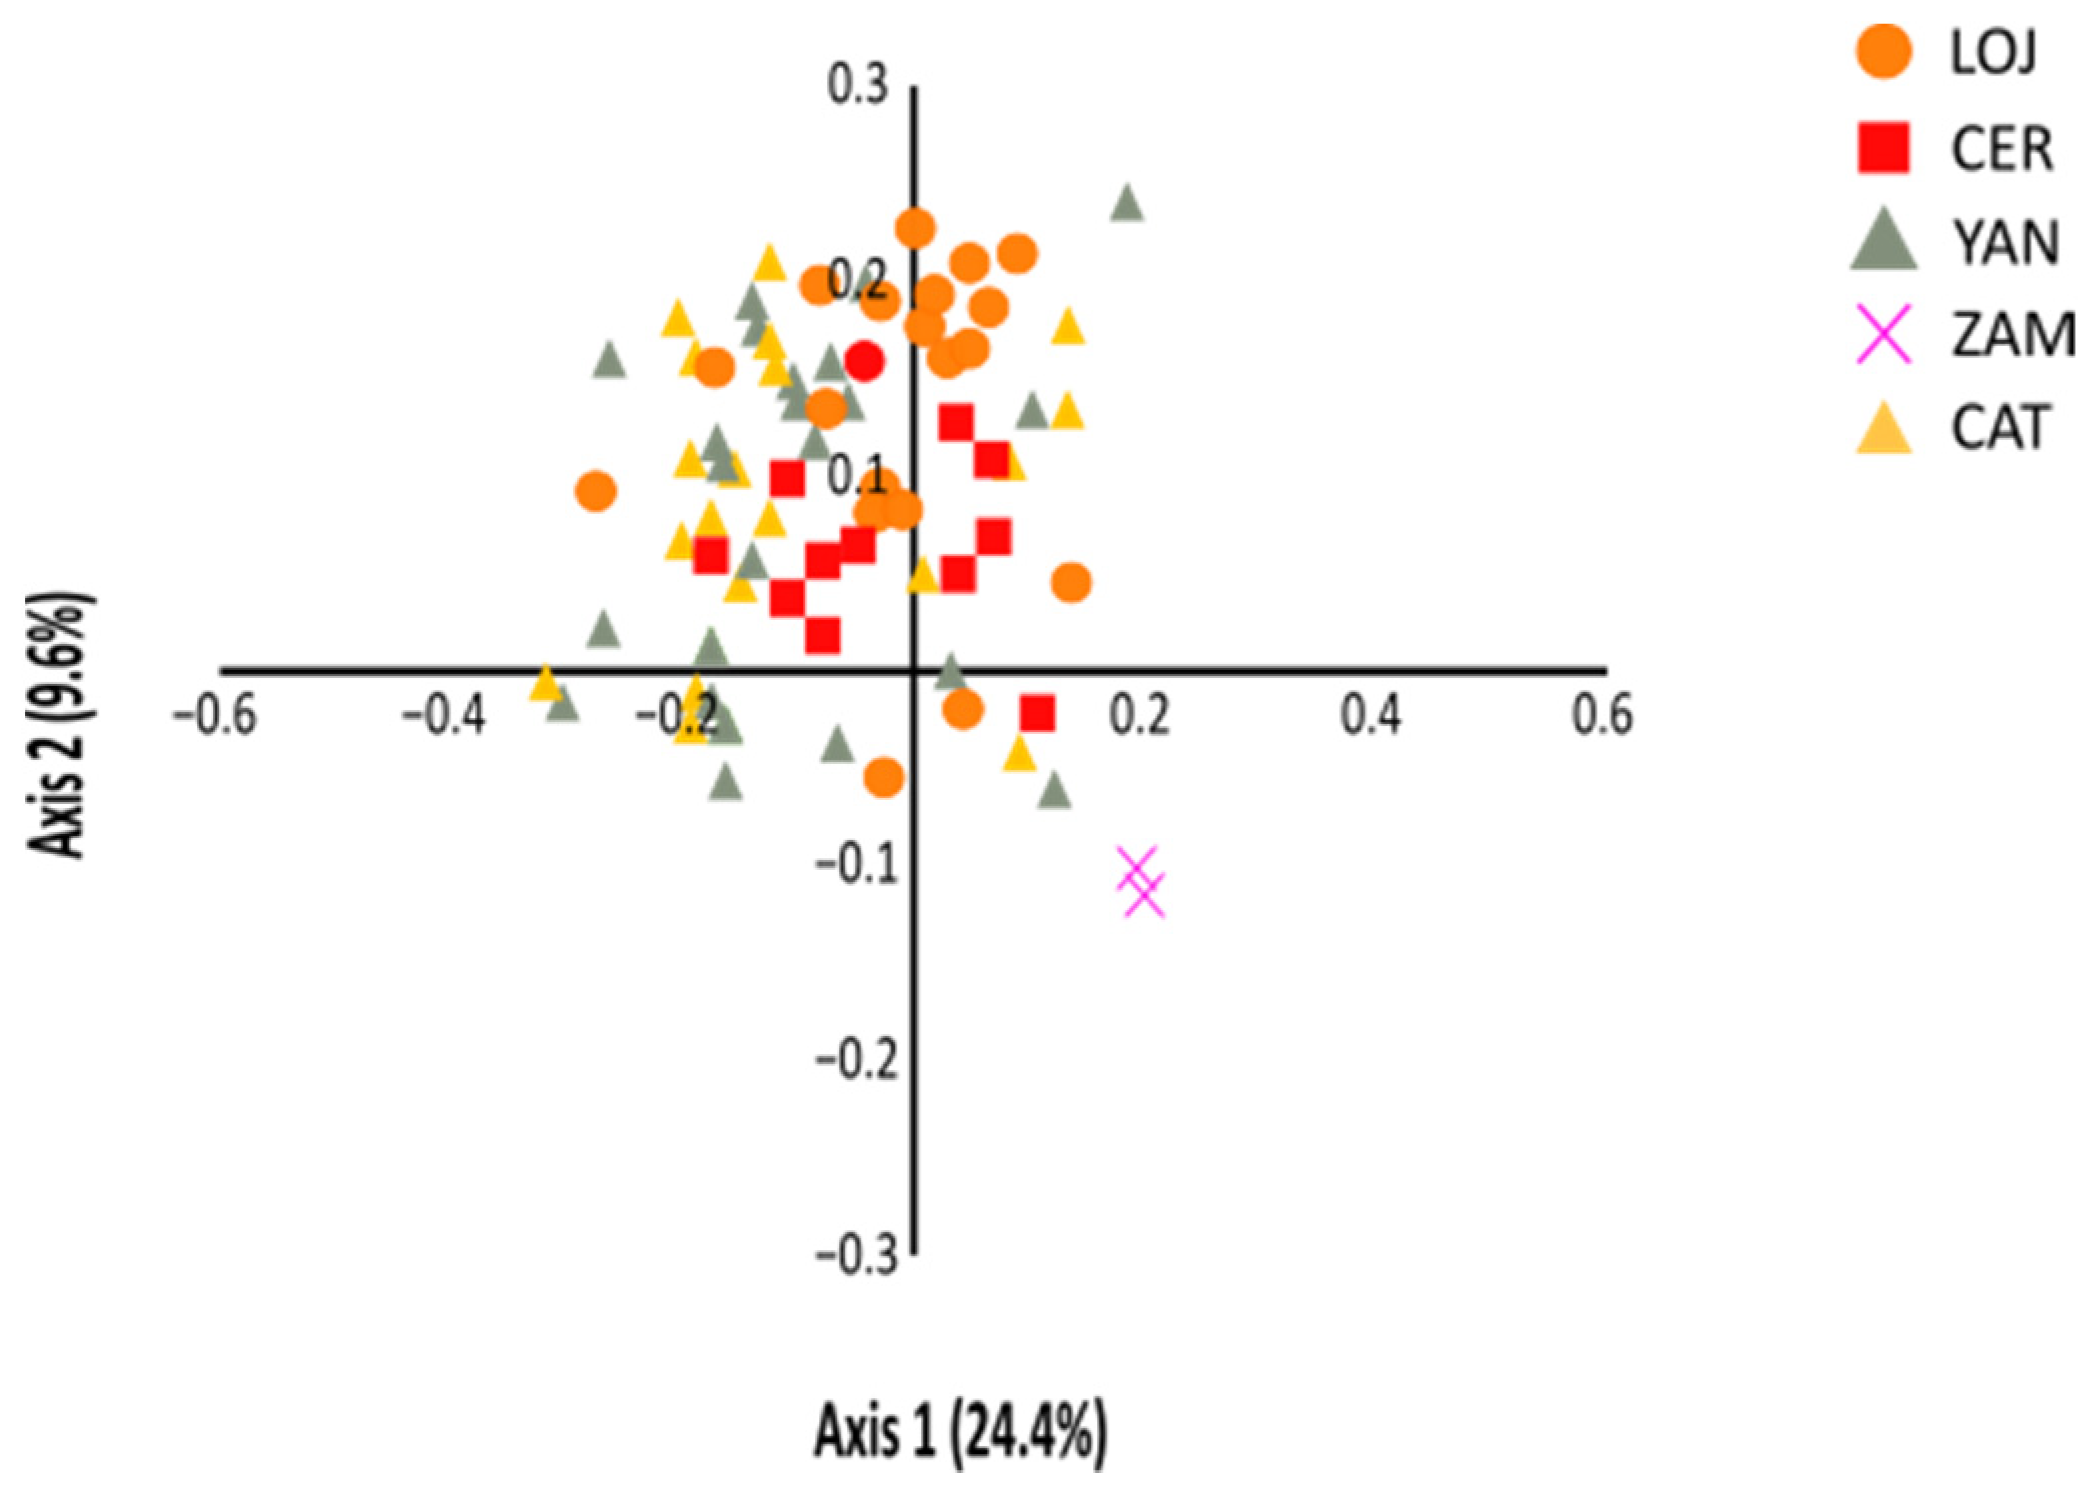
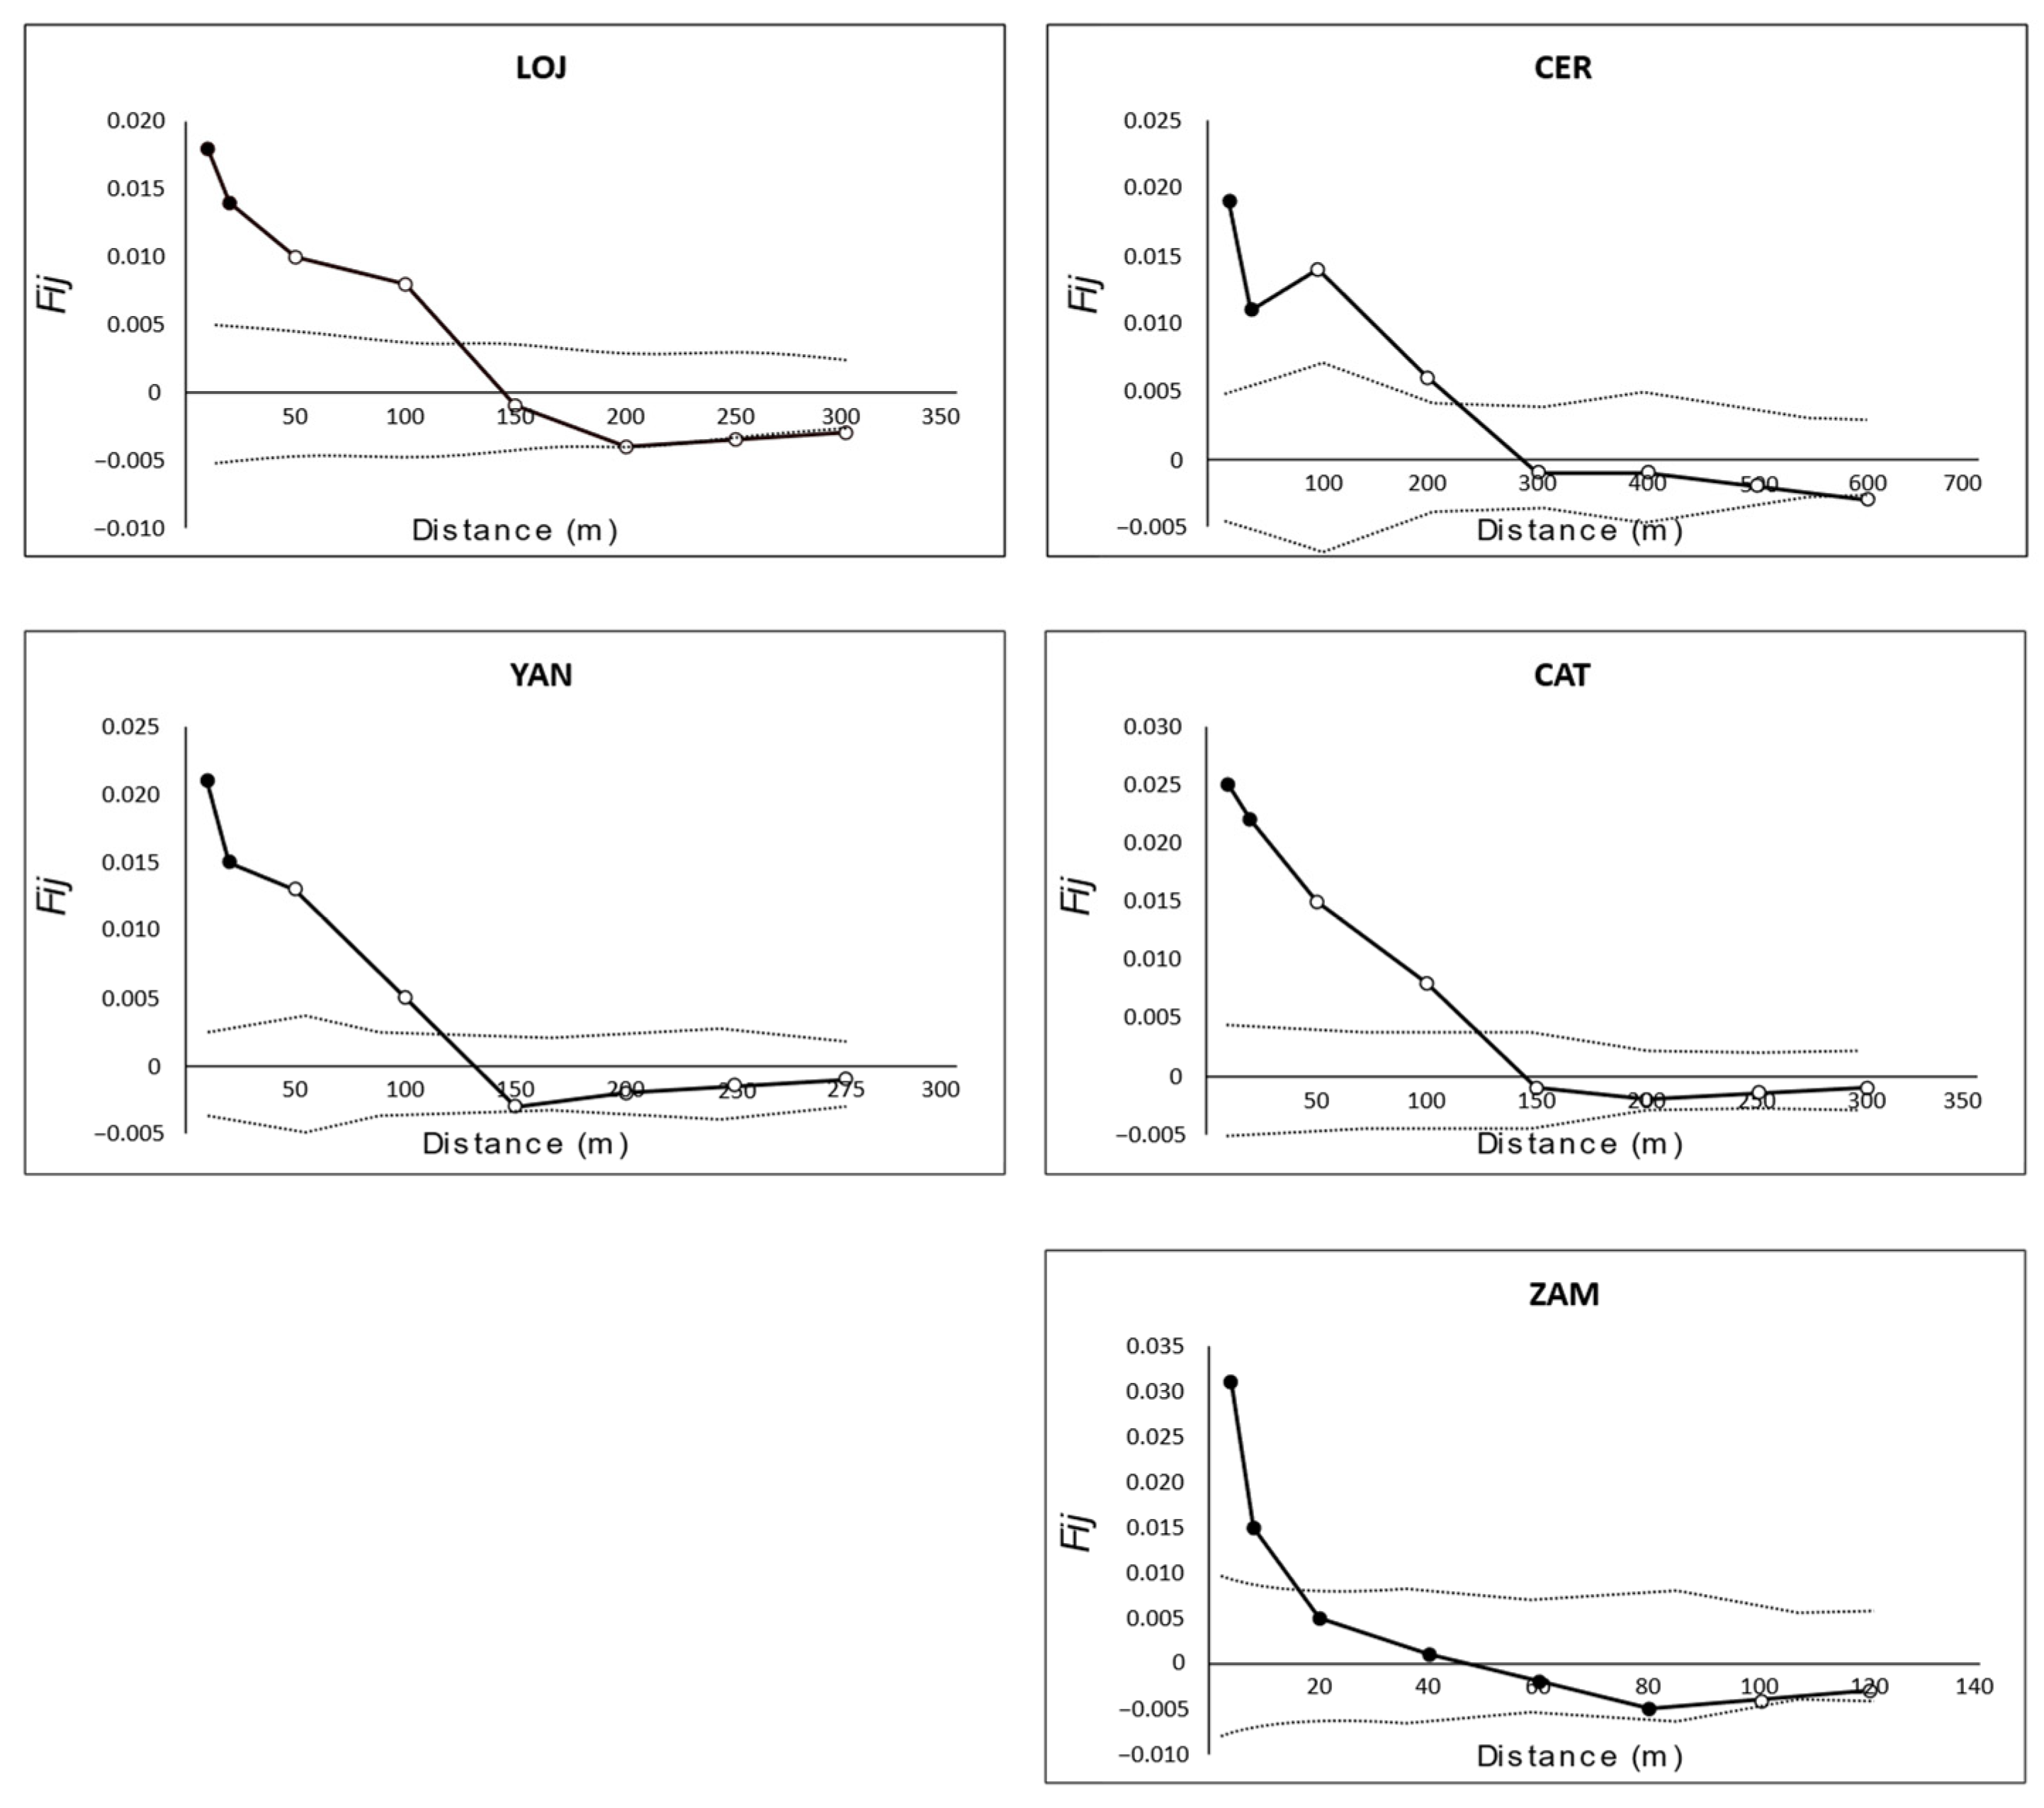
3.3. Genetic and Spatial Population Structure

The Bayesian clustering program STRUCTURE suggested the existence of four genetic groups based on LnP(D) and ΔK values (Figure 3). A high degree of genetic admixture was found between most O. rotundata populations (Figure 3). Nevertheless, a dominant genetic cluster was found in CER that was different from the prevalent ones that characterized LOJ, YAN, and CAT. Further, ZAM was the only homogeneous genetic population. Overall, this same pattern was found in the principal coordinate analysis (PCoA), where no specific clusters were found, with the exception of ZAM (Figure 4).
Spatial autocorrelation analyses using SPAGeDI detected significant SGS at the shortest distances in most populations of O. rotundata: 25–50 m (Figure 5). The strongest SGS was found in ZAM since it showed the highest pairwise kinship (Fij) and almost all distance classes showed significant SGS (up to 80 m; Figure 5). Further, in ZAM, a pronounced negative slope of Fij values was detected in the first distance class (up to 10 m). This was also reflected in a higher Sp statistic in this population (Sp = 0.026) than in the remaining ones (LOJ = 0.016; CER = 0.011; YAN = 0.013; CAT = 0.018).

4. Discussion

4.1. High Genetic Diversity in Ocotea rotundata

Our study revealed the existence of high levels of genetic diversity in O. rotundata, despite the low number of populations. Diversity was higher than the heterozygosity values found in other threatened species of Lauraceae as Litsea auriculata S.S. Chien & W.C. Cheng (Ho = 0.33 to 0.50; [60]) or Cinnamomum balansae Lecomte (Ho = 0.14 to 0.34; [61]) and especially when considering exploited tropical trees, such as Warburgia salutaris (Bertol.) Chiov. (Ho = 0.45 to 0.61; [62]) or Chinchona officinalis L. (Ho = 0.58 to 0.68; [63]). Truly, many life factors, including the type of breeding system, biogeography, and dispersal, might influence genetic diversity values [64]. However, when compared with other Ocotea species, the values reported in this study were higher than the ones found in three threatened Brazilian species, O. odorifera (Vell.) Rohwer (Ho = 0.63), O. porosa (Nees & Mart.) Barroso (Ho = 0.52), and O. catharinensis Mez (Ho = 0.57), in a genetic study also using microsatellite markers [31]. The number of alleles, including the expected ones and the number of private alleles reported in our study, were also higher than the ones found in the threatened Brazilian species, which occur in heavily harvested populations that are experiencing important reductions in size [31]. For instance, Brazil exported more than 176,000 tons of O. catharinensis wood between 1944 and 1951, leading to a rapid population decline [31]. That is not the case of O. rotundata, as the main constraints to its survival are the recent changes and the level of fragmentation occurring in its habitat due to mining and land conversion into pasture fields [39]. This would explain the low level of heterozygosity and the low number of alleles found in ZAM since this population occurs near the city and is very close to roads that have been updated in the last few decades. The lower number of adult plants recorded in this population probably caused a genetic drift [65], which could have removed enough genetic variation in ZAM when compared with the other populations.
Assessment of the impact of habitat changes in the genetic diversity of long-lived trees is a big challenge and has often failed to detect a genetic response [6,7]. Indeed, a review of the genetic consequences of habitat degradation on neotropical trees found no significant differences between disturbed and control populations in most of the studies (9 out of 13), except when analyzing progeny inbreeding (6 out of 8), reproductive output (7 out of 10), and fitness (all 6) [66]. These studies highlight how genetic diversity might slowly be lost throughout generations, with impacts that, in the case of trees, may only be felt after centuries [67]. In our study, we also found that the allele fixation index was significantly positive in all populations of O. rotundata, indicating a deficit in heterozygotes, probably due to inbreeding. This small, but already detectable, effect on genetic diversity might represent an early signal of an increased loss of diversity in these populations. Future studies focused on seeds or juveniles combined with parental analysis are, therefore, recommended to highlight the genetic health of O. rotundata populations.

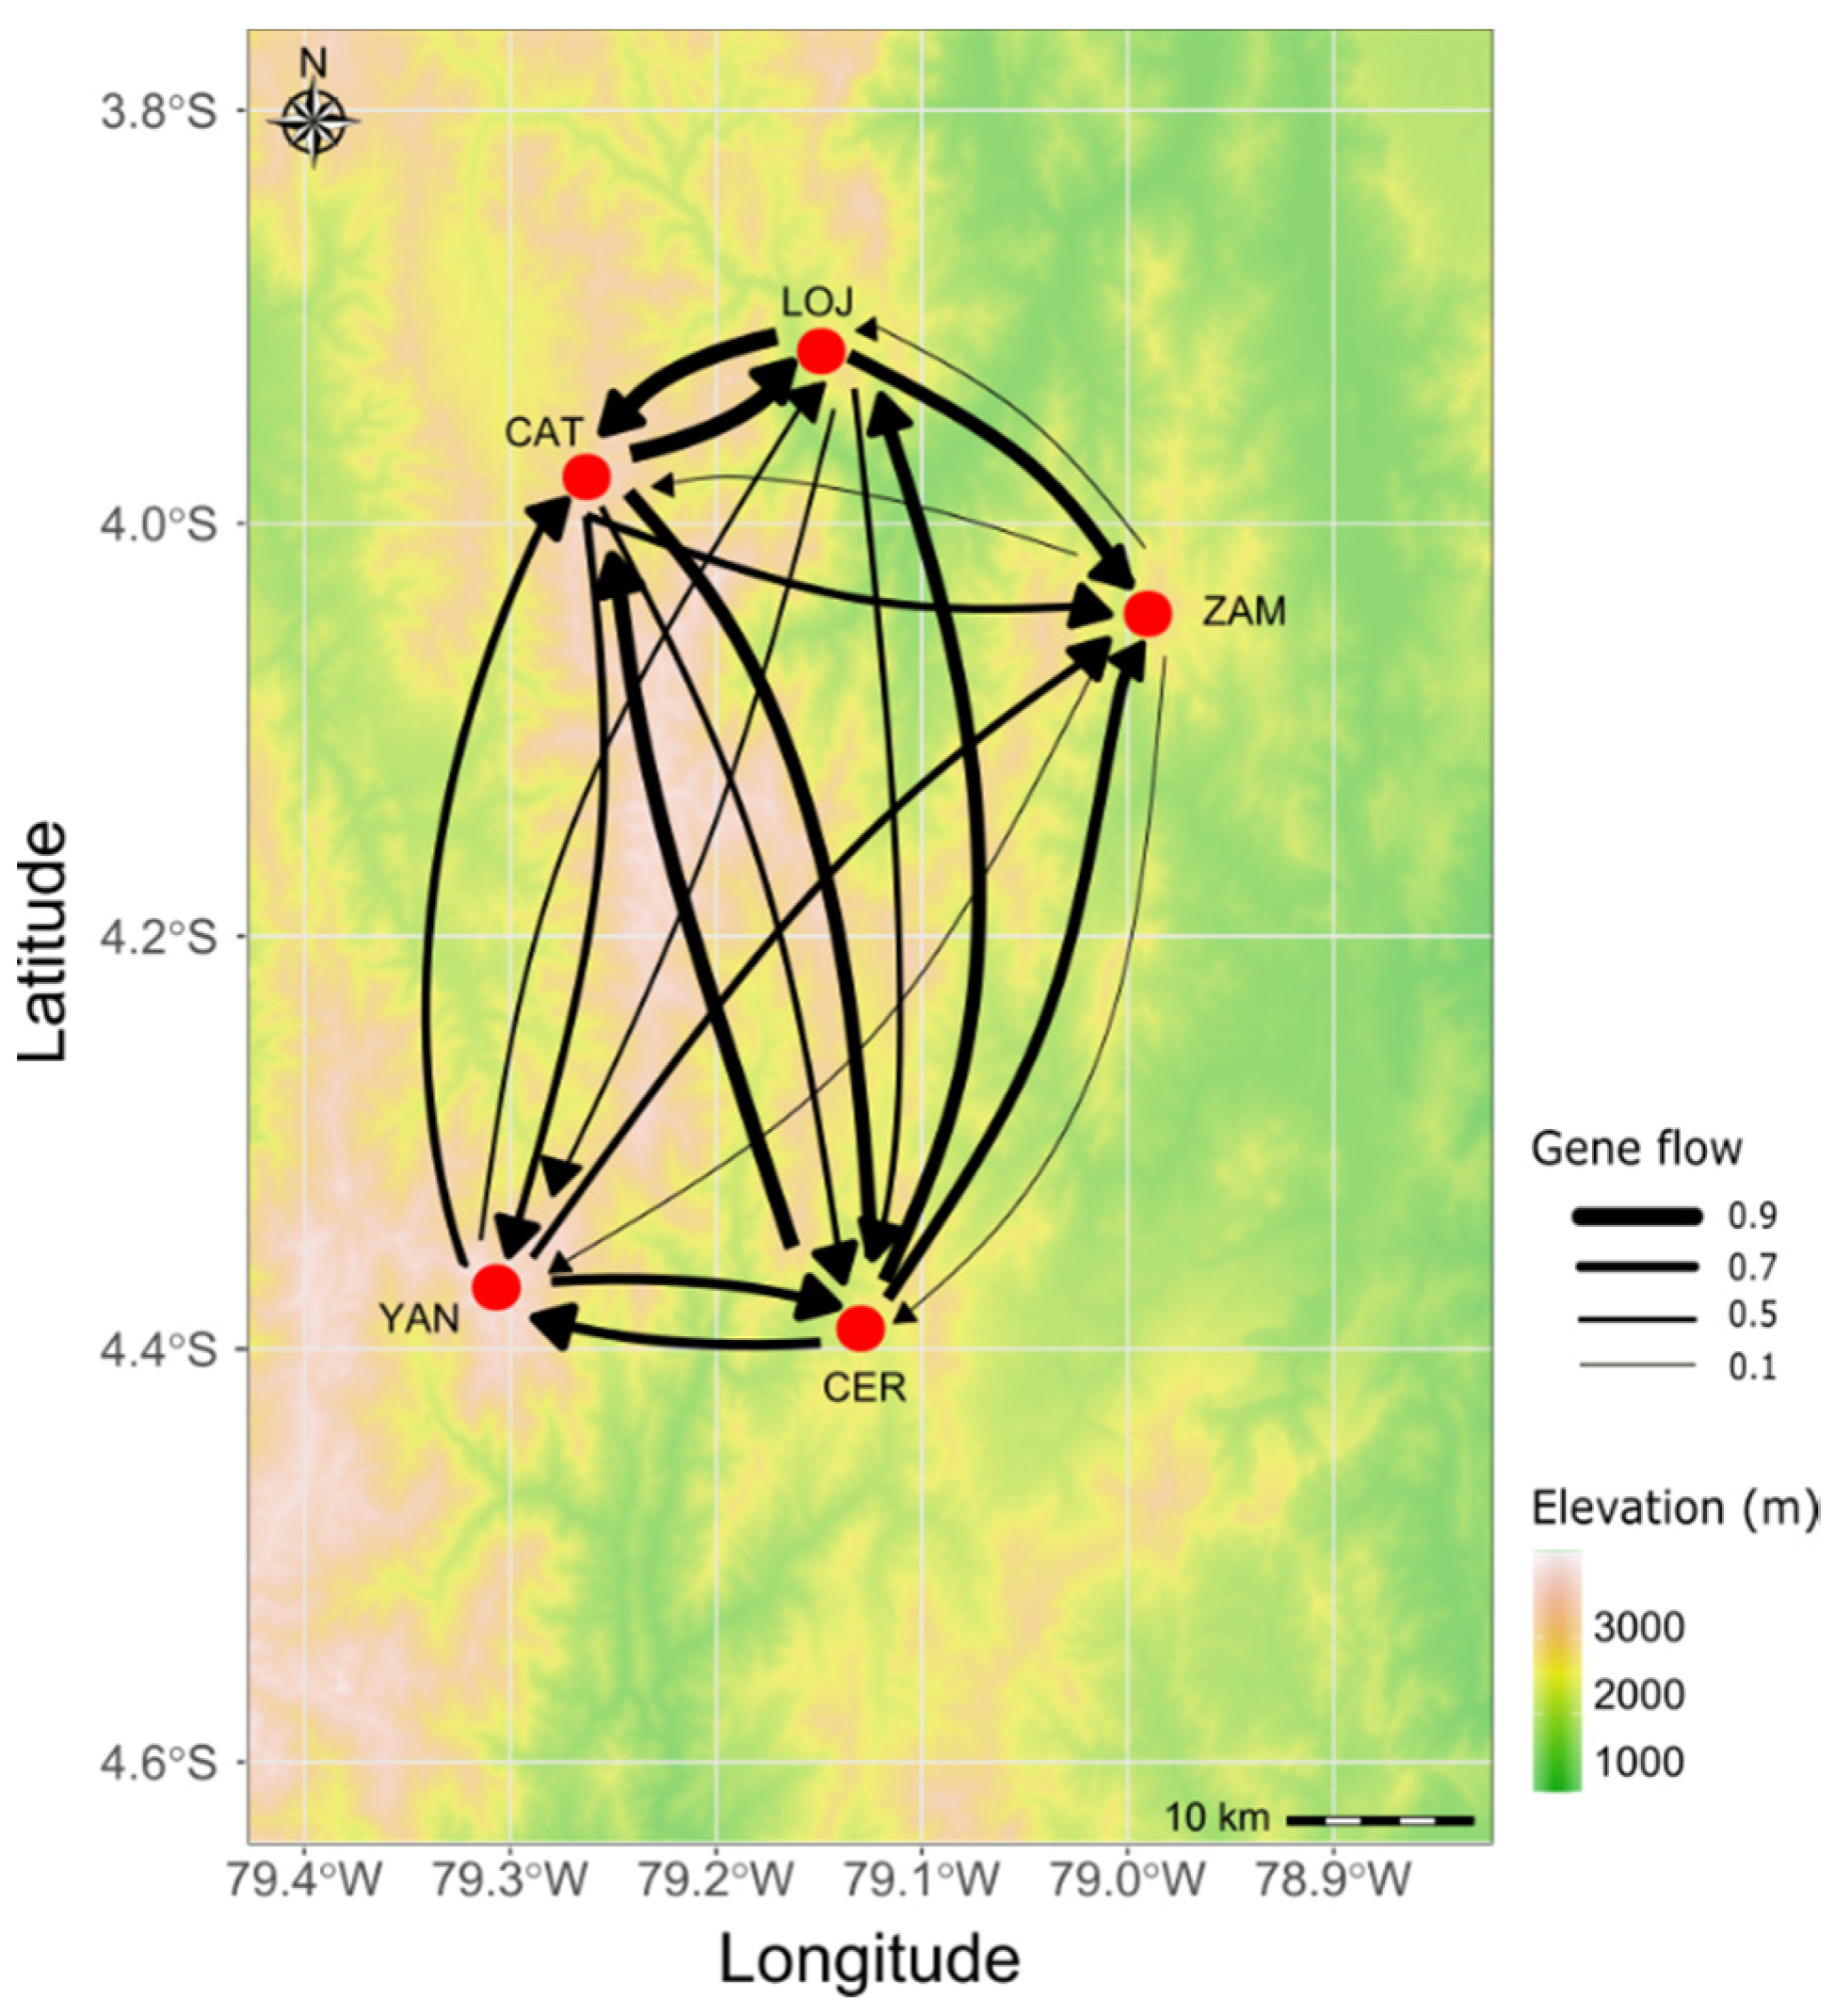
4.2. Low Differentiation and High Gene Flow between (Most) Populations

In small and fragmented populations, genetic divergence is often increased because of reduced gene flow and strong genetic drift [68,69]. However, the opposite was found in O. rotundata, since genetic differentiation between populations was low (FST = 0.082). The levels of population differentiation reported here were lower than the ones found in O. porosa (FST =0.116) and O. catharinensis (FST =0.148) but similar to O. odorifera (FST =0.086). Even lower differentiation levels have been also reported in other trees, such as Quercus variabilis BI. (FST = 0.046) [70] or Castanopsis fargesii Franch. (FST = 0.031) [71]. This could be explained through high gene flow between populations. In fact, when Nm is higher than one, as reported here (Nm = 1.68), it suggests that enough gene flow is, or has been, occurring, which can prevent genetic differentiation between populations [47]. This would explain why genetic diversity in O. rotundata populations showed no clear geographic pattern and why a high level of genetic admixture was found between most populations, except ZAM. The existence of high gene exchanges in O. rotundata was supported by the high migration rates found between populations, except for ZAM, where the lowest outgoing rates were found. Habitat disturbances and fragmentation strongly influence genetic drift, gene flow, and inbreeding, which could explain the reduction in the levels of gene flow from ZAM to the other populations and the low level of admixture according to STRUCTURE and PCoA analyses. Fragmentation can impose restrictions on seed dispersal and crossing between close relatives, ultimately leading to an enhancement in SGS throughout distances [72,73], such as the one found in this population. Remarkably, CER seems to act as an important genetic source to all populations due to its high levels of outgoing migration rates but, at the same time, seems to be receiving less gene flow from all remotest populations. CER was found to be genetically different from the remaining populations according to STRUCTURE results, and the dominant genetic group found in CER was not prevalent in other populations. This might suggest an active role of local adaptation throughout the species distribution [3]. However, the close location of the Podocarpus National Park to CER could have helped to maintain, or at least shape, some differences in the patterns of genetic structure found in this population.
The reproductive biology and breeding system of O. rotundata are yet unknown but many species within the family Lauraceae are outcrossing [74]. Contemporary gene flow in Ocotea is often facilitated by native pollinators [75], the action of new pollinators [76], or through wind dispersion of pollen [77]. An efficient frugivorous community has also been reported to be an important disperser of seeds between forest patches [78]. Here, significant SGS was only prevalent at the shortest distances, except in the population of ZAM. Restricted seed dispersion and the possibility of mating between close relatives could explain the high pairwise kinship found in the first distance class due to the spatial clustering of siblings. However, the overall differences in SGS found between most populations and ZAM could be explained, as mentioned above, by the smaller population size and its location in a more disturbed area. The range of Sp values estimated for O. rotundata populations (Sp = 0.011–0.026) was higher than the mean values reported by [59] for outcrossing species (Sp = 0.0126), being closest to the levels of species with a mixed mating (Sp = 0.0372). The values found in O. rotundata were close to the ones reported for other neotropical trees that have mixed mating systems, such as Theobroma cacao L. (Sp = 0.018 [79]) or Anadenanthera colubrina var. cebil (Griseb.) Altschul (Sp = 0.023 in saplings and 0.009 in adults [80]), suggesting the possibility of a mixed mating system in O. rotundata. Sp values reported here were also higher than the ones reported by [59] for species with seeds dispersed by animals (Sp = 0.0088), being closest to wind-dispersed (Sp = 0.0120) and gravity-dispersed seeds (Sp = 0.0281), which would indicate autochory as the main factor contributing to explaining seed dispersal in O. rotundata, contrary to the existence of a frugivorous animal dispersal community. Extensive gene flow can also occur through high pollen movement in O. rotundata, as Sp was close to the values of species with pollen dispersed by animals (Sp = 0.0171) [59]. Thus, although Ocotea species are reported to be pollinated by insects with limited flight ability, such as thrips [31,32], our results suggest the existence of, past or current biotic agents, mediating pollen flow between populations.

4.3. Genetic Insights for Conservation Actions

Despite the high levels of genetic diversity, the levels of inbreeding and the very low number of populations in a habitat that is increasingly being more disturbed raise several concerns, since stochastic factors can jeopardize the risk of extinction. In this context, management plans for O. rotundata should concentrate on in and ex situ conservation actions to maintain the genetic diversity of populations and the connectivity between populations. Owing to the high diversity of O. rotundata, the fragmented forest patches of this region should be given high conservation priority to ensure gene flow and the long-term sustenance of this species in Ecuador.
Specifically, we recommend the following actions: (1) seed collection for ex situ conservation and future tree planting in situ activities; (2) active planting or assisted regeneration in populations with a low number of adult trees, such as ZAM; (3) creation of new populations to allow for future connectivity between patches. With such a limited distribution, seeds should be collected from each population. Sampling should consider, at least, a minimum distance of 80 m in populations to minimize genetic relatedness among sampled seeds in each site. Progeny tests would allow for studying the potential of adaptative traits and assess if the magnitude of genetic diversity and gene flow remains stable across generations.

Author Contributions

Conceptualization, I.M.; methodology, I.M. and L.R.; formal analysis, I.M., L.R. and C.N.; investigation, I.M., D.D., L.R. and C.N.; writing—original draft preparation, I.M. and D.D. All authors have read and agreed to the published version of the manuscript.

Funding

This research received national funds through the FCT—Fundação para a Ciência e a Tecnologia, I.P., Portugal through the research unit UIDB/00329/2020 (CE3C), UIDB/00239/2020 (CEF), and under the Scientific Employment Stimulus—Individual Call (CEEC Individual)—2021.01107.CEECIND/CP1689/CT0001 (IM).

Data Availability Statement

Sequences generated in this study are available from NCBI with the following accession numbers: OP428738-OP428745.

Acknowledgments

We thank Yesenia Vega for her help during some field collections.

Conflicts of Interest

The authors declare no conflict of interest. The funders had no role in the design of the study; in the collection, analyses, or interpretation of data; in the writing of the manuscript; or in the decision to publish the results.

References

  1. Isabel, N.; Holliday, J.A.; Aitken, S.N. Forest genomics: Advancing climate adaptation, forest health, productivity, and conservation. Evol. Appl. 2020, 13, 3–10. [Google Scholar] [CrossRef] [PubMed] [Green Version]
  2. Allendorf, F.W.; Hohenlohe, P.A.; Luikart, G. Genomics and the future of conservation genetics. Nat. Rev. Genet. 2010, 11, 697–709. [Google Scholar] [CrossRef] [PubMed]
  3. Savolainen, O.; Pyhäjärvi, T.; Knürr, T. Gene Flow and Local Adaptation in Trees. Annu. Rev. Ecol. Evol. Syst. 2007, 38, 595–619. [Google Scholar] [CrossRef]
  4. Vanhove, M.; Pina-Martins, F.; Coelho, A.C.; Branquinho, C.; Costa, A.; Batista, D.; Príncipe, A.; Sousa, P.; Henriques, A.; Marques, I.; et al. Using gradient Forest to predict climate response and adaptation in Cork oak. J. Evol. Biol. 2021, 34, 910–923. [Google Scholar] [CrossRef] [PubMed]
  5. Lefèvre, F.; Koskela, J.; Hubert, J.; Kraigher, H.; Longauer, R.; Olrik, D.C.; Schüler, S.; Bozzano, M.; Alizoti, P.; Bakys, R.; et al. Dynamic Conservation of Forest Genetic Resources in 33 European Countries. Conserv. Biol. 2013, 27, 373–384. [Google Scholar] [CrossRef] [PubMed]
  6. Yu, W.; Wu, B.; Wang, X.; Yao, Z.; Li, Y.; Liu, Y. Scale-dependent effects of habitat fragmentation on the genetic diversity of Actinidia chinensis populations in China. Hortic. Res. 2020, 7, 172. [Google Scholar] [CrossRef] [PubMed]
  7. Jump, A.S.; Peñuelas, J. Genetic effects of chronic habitat fragmentation in a wind-pollinated tree. Proc. Natl. Acad. Sci. USA 2006, 103, 8096–8100. [Google Scholar] [CrossRef] [Green Version]
  8. Plomion, C.; Aury, J.-M.; Amselem, J.; Leroy, T.; Murat, F.; Duplessis, S.; Faye, S.; Francillonne, N.; Labadie, K.; Le Provost, G.; et al. Oak genome reveals facets of long lifespan. Nat. Plants 2018, 4, 440–452. [Google Scholar] [CrossRef] [PubMed] [Green Version]
  9. Noreen, A.M.E.; Webb, E.L. High Genetic Diversity in a Potentially Vulnerable Tropical Tree Species Despite Extreme Habitat Loss. PLoS ONE 2013, 8, 82632. [Google Scholar] [CrossRef] [PubMed] [Green Version]
  10. Ony, M.A.; Nowicki, M.; Boggess, S.L.; Klingeman, W.E.; Zobel, J.M.; Trigiano, R.N.; Hadziabdic, D. Habitat fragmentation influences genetic diversity and differentiation: Fine-scale population structure of Cercis canadensis (eastern redbud). Ecol. Evol. 2020, 10, 3655–3670. [Google Scholar] [CrossRef] [PubMed]
  11. Lee, S.L.; Wickneswari, R.; Mahani, M.C.; Zakri, A.H. Genetic Diversity of a Tropical Tree Species, Shorea leprosula Miq. (Dipterocarpaceae), In Malaysia: Implications for Conservation of Genetic Resources and Tree Improvement. Biotropica 2000, 32, 213–224. [Google Scholar] [CrossRef]
  12. Li, Z.; Wang, H.; Liao, P.-C.; Wang, C.-N.; Du, F.K.; Su, J.; Yan, Y.; Song, J.; Li, J.; Mao, J.; et al. Recent Fragmentation May Not Alter Genetic Patterns in Endangered Long-Lived Species: Evidence from Taxus cuspidata. Front. Plant Sci. 2018, 9, 1571. [Google Scholar] [CrossRef]
  13. Piotti, A.; Leonardi, S.; Buiteveld, J.; Geburek, T.; Gerber, S.; Kramer, K.; Vettori, C.; Vendramin, G.G. Comparison of pollen gene flow among four European beech (Fagus sylvatica L.) populations characterized by different management regimes. Heredity 2012, 108, 322–331. [Google Scholar] [CrossRef] [PubMed] [Green Version]
  14. Provan, J.; Beatty, G.E.; Hunter, A.M.; McDonald, R.A.; McLaughlin, E.; Preston, S.J.; Wilson, S. Restricted gene flow in fragmented populations of a wind-pollinated tree. Conserv. Genet. 2008, 9, 1521–1532. [Google Scholar] [CrossRef]
  15. Hensen, I.; Cierjacks, A.; Hirsch, H.; Kessler, M.; Romoleroux, K.; Renison, D.; Wesche, K. Historic and recent fragmentation coupled with altitude affect the genetic population structure of one of the world’s highest tropical tree line species. Glob. Ecol. Biogeogr. 2012, 21, 455–464. [Google Scholar] [CrossRef]
  16. Leonardi, S.; Piovani, P.; Scalfi, M.; Piotti, A.; Giannini, R.; Menozzi, P. Effect of Habitat Fragmentation on the Genetic Diversity and Structure of Peripheral Populations of Beech in Central Italy. J. Hered. 2012, 103, 408–417. [Google Scholar] [CrossRef] [Green Version]
  17. Finch, K.N.; Jones, F.A.; Cronn, R.C. Genomic resources for the Neotropical tree genus Cedrela (Meliaceae) and its relatives. BMC Genom. 2019, 20, 58. [Google Scholar] [CrossRef] [Green Version]
  18. Burley, J.T.; Kellner, J.R.; Hubbell, S.P.; Faircloth, B.C. Genome assemblies for two Neotropical trees: Jacaranda copaia and Handroanthus guayacan. G3 2021, 11, jkab010. [Google Scholar] [CrossRef]
  19. García-Barrios, L.; Galván-Miyoshi, Y.M.; Valdivieso-Pérez, I.A.; Masera, O.R.; Bocco, G.; Vandermeer, J. Neotropical Forest Conservation, Agricultural Intensification, and Rural Out-migration: The Mexican Experience. Bioscience 2009, 59, 863–873. [Google Scholar] [CrossRef] [Green Version]
  20. Tapia-Armijos, M.F.; Homeier, J.; Espinosa, C.I.; Leuschner, C.; De La Cruz, M. Deforestation and forest fragmentation in south Ecuador since the 1970s—Losing a hotspot of biodiversity. PLoS ONE 2015, 10, e0133701. [Google Scholar] [CrossRef]
  21. Tapia-Armijos, M.F.; Homeier, J.; Draper Munt, D. Spatio-temporal analysis of the human footprint in South Ecuador: Influence of human pressure on ecosystems and effectiveness of protected areas. Appl. Geogr. 2017, 78, 22–32. [Google Scholar] [CrossRef]
  22. Rivas, C.A.; Guerrero-Casado, J.; Navarro-Cerillo, R.M. Deforestation and fragmentation trends of seasonal dry tropical forest in Ecuador: Impact on conservation. For. Ecosyst. 2021, 8, 46. [Google Scholar] [CrossRef]
  23. Kleemann, J.; Zamora, C.; Villacis-Chiluisa, A.B.; Cuenca, P.; Koo, H.; Noh, J.K.; Fürst, C.; Thiel, M. Deforestation in Continental Ecuador with a Focus on Protected Areas. Land 2022, 11, 268. [Google Scholar] [CrossRef]
  24. Ruilova, X.R.; Marques, I. Better common than rare? Effects of low reproductive success, scarce pollinator visits and interspecific gene flow in threatened and common species of Tibouchina (Melastomataceae). Plant Species Biol. 2016, 31, 288–295. [Google Scholar] [CrossRef]
  25. Ocotea rotundata. Available online: https://www.iucnredlist.org/species/38101/10096866 (accessed on 11 August 2022).
  26. van der Werff, H. A Synopsis of Ocotea (Lauraceae) in Central America and Southern Mexico. Ann. Missouri Bot. Gard. 2002, 89, 429–451. [Google Scholar] [CrossRef]
  27. Van Der Werff, H. Studies in andean ocotea (Lauraceae) II. Species with hermaphrodite flowers and densely pubescent lower leaf surfaces, occurring above 1000 meters in altitude. Novon 2013, 22, 336–370. [Google Scholar] [CrossRef]
  28. van der Werff, H. New Species of Lauraceae from Ecuador and Peru. Ann. Missouri Bot. Gard. 1991, 78, 409. [Google Scholar] [CrossRef]
  29. Palacios, W.A. Two new species of Lauraceae from Ecuador. Phytotaxa 2018, 346, 180–188. [Google Scholar] [CrossRef]
  30. Gilardoni, G.; Montalván, M.; Vélez, M.; Malagón, O. Chemical and Enantioselective Analysis of the Essential Oils from Different Morphological Structures of Ocotea quixos (Lam.) Kosterm. Plants 2021, 10, 2171. [Google Scholar] [CrossRef] [PubMed]
  31. Martins, E.M.; Lamont, R.W.; Martinelli, G.; Lira-Medeiros, C.F.; Quinet, A.; Shapcott, A. A Genetic diversity and population genetic structure in three threatened Ocotea species (Lauraceae) from Brazil’s Atlantic Rainforest and implications for their conservation. Conserv. Genet. 2015, 16, 1–14. [Google Scholar] [CrossRef]
  32. Danieli-Silva, A.; VARASSIN, I.G. Breeding system and thrips (Thysanoptera) pollination in the endangered tree Ocotea porosa (Lauraceae): Implications for conservation. Plant Species Biol. 2013, 28, 31–40. [Google Scholar] [CrossRef]
  33. Richard, J. The Effect of Logging and Invasion of Acacia mearnsii on Regeneration of Ocotea usambarensis in Chome Nature Reserve, Tanzania. Ph.D. Thesis, Sokoine University of Agriculture, Morogoro, Tanzania, 2016. [Google Scholar]
  34. Nsolomo, V.R.; Venn, K. Capacity of fungi to colonise wood of the East African camphor tree, Ocotea usambarensis. Mycol. Res. 2000, 104, 1468–1472. [Google Scholar] [CrossRef]
  35. Aguirre-Mendoza, Z.; Loja, Á.; Solano, C.; Aguirre, N. Especies Forestales mas Aprovechadas del sur del Ecuador; Biblioteca Hernán Malo González: Cuenca, Ecuador, 2015; ISBN 9788578110796. [Google Scholar]
  36. Radice, M.; Escobar, J.A.; Pérez Martínez, A. Ocotea quixos Essential oil: A Systematic Review about the Ethno-Medicinal Uses, Phytochemistry and Biological Activity. In MOL2NET 2017, International Conference on Multidisciplinary Sciences, 3rd ed.; Multidisciplinary Digital Publishing Institute: Basel, Switzerland, 2017; Volume 3. [Google Scholar] [CrossRef]
  37. Vallejos, P.Q.; Veit, P.G.; Tipula, P.; Reytar, K. Undermining Rights: Indigenous Lands and Mining in the Amazon. World Resour. Inst. 2020. [Google Scholar] [CrossRef]
  38. Roy, B.A.; Zorrilla, M.; Endara, L.; Thomas, D.C.; Vandegrift, R.; Rubenstein, J.M.; Policha, T.; Ríos-Touma, B.; Read, M. New Mining Concessions Could Severely Decrease Biodiversity and Ecosystem Services in Ecuador Introduction New Mining Concessions in Ecuador. Trop. Conserv. Sci. 2018, 11, 1940082918780427. [Google Scholar] [CrossRef]
  39. Curatola Fernández, G.F.; Obermeier, W.A.; Gerique, A.; López Sandoval, M.F.; Lehnert, L.W.; Thies, B.; Bendix, J. Land cover change in the Andes of southern Ecuador-Patterns and drivers. Remote Sens. 2015, 7, 2509–2542. [Google Scholar] [CrossRef] [Green Version]
  40. Ecuador|EU REDD Facility. Available online: https://euredd.efi.int/countries/ecuador/ (accessed on 18 October 2022).
  41. Kõressaar, T.; Lepamets, M.; Kaplinski, L.; Raime, K.; Andreson, R.; Remm, M. Primer3_masker: Integrating masking of template sequence with primer design software. Bioinformatics 2018, 34, 1937–1938. [Google Scholar] [CrossRef] [Green Version]
  42. Van Oosterhout, C.; Hutchinson, W.F.; Wills, D.P.M.; Shipley, P. MICRO-CHECKER: Software for identifying and correcting genotyping errors in microsatellite data. Mol. Ecol. Notes 2004, 4, 535–538. [Google Scholar] [CrossRef]
  43. Peakall, R.; Smouse, P.E. GenAlEx 6.5: Genetic analysis in Excel. Population genetic software for teaching and research-an update. Bioinform. Appl. 2012, 28, 2537–2539. [Google Scholar] [CrossRef] [Green Version]
  44. Flamenco-Sandoval, A.; Martínez Ramos, M.; Masera, O.R. Assessing implications of land-use and land-cover change dynamics for conservation of a highly diverse tropical rain forest. Biol. Conserv. 2007, 138, 131–145. [Google Scholar] [CrossRef]
  45. Rousset, F. GENEPOP’007: A complete re-implementation of the GENEPOP software for Windows and Linux. Mol. Ecol. Resour. 2008, 8, 103–106. [Google Scholar] [CrossRef]
  46. Rice, W.R. Analyzing Tables of Statistical Tests. Evolution 1989, 43, 223. [Google Scholar] [CrossRef]
  47. Wright, S. The Interpretation of Population Structure By F-Statistics with Special Regard to Systems of Mating. Evolution 1965, 19, 395–420. [Google Scholar] [CrossRef]
  48. Excoffier, L.; Laval, G.; Schneider, S. Arlequin (Version 3.0): An Integrated Software Package for Population Genetics Data Analysis. Evol. Bioinform. Online 2005, 1, 117693430500100000. [Google Scholar] [CrossRef] [Green Version]
  49. Yeh, F.C.; Yang, R.-C. POPGENE Version 1.31 Microsoft Window-Based Freeware for Population Genetic Analysis. Quick User Guide, August 1999. Available online: https://sites.ualberta.ca/~fyeh/popgene.pdf (accessed on 18 October 2022).
  50. Alcala, N.; Goudet, J.; Vuilleumier, S. On the transition of genetic differentiation from isolation to panmixia: What we can learn from G S T and D. Theor. Popul. Biol. 2014, 93, 75–84. [Google Scholar] [CrossRef] [PubMed]
  51. Sundqvist, L.; Keenan, K.; Zackrisson, M.; Prodöhl, P.; Kleinhans, D. Directional genetic differentiation and relative migration. Ecol. Evol. 2016, 6, 3461–3475. [Google Scholar] [CrossRef] [PubMed] [Green Version]
  52. Keenan, K.; Mcginnity, P.; Cross, T.F.; Crozier, W.W.; Prodöhl, P.A. diveRsity: An R package for the estimation and exploration of population genetics parameters and their associated errors. Methods Ecol. Evol. 2013, 4, 782–788. [Google Scholar] [CrossRef] [Green Version]
  53. Pritchard, J.K.; Stephens, M.; Donnelly, P. Inference of population structure using multilocus genotype data. Genetics 2000, 155, 945–959. [Google Scholar] [CrossRef]
  54. Earl, D.A.; vonHoldt, B.M. STRUCTURE HARVESTER: A website and program for visualizing STRUCTURE output and implementing the Evanno method. Conserv. Genet. Resour. 2012, 4, 359–361. [Google Scholar] [CrossRef]
  55. Evanno, G.; Regnaut, S.; Goudet, J. Detecting the number of clusters of individuals using the software STRUCTURE: A simulation study. Mol. Ecol. 2005, 14, 2611–2620. [Google Scholar] [CrossRef] [PubMed]
  56. Jakobsson, M.; Rosenberg, N.A. CLUMPP: A cluster matching and permutation program for dealing with label switching and multimodality in analysis of population structure. Bioinformatics 2007, 23, 1801–1806. [Google Scholar] [CrossRef] [PubMed] [Green Version]
  57. Hardy, O.J.; Vekemans, X. SPAGeDi: A Versatile Computer Program to Analyse Spatial Genetic Structure at the Individual or Population Levels. Molecular Ecology Notes 2002, 2, 618–620. [Google Scholar] [CrossRef] [Green Version]
  58. Loiselle, B.A.; Sork, V.L.; Nason, J.; Graham, C. Spatial genetic structure of a tropical understory shrub, Psychotria officinalis (Rubiaceae). Am. J. Bot. 1995, 82, 1420–1425. [Google Scholar] [CrossRef]
  59. Vekemans, X.; Hardy, O.J. New insights from fine-scale spatial genetic structure analyses in plant populations. Mol. Ecol. 2004, 13, 921–935. [Google Scholar] [CrossRef] [PubMed]
  60. Geng, Q.; Sun, L.; Zhang, P.; Wang, Z.; Qiu, Y.; Liu, H.; Lian, C. Understanding population structure and historical demography of Litsea auriculata (Lauraceae), an endangered species in east China. OPEN. Sci. Rep. 2017, 7, 17343. [Google Scholar] [CrossRef] [PubMed] [Green Version]
  61. Cui, B.; Vu, D.D.; Vu, D.G.; Bui, T.T.X.; Rahman, S.U.; Pham, M.P.; Nguyen, M.T.; Nguyen, V.S.; Shah, S.N.M.; Tran, V.H. Genetic diversity and population structure of Cinnamomum balansae Lecomte inferred by microsatellites. Open Life Sci. 2022, 17, 323–332. [Google Scholar] [CrossRef]
  62. Senkoro, A.M.; Talhinhas, P.; Simões, F.; Batista-Santos, P.; Shackleton, C.M.; Voeks, R.A.; Marques, I.; Ribeiro-Barros, A.I. The genetic legacy of fragmentation and overexploitation in the threatened medicinal African pepper-bark tree, Warburgia salutaris. Sci. Rep. 2020, 10, 19725. [Google Scholar] [CrossRef]
  63. Cueva-Agila, A.; Vélez-Mora, D.; Arias, D.; Curto, M.; Meimberg, H.; Brinegar, C. Genetic characterization of fragmented populations of Cinchona officinalis L. (Rubiaceae), a threatened tree of the northern Andean cloud forests. Tree Genet. Genomes 2019, 15, 81. [Google Scholar] [CrossRef] [Green Version]
  64. Lundholm, J.; Johnson, A.L.; Rivkin, L.R.; Ksiazek-Mikenas, K.; Fant, J.B.; Skogen, K.A. Pollinator-Mediated Gene Flow Connects Green Roof Populations Across the Urban Matrix: A Paternity Analysis of the Self-Compatible Forb Penstemon hirsutus. Front. Ecol. Evol. 2019, 1, 299. [Google Scholar] [CrossRef] [Green Version]
  65. Solórzano, S.; Arias, S.; Dávila, P. Genetics and Conservation of Plant Species of Extremely Narrow Geographic Range. Diversity 2016, 8, 31. [Google Scholar] [CrossRef]
  66. Lowe, A.; Boshier, D.; Ward, M.; Bacles, C.; Navarro, C. Genetic resource impacts of habitat loss and degradation; reconciling empirical evidence and predicted theory for neotropical trees. Heredity 2005, 95, 255–273. [Google Scholar] [CrossRef] [PubMed] [Green Version]
  67. Alleaume-Benharira, M.; Pen, I.R.; Ronce, O. Geographical patterns of adaptation within a species’ range: Interactions between drift and gene flow. J. Evol. Biol. 2006, 19, 203–215. [Google Scholar] [CrossRef]
  68. Fischer, M.; Matthies, D. RAPD variation in relation to population size and plant fitness in the rare Gentianella germanica (Gentianaceae). Am. J. Bot. 1998, 85, 811. [Google Scholar] [CrossRef] [PubMed]
  69. Schlaepfer, D.R.; Braschler, B.; Rusterholz, H.-P.; Baur, B. Genetic effects of anthropogenic habitat fragmentation on remnant animal and plant populations: A meta-analysis. Ecosphere 2018, 9, e02488. [Google Scholar] [CrossRef]
  70. Shi, X.; Wen, Q.; Cao, M.; Guo, X.; Xu, L.A. Genetic diversity and structure of natural Quercus variabilis population in China as revealed by microsatellites markers. Forests 2017, 8, 495. [Google Scholar] [CrossRef] [Green Version]
  71. Xu, L.-A.; Li, X.-J.; Pan, H.-X.; Zou, H.-Y.; Yin, T.-M.; Hunag, M.-R. Study on Population Genetic Structure in Castanopsis Fargesii with Microsatellite Markers. J. Integr. Plant Biol. 2001, 43, 409–412. [Google Scholar]
  72. Pometti, C.; Bessega, C.; Cialdella, A.; Ewens, M.; Saidman, B.; Vilardi, J. Spatial genetic structure within populations and management implications of the South American species Acacia aroma (Fabaceae). PLoS ONE 2018, 13, e0192107. [Google Scholar] [CrossRef] [PubMed] [Green Version]
  73. Leclerc, T.; Vimal, R.; Troispoux, V.; Périgon, S.; Scotti, I. Life after disturbance (I): Changes in the spatial genetic structure of Jacaranda copaia (Aubl.) D. Don (Bignonianceae) after logging in an intensively studied plot in French Guiana. Ann. For. Sci. 2015, 72, 509–516. [Google Scholar] [CrossRef] [Green Version]
  74. Dong, W.; Zhang, X.; Guansong, Y.; Yang, L.; Wang, Y.; Shen, S. Biological characteristics and conservation genetics of the narrowly distributed rare plant Cinnamomum chago (Lauraceae). Plant Divers. 2016, 38, 247. [Google Scholar] [CrossRef] [PubMed] [Green Version]
  75. White, G.M.; Boshier, D.H.; Powell, W. Increased pollen flow counteracts fragmentation in a tropical dry forest: An example from Swietenia humilis Zuccarini. Proc. Natl. Acad. Sci. USA 2002, 99, 2038–2042. [Google Scholar] [CrossRef] [Green Version]
  76. Dick, C.W. Genetic rescue of remnant tropical trees by an alien pollinator. Proc. R. Soc. B Boil. Sci. 2001, 268, 2391–2396. [Google Scholar] [CrossRef]
  77. Liepelt, S.; Bialozyt, R.; Ziegenhagen, B. Wind-dispersed pollen mediates postglacial gene flow among refugia. Proc. Natl. Acad. Sci. USA 2002, 99, 14590–14594. [Google Scholar] [CrossRef] [PubMed] [Green Version]
  78. Zhao, X.; Ma, Y.; Sun, W.; Wen, X.; Milne, R. High Genetic Diversity and Low Differentiation of Michelia coriacea (Magnoliaceae), a Critically Endangered Endemic in Southeast Yunnan, China. Int. J. Mol. Sci 2012, 13, 4396–4411. [Google Scholar] [CrossRef] [Green Version]
  79. Silva, C.R.S.; Albuquerque, P.S.B.; Ervedosa, F.R.; Mota, J.W.S.; Figueira, A.; Sebbenn, A.M. Understanding the genetic diversity, spatial genetic structure and mating system at the hierarchical levels of fruits and individuals of a continuous Theobroma cacao population from the Brazilian Amazon. Heredity 2011, 106, 973–985. [Google Scholar] [CrossRef] [PubMed] [Green Version]
  80. Goncalves, A.L.; García, M.V.; Heuertz, M.; González-Martínez, S.C. Demographic history and spatial genetic structure in a remnant population of the subtropical tree Anadenanthera colubrina var. cebil (Griseb.) Altschul (Fabaceae). Ann. For. Sci. 2019, 76, 18. [Google Scholar] [CrossRef]
Figure 1. Topographic map of the study area in Ecuador with elevation displayed. (Left) location of Ocotea rotundata populations and the Podocarpus National Park. (Right) detail of the study area. Populations sampled are indicated by a red dot. Main roads are indicated by a dashed line. The blue line indicates the limit of the Podocarpus National Park. Main cities are also indicated.
Forests 13 01940 g001
Figure 2. Diagram of the relative magnitude and direction of gene flow between O. rotundata populations. Arrows thickness shows normalized Nm values and arrowheads the estimated direction of gene flow. Results were plotted against the topographic map of populations showing only elevation. Population labels refer to Table 2.
Forests 13 01940 g002
Figure 3. Genetic structure of Ocotea rotundata samples based on the best assignment results retrieved by STRUCTURE (K  =  4). Each sample is represented by a thin vertical line divided into K-colored segments that represent the individual’s estimated membership fractions in K clusters. Population labels refer to Table 2.
Forests 13 01940 g003
Figure 4. Genetic relationships between all Ocotea rotundata samples based on a principal coordinate analysis (PCoA). Note that only a small number of individuals can be seen in ZAM since most samples have identical alleles. Population labels refer to Table 2.
Forests 13 01940 g004
Figure 5. Spatial genetic structure correlograms between the spatial distance and the kinship coefficient (Fij) of O. rotundata in the studied populations. Filled circles indicate significant Fij values. Dashed lines indicate 95% confidence intervals per distance class around the null hypothesis of random genetic structure. Population labels refer to Table 2.
Forests 13 01940 g005
Table 1. Characteristics and genetic diversity statistics of the nuclear microsatellite markers used in the genetic study of Ocotea rotundata. For each locus, the mean number of alleles (A), mean expected heterozygosity (He), and the mean observed heterozygosity (Ho) are shown. * indicates a significant departure from HWE.
LocusPrimers (5′-3′)Ta (°C)Repeat MotifSize Range (bp)Accession NumberAHoHe
Orot5F: GGTACTCGCGTTTGGGTCTA58(AC)10196–223OP42873820.550.58
R: AGAGTAGTAGTCCCGGGTAAAA
Orot8F: GTCGGAAACTCTACCAAAGTGA58(TC)8131–140OP42873940.620.63
R: CCATCCCCGTAGAGTCTCG
Orot11F: TGACAAAGGGTACGTATGAGC57(CTT)6188–193OP42874060.410.49
R: TAATCCCTACCACATGCCCG
Orot15F: TTTCTATACCTACGCGCCGG58(TTCA)10179–187OP42874130.450.49
R: TAAACCTCCCTCTCCCCTCT
Orot21F: CGGGACTATCAGAAGGTACGT59(GT)22180–185OP42874260.13 *0.21
R: TGGGTAAAAGTCTGCTGATCCT
Orot22F: TCCTCCTACTCCTATCTACGGA50(CT)13148–155OP42874360.18 *0.32
R: ATCGTCTCTGCTATCCCTGC
Orot32F: CCTCTACTATTCTCTTTAGCGCA55(GAA)8170–175OP42874480.440.45
R: TGCCGATCTGACTATGGAGG
Orot34F: GGGATCGATCGAAAGCTACG60(TA)22190–195OP42874550.560.58
R: TCCTCCTAGTCCCGTAGTCC
Table 2. Genetic diversity of Ocotea rotundata per population. Different superscript letters indicate significant differences between populations after a post hoc Tukey’s test (p < 0.05).
PopulationsLocationLatitudeLongitudeAltitudeNAAeAprHoHeF
LOJLoja−3.91−79.1526002511.3 b8.9 b8 b0.72 b0.86 b0.22 b*
CERCerro Toledo−4.38−79.132900309.1 b8.4 b11 b0.73 b0.81 b0.21 b*
YANYangana−4.36−79.3030003010.4 b10.8 b9 b0.69 b0.73 b 0.19 a*
CATCatamayo−4.04−79.2327502512.3 b10.1 b9 b0.67 b0.80 b0.11 a*
ZAMZamora−4.05−78.992150306.1 a4.2 a2 a0.43 a0.62 a0.27 c*
Overall 1409.84 ± 2.407.06 ± 2.867.81 ± 3.420.65 ± 0.120.76 ± 0.090.20 ± 0.07
N: sampling size used in this study; A: mean number of alleles per population; Ae: mean number of effective alleles; Apr: number of private alleles per population; Ho: mean observed heterozygosity; He: mean expected heterozygosity; F: mean allelic fixation index; * indicates significant deviation from HWE.
Publisher’s Note: MDPI stays neutral with regard to jurisdictional claims in published maps and institutional affiliations.

