Article

Response of Tracheid Structure Characteristics and Lignin Distribution of Taxodium Hybrid Zhongshanshan to External Stress

1
College of Materials Science and Engineering, Nanjing Forestry University, Nanjing 210037, China
2
China Forestry Materials Corporation Limited, Beijing 100045, China
3
Co-Innovation Center of Efficient Processing and Utilization of Forest Resources, Nanjing Forestry University, Nanjing 210037, China
*
Authors to whom correspondence should be addressed.
Forests 2022, 13(11), 1792; https://doi.org/10.3390/f13111792
Submission received: 8 October 2022 / Revised: 23 October 2022 / Accepted: 24 October 2022 / Published: 28 October 2022

Abstract

:
The Taxodium hybrid Zhongshanshan fast-growing species is susceptible to environment and gravity to form reaction wood. In this study, individual growth rings of reaction wood are used as subjects, and an individual growth ring is divided into three zones: compression zone (CZ), lateral zone (LZ), and opposite zone (OZ). The microanatomical structure and chemical properties of the tracheids in CZ, LZ, and OZ forms by the inclined or bent growth of T. Zhongshanshan are comparatively analyzed by using optical microscopy, scanning electron microscope, laser confocal microscopy, and Raman imaging techniques. In CZ, the length and diameter of compression wood (CW) tracheids decreased, and the shape of cross-sections became rounded as compared to the OZ and LZ tracheids. More notably, threaded fissures appeared on the cell wall of tracheids, and the thickness of the cell wall increased in CW. The analysis of tracheids’ cell wall structure showed that CW tracheids had a complete outer secondary wall middle (S2L) layer, but had no secondary wall inner (S3) layer. In the transition zone (TA) between CW and normal early wood, tracheids were divided into compressed and normal tracheids. Despite the compressed tracheids having a similar cell morphology to normal tracheids, they had a thin secondary wall S2L layer. Tracheids in LZ had a thin S2L layer only at the angle of the cell. No S2L layer was seen in the cell wall of OZ and CZ late wood tracheids. It can be concluded that the response of lignin deposition location to external stress was faster than the change in cell morphology. The above results help provide the theoretical basis for the response mechanism of T. Zhongshanshan reaction wood anatomical structures to the external environment and has important theoretical value for understanding its characteristics and its rational and efficient usage.

1. Introduction

Compression wood (CW) is an abnormal wood tissue in trees. It is a kind of wood tissue with a special anatomical structure and chemical composition formed in the original growth position when the trunk or branch bends under the action of external force during the growth of trees [1,2]. These trees with special tissues are called reaction wood. Fast-growing trees easily form reaction wood, and thus, the amount of reaction wood is extensive. Reaction wood has different mechanical and physical properties due to changes in its physical and chemical properties, including differences in fiber properties, workability, deformation, and strength [3]. The wood defects of compression wood such as high lignification seriously restrict the processing and utilization of high-quality plantation wood [4]. The Taxodium hybrid Zhongshanshan is an improved tree species obtained via artificial hybridization at the Institute of Botany, Jiangsu Province, and the Chinese Academy of Sciences. The T. Zhongshanshan has good strength and rigidity properties and can be used as outdoor timber or building timber after processing [5]. However, CW accounts for a large proportion of the fast-growing lumber of T. Zhongshanshan, and it is an unwanted raw material for wood-based panels, pulp, and paper [6]. The high lignification of CW makes it difficult to pulp or bleach, but it also increases the resistance of the cell wall to compression damage [7,8]. Therefore, the study of the structural characteristics of CW will contribute to the cultivation and processing of the tree species.
As compared to normal wood, CW has very significant differences in cell structure, and opposite wood (OW) has similar properties to normal wood [9]. The tracheids are the most significantly altered structure in the anatomical configuration of reaction wood, and the structure of parenchyma cells is not altered [10]. CW has mainly consisted of rounded tracheids with thicker cell walls. These rounded tracheids form intercellular spaces, and their inner walls have helical cavities [11]. Accurate classification and characterization of CW in reaction wood cross-sections are necessary as a prerequisite for any CW testing method [12]. In the literature, CW has been classified into three classes: mild compression wood, moderate compression wood, and severe compression wood [13]. With the development of research, CW was more carefully classified according to the severity of spiral check, cell wall thickness and the outer secondary wall inner middle (S2L) layer ultraviolet absorption (Spontaneous Fluorescence of Lignin), and other anatomical characteristics [14]. The most significant characterization of compression wood is the occurrence of an excessively lignified S2L. In fact, CW is a series of changes that form a continuum between normal wood and severely compressed wood, and there is no distinct border between normal wood and CW [15,16]. CW tracheids have the highly lignified S2L layer and lack the secondary wall inner (S3) layer of the secondary wall [17,18]. As the degree further lowers, there is a discontinuous S2L layer in the tracheid cell walls [19]. Then, the cell wall composition is a useful quantitative chemical indicator to assess the degree of CW [20], and changes in the anatomical and chemical characteristics of secondary xylem in reaction wood are related to lignin in the cell walls [21]. Compared with OW, tracheids in CW have a highly lignified outer S2L layer, and the lignin concentration in the thinner S1 layer and compound middle lamella (CML) decreased [22]. Confocal Raman microscopy can successfully reflect the distribution of lignin in the wood cell walls [23]. Chemical imaging by confocal Raman microscopy can emphasize the highly lignified S2 outer layer in CW [19,24]. Fluorescence lifetime imaging of lignin autofluorescence has been shown to characterize changes in lignin distribution in reaction wood [25].
In previous studies, reaction wood was usually used to investigate the anatomical characteristics of its CW and OW [26]. In contrast, the lateral wood (LW) between OW and CW was considered normal wood, and has mostly similar characteristics to OW [27,28]. Few studies have focused on OW or LW itself or compared OW or LW with CW [29]. In fact, even within a limited area of reaction wood, there are substantial differences in the degree of development of the compressed tracheids in terms of characteristics [30]. Exploring the development of compressed tracheids in different regions of the reaction wood can improve the utilization of the reaction wood by avoiding severely compressed wood during the use process.
In this study, a more detailed partitioning of the reaction wood on cross-sections was carried out. As shown in Figure 1, the individual growth ring was divided into three types of zones: compression zone (CZ), lateral zone (LZ), and opposite zone (OZ), and the cell wall structure of tracheids in each zone was analyzed to study the lignin distribution. The study of microstructural characteristics of wood and its variability helps in understanding the growth pattern of trees and the relationship between growth and wood properties. It is also essential for species selection and the rational and efficient utilization of wood (e.g., pulp and paper, biofuel applications, etc.).

2. Materials and Methods

2.1. Materials

Five leaning-grown T. Zhongshanshan trees of 14-year-olds were obtained from the National Zhongshan Fir Breeding Base in Jingjiang City, Jiangsu Province (31°51′~32°10′ N, 120°00′~120°33′ E). As shown in Figure 1, experimental woods were taken from the reaction wood bend (2–2.5m above the ground), 12nd–13th growth ring. In the cross-section of the reaction wood, CW is distributed in strips along the growth ring, with a dark brown color; the early wood in CZ, OZ, and LZ is light yellow. The wood in the opposite zone is called opposite wood (OW), and the wood in the lateral zone is called lateral wood (LW). CZ includes CW and transition area (TA), and TA is the area between the normal early wood tracheids and CW tracheids.

2.2. Microstructure Observation

Small wood blocks with the dimensions of 5 mm × 5 mm × 5 mm (longitudinal × radial × tangential) were cut from CZ, LZ, and OZ for microstructure observation. The slices with the thickness of 12 μm on the cross, tangential, and radial sections were prepared using a microtome after the wood blocks were softened in boiling water for 12h. The slices were then stained with a 1% pink stain, and those slices were then observed by an optical microscope (BX51, OLYMPUS, Tokyo, Japan).
The residual wood blocks after slicing were subsequently dried in a frozen dryer (−55 °C, 0.05 mbar) for 48 h. The microstructure of these samples at different locations was examined using a scanning electron microscope (SEM) (Quanta 200, FEI, Hillsboro, Oregon, USA), operating at an accelerating voltage of 25 kV.

2.3. Roundness Value of Tracheid Measurement

As shown in Figure 2, the captured cross-sectional micrographs were converted to binary images using Image J software. The cell walls were automatically selected using the lowest grey threshold method to determine a clear boundary between the cell wall and the cell cavity. Then, data on the roundness values and the ratio of the long and short axes of the inner contour of the tracheid cell wall calculate and obtain. The roundness value of the tracheid is calculated as follows [31]:
Cric = 4 π × S / C 2
where Cric refers to the circularity value, S refers to the area of the tracheid cavity, and C refers to the circumference of the tracheid cavity. The closer the circularity value is to 1, the closer the measured figure is to a circle.

2.4. Tracheid Dimensions Analysis

For the tracheid dimensions observation, the CW, LW, and OW samples were delignified using Franklin’s method. Portions of samples were separately soaked in a mixture of equal volumes of glacial acetic acid and hydrogen peroxide and heated at 60 °C for 1 day. The anatomical observation was performed with an optical microscope (BX51, OLYMPUS, Tokyo, Japan) connected to the Motic Image Plus 2.0 image analysis system (Hong Kong, China). The average dimensions of tracheids were calculated from 50 tracheids in each sample. Tracheid dimensions were analyzed by one-way analysis of variance (ANOVA) with a 5% significance level and using SPSS (Version 28.0, Armonk, NY, USA).

2.5. Multilayer Structure of Cell Walls

The unstained 12 μm wood sections were examined using a laser scanning confocal microscope (LSCM) (LSM 710, Carl Zeiss, Oberkochen, Baden-Württemberg, Germany), using 488 nm laser excitation. Other unstained sections were examined using a 532 nm Micro-Raman spectrometer (LabRam HR evolution, Horiba, Palaiseau, France). Scanning the spectra in the wave number range of 600 cm−1–2000 cm−1 (containing the major lignin characteristic peaks) at a step size of 1 µm, the laser exposure time was set at 3 s for each spectrum. Integral imaging of Raman intensity was in the wavenumber range 1519 cm−1–1712 cm−1.

3. Results

3.1. Microscopic Distribution of CW Tracheids

As shown in Figure 3, the cavities of compression wood and late wood tracheids were small and thick, which can be stained easily with saffron dyed dark red. Most early wood tracheids in CW and OW were pentagonal or hexagonal; a few were quadrilateral, stained light red because of the large lumen and thin wall. Most early woods in the same growth ring form only one round of CW. However, there were also growth rings with two CW bands and normal early wood tracheids between the two CW bands, and the early wood at the beginning did not have the characteristics of the compressed tracheids.
The CW tracheids were formed in the middle or posterior of the growth rings. In TA, the tracheid cell walls showed a gradual thickening trend. The tracheid cell walls of early wood and late wood are not significantly thickened.

3.2. Anatomical Characteristics of Reaction Wood

The optical micrographs in CW, LW, and OW of T. Zhongshanshan are presented in Figure 4. In OW, early wood tracheids are square or polygonal, while late wood cells are quadrilateral and have significantly thicker cell walls than the early wood tracheids. Lignin in wood is the main object of staining for saffron [32]. The darkest color is of the cell corner (CC) and CML in OW, while the color of the secondary cell wall saffron is lighter. Compared with OW tracheids, CW tracheids have thicker cell walls, nearly round cross-sections, and many intercellular spaces. Their highly lignified S2L layer is stained dark red by saffron, and the S2 inner layer is light red. LW tracheids are mainly polygonal in shape, with a more pronounced angle of cells, intercellular spaces, and slightly thickened cell walls. Their S2L layer is more clearly distinguished from the inner S2 layer in the stained sections, with the dark red S2L layer being thinner and mainly located at the angle of the cell.
As shown in Figure 5, the inner wall of the tracheids of the OW is smooth, without thread cracks, and with normal pit morphology. The pits of CW tracheids are narrow and elongated as a result of the helical cavities, which are grooved and usually do not extend into the S1 layer. The inner side of tracheids in LW is usually smooth or has shallow helical cavities. The shallow spiral check may be a preliminary form of the grooved spiral check [33].

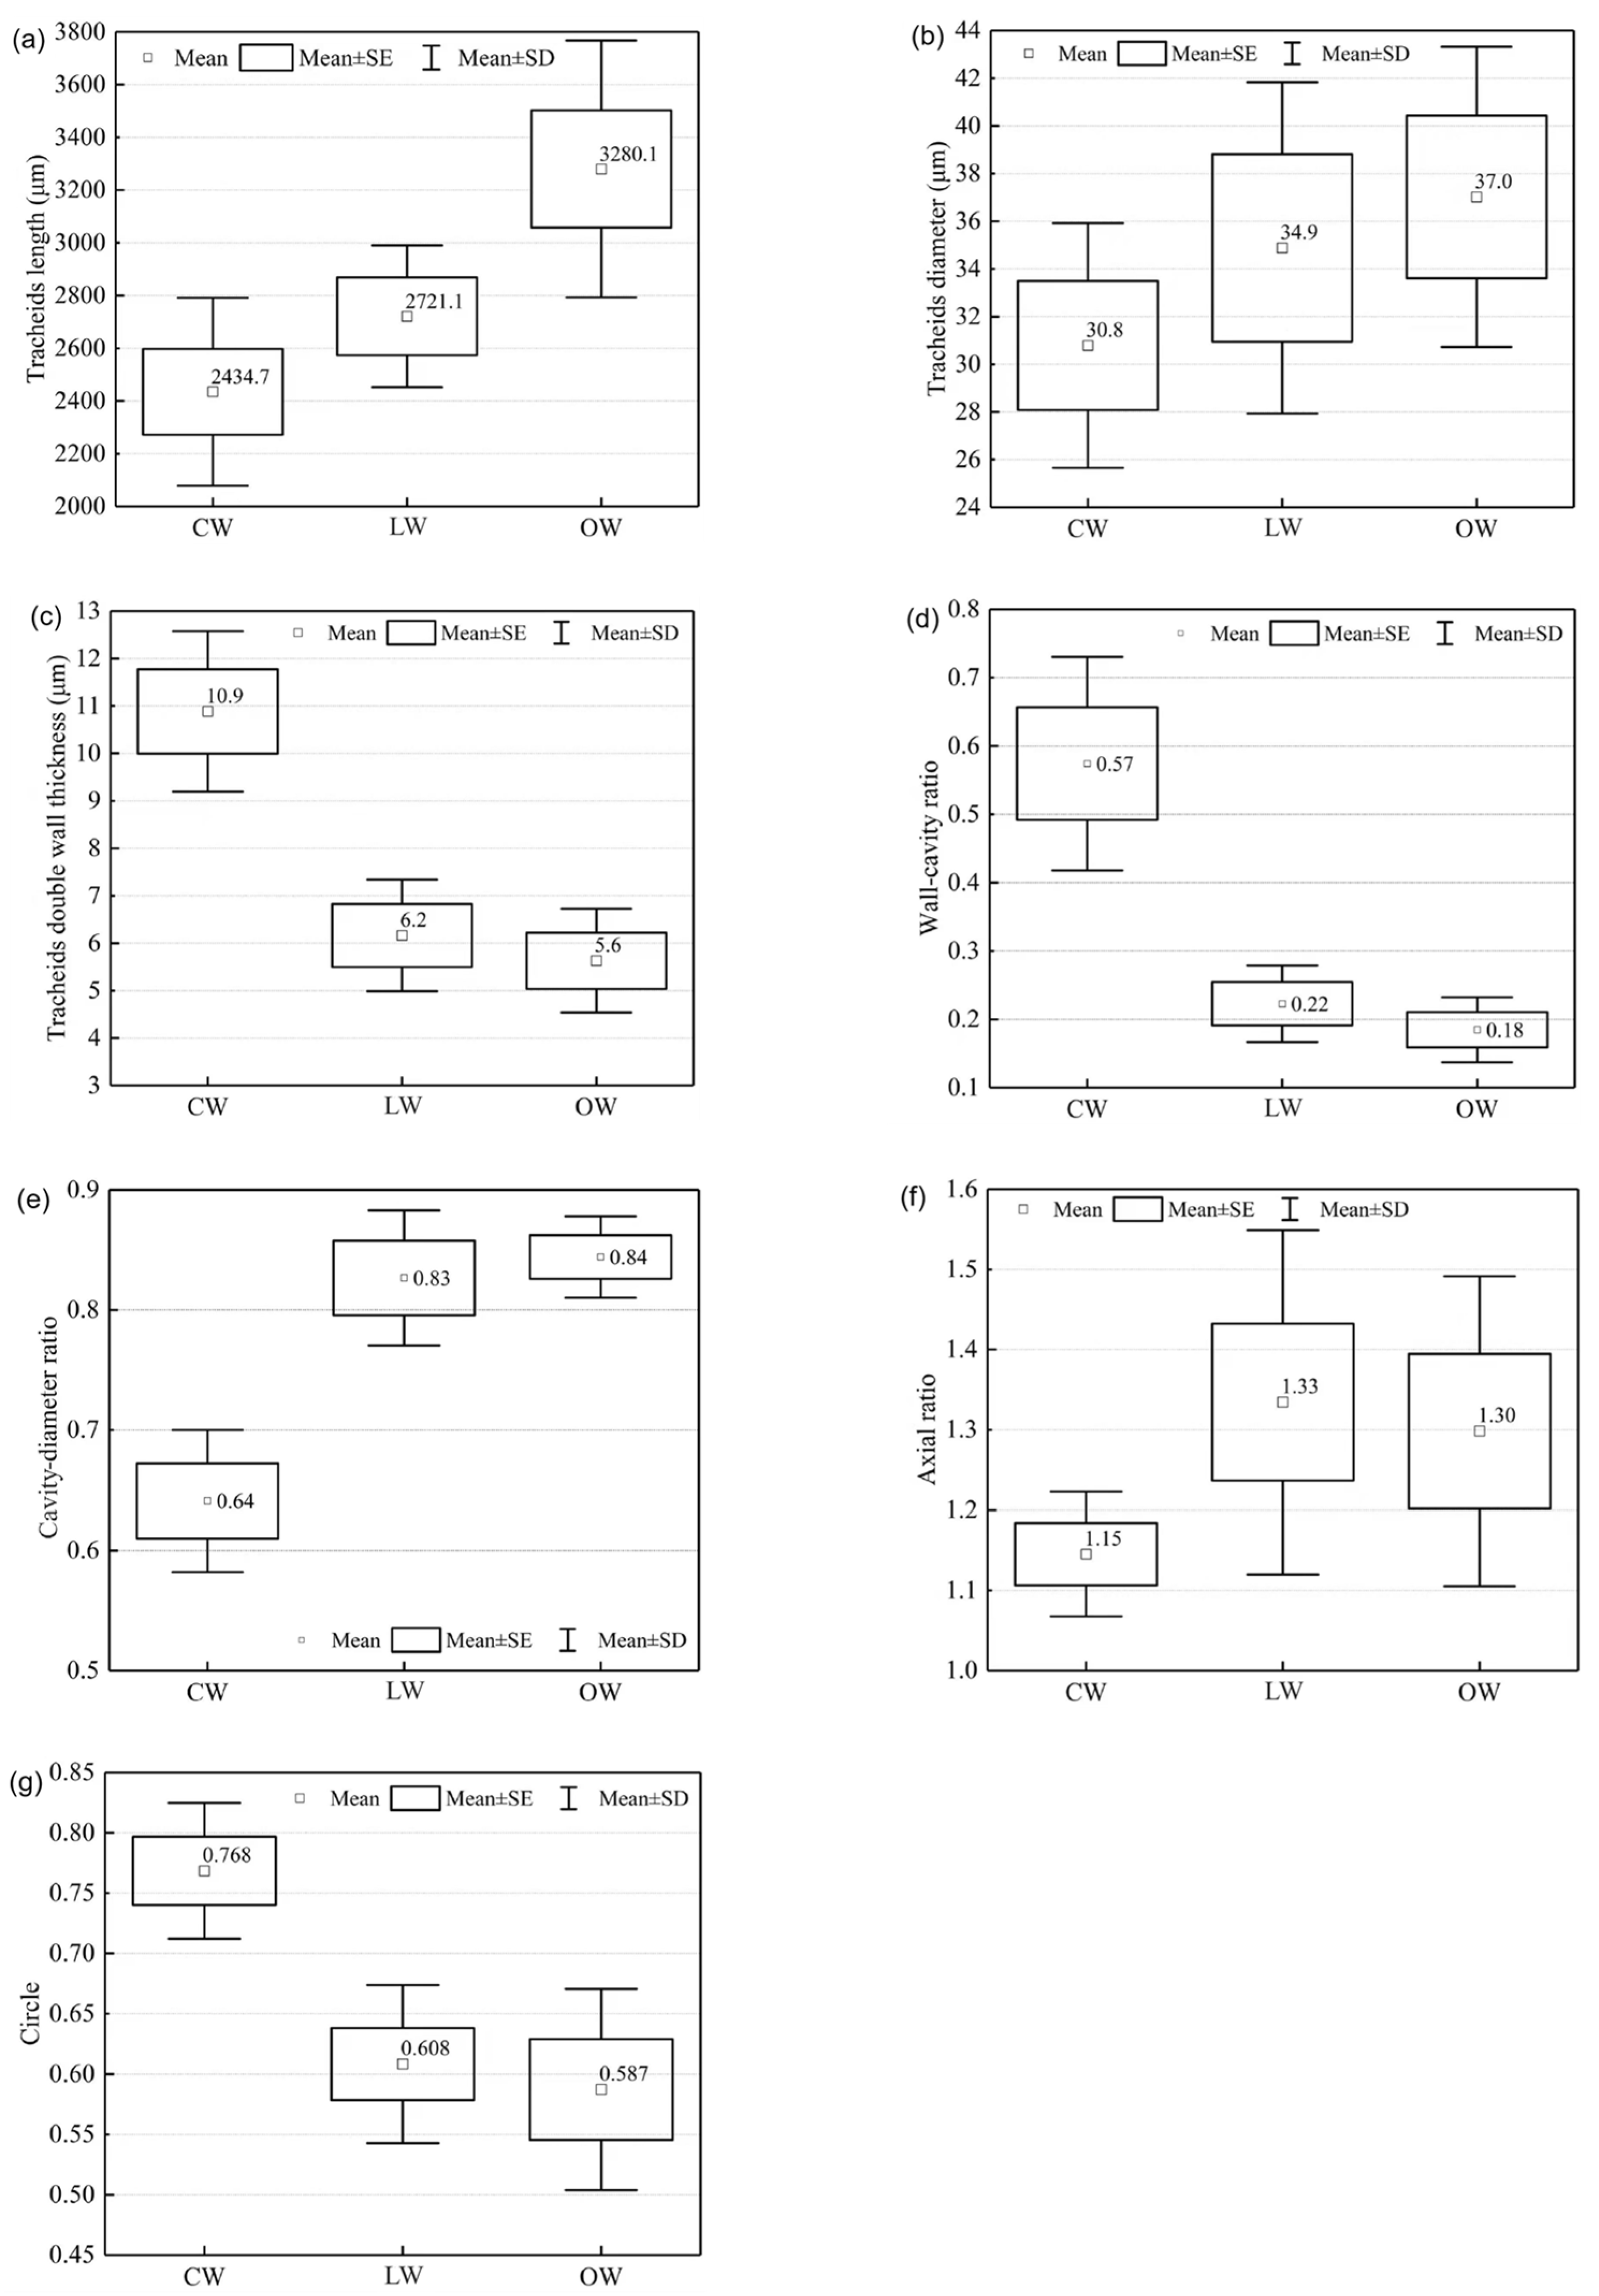
3.3. Tracheid Morphological Parameters of Reaction Wood

The tracheid lengths of OW were significantly longer than those of LW and CW, with an average length of 3280.1 ± 44.5 μm. The average tracheid length of CW was 2434.7 ± 32.54 μm, and that of LW was 2721.1 ± 29.6 μm (Figure 6a). The differences between CW, LW, and OW tracheid lengths were highly significant. It can be speculated that the shortening of the length of CW and LW tracheids may be related to their compressive stress; CW tracheids were subjected to higher compressive stress, so CW tracheids were the shortest in length.
The average diameter of OW tracheids was the largest at 37.0 ± 0.7 μm, while the average diameters of CW and LW tracheids were 30.8 ± 0.5 μm and 34.9 ± 0.8 μm, respectively (Figure 6b). The diameters of CW tracheids differ from those of LW and OW tracheids in a highly significant way (p < 0.01), and the diameters of LW tracheids differ from those of OW tracheids in a significant way (0.01 < p < 0.05). The decrease in the diameter of the CW tracheids may be related to its influence by compressive stress: the CW tracheids were subjected to higher compressive stress, so the diameter of tracheids was narrowed; LW tracheids were subjected to slightly lower compressive stress, and the tracheid diameter was also narrowed to some extent.
The tracheid double wall thickness of the CW was significantly thicker than that of OW. The average double wall thickness of the CW tracheid was 10.9 ± 0.2 μm, while that of the OW was only 5.6 ± 0.1 μm and that of LW was 6.2 ± 0.1 μm (Figure 6c). The differences between CW, LW, and OW tracheids’ double wall thicknesses were highly significant (p < 0.01).
The average wall–cavity ratio of the CW tracheid was 0.57, which was significantly greater than those of the LW and OW tracheids, while the average values for the tracheids of LW and OW were 0.22 and 0.18, respectively (Figure 6d). The differences between the wall–cavity ratios of CW, LW, and OW were highly significant (p < 0.01). The average cavity–diameter ratio of CW tracheids was 0.64, significantly different from those of LW and OW tracheids (p < 0.01). The average cavity–diameter ratio of LW tracheids was 0.83, and that of OW tracheids was 0.84 (Figure 6e), which were significantly different from each other (0.01 < p < 0.05).
The axial ratio and circle value of the tracheids can be used to measure the morphology of the cross-section of the tracheids. The closer the axial ratio is to 1, the more like a square or regular circle the tracheid cross-section seems to be. Therefore, comparing the axial ratios of round and square tracheids was not very meaningful, but the axial ratio can better distinguish round and oval tracheids. In comparison to OW and LW tracheids, CW tracheids had an average axial ratio of 1.15 and an average circle value of 0.768 (Figure 6f), both of which were closer to 1 and showed that the tracheids tended to be more round. The axial ratio and circle values of CW tracheids were respectively highly significant (p < 0.01) to those of OW and LW tracheids. The average axial ratios of LW and OW were 1.33 and 1.30, respectively, which were not significantly different. The average circle values of the LW and OW tracheids were 0.608 and 0.587 (Figure 6g), respectively, which were significantly different (0.01 < p < 0.05).

3.4. Cell Wall Structure of Reaction Wood

Lignin has the characteristic of producing autofluorescence under the excitation of fluorescence, which can be used to qualitatively characterize the relative level of lignin concentration in wood cell walls with the help of fluorescence microscopy [34,35,36]. The results of LSCM in Figure 7 showed that the strongest fluorescence effect in CW was in the S2L layer of the cell wall, which showed a uniformly thicker circular shape. The fluorescence intensity of the inner S2 layer was weaker than that of the S2L layer. At the same time, there was almost no or only a very weak fluorescence effect at the CC because of the many intercellular spaces. Therefore, the lignin concentration in the S2L layer of the cell wall in CW was significantly higher than that in the S2 inner layer and the CML, and in the CC, it was extremely low. In LW tracheids, the cell wall S2L layer had the strongest fluorescence effect. No signs of the complete S2L layer were observed in the end walls of the LW tracheids, while it was only present at the angle of the cells, and the thickness was thin. The lignin concentration in LW tracheids was ranked from highest to lowest in the cell wall S2L layer, CC, CML, and the S2 inner layer. In OW, the strongest fluorescence effect was at the angle of the cell, followed by the CML, and the weakest fluorescence intensity was in the S2 layer of the cell wall; no sign of the presence of the S2L layer was observed.
The lignin visualization was performed on the transition region of reaction wood (Figure 8). TA consists of normal tracheids (white arrow) without the secondary cell wall S2L layer and angular square or polygonal compressed tracheids (blue arrow) with the distinct S2L layer. The strongest fluorescence intensity of the normal tracheid was found in CC, indicating that the lignin concentration was higher here than in the secondary cell wall. In contrast, the fluorescence intensity of the compressed tracheid at CC was lower than that of the S2L layer, meaning that the S2L layer had the highest lignin concentration.
In TA, the compressed tracheids had a similar cell morphology to normal tracheids. They had little difference in cell diameter and cell wall thickness, so it was difficult to distinguish the two from each other only by cell morphology. However, with the help of the presence or absence of the secondary cell wall S2L layer, a relatively clear demarcation line between normal and compressed tracheids in the transition region can be determined (the red line in Figure 8c–d). It can be inferred that the variation in the location of lignin deposition was more significant than the variation in cell morphology in the compressed tracheids of T. Zhongshanshan.
In CZ, the latewood cells (white arrow) were square and did not have a secondary cell wall S2L layer, and the fluorescence intensity was stronger at CC. The CW tracheids near latewood (red arrow) were polygonal in the cross-section and had the S2L layer with stronger fluorescence intensity at the angle of the cell and darker fluorescence at CC (Figure 9 left). In OW, latewood tracheids (white arrow) were quadrilateral in shape and had thicker cell walls and smaller diameters than early wood tracheids (blue arrow). The lignin concentration at CC of the latewood tracheids was higher than that at the secondary cell wall of the latewood tracheids, and the lignin concentration at the secondary cell wall of latewood was higher than that at the secondary wall of earlywood.

3.5. Microscopic Distribution of Lignin in Reactive Wood Tracheids

The transverse Raman absorption spectra of CW and OW are shown in Figure 10. The strongest peak of lignin was located at 1595 cm−1, and the secondary peak was located at 1655 cm−1. The strongest peak of cellulose was located at 1094 cm−1.
In CW tracheids, the 1595 cm−1 characteristic peak intensity of the S2L layer was the highest, and the 1655 cm−1 characteristic side peak was formed by the conjugation effect of a carbonyl and benzene ring. The 1595 cm−1 characteristic peak intensity of CC and CML was relatively weak. In general, the characteristic peaks of 1094 cm−1 cellulose in each wall layer were relatively weak. In OW tracheids, the absorption intensity of the 1595 cm−1 characteristic peak in CC was significantly higher than that of the 1094 cm−1 characteristic peak, and the 1595 cm−1 characteristic peak in CML and S2 layer was only slightly higher than the 1094 cm−1.
The wave number range of 1519−1–1712 cm−1 was used for integral imaging to characterize the micro-distribution of lignin in tracheids (Figure 11). The result showed a significant difference in the location of lignin deposition between the CW and the OW. In normal wood (or OW), the lignification process becomes active after forming the S3 layer [35]. In contrast, the formation of lignin in the OW had the following main characteristics: the formation of the S2 layer of the secondary cell wall proceeded simultaneously with a high degree of lignification; the lignification process gradually progressed from the S2L layer to the inner S2 layer; lignification was prolonged, with the most active lignification occurring in the S2L layer [17].

4. Discussion

During reaction wood formation, changes take place in the cell morphology. While the appearance of the S2L layer in the cell wall of compressed tracheids indicated that the distribution of cell wall lignin also changed significantly. The S2L layer of tracheids could not be easily identified by optical microscopy of safranin-stained sections. However, observation of the autofluorescence of lignin by means of a fluorescence microscope is an effective way to identify the S2L layer due to the high lignification of the cell wall S2L layer. Ji, Z. et al. had studied the distribution of lignin in CW tracheids of Pinus yunnanensis by fluorescence microscopy and confocal Raman microscopy [37]. In the present study, the lignin distribution of LW and OW tracheids were added. The occurrence of well-developed compression wood is most often seen in the first ten growth rings from the pith [38], and thus, the young wood of fast-growing T. Zhongshanshan was used in this study.
The results of lignin fluorescence effect and Raman imaging showed that the strongest fluorescence effect in CW and LW was the secondary cell wall S2L layer, and the strongest fluorescence effect in OW was the CC. Although the anatomical characteristics of the LW and TA tracheids did not change significantly, they still had continuous or discontinuous S2L layers. It can be seen that the lignin of the tracheid wall responds more rapidly to external stress than cell morphology. The deposition of lignin occurs after cellulose and hemicellulose, and some studies had shown a correlation between lignin and sugar content in CW [39,40]. Therefore, exploring the concentration and distribution of lignin needs to take into account the influence of other chemical components, which may be a subject for further study. In any case, it is more reasonable to identify the compression wood by the change in chemical composition such as lignin rather than the change in cell morphology.

5. Conclusions

In this work, anatomical characteristics and wall layer structures of fast-growing T. Zhongshanshan reaction wood tracheids were characterized and studied. According to fluorescence microscopy, the tracheids in CZ, LZ, and OZ have different wall layer structures. In CZ, the CW tracheids formed in the middle and posterior part of the growth ring had a continuous S2L layer. While the TA tracheid adjacent to the CW was also found to have the S2L layer, its cell morphology was the same as that of the normal tracheids. In LZ, the S2L layer of the tracheids existed only at the angle of the cell, and the cross-section of tracheids was slightly rounded and polygonal. In OZ, no signs of the presence of the S2L layer were observed in the tracheids. The results of Micro-Raman spectroscopy also showed that the lignin concentration in the S2L layer of reaction wood tracheids was much higher than that in the other cell wall layers. It would appear that the response of the lignin deposition location to external stress was faster than the change in cell morphology. It seems more reliable to identify compressed tracheids based on highly lignified S2L layers than on morphological changes.

Author Contributions

Conceptualization, L.Y., Y.B. and B.P.; methodology, B.P. and J.S.; resources, B.P. and Y.B.; data curation, Y.B.; writing—original draft preparation, L.Y.; writing—review and editing, L.Y., B.P. and X.W. All authors have read and agreed to the published version of the manuscript.

Funding

This research was funded by the National Natural Science Foundation of China [31971585]; the China Postdoctoral Science Foundation [2021M690531], and the Qing Lan project [2021].

Data Availability Statement

The data presented in this study are available upon request from the corresponding author.

Acknowledgments

The authors acknowledge Nanjing Forestry University for providing an adequate learning and technical environment that enabled us to successfully accomplish the objectives in this investigation.

Conflicts of Interest

The authors declare no conflict of interest.

References

  1. Archer, R.R. Growth Stresses and Strains in Trees; Springer Science & Business Media: Berlin/Heidelberg, Germany, 1987. [Google Scholar] [CrossRef]
  2. Klement, I.; Vilkovská, T.; Vilkovský, P.; Hýsek, Š. Structural differences between reaction wood and opposite wood with different drying temperatures. BioResources 2020, 15, 4407–4416. [Google Scholar] [CrossRef]
  3. Klement, I.; Vilkovská, T.; Uhrín, M. Color Changes of Compression and Opposite Spruce Wood (Picea abies L. Karst.) Affected by Different Drying Conditions. BioResources 2019, 14, 6697–6708. [Google Scholar] [CrossRef]
  4. Malan, F.S.; Gerischer, G.F.R. Wood property differences in South African grown Eucalyptus grandis trees of different growth stress intensity. Holzforschung 1987, 41, 331–335. [Google Scholar] [CrossRef]
  5. Zhao, R.; Fei, B.; Yu, H.; Liu, J. Physical and Mechanical Properties of Taxodium ’zhongshansha 302’ and Taxodium distichum Wood. J.-Northeast. For. Univ.-Chin. Ed. 2007, 35, 4–6. [Google Scholar] [CrossRef]
  6. Wimmer, R.; Johansson, M. Effects of reaction wood on the performance of wood and wood-based products. In The Biology of Reaction Wood; Springer: Berlin/Heidelberg, Germany, 2013; pp. 225–248. [Google Scholar] [CrossRef]
  7. Wadenbäck, J.; Clapham, D.; Gellerstedt, G.; von Arnold, S. Variation in content and composition of lignin in Young Wood of norway spruce. Holzforschung 2004, 58, 107–115. [Google Scholar] [CrossRef]
  8. Gindl, W. Comparing mechanical properties of normal and compression wood in Norway spruce: The role of lignin in compression parallel to the grain. Holzforschung 2002, 56, 395–401. [Google Scholar] [CrossRef]
  9. Sharma, M.; Altaner, C.M. Properties of young Araucaria heterophylla (Norfolk Island pine) reaction and Normal Wood. Holzforschung 2014, 68, 817–821. [Google Scholar] [CrossRef]
  10. Donaldson, L.A.; Nanayakkara, B.; Radotić, K.; Djikanovic-Golubović, D.; Mitrović, A.; Bogdanović Pristov, J.; Simonović Radosavljević, J.; Kalauzi, A. Xylem parenchyma cell walls lack a gravitropic response in conifer compression wood. Planta 2015, 242, 1413–1424. [Google Scholar] [CrossRef]
  11. Timell, T.E. Origin and evolution of Compression Wood. Holzforschung 1983, 37, 3–4. [Google Scholar] [CrossRef]
  12. Donaldson, L.A.; Singh, A.P. Formation and structure of Compression Wood. In Plant Cell Monographs; Springer: Berlin/Heidelberg, Germany, 2013; pp. 225–256. [Google Scholar] [CrossRef]
  13. Shelbourne, C.J.; Ritchie, K.S. Relationships between degree of compression wood development and specific gravity and Tracheid characteristics in loblolly pine (Pinus taeda L.). Holzforschung 1968, 22, 185–190. [Google Scholar] [CrossRef]
  14. Yumoto, M.; Ishida, S.; Fukazawa, K. Gradation of the Severity of Compression Wood Tracheids. In Studies on the Formation and Structure of the Compression Wood Cells Induced by Artificial Inclination in Young Trees of Picea glauca; Research Bulletins of the College Experiment Forests Hokkaido University: Sapporo, Japan, 1983; pp. 409–454. [Google Scholar]
  15. Altaner, C.M.; Tokareva, E.N.; Wong, J.C.; Hapca, A.I.; McLean, J.P.; Jarvis, M.C. Measuring compression wood severity in spruce. Wood Sci. Technol. 2008, 43, 279–290. [Google Scholar] [CrossRef]
  16. Donaldson, L.A.; Singh, A.P.; Yoshinaga, A.; Takabe, K. Lignin distribution in mild compression wood of Pinus radiata. Can. J. Bot. 1999, 77, 41–50. [Google Scholar] [CrossRef]
  17. Fukushima, K.; Terashima, N. Heterogeneity in formation of lignin. Wood Sci. Technol. 1991, 25, 371–381. [Google Scholar] [CrossRef]
  18. Boyd, J.D. Helical fissures in compression wood cells: Causative factors and mechanics of development. Wood Sci. Technol. 1973, 7, 92–111. [Google Scholar] [CrossRef]
  19. Zhang, Z.; Ma, J.; Ji, Z.; Xu, F. Comparison of anatomy and composition distribution between normal and compression wood of Pinus bungeana zucc. revealed by Microscopic Imaging Techniques. Microsc. Microanal. 2012, 18, 1459–1466. [Google Scholar] [CrossRef]
  20. Nanayakkara, B.; Manley-Harris, M.; Suckling, I.D.; Donaldson, L.A. Quantitative chemical indicators to assess the gradation of Compression Wood. Holzforschung 2009, 63, 431–439. [Google Scholar] [CrossRef]
  21. Aiso-Sanada, H.; Ishiguri, F.; Irawati, D.; Wahyudi, I.; Yokota, S. Reaction wood anatomy and lignin distribution in gnetum gnemon branches. J. Wood Sci. 2018, 64, 872–879. [Google Scholar] [CrossRef] [Green Version]
  22. Parham, R.A.; Côté, W.A. Distribution of lignin in normal and compression wood of Pinus taeda L. Wood Sci. Technol. 1971, 5, 49–62. [Google Scholar] [CrossRef]
  23. Agarwal, U.P. Raman imaging to investigate ultrastructure and composition of plant cell walls: Distribution of lignin and cellulose in black spruce wood (Picea mariana). Planta 2006, 224, 1141–1153. [Google Scholar] [CrossRef]
  24. Zhang, X.; Li, L.; Xu, F. Chemical characteristics of wood cell wall with an emphasis on ultrastructure: A mini-review. Forests 2022, 13, 439. [Google Scholar] [CrossRef]
  25. Donaldson, L.A.; Radotic, K. Fluorescence lifetime imaging of lignin autofluorescence in normal and Compression Wood. J. Microsc. 2013, 251, 178–187. [Google Scholar] [CrossRef] [PubMed]
  26. Tarmian, A.; Azadfallah, M. Variation of cell features and chemical composition in spruce consisting of opposite, normal, and compression wood. BioResources 2008, 4, 194–204. [Google Scholar]
  27. Timell, T.E. Compression Wood in Gymnosperms; Springer: Berlin/Heidelberg, Germany, 1986; Volume 1–3. [Google Scholar]
  28. Purusatama, B.D.; Kim, N.H. Quantitative anatomical characteristics of compression wood, lateral wood, and opposite wood in the stem wood of Ginkgo biloba L. BioResources 2018, 13, 8076–8088. [Google Scholar] [CrossRef]
  29. Eom, Y.; Butterfield, B.G. Anatomical comparisons of compression, opposite, and lateral woods in New Zealand radiata pine (Pinus radiata D. Don). J. Korean Wood Sci. Technol. 1997, 25, 88–99. [Google Scholar]
  30. Harris, J.M. Within-tree variation in anatomical properties of compression wood in Radiata Pine. IAWA J. 2004, 25, 253–271. [Google Scholar] [CrossRef]
  31. González, O.M.; Velín, A.; García, A.; Arroyo, C.R.; Barrigas, H.L.; Vizuete, K.; Debut, A. Representative Hardwood and Softwood Green Tissue-Microstructure Transitions per Age Group and Their Inherent Relationships with Physical–Mechanical Properties and Potential Applications. Forests 2020, 11, 569. [Google Scholar] [CrossRef]
  32. Bond, J.; Donaldson, L.; Hill, S.; Hitchcock, K. Safranine fluorescent staining of wood cell walls. Biotech. Histochem. 2008, 83, 161–171. [Google Scholar] [CrossRef]
  33. Yoshizawa, N.; Itoh, T.; Shimaji, K. Variation in features of compression wood among gymnosperms. Bull. Utunomiya Univ. For. 1982, 16, 269–277. [Google Scholar]
  34. Saka, S.; Whiting, P.; Fukazawa, K.; Goring, D.A. Comparative studies on lignin distribution by UV microscopy and bromination combined with EDXA. Wood Sci. Technol. 1982, 16, 269–277. [Google Scholar] [CrossRef]
  35. Donaldson, L.A. Lignification and lignin topochemistry—An ultrastructural view. Phytochemistry 2001, 57, 859–873. [Google Scholar] [CrossRef]
  36. Shen, X.; Guo, D.; Jiang, P.; Li, G.; Yang, S.; Chu, F. Reaction mechanisms of furfuryl alcohol polymer with wood cell wall components. Holzforschung 2021, 75, 1150–1158. [Google Scholar] [CrossRef]
  37. Ji, Z.; Ma, J.-F.; Zhang, Z.-H.; Xu, F.; Sun, R.-C. Distribution of lignin and cellulose in compression wood tracheids of pinus yunnanensis determined by fluorescence microscopy and confocal Raman microscopy. Ind. Crops Prod. 2013, 47, 212–217. [Google Scholar] [CrossRef]
  38. Harris, J.M. Shrinkage and density of radiata pine compression wood in relation to its anatomy and mode of formation. N. Z. J. For. Sci. 1977, 7, 91–106. [Google Scholar]
  39. Chen, Q.; Hu, Z.; Chang, H.; Li, B. Micro analytical methods for determination of compression wood content in loblolly pine. J. Wood Chem. Technol. 2007, 27, 169–178. [Google Scholar] [CrossRef]
  40. Peng, H.; Salmén, L.; Stevanic, J.S.; Lu, J. Structural Organization of the cell wall polymers in compression wood as revealed by FTIR microspectroscopy. Planta 2019, 250, 163–171. [Google Scholar] [CrossRef] [PubMed]
Figure 1. Reaction wood sample illustration. Compression zone (CZ), lateral zone (LZ), and opposite zone (OZ) in an individual growth ring of Taxodium hybrid Zhongshanshan. Compression wood (CW) and transition area (TA) are in the CZ. The wood in OZ is called opposite wood (OW), and the wood in LZ is called lateral wood (LW).
Forests 13 01792 g001
Figure 2. Schematic diagram for calculating the roundness value of tracheid cross-sections.
Forests 13 01792 g002
Figure 3. The position of CW within the growth ring of T. Zhongshanshan. (CZ-E: early wood of CZ; CZ-L: late wood of CZ).
Forests 13 01792 g003
Figure 4. Anatomical structure of CW, LW, and OW of T. Zhongshanshan. From top to bottom: CW, LW, and OW.
Forests 13 01792 g004
Figure 5. The ultrastructure of CW, LW, and OW tracheids of T. Zhongshanshan.
Forests 13 01792 g005
Figure 6. Box and whisker plot of tracheid dimensions for CW, OW, and LW tracheids showing the mean, standard deviation, and standard error. (a) tracheid’s length; (b) tracheid’s diameter; (c) tracheid’s double wall thickness; (d) wall–cavity ratio; (e) cavity–diameter ratio; (f) axial ratio; (g) circle.
Forests 13 01792 g006
Figure 7. Lignin distribution in the cell walls of CW, LW, and OW tracheids. (CC: cell corner; S2L: the outer S2 layer).
Forests 13 01792 g007
Figure 8. Lignin distribution in the cell walls of TA tracheids. The blue arrow points to the compressed tracheids, the white arrow points to the normal tracheids and the red line represents the demarcation line between normal and compressed tracheids. (a,b) confocal fluorescence images; (c,d) fluorescence microscope image.
Forests 13 01792 g008
Figure 9. Lignin distribution in the cell walls of latewood in CZ and OZ tracheids. The white arrow points to the late wood, the red arrow points to the CW tracheids near latewood, and the blue arrow points to the early wood.
Forests 13 01792 g009
Figure 10. Transverse Raman absorption spectra in cross-section of CW (a) and OW (b). Bands at 1094 cm–1 were due to cellulose. Bands at 1595 cm–1 and 1655 cm–1 were due to lignin. (CML: compound middle lamella).
Forests 13 01792 g010
Figure 11. Raman images of lignin in the cell wall of CW and OW. For comparison, Figure (b) is adjusted to the same color scale as Figure (a) to obtain Figure (c). The lignin concentration in CC of OW (red, 2000 intensity units) is higher than that in CC of CW cell (yellow, 1750 intensity units), but lower than that in the S2L layer of the CW cell wall (dark red, 2250–2500 intensity units).
Forests 13 01792 g011
Publisher’s Note: MDPI stays neutral with regard to jurisdictional claims in published maps and institutional affiliations.

