Article

Dendrochemistry in Public Health: A Case Study in North Carolina, USA

1
Laboratory of Tree-Ring Research, University of Arizona, Tucson, AZ 85721, USA
2
Odyssey Research Institute, Tucson, AZ 85710, USA
*
Author to whom correspondence should be addressed.
Forests 2022, 13(11), 1767; https://doi.org/10.3390/f13111767
Submission received: 30 September 2022 / Revised: 17 October 2022 / Accepted: 24 October 2022 / Published: 27 October 2022

Abstract

:
Dendrochemistry, the measurement of element concentrations in tree rings for the purpose of assessing temporal changes in chemical environments, was used to study an area in south-central North Carolina, USA, that has experienced higher than expected incidences of a couple human illnesses. A principal objective of applying dendrochemistry around an area with public health problems is to assess the environmental chemistry through time to see if the environmental abundance of any elements has changed recently, which then might inform further research into the possible linkage between those elements and the reported illnesses. Loblolly pine is common in the study area and, therefore, was chosen for sampling. Using acid digestion ICP-MS, decadal chunks of rings were measured for the concentration of multiple elements. Most of the elements measured do not show any particular changes in concentration throughout the time period covered by the trees, but four elements (molybdenum, chromium, iron, and, possibly, vanadium) show concentrations in the most recent decade (the 2010s) that were higher than for previous decades. Because this study was ecologic in design, it is not possible to associate these elements with the illnesses that are being reported for the area based on this study alone, but further environmental monitoring might be merited to confirm the temporal pattern found here.

1. Introduction

In the realm of public health, illnesses have background rates of incidence that are considered baseline minima. For example, in the US, the age-adjusted incidence rate of leukemia in children and adolescents younger than 20 years of age is 4.7 per 100,000 children per year [1]. Additionally, in the US, the rate of female breast cancer in 2019 was about 130 new cases per 100,000 women [2]. It is not that incurring any cases of an illness is acceptable, but rather that illness is inevitable at some background frequency that cannot be avoided [3].
If or when the incidence rate of an illness for a discrete place and/or period of time exceeds the background rate for that illness, concern might arise that something is wrong. For example, in the late 1990s, Fallon, Nevada, USA experienced an unusual incidence rate of childhood leukemia, about 12× the background rate, which was dubbed “one of the most unique clusters of childhood cancer ever reported” [4]. Additionally, beginning in the late 1990s, Clyde, Ohio, USA experienced about 2× the background rate of multiple types of cancer in children [5].
Upon identifying even the possibility of a public health problem in a place, a scientific investigation might be initiated for the purpose of at least documenting the problem, as well as for, perhaps, searching for a cause of the higher than expected incidence of illness. A sense of pessimism pervades such investigations, as it is commonly felt, for various reasons, that public health problems (illness clusters) cannot be solved by finding a cause for the higher frequency of cases [6]. Nonetheless, the effort is often exerted anyway. Fallon, Nevada was studied extensively and in multiple ways, including through conducting health surveys, testing water quality, assaying soil for contaminants, and quantifying airborne constituents [7,8]. The Fallon investigations were carried out by government agencies at multiple levels, as well as by academic entities. Clyde, Ohio was similarly studied extensively, also by government agencies and by academics [5].
A question inevitably emerges in investigations of public health problems: Has anything changed through time in or around the area of the problem? Changes that might affect public health include zoning laws for development projects [9], industry that might discharge or emit a contaminant [10], or roads causing an increase in vehicular traffic [11]. These kinds of changes in development might alter the environmental quality of an area or region by changing the quantity and/or exact composition of airborne particulates [12].
A method for assessing environmental change through time is dendrochronology, the study of tree rings. Traditional applications for dendrochronology include dating cultural and/or environmental events of the past [13,14] or reconstructing climate back in time beyond human memory or meteorological record keeping [15].
A subdiscipline of tree-ring analysis is dendrochemistry, the measurement of element concentrations in tree rings for the purpose of assessing changes in chemical environments [16]. Among other applications of dendrochemistry [17], this technique can be used in environmental studies of areas with public health problems. For example, tree-ring chemistry was employed in the investigation of the cluster of childhood leukemia in Fallon, Nevada [18,19], as well as in the environmental assessment of the excessive cancer in Clyde, Ohio [20].
It is not 100% straightforward just how to get started with dendrochemistry in an area apparently afflicted with too much incidence of a disease. Many questions arise:
  • What tree species grow in the study area and how suitable are they for dendrochronological analysis generally [21] and dendrochemistry specifically [22]?
  • Will trees be sampled within neighborhoods or from urban parks, or some combination of sampling sites?
  • Will trees be sampled with or without consideration of locations of either sick individuals or of potential point sources of a contaminant?
  • Will the sampling scheme include trees that might reasonably be considered as “controls”, in the sense that they are growing outside of the area of the public health problem [23]?
  • How many trees will be sampled, recognizing the reality that the chemical measurement of tree rings is expensive and that it could cost thousands of dollars to measure rings of even just a single tree?
  • What temporal resolution will be measured? Measuring at the annual scale would be costly, perhaps prohibitively, and individual rings might not provide enough wood biomass to confidently measure chemically. However, would a coarser time span (e.g., 2 years, 5 years, or decadal) adequately show changes through time in environmental chemistry?
  • What chemical elements will be measured in the tree rings? It is not necessarily knowable ahead of time which elements should be of interest in urban settings [24].
  • How will data analysis proceed in the search for element signals held across trees in the face of inter-tree variability, which can be high in dendrochemistry [25]?
An objective of this work is to consider these questions surrounding dendrochemistry in public health. A recent investigation serves as a case study. We became aware of an area that appears to be experiencing certain cancers at a higher rate of incidence than expected from baseline rates. We were asked to conduct dendrochemistry in and around this area to possibly determine if anything has changed in the recent past in terms of environmental chemistry. All of the questions listed above arose and needed to be considered. We agreed to try dendrochemistry in this case study, and in so doing, had the experience described herein.

2. Materials and Methods
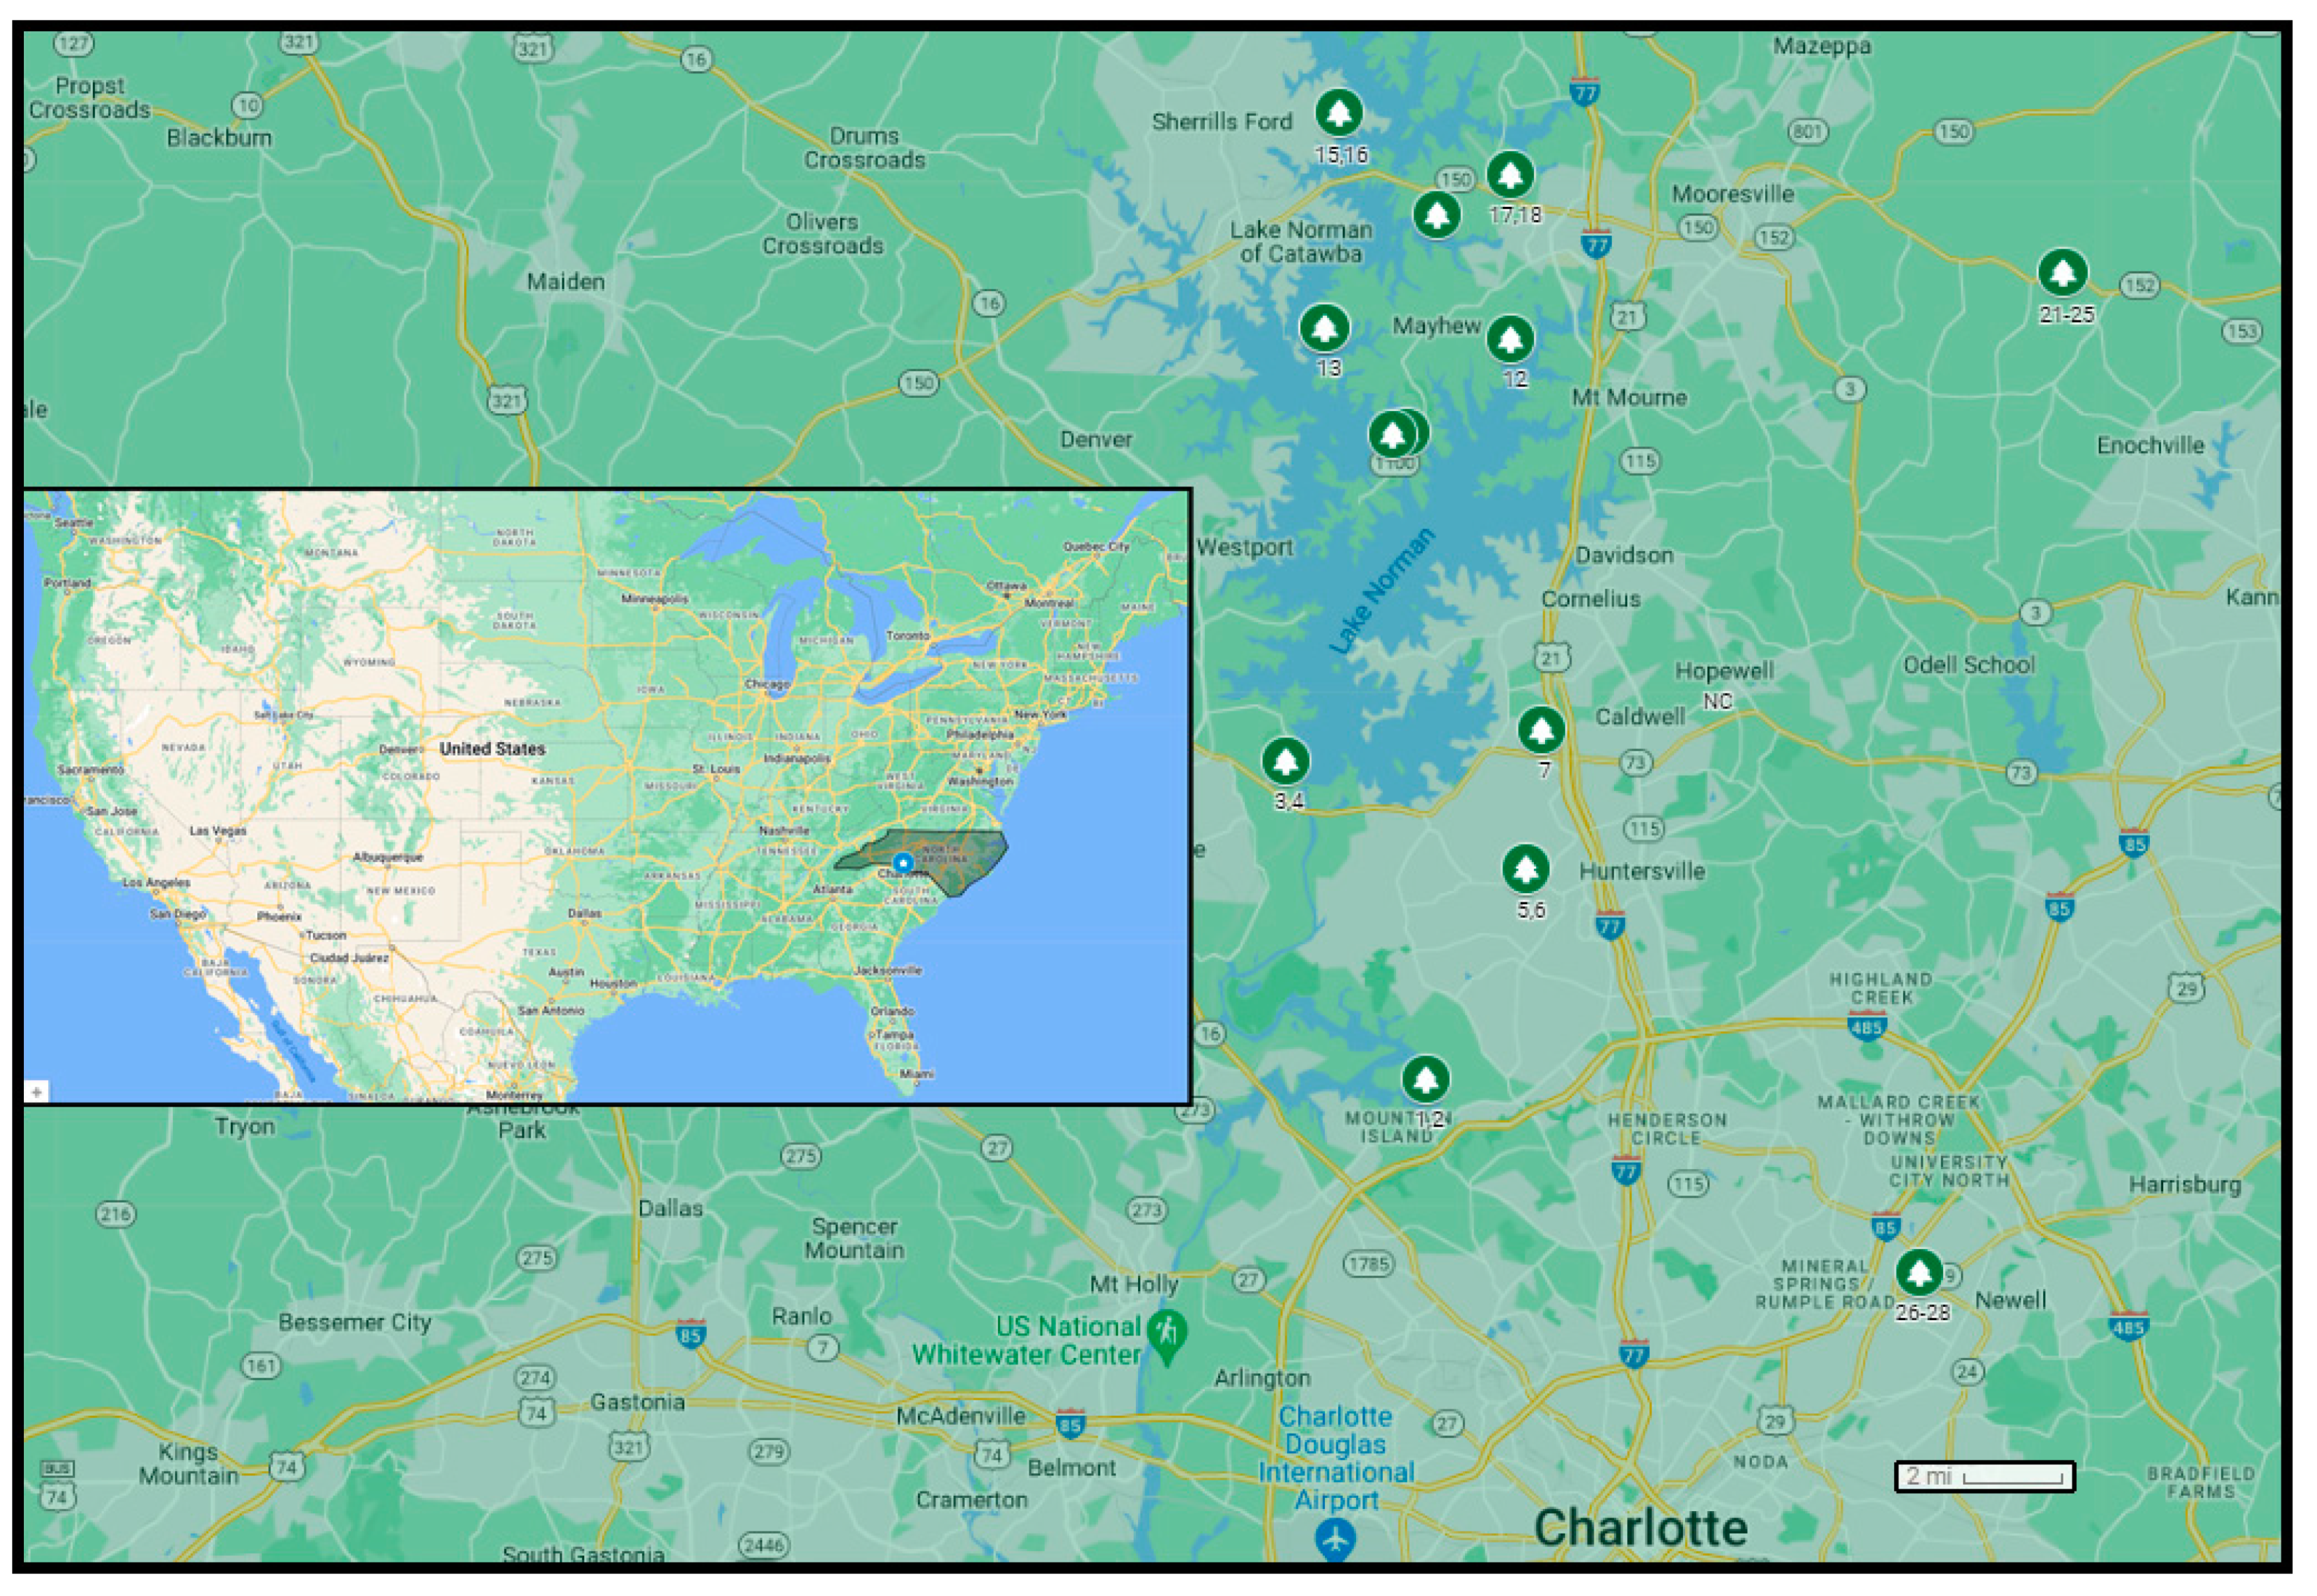
2.1. Study Area

This study site is in the state of North Carolina, along the east coast of the US (Figure 1, inset). In south-central North Carolina, just north of the city of Charlotte, a reservoir named Lake Norman has multiple communities scattered throughout with variable densities of housing, parks, industry, and open areas (Figure 1). In 2018, it was reported that a couple communities near Lake Norman had higher than expected incidences of thyroid cancer [26]. The area has also experienced higher than expected incidences of ocular melanoma [27]. Relevant agencies have been investigating the area [28], but no clear cause of these public health problems has been identified.
The question arose of the timing of possible environmental change in the past around Lake Norman. Perhaps it would be instructive knowing when something in the environment changed relative to the perceived onset of the public health problems. The state epidemiologist noted that in addition to it being hard to identify what might be causing increases in cancer, it is also hard to determine when an issue began across an area [28]. Multiple techniques exist for monitoring and assessing environments for public health reasons, constituting a scientific subdiscipline known as environmental epidemiology [29]. Of those many techniques, one that focuses on environmental change through time at a sufficiently fine temporal resolution is dendrochemistry [30]. Upon being asked to carry out dendrochemistry in and around Lake Norman, we agreed.
The approach used here to study environments of areas with public health problems falls within the style of investigation known as ecologic study [31], wherein environments are characterized broadly, as opposed to focusing on specific locations near individuals afflicted with the illness of concern [32]. A fundamental limitation of ecologic study is that it cannot conclude that something environmental caused a problem of public health [33]; thus, that was not an objective here. Rather, an objective in ecologic study is to generally characterize environments and/or changes in environments through time so that if something unusual were discovered, then it might become the focus of follow-up biomedical studies that could speak to causal association with the disease at hand [34].

2.2. Field Sampling

Accordingly, an ecologic investigation of the Lake Norman area was carried out. The sampling strategy for this dendrochemistry study was to select trees without regard to the locations of specific individuals who have been sick, to locations of possible sources of environmental contamination, or to specific contaminants thought to be candidates for concern. Rather, trees were chosen to represent the area more broadly (Figure 1). A couple sampling sites located away from the main area of interest were sampled in an attempt to have samples that might be considered controls, i.e., trees growing within the region but away from where the public health problems are located. However, without knowing beforehand the geographical patterns of the environmental chemistry of the area, it was not clear just where control sites could be found.
Tree selection was dictated by multiple criteria. Large-diameter trees were targeted for sampling in order to have as much temporal extent as possible, with decades of time at a minimum. Trees of the conifer type were preferred, as they are easy to obtain increment cores from relative to hardwoods and their growth rings are clearly visible and confidently identifiable [22]. The predominant species wound up being loblolly pine (Pinus taeda), which is common and abundant throughout the Piedmont Plateau, including in North Carolina [35]. Some sampled trees were on private property and were selected because the homeowners knew of this study and helpfully volunteered their permission to collect cores from their trees. Other trees sampled were in natural areas with no clear private ownership, but were representative of forest stands of hundreds, if not thousands, of similar trees. Because of sampling across such different sites (private homes versus public areas), soil conditions such as nutrient status or moisture availability were not controllable for each tree. At each sampling site, at least two trees were collected so as to have the ability to assess inter-tree variability [36]. All trees sampled were healthy, at least outwardly, with no bark abrasions (e.g., fire scars) or obvious indications of bark beetles, for example.
Tree sampling was performed by increment coring, which is the dominant method of sample collection in dendrochronology [37]. The impact of increment coring on trees has been debated [38], but coring is considered not harmful to healthy trees typically used in dendrochronology [39], which characterizes the loblolly pine. A standard borer, 40 cm in length and 5 mm in diameter, was used. Two cores were collected from each tree, with each from the same side of the tree so as to be essentially duplicates of each other. The increment borer was sanitized with isopropyl alcohol in between trees. Increment cores were placed in sterile plastic drinking straws for labeling, protection, and transport.

2.3. Lab Procedures

In the lab, the increment cores were processed specifically for dendrochemistry, as opposed to generally for dendrochronology. Cores were attached to protective mounts for safe keeping, but they were not glued into the mounts, which could be a source of contamination [40]. Rather, cores were just tied to mounts using string. Cores were not sanded, another step that could, if not should, cause contamination by distributing sanding dust across rings [41]. Instead, cores were viewed as-is under a low magnification for the purpose of identifying rings, which, as expected, were clearly visible because growth rings in loblolly pines growing in favorable conditions are usually easy to distinguish [42].
For chemical measurements, an additional sample selection step was invoked. Chemical measurements are expensive relative to ring-width dendrochronology; thus, the measurement started with only a subset of trees and with a temporal resolution coarser than annual. Namely, only one tree from each subsite was chosen for measurement, only one core from each chosen tree was measured, and that core was cut into decadal time chunks. This provided a sufficient amount of data to allow a preliminary view of the dendrochemistry of the area while leaving sample material for conducting more measurements and cross-checking results if necessary. Additionally, measuring decadal time chunks acknowledges the possibility of elements moving across rings [43] and serves as a temporal smoothing technique right from the start [36].
The wood of the tree rings was chemically analyzed via acid digestion, followed by inductively coupled plasma mass spectroscopy (ICP-MS). Oven dried (50 °C) wood samples were weighed into precleaned, preweighed, trace metal-free polypropylene digestion tubes. Depending on the mass of each sample, 3–6 mL of concentrated Optima-grade nitric acid (HNO3) was added to the tube. The samples were allowed to sit at room temperature for two days, and then, were digested at 90 °C in a heat block until digestion was complete, usually between 1 and 2 h. After digestion was complete, the sample tubes were reweighed in order to calculate dilution factors. After thorough mixing, a 1.5 mL aliquot of the digestate was gravimetrically diluted by a factor of 10 with ultrapure 18.2 megaOhm/cm water. Internal standards of Be, Bi, and In were also added.
To calibrate the VG PlasmaQuad 3 ICP-MS, linearity standards were prepared. These linearity standards were diluted from multielement calibration standards obtained from High Purity Standards. Scandium and indium were added to the linearity standards at approximately 20 ppb for scandium and 10 ppb for indium. Be, In, and Bi internal standards were added to the linearity standards at approximately 20 ppb (for Be), 10 ppb (for In), and 5 ppb (for Bi). Four standard points were used to calibrate the instrument for all elements of interest. The exact concentrations for all standards were calculated and these data were used to create the linear calibration curve of instrument response versus concentration (for each analyte). The linearity standards were reanalyzed repeatedly during the analytical run to ensure continuous correct instrument response. Solutions were measured for the concentration of elements of a couple standard sets, namely: Be, Al, V, Cr, Mn, Fe, Co, Ni, Cu, Zn, As, Se, Mo, Ag, Cd, Sn, Sb, Ba, and Pb. The limits of detection were mostly ≤10 ppb. Sample values less than the limit of detection were considered missing values.

3. Results

Intuitively, a first look at the dendrochemistry data could be carried out with nothing more than simple overlay plots of raw concentrations of each element across all trees measured (Figure 2). One feature this approach exposes is if some trees differ from the others by having higher concentrations of an element through time (Figure 2a). In this North Carolina study, one tree (Tree #1, dashed line) does stick out from the others with high concentrations of four elements: Cr, Fe, Mo, and Ni. This tree is not unusual with regard to the other elements measured, and thus, it might merit following up on why this tree has a high concentration of some elements. Accordingly, the subsite pair tree of Tree #1 (Tree #2) was measured. Tree #2 does not show high concentrations of these four elements. This might be an example of inter-tree variability in dendrochemistry, where trees growing close to one another do not necessarily show identical values and/or patterns through time [44].
One other tree (Tree #26) shows high concentrations for Cd (dashed line), and two trees show high concentrations for Ba and Pb (dashed lines) (Figure 2a). It is not immediately apparent what might be causing these trees to be outliers for these elements. In the cases of these elements, the next step in the analysis would be to measure their intrasite pair trees to see if multiple trees show similarly high values.
Otherwise, a dominant feature of this data set of raw concentrations through time is high variability within each series, as well as between trees (Figure 2b). No particular tree or element sticks out as unusual from the others based on most of these plots of raw concentrations.
A ramification of there being outlier trees with high concentrations of an element is that the y-axis scale for that element is inadvertently compressed for all other trees, potentially obscuring signals in relative variability through time that might be held in common across trees. To rectify this, concentration values were normalized within each tree for each element. In standard statistics, normalization is carried out by subtracting the mean from each value and dividing by the standard deviation of a distribution of values [45], thereby putting all samples on the same scale and making it easier to compare them with each other. Here, normalization was performed with a slight modification: instead of using the series mean, the median was subtracted from each value in order to reduce the influence of outlier values within a series. This modification is clearly called for in the case of Tree #1 for Cr, Fe, and Mo (Figure 2a), as these series have outlier values much higher than the other values, but this modification is appropriate generally, in part, because the number of values within each tree for each element is low. The median is safer than the mean for estimating the central tendency of a distribution with few data points [45]. After transformation by normalization, the data were overlay plotted again for all elements and trees measured. An additional time series of median values for each decade was added to each plot to highlight temporal trends held in common across trees, which is similar to the robust estimation of tree-ring chronologies in typical dendrochronology [46].
Sure enough, patterns that were not obvious in the plots of raw concentration values became apparent in the normalized data (Figure 3). At least three elements (Mo, Cr, and Fe) show little to no trend through time up to the 2000s, but then show a sharp increase in the most recent decade, the 2010s (Figure 3a). This pattern is also true for V, though not as strongly. This pattern is expressed, pretty much, by all trees measured, including trees well away from Lake Norman that were sampled to serve as control trees for comparison with trees within the area of Lake Norman. If these elements wound up being of interest in subsequent research on a possible linkage with the illnesses in and around Lake Norman, then technically speaking, this data set does not yet have control trees showing no change in these elements during the 2010s.
A longstanding concern in dendrochemistry is interpreting high values of elements in the outermost rings of trees [47]: Does such a pattern truly reflect a recent increase in environmental availability of these elements throughout the area, in which case, those elements might be legitimate candidates for further study in environmental epidemiology? Or, does this pattern reflect internal tree physiology where concentrations of elements tend to be high in outermost rings simply because that is where the most biological activity is found in the trunks of trees [48], in which case, those elements would not merit further study for environmental interpretation? One way to assess this question in dendrochemistry is to check other elements as a form of control: If most, if not all, elements measured showed high values in the outermost rings, then internal tree physiology could be a plausible explanation over the alternative of there being a change in the environmental variability of everything. Or, if there were other elements that did not show high relative values in the outermost rings, then the elements that did show high values for the last decade might actually be increasing in environmental availability.
In this North Carolina data set, most elements measured do not show high relative values for just the outermost decade (Figure 3b). Some of these elements (Cu, Al, Ni, Sn, Co, and Sb) show upward trends throughout the entire period covered by all trees, which might be evidence of a general increase in population in the area, resulting in slight but steady increases in airborne particulates (dust) generally [49]. Other elements (Mn and Cd) show downward trends throughout the entire period covered by all trees, which might be difficult to explain. Further, other elements (Ag, Se, Ba, As, and Zn) show no trend throughout the entire period covered by all trees, which, at a minimum, is evidence that dendrochemistry can yield time series without abrupt high relative values in the outermost rings. Given this, it is not unreasonable to conclude that Mo, Cr, Fe, and possibly V should be studied further in environmental epidemiology. Is there a plausible environmental explanation for the high environmental availability of these elements recently? Additionally, might human exposure to any of these elements result in adverse health effects?
An element of persistent interest in dendrochemistry, regardless of the motivation of any given study, is lead (Pb). Lead has a long history of being both useful to humanity [50] and harmful to human health if ingested even in minute amounts [51]. The environmental availability of lead increased virtually everywhere throughout the 20th century as a result of adding it to gasoline, which began in the 1920s [52], thereby creating a public health nightmare [53]. By the 1970s in the US, lead began to be phased out of gasoline, with the last of leaded gasoline being available for automobile use in the 1980s [54]. Environmental monitoring since the 1980s has shown decreases in the environmental availability of Pb, as well as in blood lead levels in people [55].
Given that the recent history of lead in the environment is well-known, Pb could serve as a calibration test for dendrochemistry: Can dendrochemistry document the history of lead by showing increases throughout the 1900s up to the 1980s, then leveling off, and then decreasing? Early dendrochemistry of lead was not optimistic, showing movement of lead across rings and, therefore, cautioning against the simple interpretation of the dendrochemistry of lead [56]. Subsequent dendrochemistry publications have had mixed success in documenting Pb through time [57,58,59,60].
What about Pb in this study in North Carolina? No temporal pattern of lead is obvious in the overlay plot of raw concentrations (Figure 2), probably largely due to the existence of two trees with high absolute values compressing the y-axis scale for the other trees. However, after normalization, a pattern of Pb through time does emerge (Figure 3b, the last plot), and it matches well with the history of lead in the environment throughout the 1900s and the 2000s. Lead increased from the 1920s through the 1980s, then leveled off in the 1990s, and then decreased to the present.
One general concern regarding the dendrochemistry of lead has been the possibility of lead concentrations in tree rings correlating with the width of the rings. For example, a negative correlation has been shown, whereby wide rings had low concentrations of Pb and vice versa [61]. Such an association would diminish the dendrochemistry of lead as an independent indicator of the environmental availability of Pb. Testing for this in the North Carolina data, some of the trees do show a negative association between decadal wood mass (a proxy for ring width) and Pb concentrations (Figure S1). However, in only some of those trees is this association strong, whereas in other trees it is weak. In still other trees, the association of the sample mass with Pb concentrations is positive. Thus, in this study Pb concentration is not consistently associated with wood mass, and therefore, the dendrochemistry of Pb is not merely a proxy for ring width.
Confirmation of the history of lead in the environment by these dendrochemistry data should lend credence that other elements are being accurately depicted by these data. For example, the elements showing high values in the outermost decade might actually reflect reality in the environmental availability of those elements.

4. Discussion

The questions underlying the use of dendrochemistry in public health studies can be considered again at this point:
  • Tree selection: Various principles exist for selecting trees for sampling in dendrochronology, ranging from random sampling for general purposes to the targeted selection of trees for specific objectives [62]. Dendrochemistry for public health research often involves sampling within local neighborhoods, including on private property, where selecting trees for study can be dictated more by logistical practicalities than by theoretical preferences of dendrochronological principles. In an ecologic study, the exact location of sample trees is not important, with the emphasis falling more on trees being generally representative of the area. In this study, loblolly pine is common and abundant; thus, that was the species of choice. Reasonably mature trees were selected so as to provide a time series as long as possible, acknowledging that urban trees are not likely to be very old, i.e., rarely older than 50 years. Chronologies of only a few decades in length would not be useful for dendroclimatological reconstructions, but changes in environmental chemistry might not otherwise be knowable back in time for even a couple decades; therefore, 50 years of dendrochemistry results could be quite useful.
    Regardless of the climate of a region, urban trees experience different soil moisture regimes across different residences or public parks, which cannot be controlled for and generally makes the cross-dating of growth rings across trees unlikely at the annual scale. A preferred scenario in dendrochemistry is that sampled trees have clearly visible, discernible growth rings with few if any periods of suppressed growth so that rings can be separated reasonably confidently and provide enough wood biomass to measure for element concentrations at what are bound to be trace levels.
    Urban trees also experience different soil nutrient regimes across different residences or public parks, which cannot be controlled for. Because of this, the raw concentration data of dendrochemistry might reflect variations unrelated to whatever public health issue is occurring. Normalizing data within each tree is especially useful in this case, as relative changes in abundance of any given element across time within each tree are emphasized.
  • Site selection: Various principles also exist for selecting sites for sampling in dendrochronology, usually related to the broad objectives of a study, e.g., climatology [63], ecology [64], or geomorphology [65]. In ecologic studies for public health, no particular site should be more important than others, especially in the beginning phase of a study when there might not be a priori hypotheses about spatial variation in environmental chemistry. In particular, it is not necessary to aim for sampling sites to be near homes of people known to be sick or near specific industries thought to be emitting some contaminant or another. Therefore, site selection for public health studies is more a matter of optimizing the spatial density of sampling across a community or region. If possible, collecting more than one tree at any given location is useful for being able to assess inter-tree variability.
  • Control trees: Collecting trees thought to be away from the area of concern in the public health sense should be useful for providing putative control samples, i.e., trees growing outside the sampling area of interest. However, without knowing spatial patterns of environmental chemistry ahead of time, it is difficult to know with certainty that any given area really will provide a study with control samples. It is possible that trees initially presumed to be controls in a study will be similar to trees located within areas of public health concern, which would mean that true control trees might not be collected in the initial field collection. In that case, multiple field collections would be necessary.
  • Sample depth: Expectations in dendrochronology for the number of trees sampled and measured vary depending on the objectives and the type of measurements being made. Traditional ring-width applications of dendrochronology typically collect a lot of samples, e.g., many tens, if not hundreds, of trees [66]. However, collecting such high numbers of trees is not usually practical in dendrochemistry, in part because of having to sample in neighborhoods. Additionally, measuring tree rings chemically costs money and is expensive, and therefore, it is yet more impractical to measure many trees. Of course, some amount of sample replication is required in dendrochemistry in order to have confidence in the results (“entire [dendrochemistry] investigations based on a single tree … should be discouraged” [43]). Ideally, results from preliminary measurements on a few trees can suggest strategies for measuring more trees in subsequent analyses.
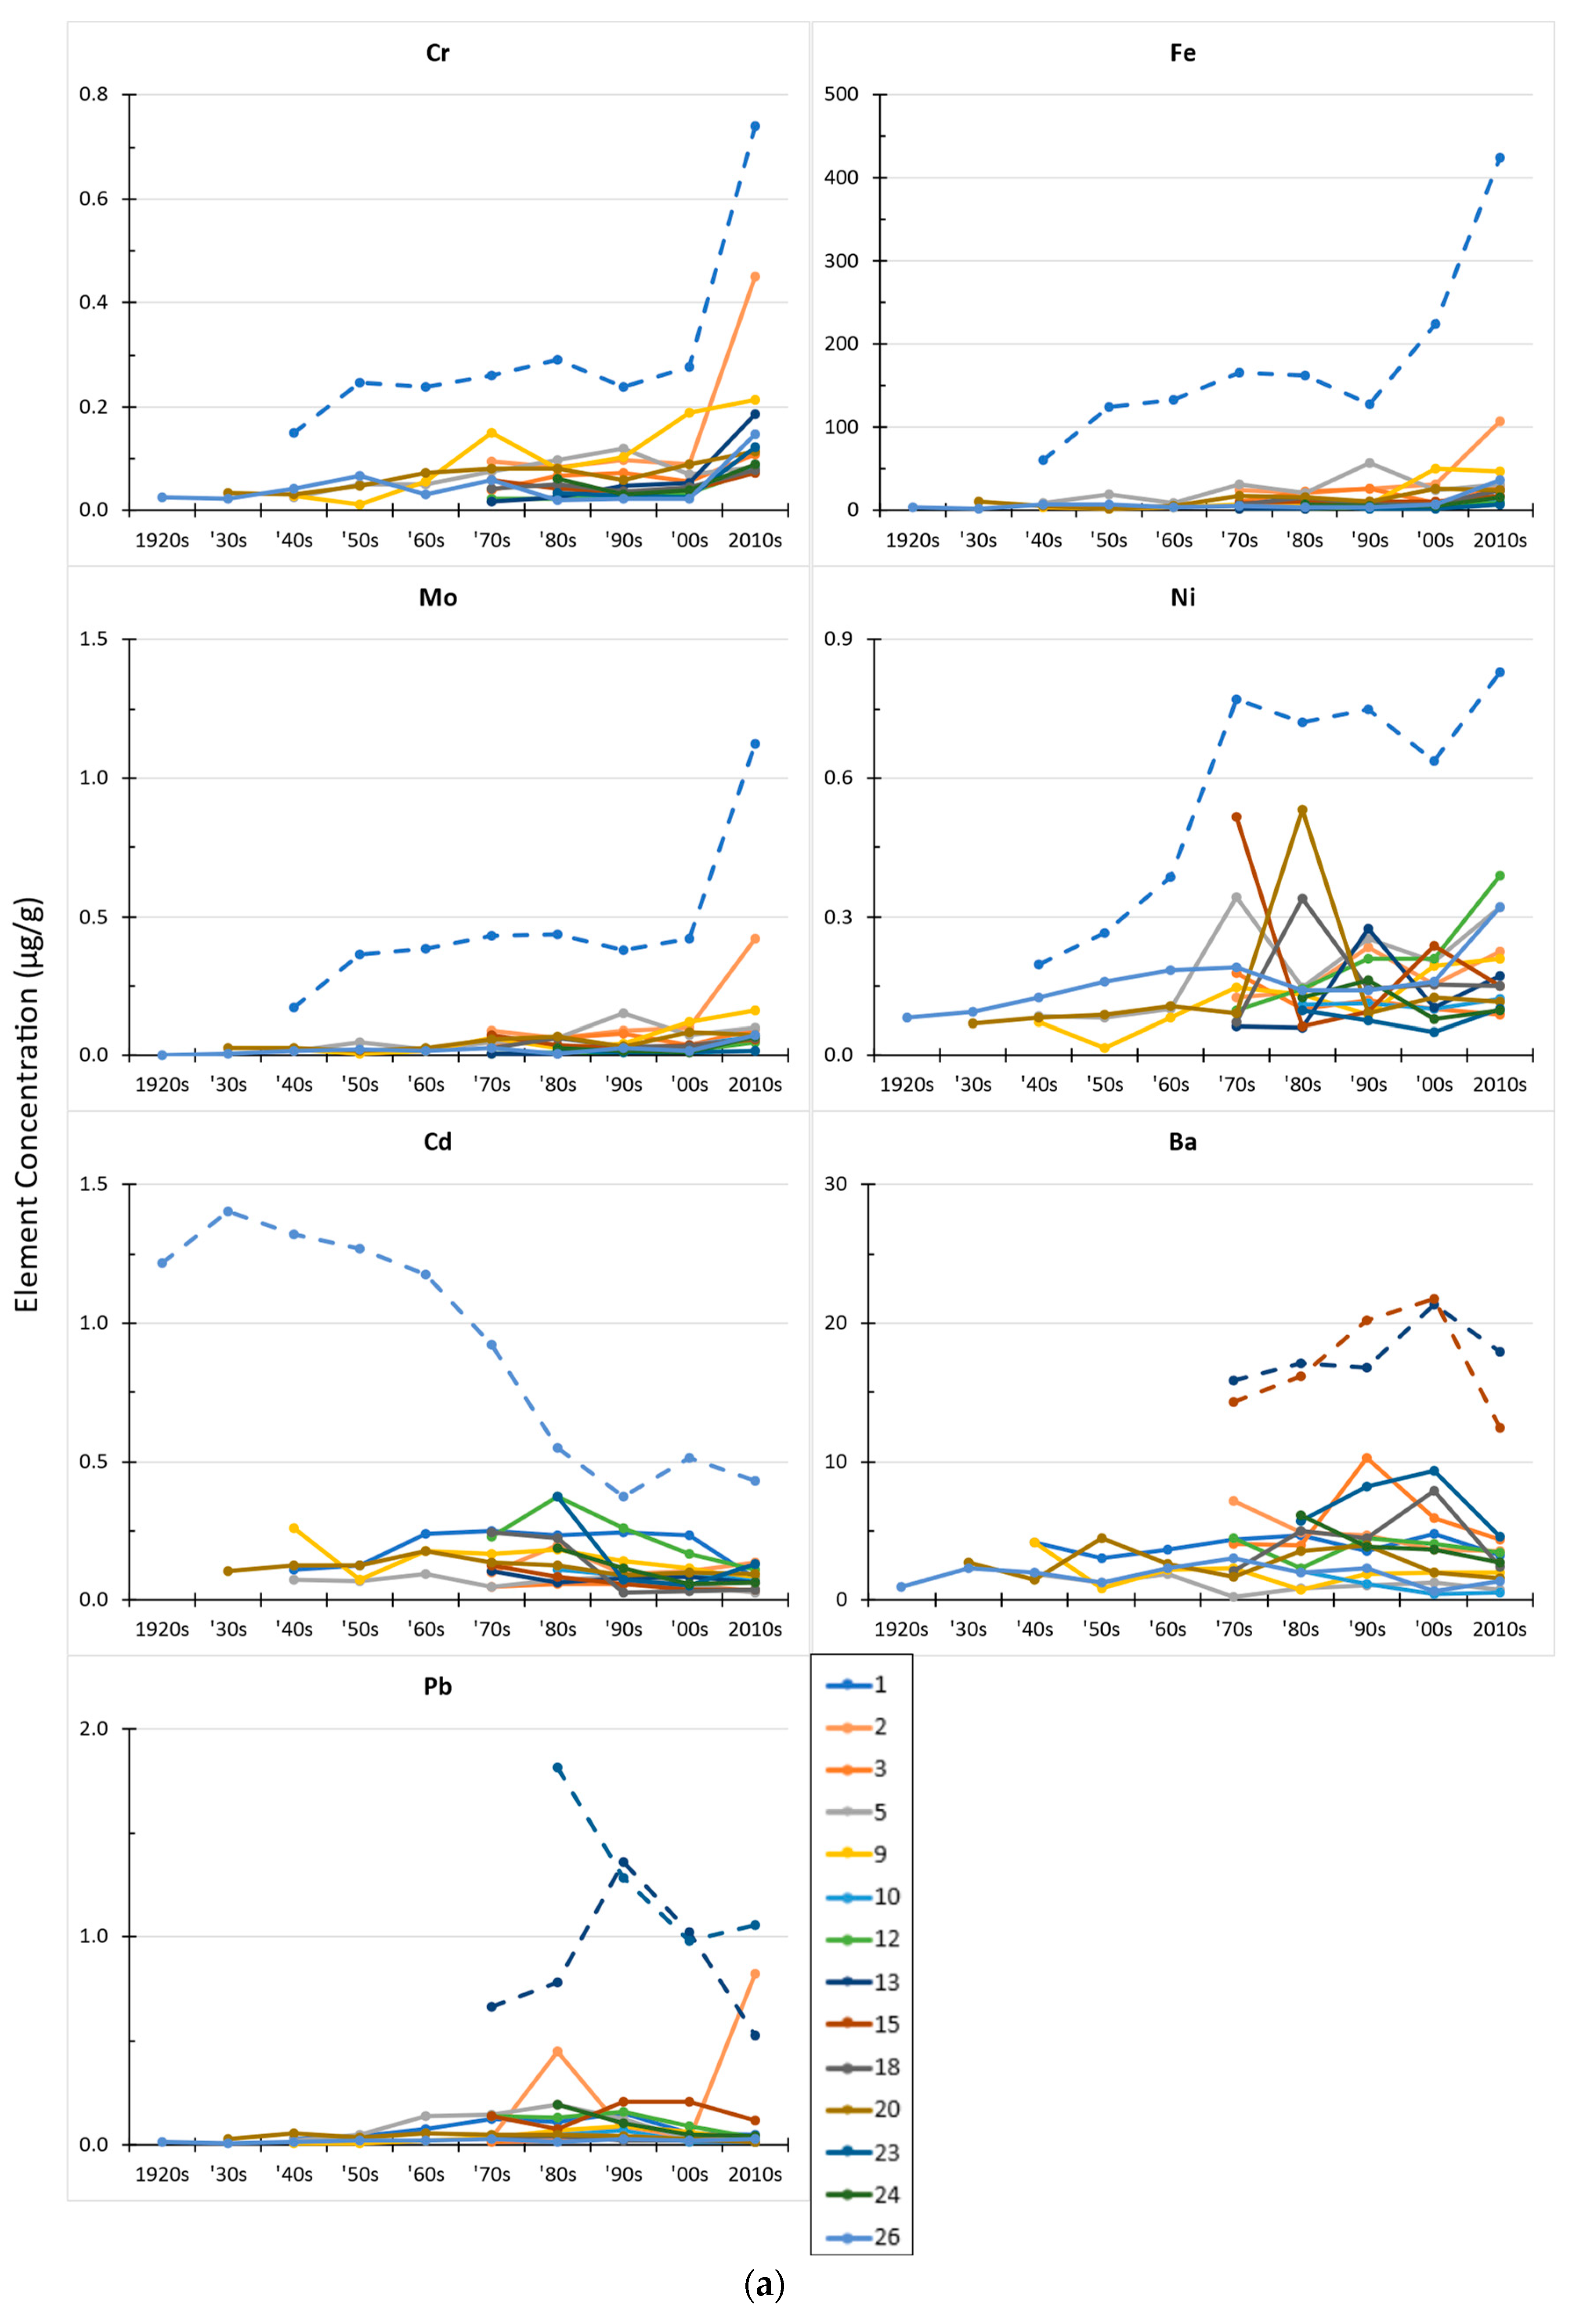
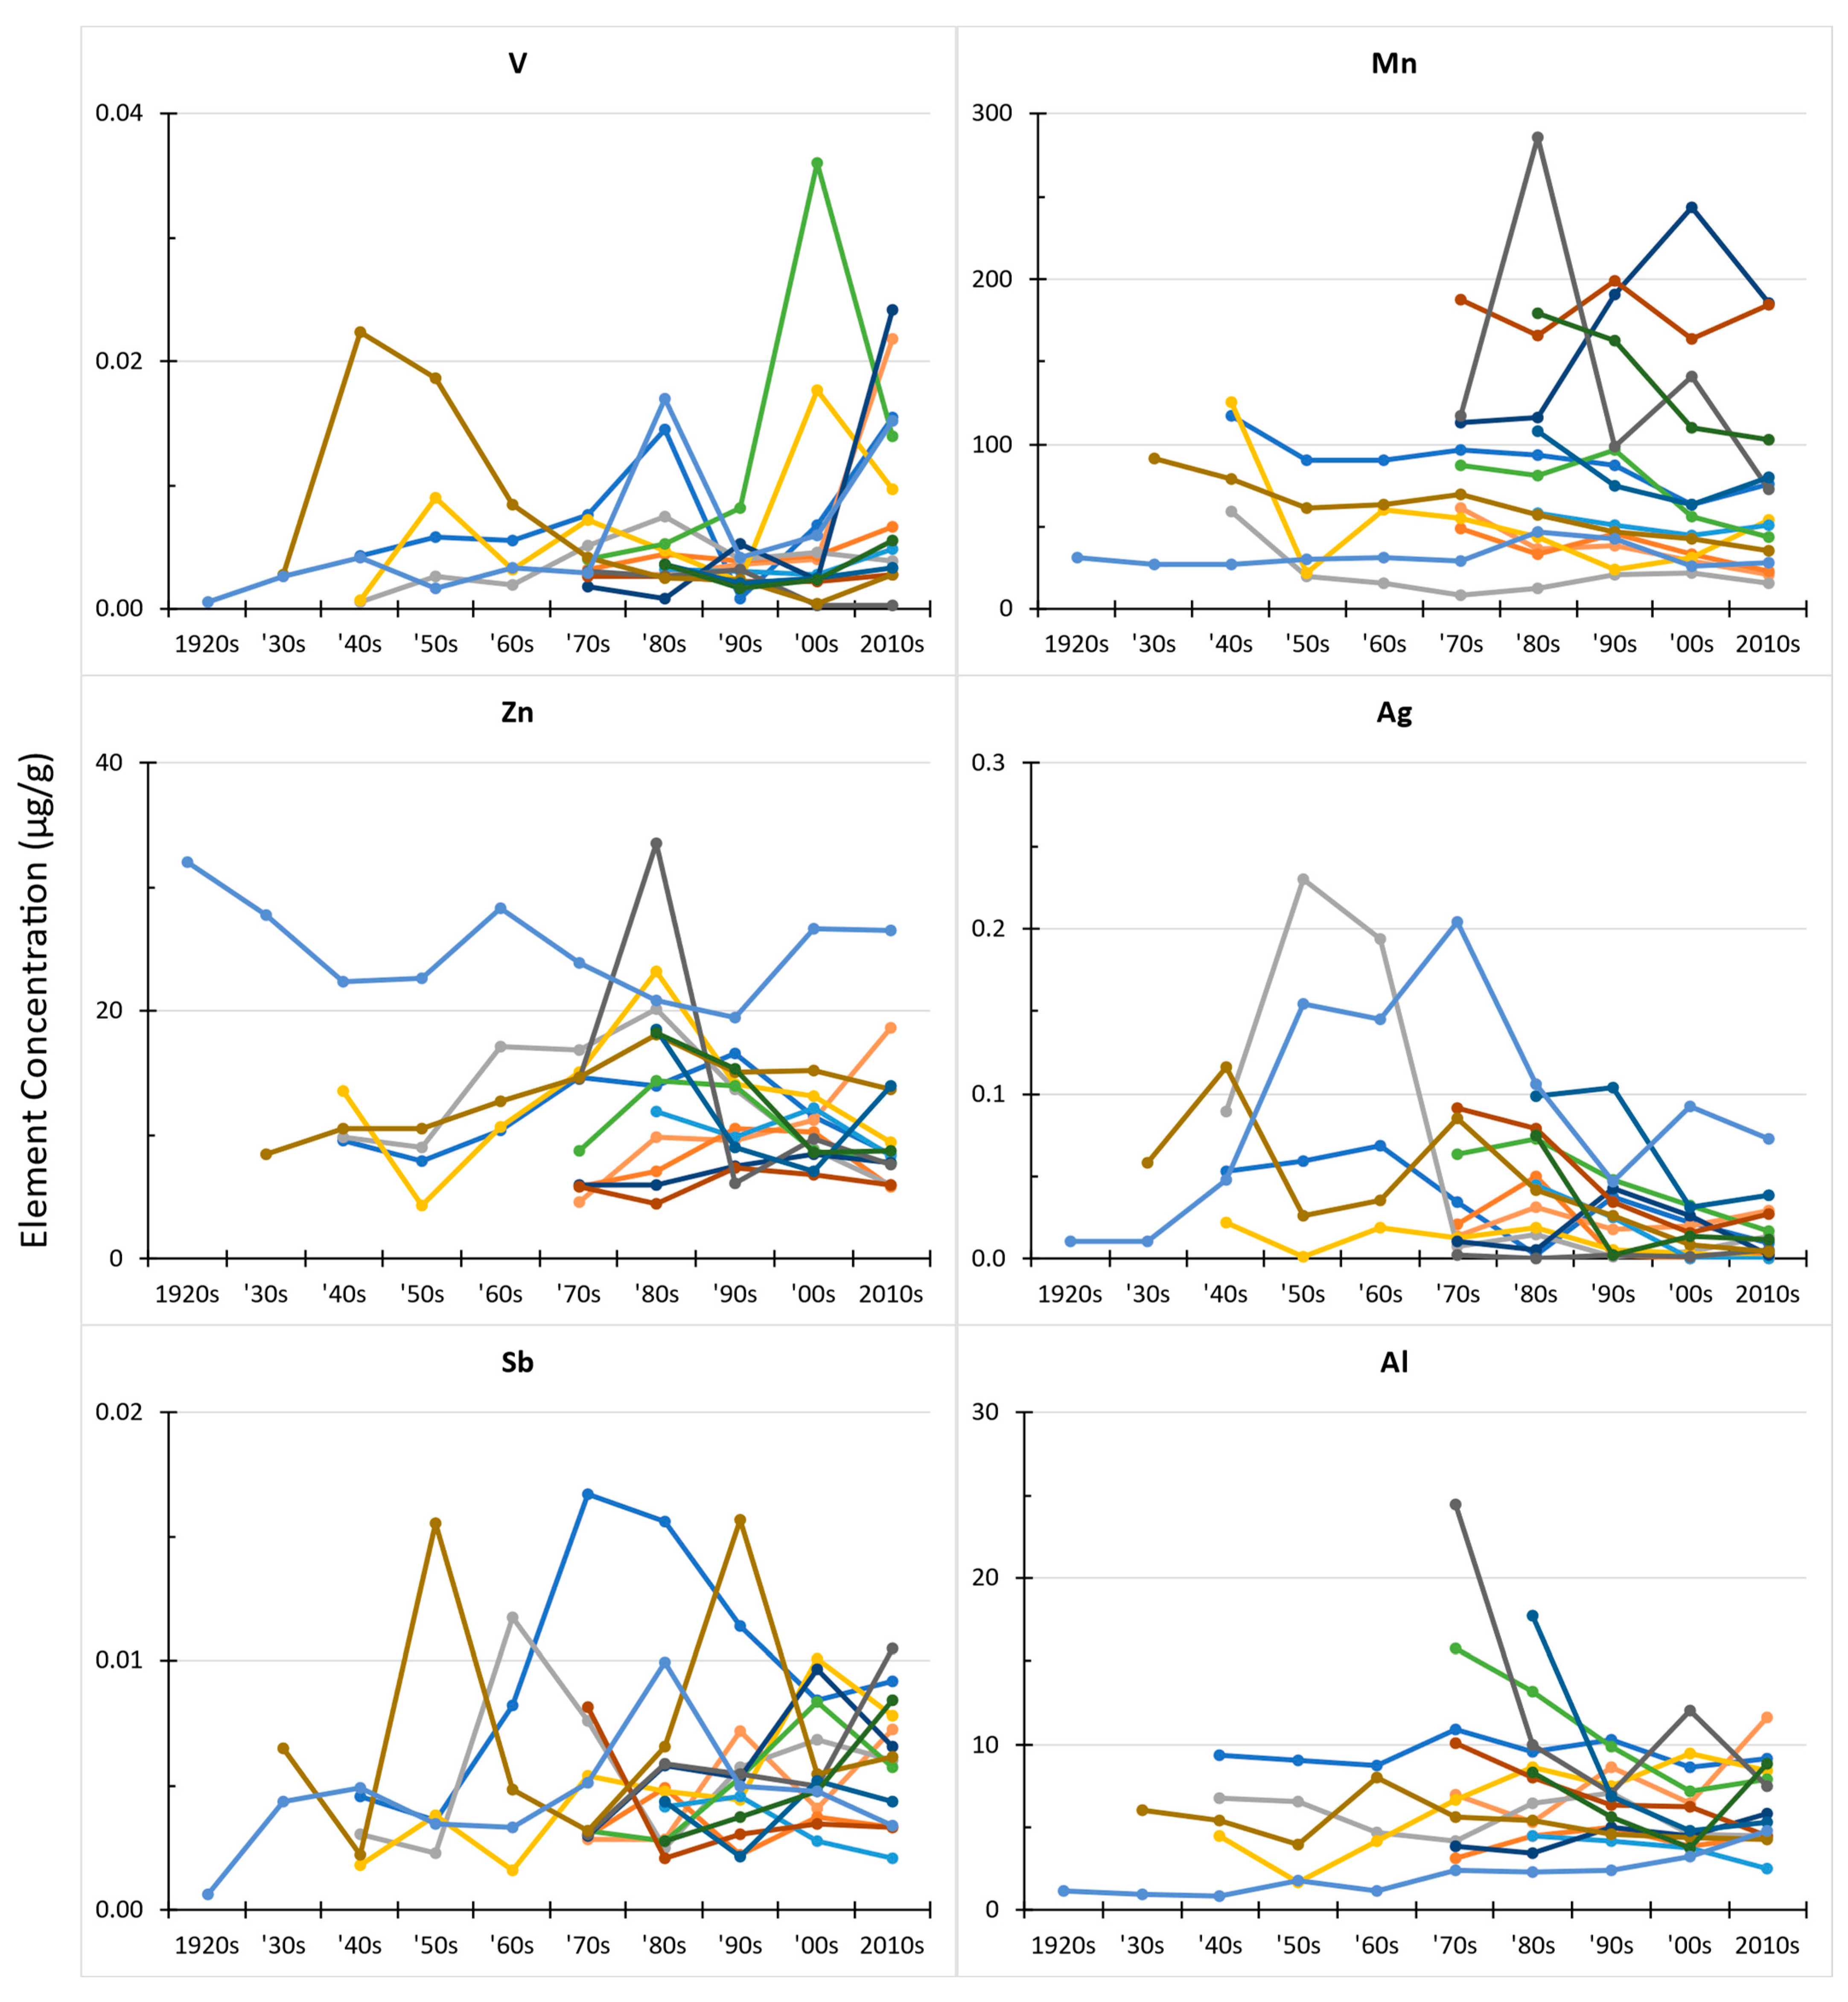
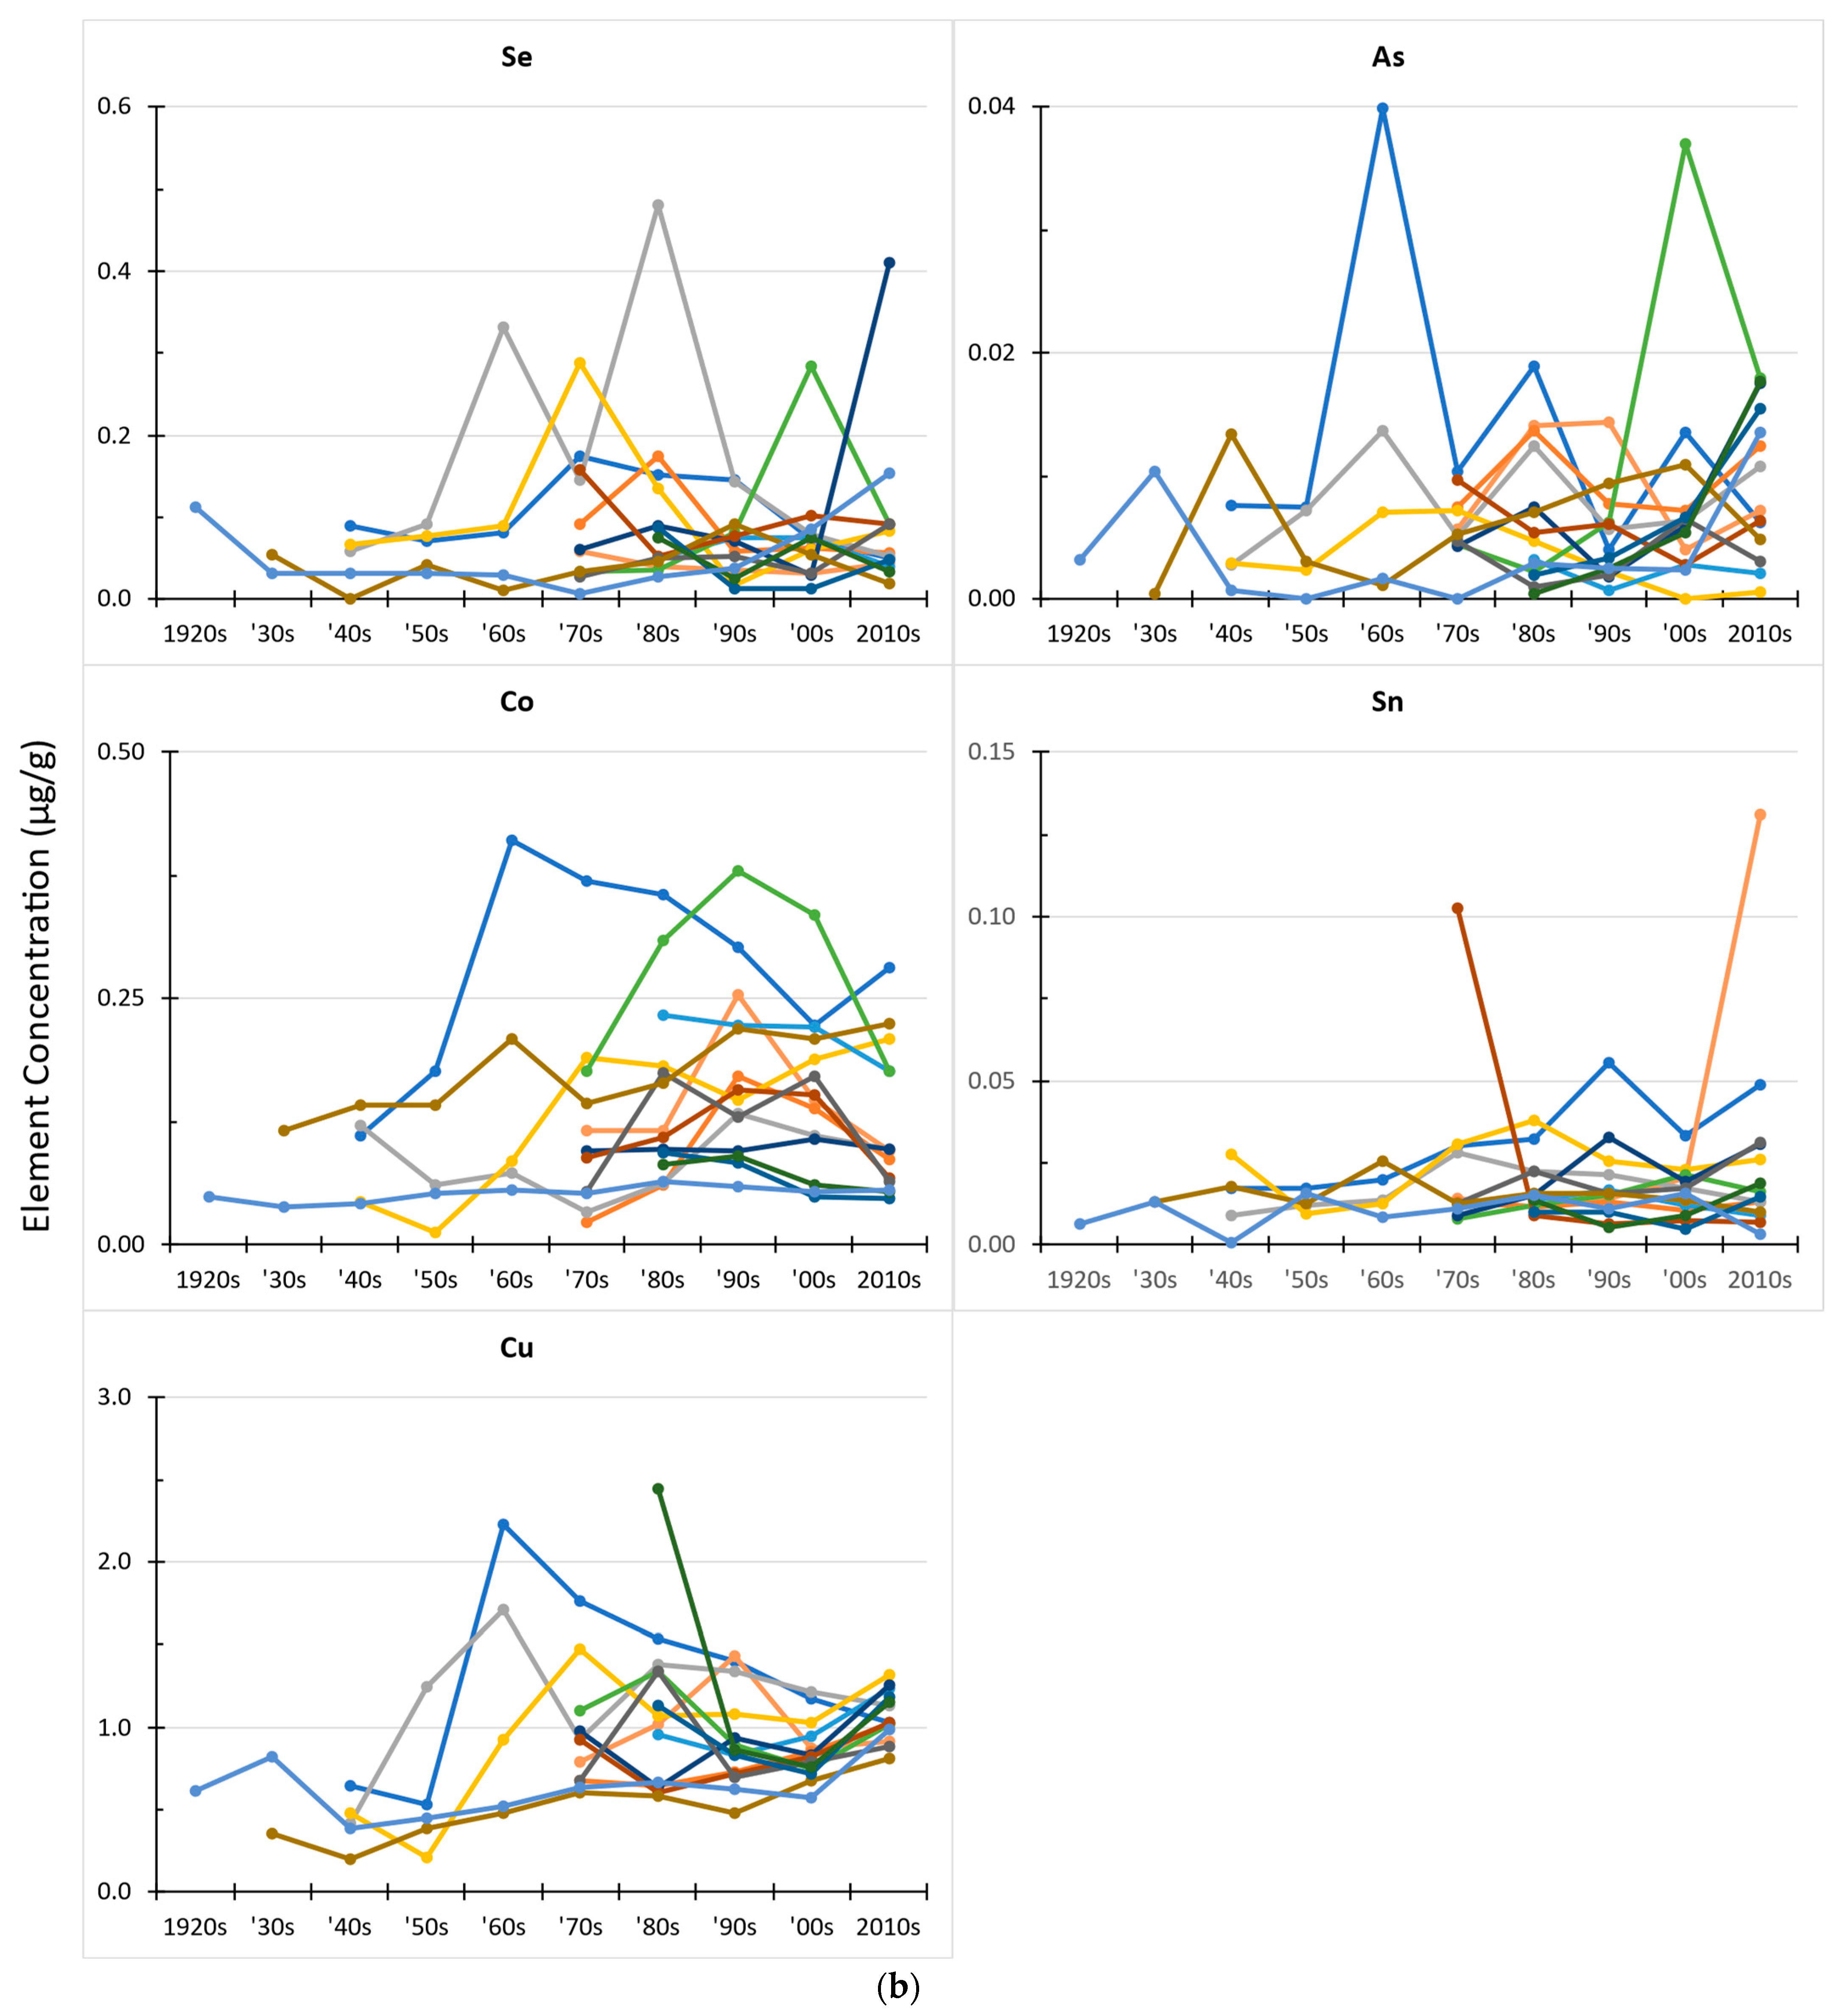
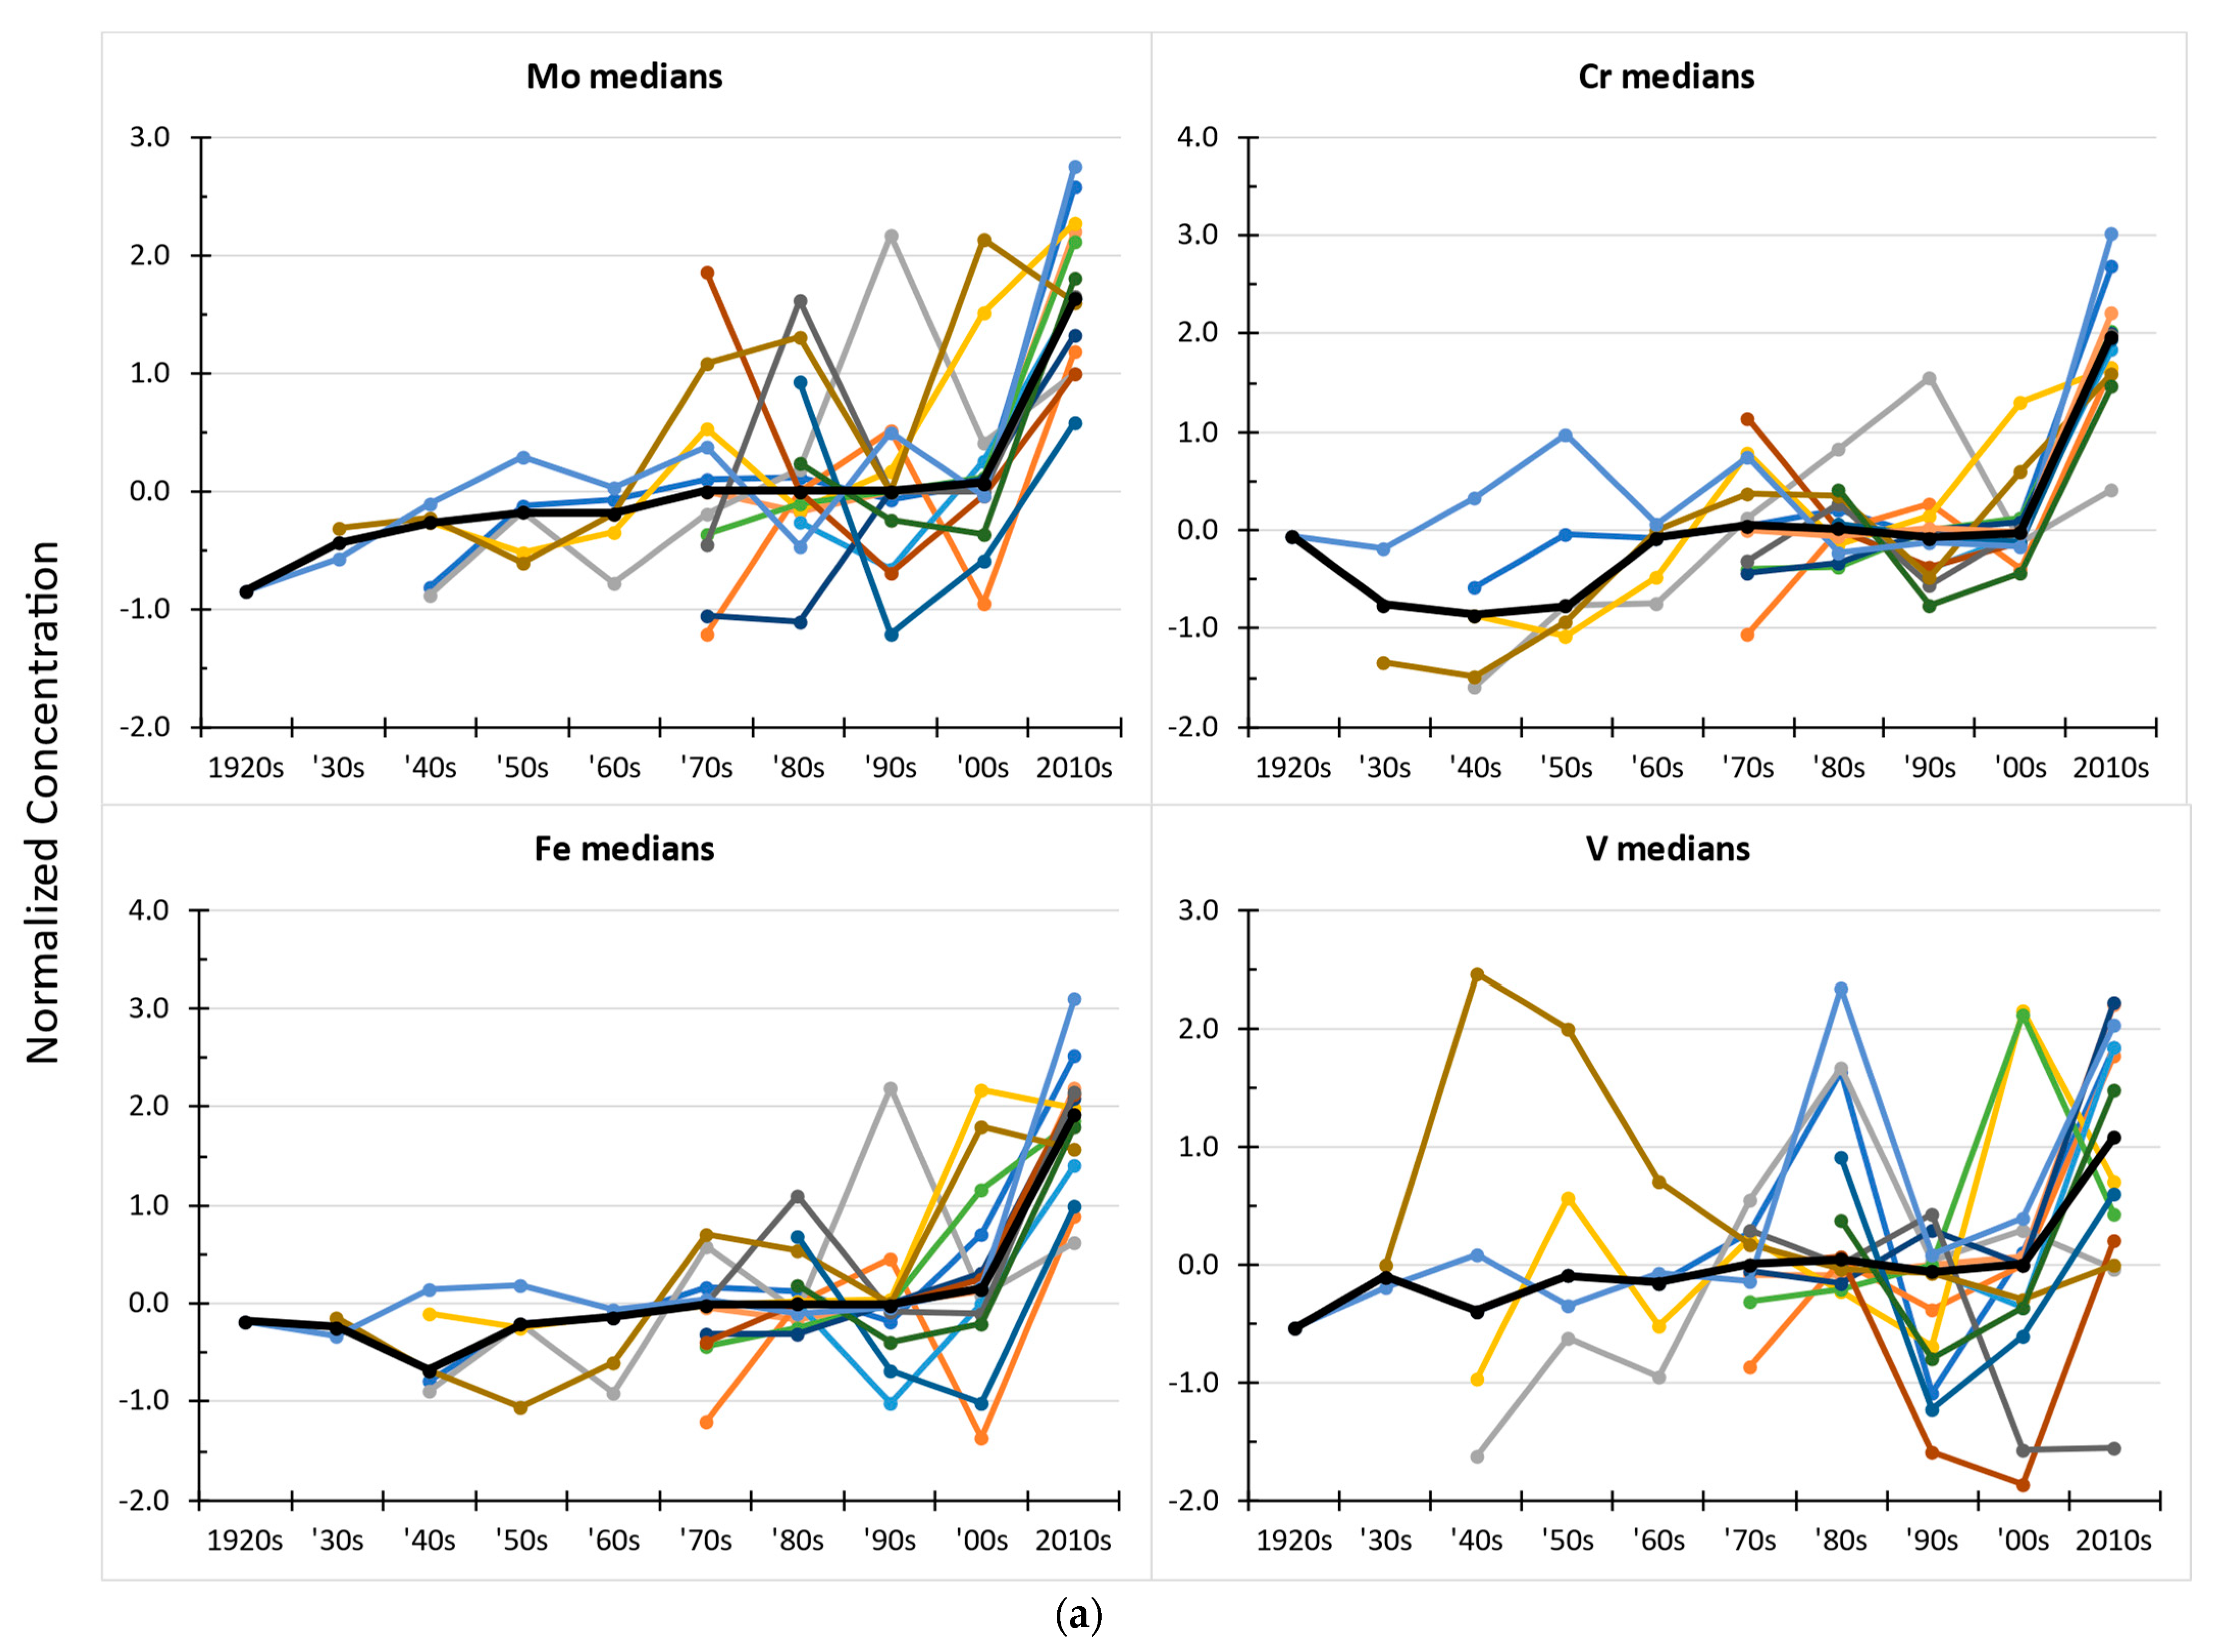
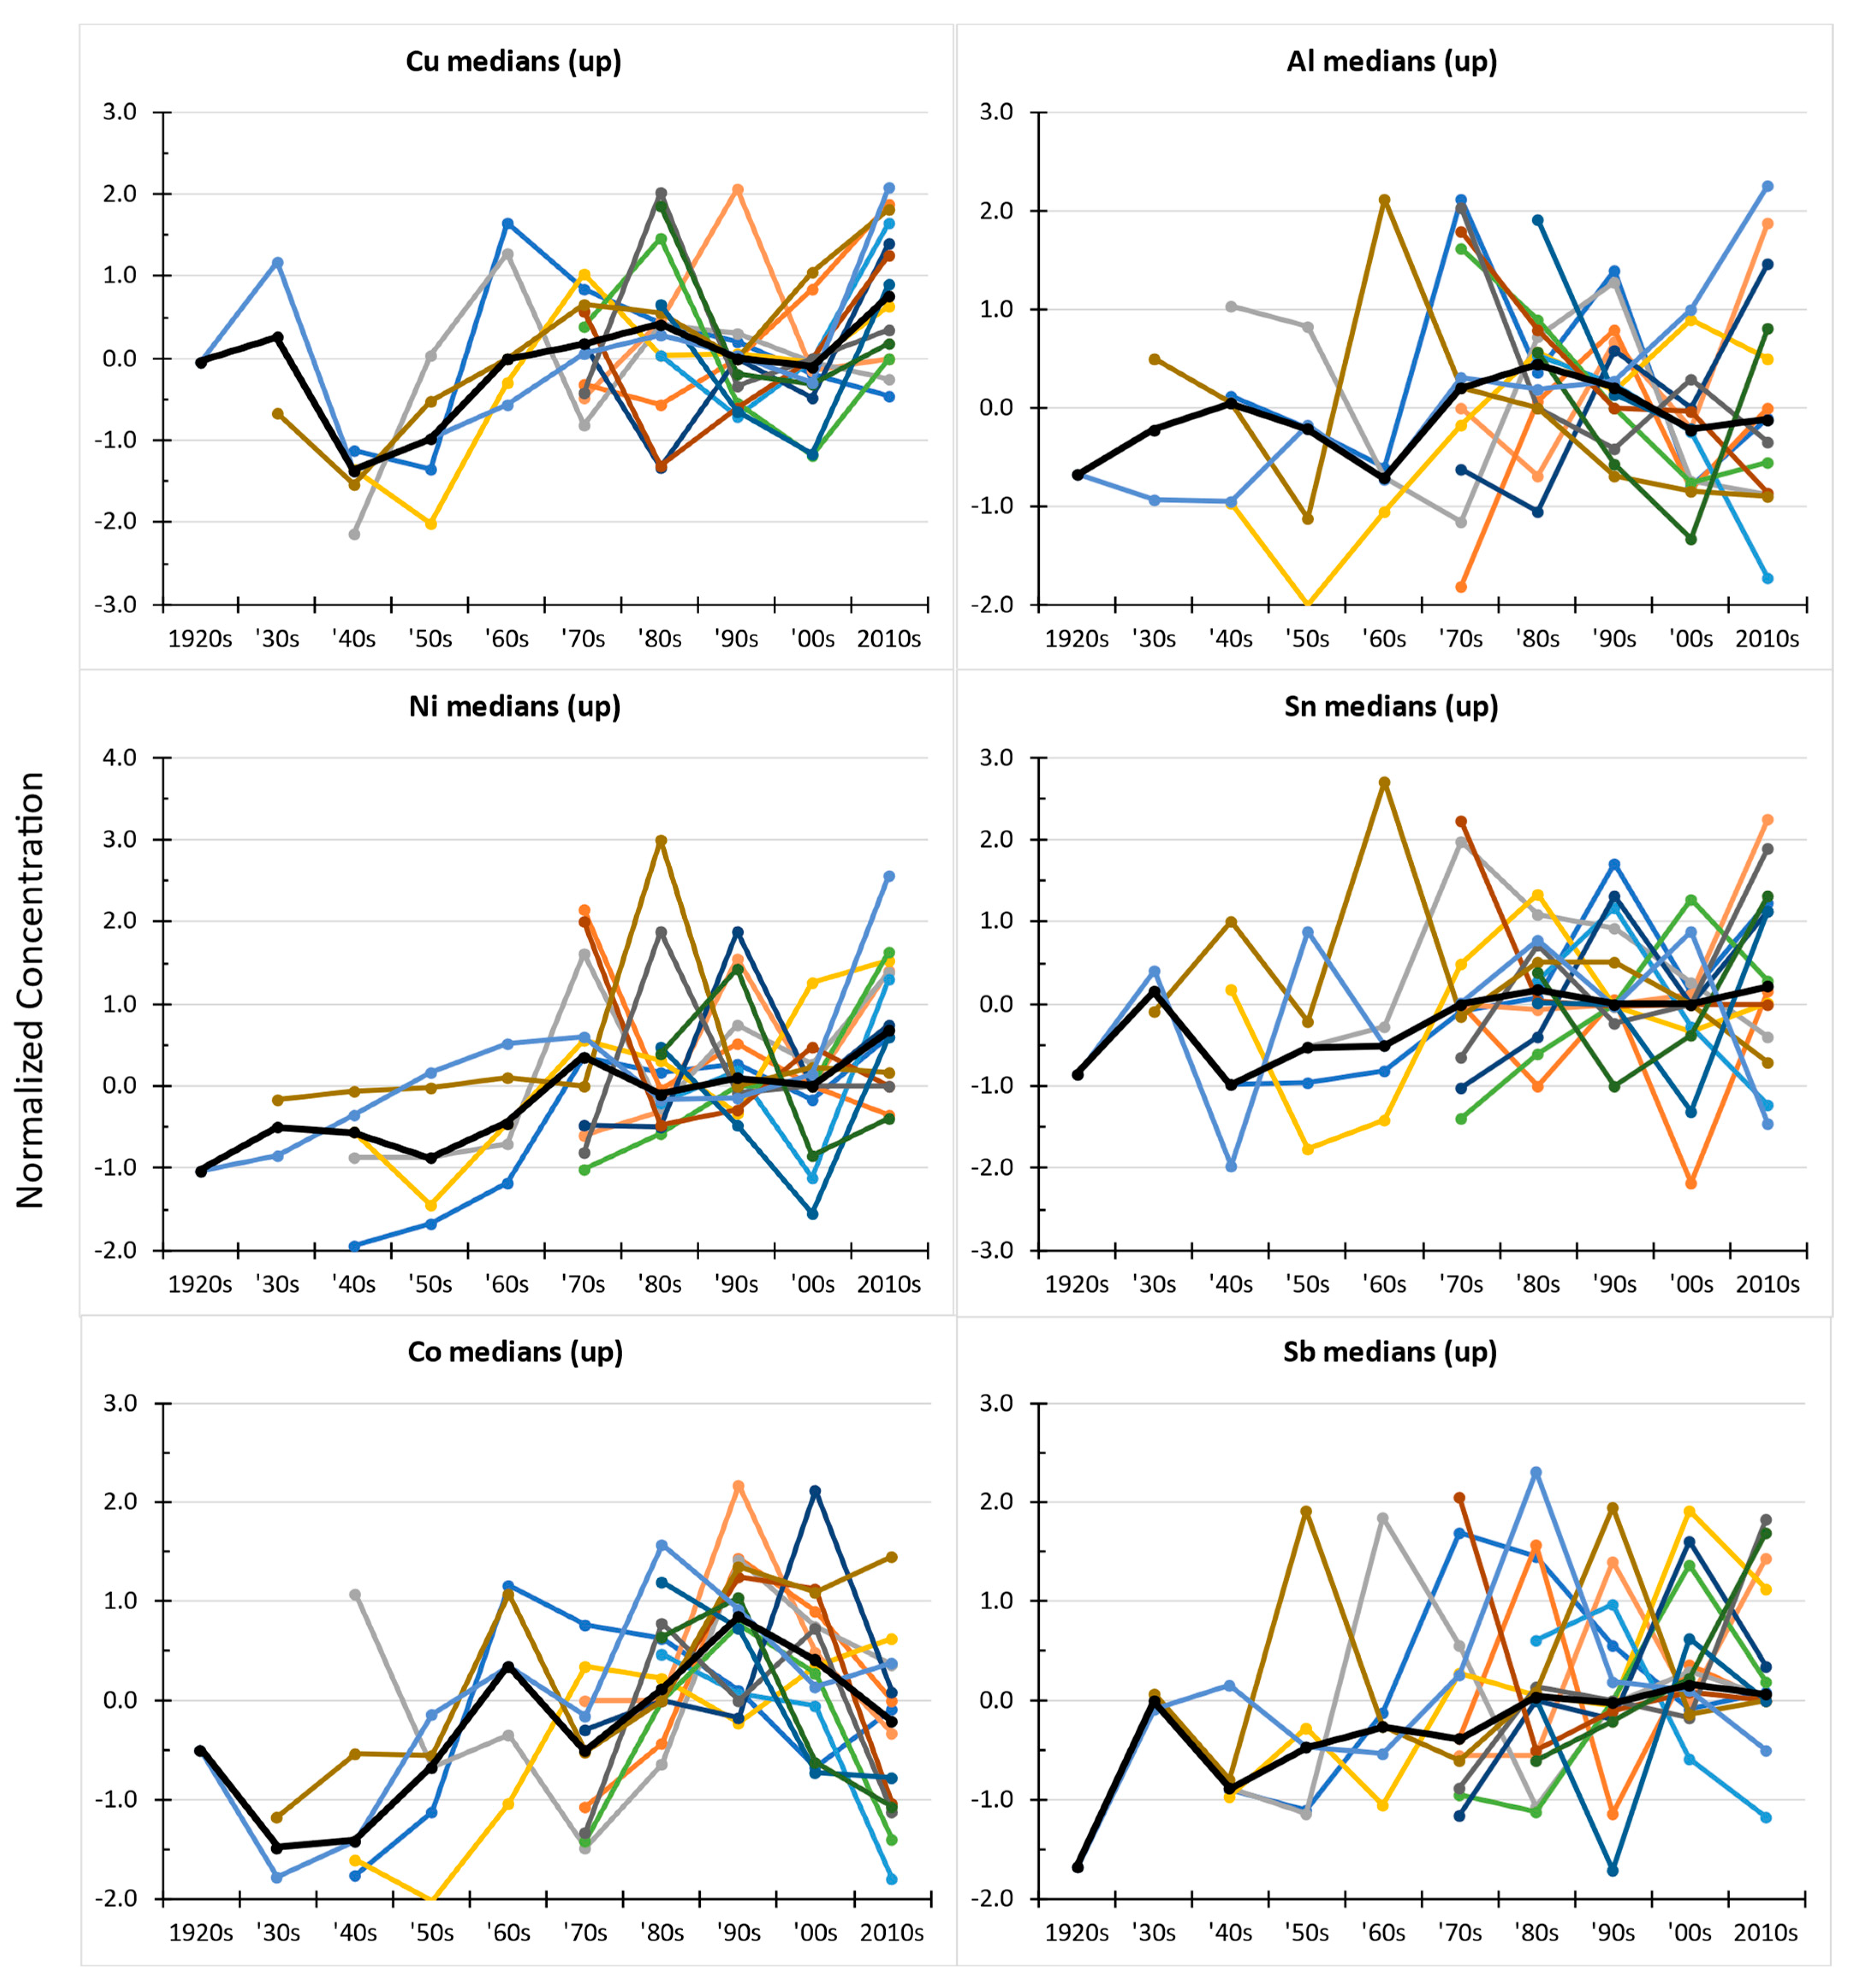
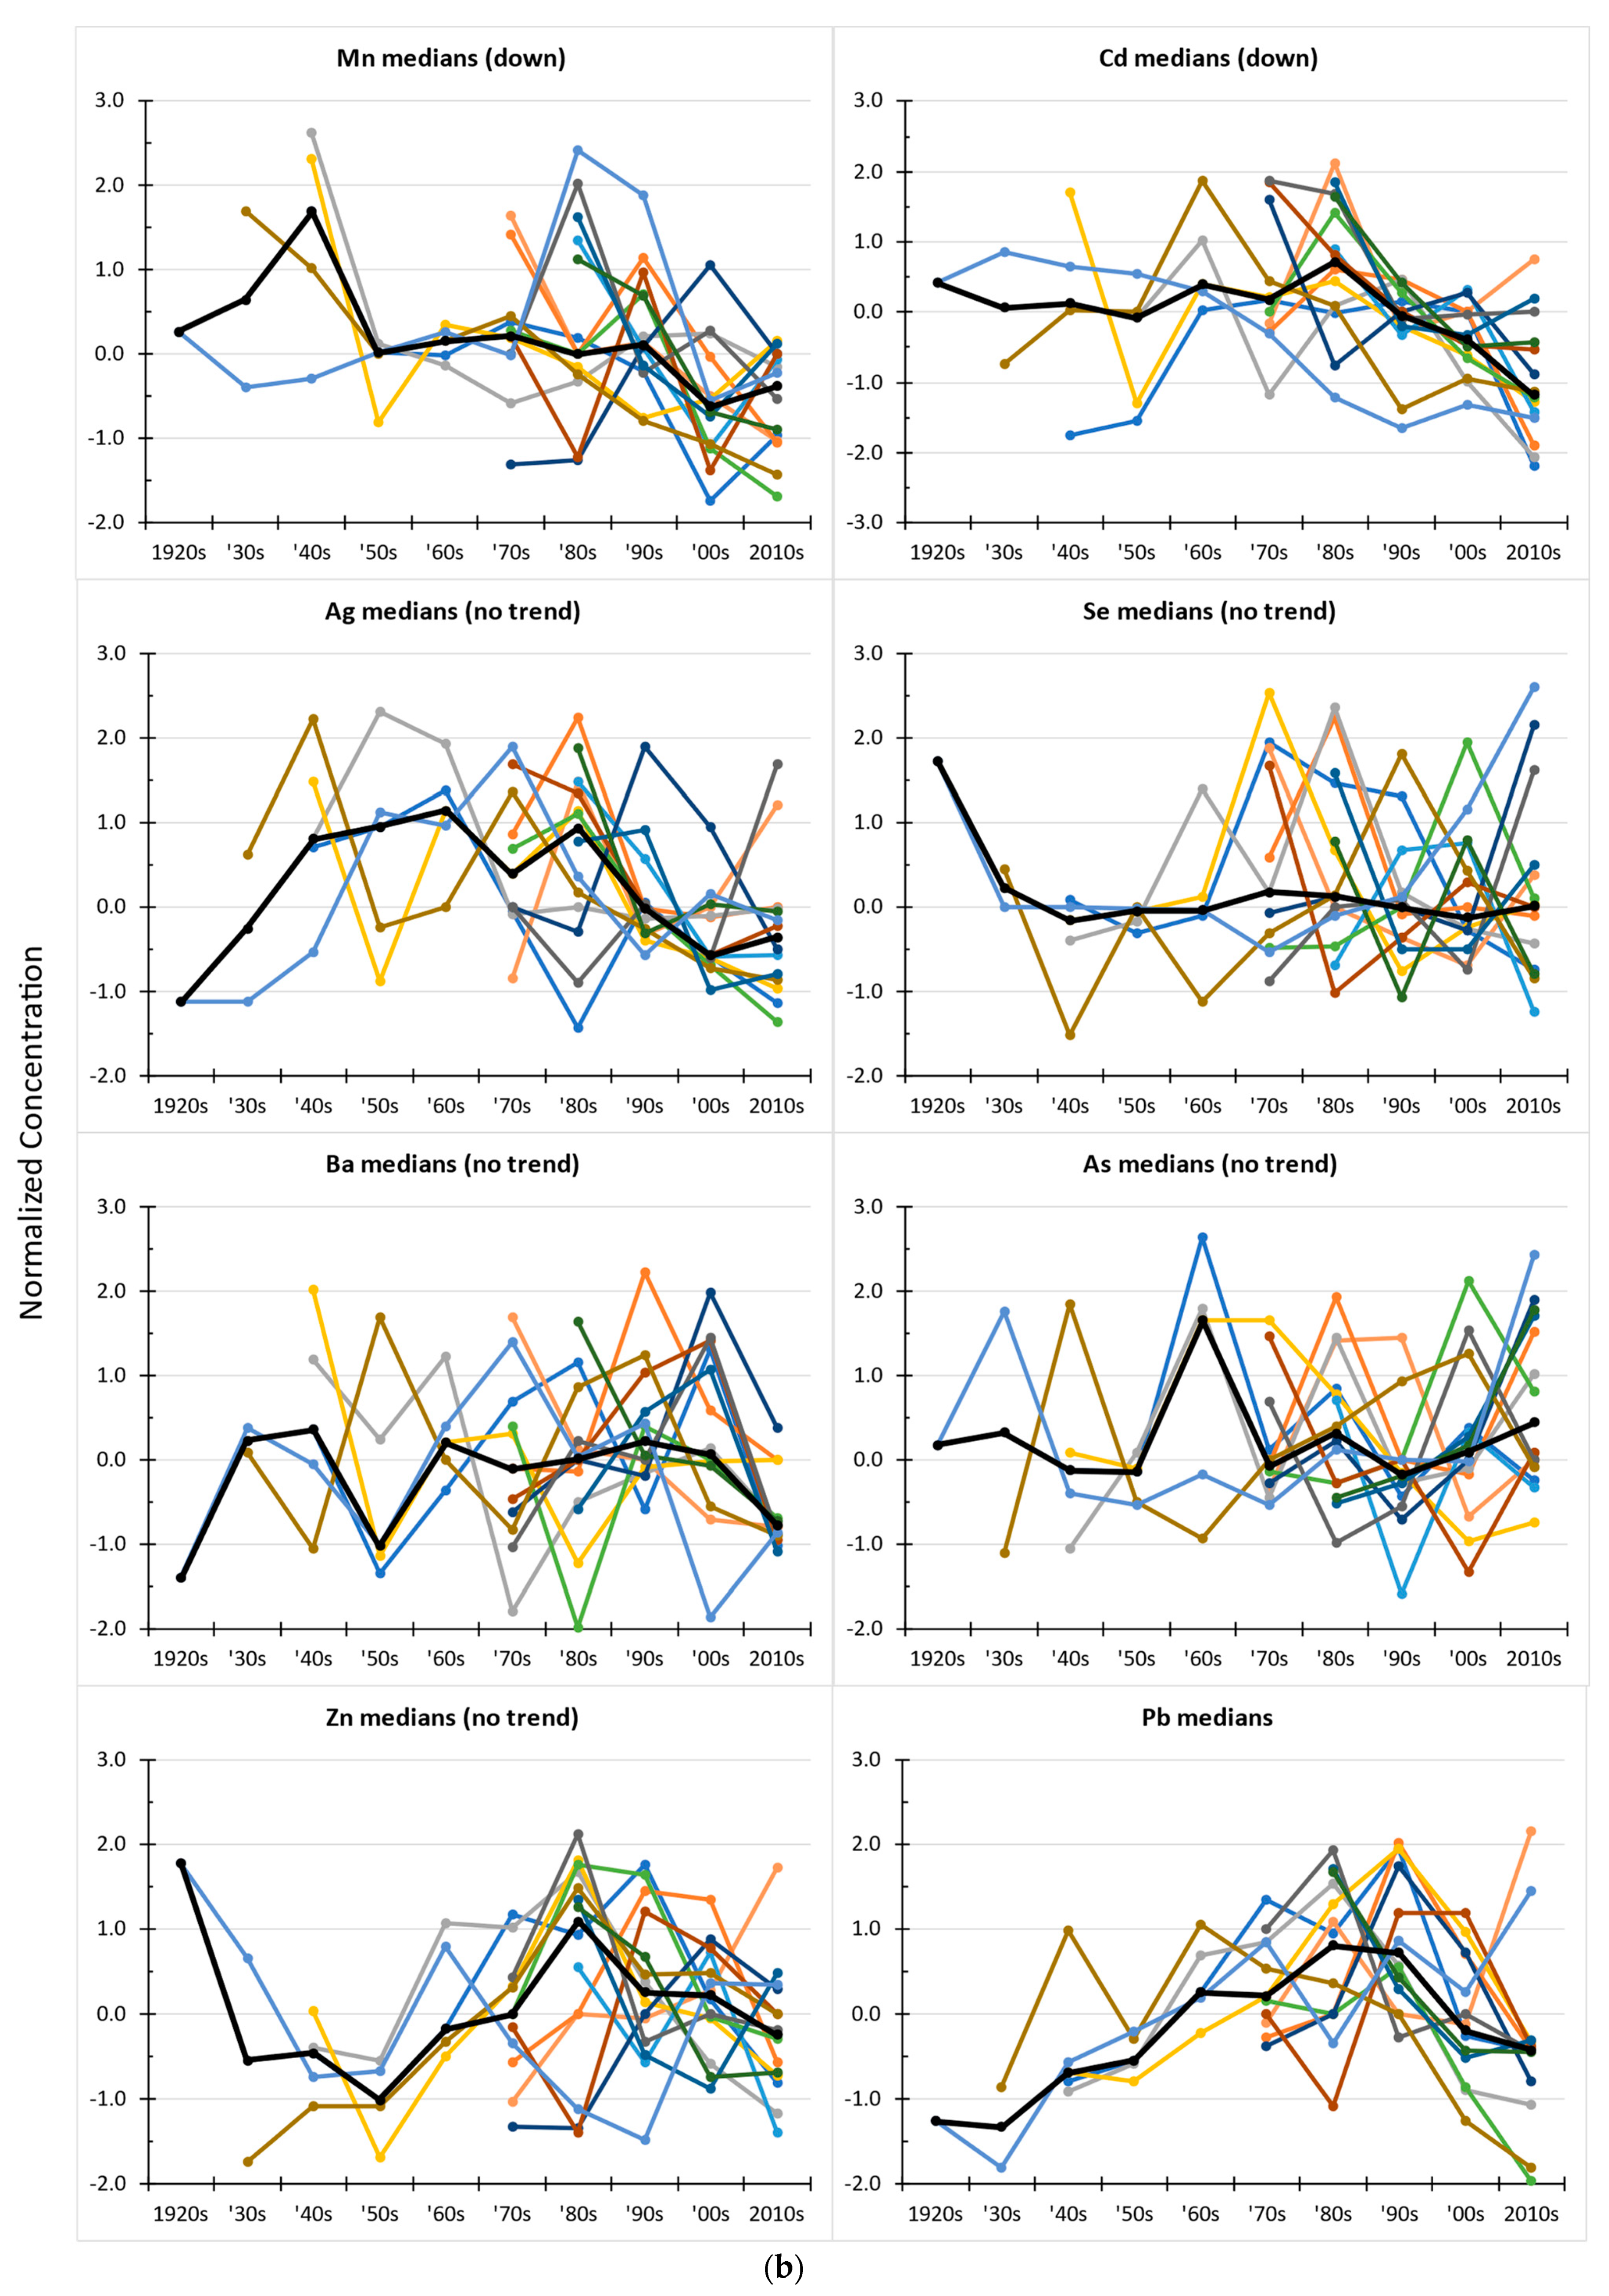
  • Temporal resolution of measurements: Intuitively, it would seem obvious to measure tree rings at the annual resolution. Tree rings are mostly annual in formation, and most traditional ring-width applications of dendrochronology measure rings at the annual scale. However, once again, dendrochemistry is expensive due to the cost of measuring wood chemically, and thus, measuring even one tree core with even just 100 growth rings at the annual scale could cost several thousands of dollars, which would be hard to afford across multiple trees. Combining rings through time and measuring at coarser time scales would reduce costs per tree, thereby allowing for more trees to be measured. Environmentally, chemical changes might occur slowly through time anyway, in which case a coarser temporal resolution for the dendrochemical data should suffice in identifying something interesting.
    In this study, the decadal scale was a reasonable starting point for measurements. It appears that temporal patterns of environmental lead (Pb) are correctly demonstrated at the decadal scale, and thus, confidence should be reasonably high in the decadal values of other elements as well. If it were determined that a finer temporal resolution could help better pinpoint a moment of change in environmental chemistry, then additional samples are on hand for the measurement of shorter time increments.
  • Chemical elements to be measured: It might seem logical to start a dendrochemical assessment of an area with illness with an a priori interest in elements known to be detrimental to human health. For example, in addition to lead (discussed in detail above), environmental exposure to arsenic [67], cadmium [68], and/or nickel [69] is of general concern in public health and, therefore, these elements are commonly measured in public health studies. However, without specific prior knowledge about exactly what elements might be elevated environmentally and could possibly be causing an illness, it would be wise not to restrict an initial survey of elements to just those known to have caused illness elsewhere. A broader survey of as many elements as possible might result in discovering something that would not otherwise be suspected of being elevated environmentally and/or causing an illness.
  • Exploratory analysis of the data: For an initial analysis of dendrochemical data, time-series plotting of the concentration for all elements is reasonable for seeing if certain trees differ from others, which might indicate a temporal outlier period and/or a spatial “hot spot” (elevated values) for an element or multiple elements. This can be especially true when all measured trees are overlay plotted together on one plot for each element.
    As a next step in exploratory data analysis, normalizing concentration values within each tree and replotting in an overlay time series can be additionally edifying. Normalization puts all series on the same scale, making them easier to plot together and compare. Subtracting median values, as opposed to mean values, from each raw value is a conservative approach and avoids undue influence from large positive outliers, which occasionally occur in dendrochemistry measurements [70].

5. Conclusions

Dendrochemistry at Lake Norman in North Carolina shows tree-ring values of molybdenum, chromium, iron, and, possibly, vanadium that are elevated in the most recent decade of time compared to prior decades going back to the early to mid-1900s. Multiple other elements measured do not show this temporal pattern, and thus, these elements appear to be unique in this regard. The dendrochemistry of lead (Pb) shows a slow increase throughout the 1900s, a peak by the 1980s, and a decrease since the 1990s, reflecting the known disposition of environmental lead due to its use in, and subsequent removal from, gasoline.
Further environmental monitoring at Lake Norman might be merited to confirm this temporal pattern of molybdenum, chromium, iron, and possibly vanadium, and/or to begin isolating a source or sources of these elements in the environment. Because this study was ecologic in design, it is not possible to associate these elements with the illnesses that are being reported there based on this study alone. If additional environmental monitoring confirmed this temporal pattern for these elements and isolated a source or sources for their current concentration, then biomedical research might be warranted to test for a possible linkage between exposure to these elements and body burdens and/or illnesses.
It has been said that dendrochemistry “should be used with caution as a tool for retrospective biomonitoring of environmental pollution” [71]. This, of course, is good advice generally for any scientific endeavor. In the case of using dendrochemistry in public health, caution can take the form of thoughtful site and tree selection, collecting samples from as many trees as possible/feasible, dedicating at least some sampling for the purpose of collecting specimens from putative control trees, optimizing the temporal resolution of growth rings to be measured with respect to tradeoffs between minimizing the cost of measurements while maximizing the number of specimens measured, measuring as many elements as possible without necessarily targeting elements thought to be playing a role in an illness, and plotting and graphing the data in multiple ways to maximize the chance of observing an environmental pattern if one truly exists while not overinterpreting patterns in the tree rings that might not be environmentally caused.

Supplementary Materials

The following supporting information can be downloaded at: https://www.mdpi.com/article/10.3390/f13111767/s1, Figure S1: Bivariate scatter plots of Pb concentration by sample mass. Table S1: Tree data.

Author Contributions

Conceptualization, P.R.S. and M.L.W.; methodology, P.R.S.; formal analysis, P.R.S.; data curation, P.R.S.; writing—original draft preparation, P.R.S.; writing—review and editing, M.L.W.; project administration, M.L.W.; funding acquisition, M.L.W. All authors have read and agreed to the published version of the manuscript.

Funding

This research was funded in part by Trevor’s Trek Foundation.

Institutional Review Board Statement

Not applicable.

Informed Consent Statement

Not applicable.

Data Availability Statement

The data presented in this study are available on request from the corresponding author.

Acknowledgments

Susan Wind assisted in the fieldwork of this research. Chemical measurements were made in the Arizona Laboratory of Emerging Contaminants, University of Arizona.

Conflicts of Interest

The authors declare no conflict of interest. The funders had no role in the design of the study; in the collection, analyses, or interpretation of data; in the writing of the manuscript; or in the decision to publish the results.

References

  1. Leukemia & Lymphoma Society. Childhood and Adolescent Blood Cancer Facts and Statistics. Available online: https://www.lls.org/facts-and-statistics/childhood-and-adolescent-blood-cancer-facts-and-statistics# (accessed on 8 June 2022).
  2. US Centers for Disease Control and Prevention. United States Cancer Statistics. Available online: https://gis.cdc.gov/Cancer/USCS/#/AtAGlance/ (accessed on 8 June 2022).
  3. Black, S.B.; Law, B.; Chen, R.T.; Dekker, C.L.; Sturkenboom, M.; Huang, W.T.; Gurwith, M.; Poland, G. The critical role of background rates of possible adverse events in the assessment of COVID-19 vaccine safety. Vaccine 2021, 39, 2712–2718. [Google Scholar] [CrossRef] [PubMed]
  4. Steinmaus, C.; Lu, M.; Todd, R.L.; Smith, A.H. Probability estimates for the unique childhood leukemia cluster in Fallon, Nevada, and risks near other U.S. Military aviation facilities. Environ. Health Perspect. 2004, 112, 766–771. [Google Scholar] [CrossRef] [PubMed] [Green Version]
  5. Sandusky County Health Department; Ohio Department of Health. Childhood Cancer in Eastern Sandusky County, 1996–2010: A Profile of 21 Cases. Sandusky County Health Department and Ohio Department of Health. Available online: http://docs.wixstatic.com/ugd/5cff61_477f768c5e1a463d9e91775f33fce0a8.pdf (accessed on 8 June 2022).
  6. Rothman, K. A sobering start for the Cluster Busters Conference. Am. J. Epidemiol. 1990, 132, S6–S13. [Google Scholar] [CrossRef]
  7. Rubin, C.S.; Holmes, A.K.; Belson, M.G.; Jones, R.L.; Flanders, W.D.; Kieszak, S.M.; Osterloh, J.; Luber, G.E.; Blount, B.C.; Barr, D.B.; et al. Investigating childhood leukemia in Churchill County, Nevada. Environ. Health Perspect. 2007, 115, 151–157. [Google Scholar] [CrossRef] [PubMed] [Green Version]
  8. Pritsos, C.; Walker, M. Evaluating environmental exposures and potential mechanisms of a leukemia cluster: Churchill County, NV case study. Chem. Biol. Interact. 2012, 196, 51. [Google Scholar] [CrossRef] [PubMed]
  9. Maantay, J. Zoning, equity, and public health. Am. J. Public Health 2001, 91, 1033–1041. [Google Scholar]
  10. Rahman, M.M.; Alam, K.; Velayutham, E. Is industrial pollution detrimental to public health? Evidence from the world’s most industrialised countries. BMC Public Health 2021, 21, 1175. [Google Scholar] [CrossRef]
  11. Ferguson, E.C.; Maheswaran, R.; Daly, M. Road-traffic pollution and asthma—Using modelled exposure assessment for routine public health surveillance. Int. J. Health Geogr. 2004, 3, 24. [Google Scholar] [CrossRef] [Green Version]
  12. Grahame, T.J.; Schlesinger, R.B. Health effects of airborne particulate matter: Do we know enough to consider regulating specific particle types or sources? Inhal. Toxicol. 2007, 19, 457–481. [Google Scholar] [CrossRef]
  13. Baillie, M.G.L. Tree-Ring Dating and Archaeology; University of Chicago Press: Chicago, IL, USA, 1982; 274p. [Google Scholar]
  14. Margolis, E.Q.; Guiterman, C.H.; Chavardès, R.D.; Coop, J.D.; Copes-Gerbitz, K.; Dawe, D.A.; Falk, D.A.; Johnston, J.D.; Larson, E.; Li, H.; et al. The North American Tree-Ring Fire-Scar Network. Ecosphere 2022, 13, e4159. [Google Scholar] [CrossRef]
  15. Fritts, H.C. Tree Rings and Climate; Academic Press: New York, NY, USA, 1976; 567p. [Google Scholar]
  16. Hevia, A.; Sánchez-Salguero, R.; Camarero, J.J.; Querejeta, J.I. Long-term nutrient imbalances linked to drought-triggered forest dieback. Sci. Total Environ. 2019, 690, 1254–1267. [Google Scholar] [CrossRef] [PubMed]
  17. Binda, G.; Di Iorio, A.; Monticelli, D. The what, how, why, and when of dendrochemistry: (paleo) environmental information from the chemical analysis of tree rings. Sci. Total Environ. 2021, 758, 143672. [Google Scholar] [CrossRef] [PubMed]
  18. Sheppard, P.R.; Speakman, R.J.; Ridenour, G.; Witten, M.L. Temporal variability of tungsten and cobalt in Fallon, Nevada. Environ. Health Perspect. 2007, 115, 715–719. [Google Scholar] [CrossRef] [Green Version]
  19. Sheppard, P.R.; Helsel, D.L.; Speakman, R.J.; Ridenour, G.; Witten, M.L. Additional analysis of dendrochemical data of Fallon, Nevada. Chem. Biol. Interact. 2012, 196, 96–101. [Google Scholar] [CrossRef] [PubMed]
  20. Garvin, M.C.; Schijf, J.; Kaufman, S.R.; Konow, C.; Liang, D.; Nigra, A.E.; Stracker, N.H.; Whelan, R.J.; Wiles, G.C. A survey of trace metal burdens in increment cores from eastern cottonwood (Populus deltoides) across a childhood cancer cluster, Sandusky County, OH, USA. Chemosphere 2020, 238, 124528. [Google Scholar] [CrossRef]
  21. Grissino-Mayer, H.D. An updated list of species used in tree-ring research. Tree-Ring Bull. 1993, 53, 17–43. [Google Scholar]
  22. Cutter, B.E.; Guyette, R.P. Anatomical, chemical, and ecological factors affecting tree species choice in dendrochemistry studies. J. Environ. Qual. 1993, 22, 611–619. [Google Scholar] [CrossRef]
  23. Savard, M.M. Tree-ring stable isotopes and historical perspectives on pollution—An overview. Environ. Pollut. 2010, 158, 2007–2013. [Google Scholar] [CrossRef]
  24. Watmough, S.A. An evaluation of the use of dendrochemical analyses in environmental monitoring. Environ. Rev. 1997, 5, 181–201. [Google Scholar] [CrossRef]
  25. Sheppard, P.R.; Ort, M.H.; Anderson, K.C.; Elson, M.D.; Vázquez-Selem, L.; Clemens, A.W.; Little, N.C.; Speakman, R.J. Multiple dendrochronological signals indicate the eruption of Parícutin volcano, Michoacán, Mexico. Tree-Ring Res. 2008, 64, 97–108. [Google Scholar] [CrossRef] [Green Version]
  26. The Pulse: BREAKING: DHHS Investigating Suspected Cancer Cluster Near Lake Norman. 2018. Available online: https://pulse.ncpolicywatch.org/2018/06/20/breaking-dhhs-investigating-suspected-cancer-cluster-near-lake-norman/#sthash.22BlRPMJ.dpbs (accessed on 10 June 2022).
  27. WCNC Charlotte. “It still remains a mystery:” Questions Loom Surrounding Lake Norman Cancer Clusters. 2020. Available online: https://www.wcnc.com/article/news/health/questions-loom-surrounding-lake-norman-cancer-clusters/275-01318804-3c6d-49e0-b719-c6764a47771d (accessed on 10 June 2022).
  28. NPR. Researchers Investigate Cancer Clusters in North Carolina. 2019. Available online: https://www.npr.org/2019/12/17/788760892/researchers-investigate-cancer-clusters-in-north-carolina (accessed on 10 June 2022).
  29. Paddle, G.M.; Harrington, J.M. Environmental epidemiology–strengths and weaknesses. Int. Arch. Occup. Environ. Health 2000, 73, 7–14. [Google Scholar] [CrossRef] [PubMed]
  30. Sheppard, P.R.; Ridenour, G.; Witten, M.L. Multiple techniques for researching airborne particulates: A comprehensive case study of Fallon, Nevada. In Airborne Particulates; Cheng, M., Liu, W., Eds.; Nova Science Publishers: New York, NY, USA, 2009; pp. 141–156. [Google Scholar]
  31. Pleil, J.D.; Sobus, J.; Sheppard, P.R.; Ridenour, G.; Witten, M.L. Strategies for evaluating the environment-public health interaction of long-term latency disease: The quandary of the inconclusive case-control study. Chem. Biol. Interac. 2012, 196, 68–78. [Google Scholar] [CrossRef]
  32. Bangdiwala, S.I. Basic epidemiology research designs II: Case-control design. Int. J. Inj. Contr. Saf. Promot. 2019, 26, 200–202. [Google Scholar] [CrossRef]
  33. Nielsen, J.B.; Jensen, T.K. Environmental epidemiology. In Essentials of Medical Geology: Impacts of the Natural Environment on Public Health; Selinus, O., Alloway, B., Centeno, J.A., Finkelman, R.B., Fuge, R., Lindh, U., Smedley, P., Eds.; Elsevier: Amsterdam, The Netherlands, 2005; pp. 529–540. [Google Scholar]
  34. Morgenstern, H. Ecologic Study. In Encyclopedia of Biostatistics; John Wiley & Sons: Chichester, UK, 2005; Volume 3, pp. 1588–1610. [Google Scholar]
  35. Burns, R.M.; Honkala, B.H. Silvics of North America, Volume 1, Conifers; US Forest Service Agriculture Handbook 654; US Department of Agriculture, Forest Service: Washington, DC, USA, 1990; pp. 497–512.
  36. Lageard, J.G.A.; Howell, J.A.; Rothwell, J.J.; Drew, I.B. The utility of Pinus sylvestris L. in dendrochemical investigations: Pollution impact of lead mining and smelting in Darley Dale, Derbyshire, UK. Environ. Pollut. 2008, 153, 284–294. [Google Scholar] [CrossRef] [PubMed]
  37. Phipps, R.L. Collecting, Preparing, Crossdating, and Measuring Tree Increment Cores; Water Resources Investigations Report, 85-4148; US Department of the Interior, Geological Survey: Washington, DC, USA, 1985; 48p.
  38. Kalisz, P.; Carrico, A. Caution: Increment boring is hazardous to the health of trees. Wild Earth 1997, 7, 29–30. [Google Scholar]
  39. Cleaveland, M. Coring Controversy. Wild Earth 1998, 13–14. Available online: https://www.environmentandsociety.org/sites/default/files/key_docs/rcc_00097008_1_2.pdf (accessed on 10 June 2022).
  40. Sheppard, P.R.; Witten, M.L. Laser trimming tree-ring cores for dendrochemistry of metals. Tree-Ring Res. 2005, 61, 87–92. [Google Scholar] [CrossRef]
  41. Pearson, C.; Manning, S.W.; Coleman, M.; Jarvis, K. Can tree-ring chemistry reveal absolute dates for past volcanic eruptions? J. Archaeol. Sci. 2005, 32, 1265–1274. [Google Scholar] [CrossRef]
  42. Albayrak, R.F.; Post, C.J.; Mikhailova, E.A.; Schlautman, M.A.; Zurqania, H.A.; Green, A.R.; Minerva, P. Age and site index evaluations for loblolly pine in urban environments. Urban For. Urban Greening 2020, 47, 126517. [Google Scholar] [CrossRef]
  43. Smith, K.T.; Shortle, W.C. Tree biology and dendrochemistry. In Tree Rings, Environment and Humanity; Dean, J.S., Meko, D.M., Swetnam, T.W., Eds.; Radiocarbon: Tucson, AZ, USA, 1996; pp. 629–635. [Google Scholar]
  44. Sheppard, P.R.; Ort, M.H.; Anderson, K.C.; Clynne, M.A.; May, E.M. Multiple dendrochronological responses to the eruption of Cinder Cone, Lassen Volcanic National Park, California. Dendrochronologia 2009, 27, 213–221. [Google Scholar] [CrossRef]
  45. Sokal, R.R.; Rohlf, F.J. Biometry; Freeman and Company: San Francisco, CA, USA, 1981; 859p. [Google Scholar]
  46. Cook, E.R. A Time Series Analysis Approach to Tree-Ring Standardization. Ph.D. Dissertation, University of Arizona, Tucson, AZ, USA, 1985. [Google Scholar]
  47. Horikawa, K.; Takeda, M.; Kawasaki, K.; Zhang, J. Historical changes in soil acidification inferred from the dendrochemistry of a Tateyama cedar at Bijodaira, Mt. Tateyama, Japan. Geochem. J. 2013, 47, 663–673. [Google Scholar] [CrossRef] [Green Version]
  48. Merrill, W.; Cowling, E.B. Role of nitrogen in wood deterioration: Amounts and distribution of nitrogen in tree stems. Can. J. Bot. 1966, 44, 1555–1580. [Google Scholar] [CrossRef]
  49. Holmes, H. The Secret Life of Dust; Wiley: New York, NY, USA, 2001; 240p. [Google Scholar]
  50. Boldyrev, M. Lead: Properties, history, and applications. Wiki J. Sci. 2018, 1, 7. [Google Scholar] [CrossRef] [Green Version]
  51. Lippman, M. 1989 Alice Hamilton lecture. Lead and human health: Background and recent findings. Environ. Res. 1990, 51, 1–24. [Google Scholar]
  52. Kitman, J.L. The secret history of lead. Nation 2000, 270, 11–44. [Google Scholar]
  53. Kovarik, W. Ethyl-leaded gasoline: How a classic occupational disease became an international public health disaster. Int. J. Occup. Environ. Health 2005, 11, 384–397. [Google Scholar] [CrossRef]
  54. Needleman, H.L. The removal of lead from gasoline: Historical and personal reflections. Environ. Res. 2000, 84, 20–35. [Google Scholar] [CrossRef] [Green Version]
  55. Mielke, H.W.; Gonzales, C.R.; Powell, E.T.; Laidlaw, M.A.S.; Berry, K.J.; Mielke, P.W.; Egendorf, S.P. The concurrent decline of soil lead and children’s blood lead in New Orleans. Proc. Natl. Acad. Sci. USA 2019, 116, 22058–22064. [Google Scholar] [CrossRef] [Green Version]
  56. Donnelly, J.R.; Shane, J.B.; Schaberg, P.G. Lead mobility within the xylem of red spruce seedlings: Implications for the development of pollution histories. J. Environ. Qual. 1990, 19, 268–271. [Google Scholar] [CrossRef]
  57. Ward, N.I.; Brooks, R.R.; Reeves, R.D. Effect of lead from motor-vehicle exhausts on trees along a major thoroughfare in Palmerston North, New Zealand. Environ. Pollut. 1974, 6, 149–158. [Google Scholar] [CrossRef]
  58. Danek, M.; Bell, T.; Laroque, C.P. Some considerations in the reconstruction of lead levels using laser ablation: Lessons from the design stage of an urban dendrochemistry study, St. John’s, Canada. Geochronometria 2015, 42, 217–231. [Google Scholar] [CrossRef] [Green Version]
  59. Arteau, J.; Boucher, E.; Poirier, A.; Widory, D. Historical smelting activities in Eastern Canada revealed by Pb concentrations and isotope ratios in tree rings of long-lived white cedars (Thuja occidentalis L.). Sci. Total Environ. 2020, 740, 139992. [Google Scholar] [CrossRef] [PubMed]
  60. Burnett, A.; Kurtz, A.C.; Brabander, D.; Shailer, M. Dendrochemical record of historical lead contamination sources, Wells G&H Superfund site, Woburn, Massachusetts. J. Environ. Qual. 2007, 36, 1488–1494. [Google Scholar] [PubMed]
  61. Fisher, S.; Nicholas, N.S.; Scheuerman, P.R. Dendrochemical analysis of lead and calcium in Southern Appalachian American beech. J. Environ. Qual. 2002, 31, 1137–1145. [Google Scholar] [CrossRef] [PubMed]
  62. Speer, J.H. Fundamentals of Tree-Ring Research; University of Arizona Press: Tucson, AZ, USA, 2010; 333p. [Google Scholar]
  63. Sheppard, P.R. Dendroclimatology: Extracting climate from trees. Wiley Interdiscip. Rev. Clim. Chang. 2010, 1, 343–352. [Google Scholar] [CrossRef]
  64. Fritts, H.C.; Swetnam, T.W. Dendroecology: A tool for evaluating variations in past and present forest environments. Adv. Ecol. Res. 1989, 19, 111–188. [Google Scholar]
  65. Stoffel, M.; Butler, D.R.; Corona, C. Mass movements and tree rings: A guide to dendrogeomorphic field sampling and dating. Geomorphology 2013, 200, 106–120. [Google Scholar] [CrossRef]
  66. Corona, C.; Lopez Saez, J.; Stoffel, M. Defining optimal sample size, sampling design and thresholds for dendrogeomorphic landslide reconstructions. Quat. Geochronol. 2014, 22, 72–84. [Google Scholar] [CrossRef]
  67. Rahaman, M.S.; Rahman, M.M.; Mise, N.; Sikder, M.T.; Ichihara, G.; Uddin, M.K.; Kurasaki, M.; Ichihara, S. Environmental arsenic exposure and its contribution to human diseases, toxicity mechanism and management. Environ. Pollut. 2021, 289, 117940. [Google Scholar] [CrossRef] [PubMed]
  68. Genchi, G.; Sinicropi, M.S.; Lauria, G.; Carocci, A.; Catalano, A. The effects of cadmium toxicity. Int. J. Environ. Res. Public Health 2020, 17, 3782. [Google Scholar] [CrossRef] [PubMed]
  69. Genchi, G.; Carocci, A.; Lauria, G.; Sinicropi, M.S.; Catalano, A. Nickel: Human health and environmental toxicology. Int. J. Environ. Res. Public Health 2020, 17, 679. [Google Scholar] [CrossRef] [PubMed] [Green Version]
  70. McClenahen, J.R.; Vimmerstedt, J.P.; Scherzer, A.J. Elemental concentrations in tree rings by PIXE: Statistical variability, mobility, and effects of altered soil chemistry. Can. J. For. Res. 1989, 19, 880–888. [Google Scholar] [CrossRef]
  71. Nabais, C.; Freitas, H.; Hagemeyer, J. Dendroanalysis: A tool for biomonitoring environmental pollution? Sci. Total Environ. 1999, 232, 33–37. [Google Scholar] [CrossRef]
Figure 1. Map of the US (inset) showing the location of North Carolina (shaded), and map of the study area showing locations of the sampled trees (tree symbols with #s. #s = numbers, as in Tree 1, or Tree 2).
Forests 13 01767 g001
Figure 2. (a) Time series of element raw concentrations for North Carolina trees measured thus far. Color code for the trees is given. These elements have outlier trees with unusually high concentrations relative to the other trees, whose lines are dashed for emphasis. (b) Time series of element raw concentrations for North Carolina trees measured thus far. Color code for the trees is given in (a). These elements do not have outlier trees with unusually high concentrations relative to the other trees.
Forests 13 01767 g002aForests 13 01767 g002bForests 13 01767 g002c
Figure 3. (a) Time series of normalized element concentrations for North Carolina trees measured thus far. Color code for the trees is given in Figure 2a. The black line is the median of all trees for each time period. These elements show little to no temporal variation until the last time period (2010s), which is noticeably higher than the rest of the time. (b) Time series of normalized element concentrations for North Carolina trees measured thus far. Color code for the trees is given in Figure 2a. The black line is the median of all trees for each time period. Two elements show series-length trends downwards, five elements show no series-length trends, six elements show series-length trends upwards and lead (Pb) shows a particular temporal pattern.
Forests 13 01767 g003aForests 13 01767 g003bForests 13 01767 g003c
Publisher’s Note: MDPI stays neutral with regard to jurisdictional claims in published maps and institutional affiliations.

