Article

Defect Removal and Rearrangement of Wood Board Based on Genetic Algorithm

College of Mechanical and Electrical Engineering, Nanjing Forestry University, Nanjing 210037, China
*
Author to whom correspondence should be addressed.
Forests 2022, 13(1), 26; https://doi.org/10.3390/f13010026
Submission received: 2 December 2021 / Revised: 22 December 2021 / Accepted: 23 December 2021 / Published: 25 December 2021
(This article belongs to the Special Issue Wood Production and Promotion)

Abstract

:
Defects on a solid wood board have a great influence on the aesthetics and mechanical properties of the board. After removing the defects, the board is no longer the standard size; manual drawing lines and cutting procedure is time-consuming and laborious; and an optimal solution is not necessarily obtained. Intelligent cutting of the board can be realized using a genetic algorithm. However, the global optimal solution of the whole machining process cannot be obtained by separately considering the sawing and splicing of raw materials. The integrated consideration of wood board cutting and board splicing can improve the utilization rate of the solid wood board. The effective utilization rate of the board with isolated consideration of raw material sawing with standardized dimensions of wood pieces and board splicing is 79.1%, while the shortcut splicing optimization with non-standardized dimensions for the final board has a utilization rate of 88.6% (which improves the utilization rate by 9.5%). In large-scale planning, the use of shortcut splicing optimization also increased the utilization rate by 12.14%. This has certain guiding significance for actual production.

1. Introduction

Solid wood furniture is preferred by people due to its unique aesthetic feeling and superior material characteristics, and wood-based products can contribute to climate change mitigation by prolonging the storage of carbon in the anthroposphere [1,2]. Unlike other industrial products, wood is a naturally grown material and may present defects in random positions on the board. In the production process, these defects have a certain impact on the performance and aesthetics of the wood materials. Therefore, it is necessary to saw off the defects on the raw materials, to apply a finger joint, and finally to piece together the board. Wood is an anisotropic and orthotropic material with unique properties, color and texture. Thus, the splicing of solid wood pieces usually needs to be conducted along one direction [3]. Then, several pieces are connected in parallel according to the requirements. As such, the splicing board surface is not a complete 2D layout problem. At present, most enterprises adopt a manual layout in order to obtain a reasonable cutting scheme, and the calculation process is very complex and does not necessarily yield a good layout result. In addition, at present, most enterprises only consider a sheet cutting or splicing layout. If the sheet material and layout are integrated together, the utilization rate of the solid wood board will be greatly improved, and the production efficiency will be improved.
The wood board cutting stock problem (CSP) [4,5] refers to placing the required standard boards of different lengths on original boards of different lengths. Under the condition of meeting the size of standard boards, the original boards are fully utilized to maximize the board utilization rate. In this integrated algorithm, there are two solid wood board cutting stock problems: cutting and placing. The cutting stock problem, as a typical NP-hard problem, has been widely studied. Cerqueira [6] proposed a change in the constructive greedy heuristic that consists of building a cutting pattern by sorting in descending order the items of pair or odd length, with priority being given to those which appear more frequently. Ayres [7] introduced a new model for integrated lot sizing, one-dimensional cutting stock, and two-dimensional cutting stock problems, using a column generation heuristic algorithm and applying a relax-and-fix technique to evaluate the proposed model from a series of experiments. Wang [8] addressed an integrated scheduling optimization of flow-shop production with a one-dimensional cutting stock in make-to-order environments and developed a hybrid algorithm by integrating a local search method and some efficient strategies under the nested partitions framework. Generally speaking, the common solutions include the linear programming method, heuristic method, and intelligent algorithms such as the genetic algorithm.
With the development of computer technology, artificial intelligence has continued to develop. Artificial intelligence algorithms have been widely used in many fields [9], such as image processing [10,11], path planning, and the cutting stock problem. The genetic algorithm is the most classical intelligent algorithm, and many variants with better performance have been produced under the continuous exploration of scholars. Tseng [12] proposed a new block-based genetic algorithm for disassembly sequence planning based on a comparison of Kongar and Gupta’s genetic algorithm [13] and Dijkstra’s algorithms. Hacioglu [14] used an existing technique which combines a genetic algorithm and a neural network to rapidly improve populations to overcome the disadvantage of evolutionary algorithms for airfoil design problems, such as the high computational costs associated with the usage of computational fluid dynamics solvers. Ruholla [15] proposed the fluid genetic algorithm (FGA), changing the concepts such as chromosomes, individuals, crossover, and mutation in GA, and as a result a better success rate and better convergence control were presented. Li [16] proposed a hybrid genetic algorithm based on information entropy and game theory in order to cope with the drawback of the traditional genetic algorithm easily falling into a local optimum. Lopes [17] found that genetic algorithm combined with random forest and random forest performs best and with high accuracy to estimate machine productivity. Juan [18] introduced a genetic algorithm to minimize the waste produced during the cutting process of rectangular figures on a sheet, and applied this algorithm in a real case situation problem. The implementation of genetic algorithms yielded savings of 10.55 % of the total waste area. The genetic algorithm keeps innovating and improving the stability and efficiency of the algorithm.
In this paper, in order to obtain the global optimal solution of the layout of the board after reassembly, a mathematical model considering the global processing loss is established. The utilization rate of the whole board is optimized from the raw material to obtain the global optimal solution of shear-splice. The exact loss between shearing and splicing and direct splicing is compared by the experiments.

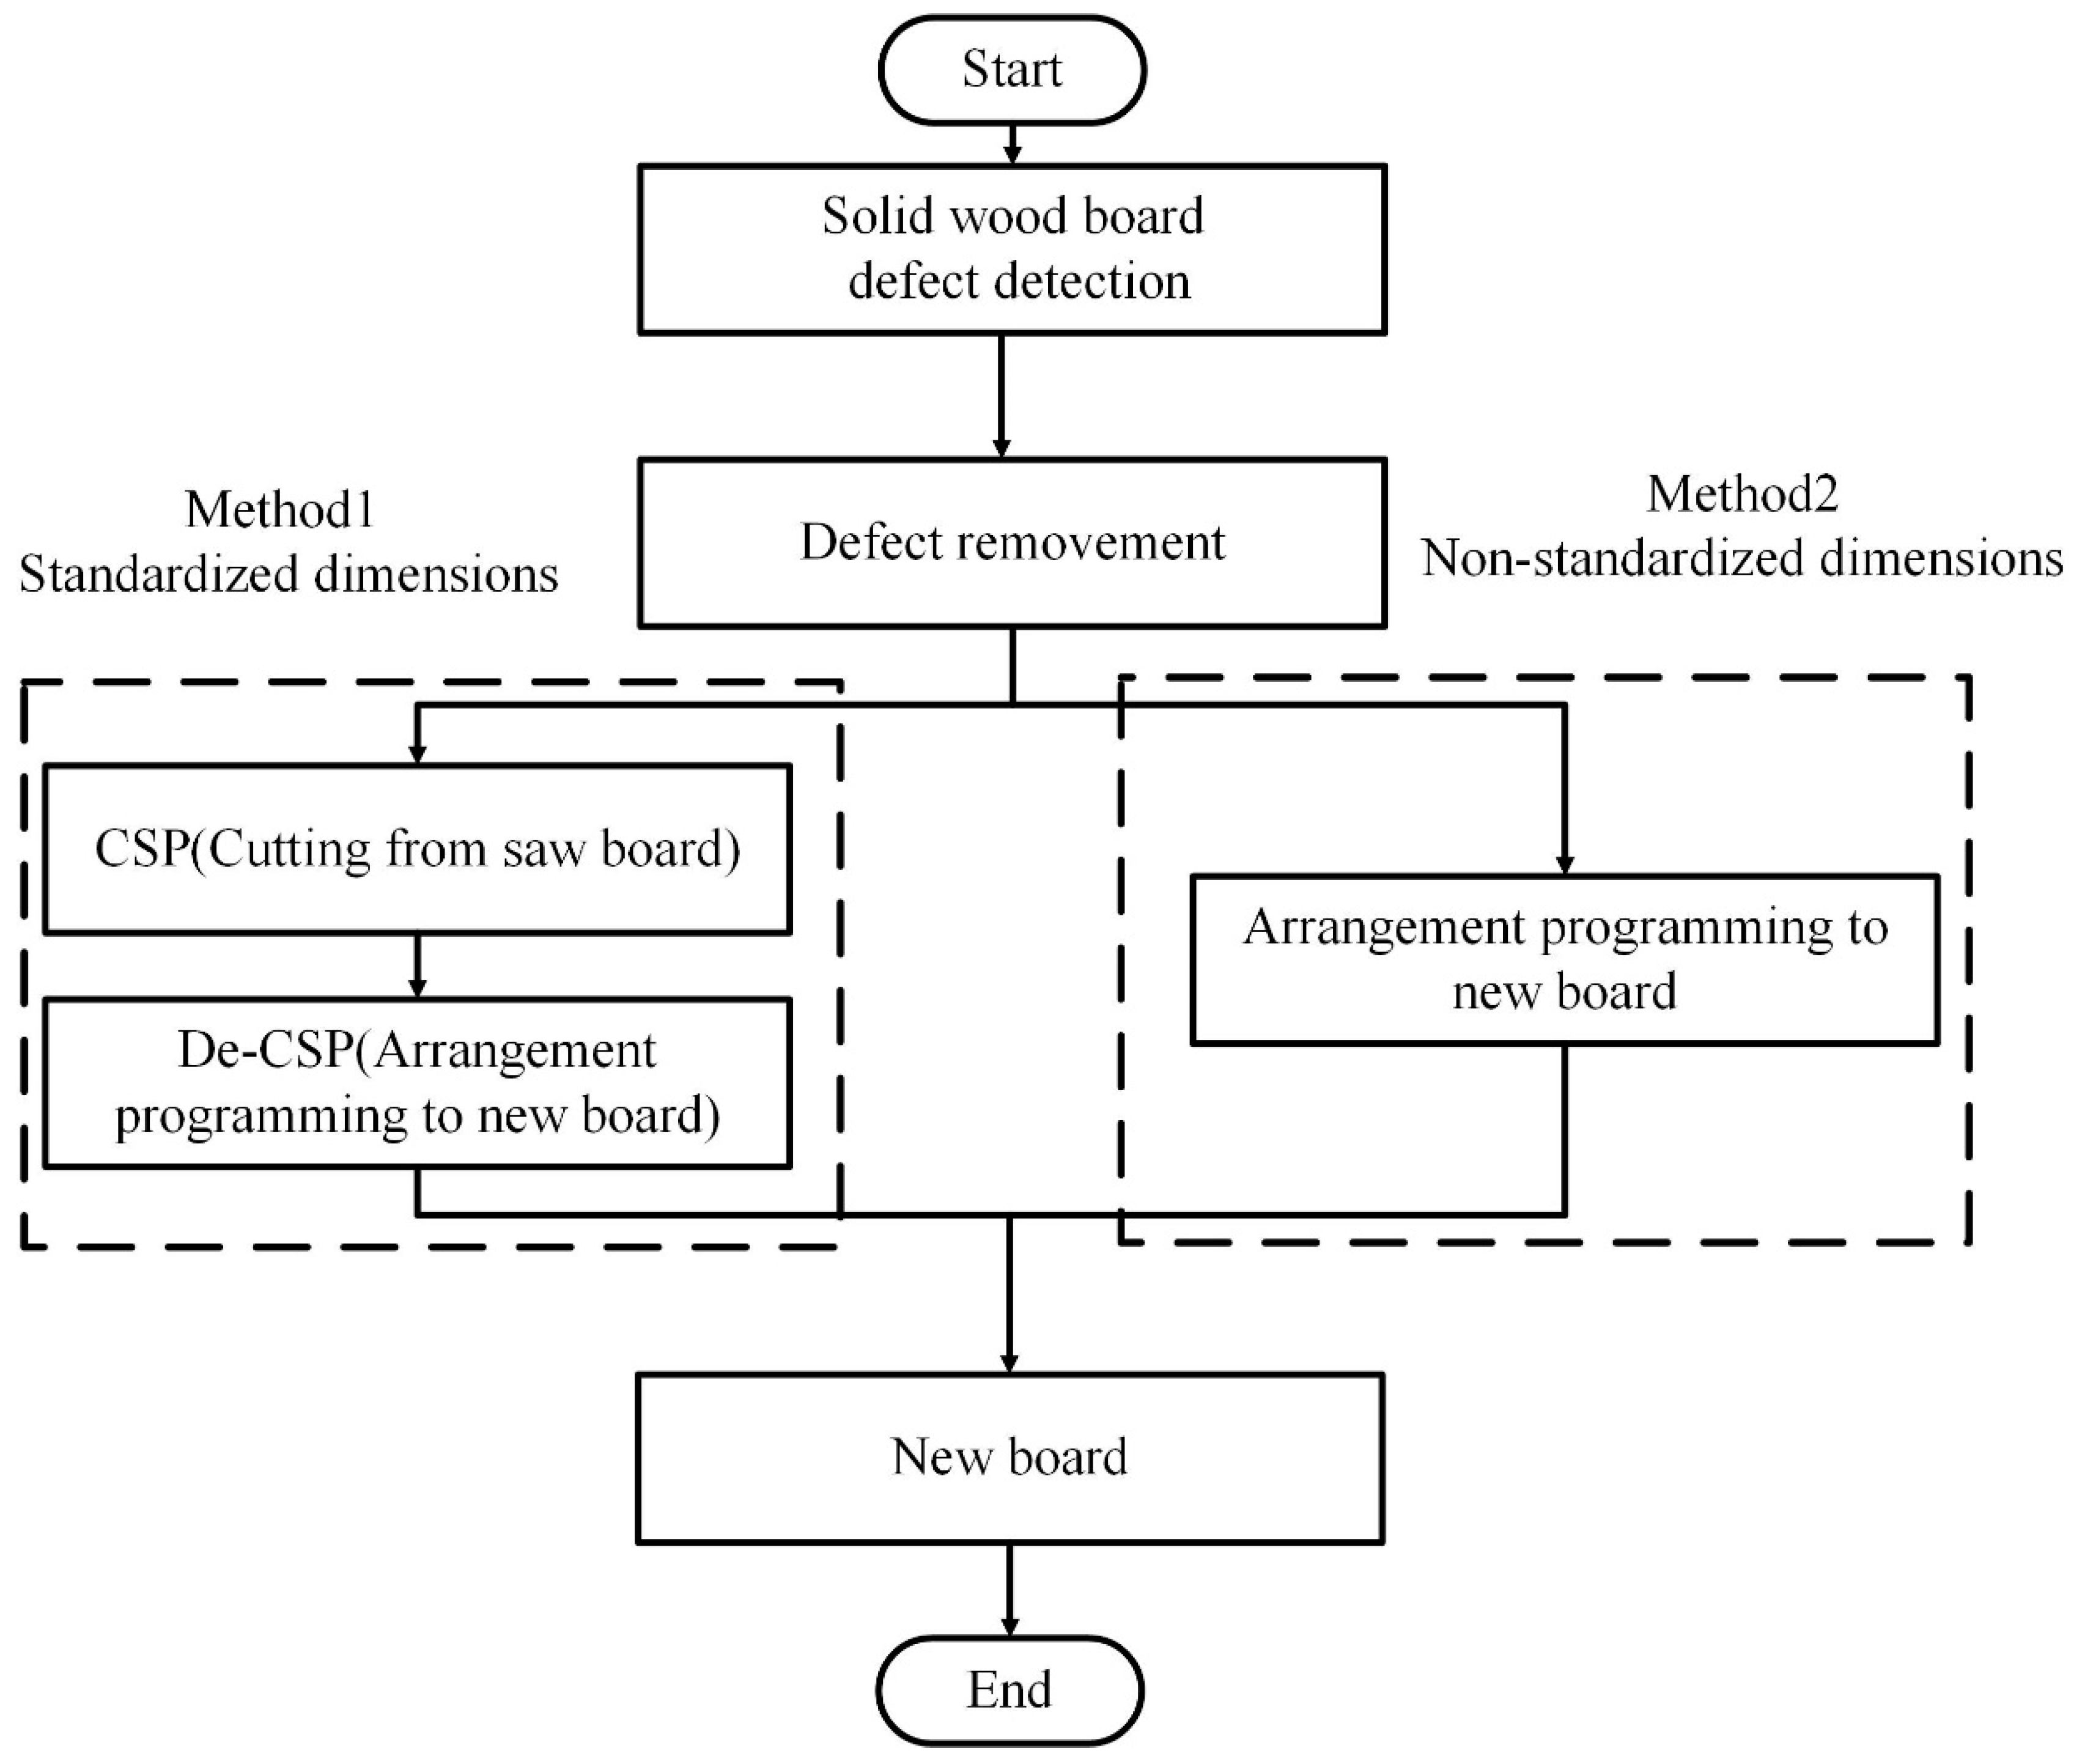
2. Materials and Methods
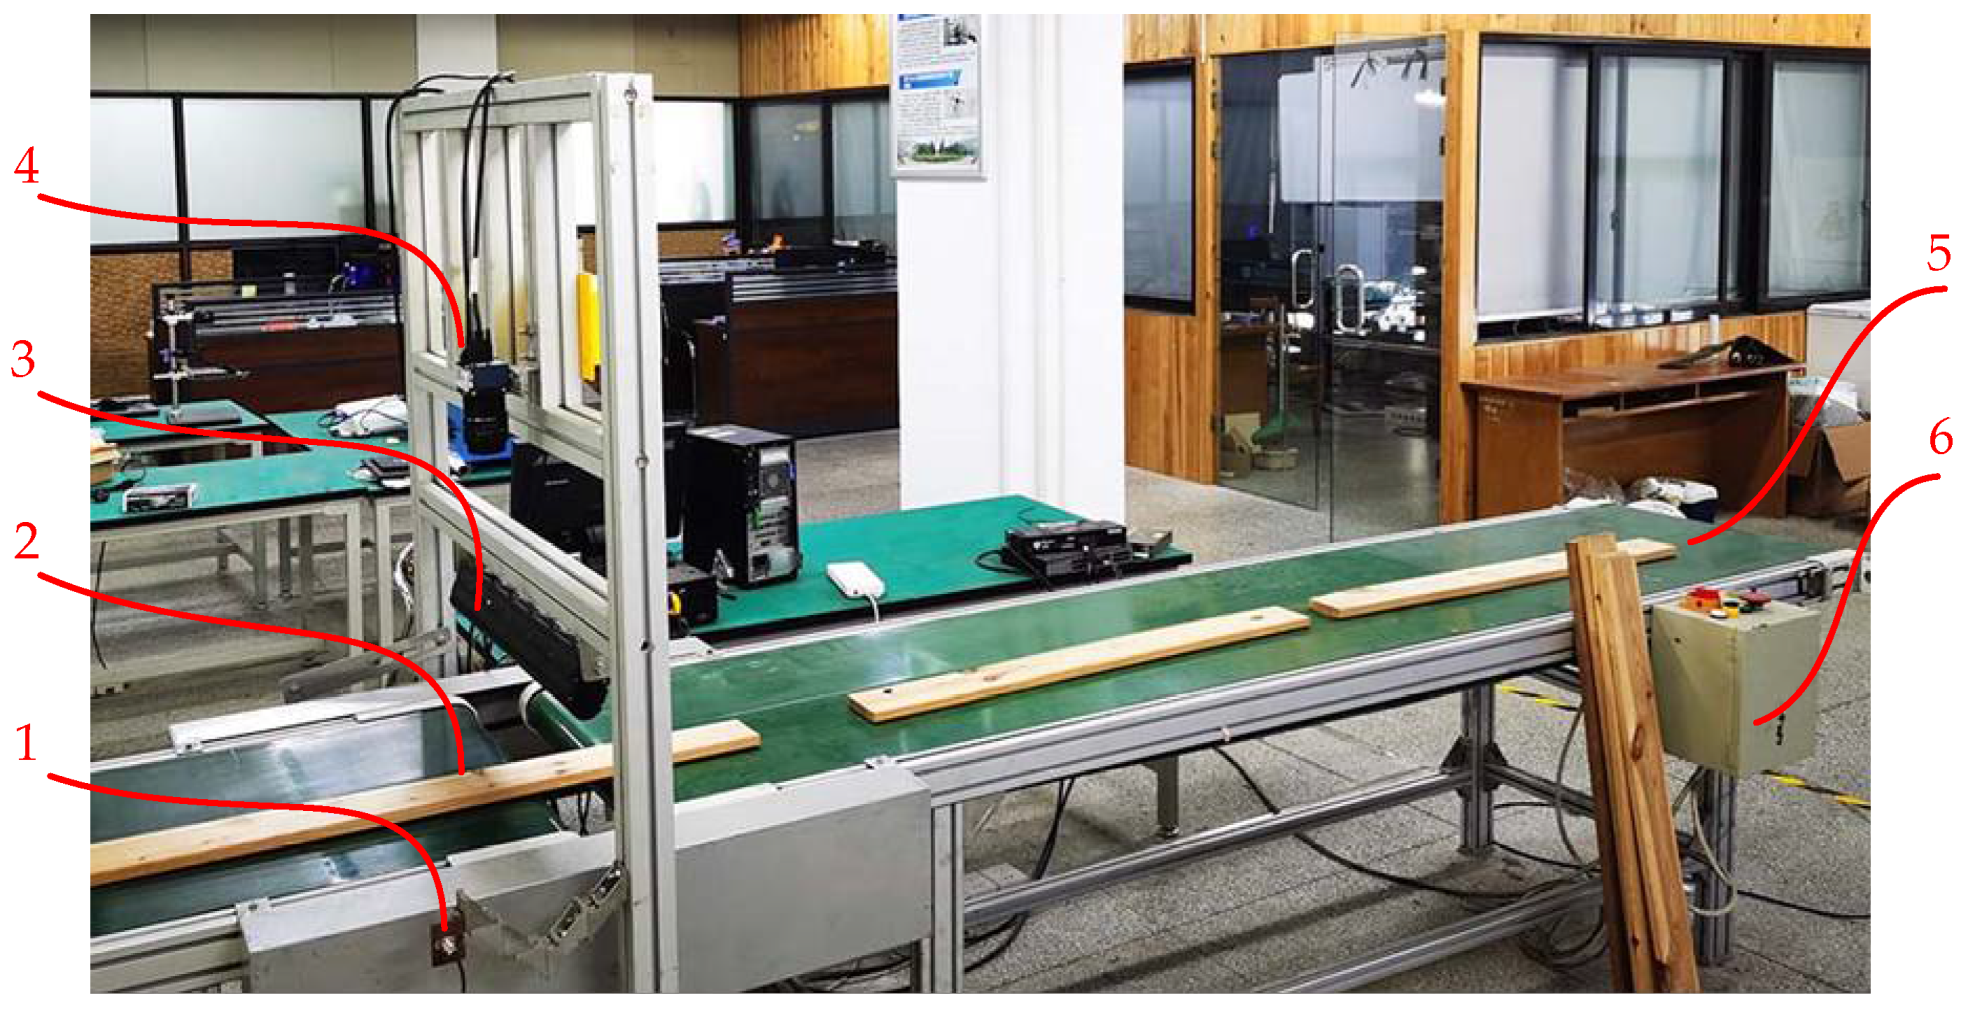
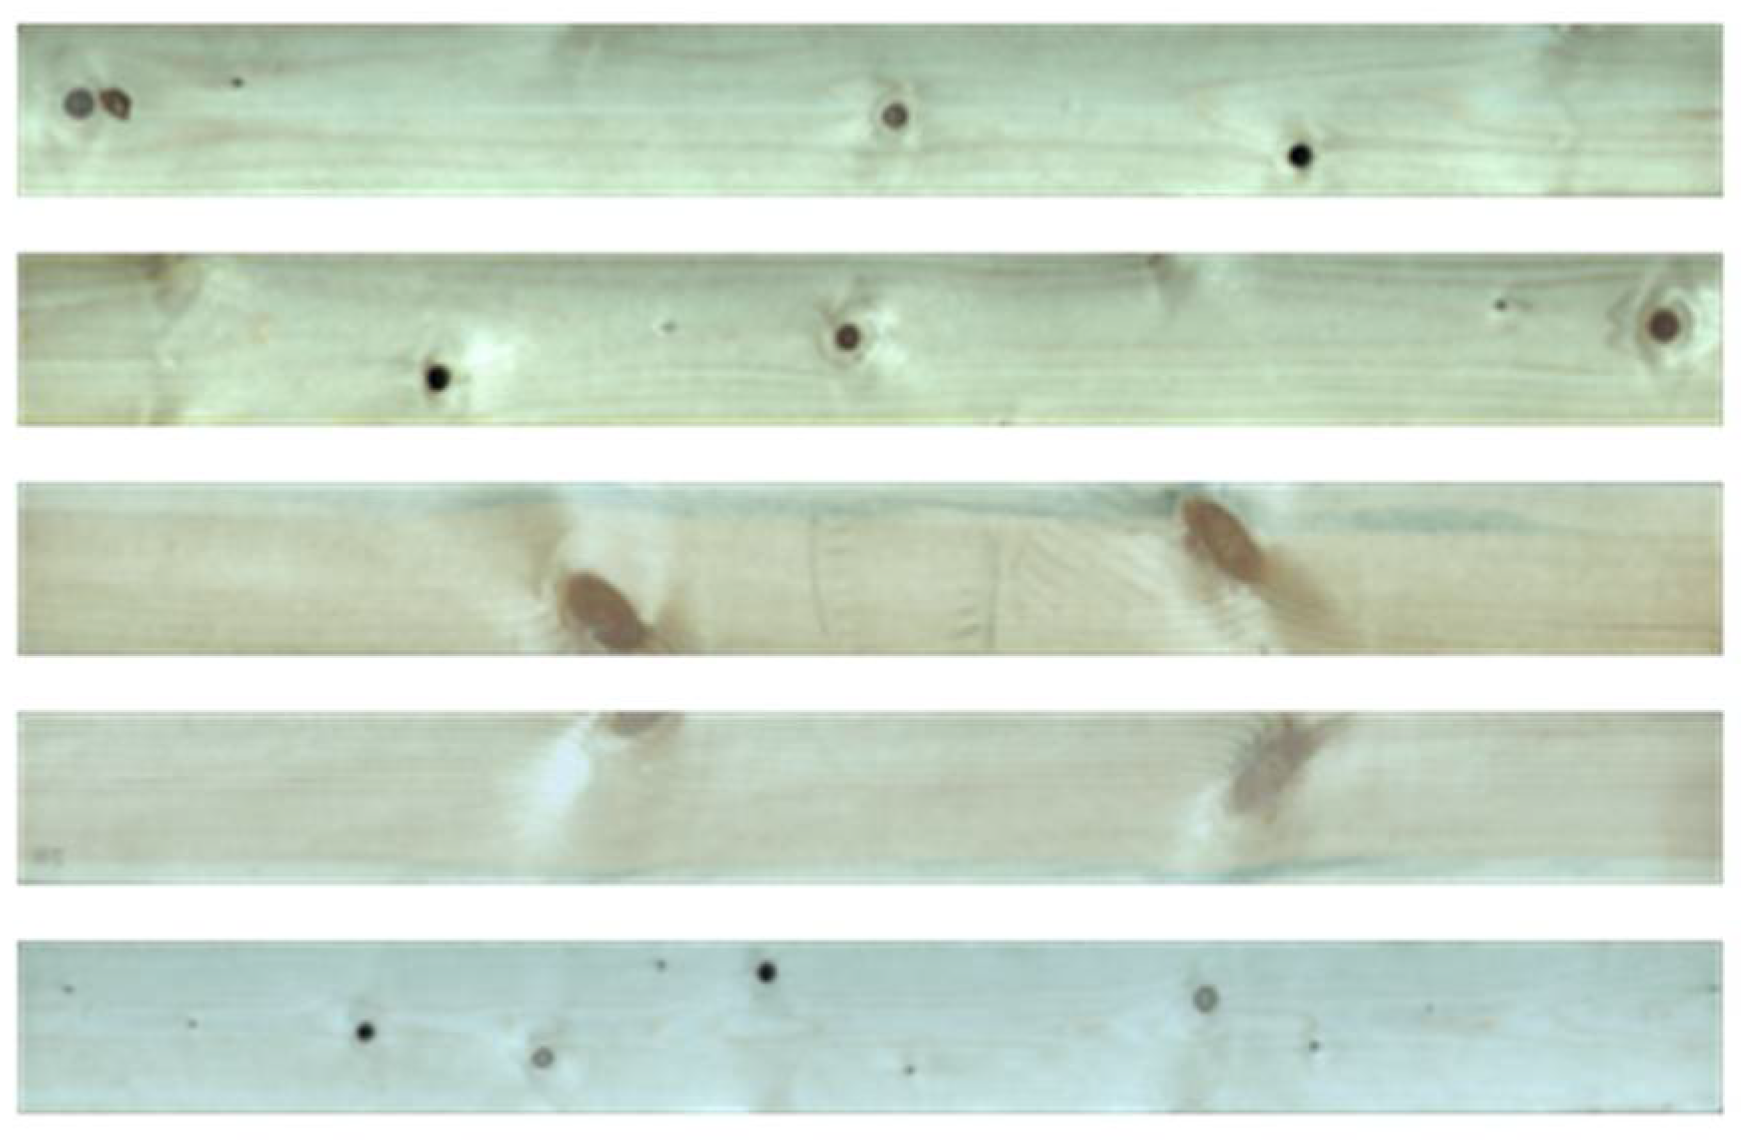
2.1. Imaging

In actual production, defect detection is performed on the image of a solid wood board through several processing steps. The structure of the image acquisition system built in this study is shown in Figure 1.
The core device of the CCD camera in the image acquisition system was a Linea LA-GC-02K05B color line scan camera (Teledyne DALSA Co., Waterloo, ON, Canada). The camera adopts high-sensitivity CMOS (complementary metal oxide semiconductor) technology and the line frequency can reach up to 26 kHz, with high acquisition speed, low noise, high single-line resolution, and high sensitivity. To improve the imaging quality of the acquired image, it was necessary to reduce the influence of light conditions on the acquisition effect during the data acquisition process, thus ensuring uniform illumination and minimizing the light reflection in the data acquisition area. Therefore, a linear light source LCOL-300-25 (HZN, shanghai, China) was selected to meet the requirement of uniform illumination in the single-line area required by the linear CCD camera. When collecting data, the scanning frequency was set to 1280 lines for processing once, and, after collecting data on the front of each sheet, a 2048 × 18,000 pixel image of the solid wood board with a depth of eight bits was obtained.

2.2. Mathematical Model

Assuming that there are still t small pieces of boards after removing the defect, that s types of standard boards need to be placed, and that the k-th wood specification i is sawn to obtain the number of segments   x k i , the first constraint is as follows:
[ x 11 x 1 s x t 1 x t s ] × [ a 1 a s ] [ l 1 l t ] .
It can also be written as
i a i x k i l k ,
where a i denotes the standard length of wood of the first specification.
Considering the loss when cutting wood, each cutting will produce a certain loss; taking the loss as cl, we get
i a i x k i c l × ( i x k i 1 ) l k .
Thus, in order to achieve the highest utilization rate of wood, we can directly take the total length of the final board length as the optimization goal; then, we need to obtain the maximum of the total length, i.e.,
f 1 = m a x ( i , k a i x k i ) .
In order to maintain the consistency of the solid wood board’s texture, the splicing of the board surface is generally first spliced according to the direction of texture, and then several rows of wood board are glued according to the dimensions demand. Assuming that the splicing board does not use wood from other sources, then the total number of each specification wood required for splicing the desktop is less than or equal to the number of each specification wood cutout; furthermore, assuming that a total of r pieces of board splicing are required and that the number of boards of the i-th specification used in row j is m j i , the second constraint is as follows:
j m j i k x k i .
Similar to Equation (1), the third constraint is as follows:
[ m 11 m 1 s m r 1 m r s ] × [ a 1 a s ] = [ L 1 L r ] .
It can also be written as
L j = i a i m j i .
Each time the board is fingered, a certain loss will be generated. Taking the loss of the board during fingering as g l , we get
L j = i a i m j i g l × ( i m j i 1 ) .
The fingered board is bonded with glue according to the specification requirements, and the final effective area is the maximum rectangle inscribed on the spliced graph. The length of one edge of the rectangle is determined by the number of rows of the spliced board, and the length of the other edge is determined by the length of the board with the shortest row. Then, the optimization objective can be written as
f 2 = m a x ( m i n ( L j ) ) .
Thus, the final number of variables to be calculated is (r + t) × s, and the problem of optimal cutting of boards is transformed into solving an (r + t) × s element optimization problem. The final constraint number is r + t, where t is the number of wood segments after removing defects, r is the number of long board blocks that need to be assembled, and s is the number of standard sizes. The optimization problem can be written as
{ f 2 = m a x ( min ( L j ) ) , L j = i a i m j i g l × ( i m j i 1 ) s . t . { i a i x k i c l × ( i x k i 1 ) l k j m j i k x k i ,   x k i , m j i N .
In the above process, in order to meet the standards of the factory’s processing and circulation, there are two wastes. One is the standardized waste which comes from removing defects to satisfied the standard size, and the other is the waste of materials cut into rectangles after splicing. If the two processes of removing defects of the solid wood board and finger-jointed board are optimized together, the utilization rate of wood can be greatly improved in theory. Then, the first constraint will disappear. The corresponding assumption is that there are still t small pieces of wood after removing defects, and that the length of the k-th small piece of wood is l k . Thus, it is only necessary to consider the line where the t small piece is, as well as whether the k-th small piece is arranged in the j-th row, denoted as q j k .
[ q 11 q 1 t q r 1 q r t ] × [ l 1 l t ] = [ L 1 L r ] .
Considering the fingering consumption, the length of the j-th row for stitching can be expressed as
L j = k q j k l k g l × ( k q j k 1 ) ,
where q t i is 0 or 1. The constraint is that small pieces of wood can only be used once; thus,
i q t i 1 .
Accordingly, the final number of variables to be calculated is r × t, and the problem of optimal cutting of boards is transformed into solving an r × t element optimization problem. The final number of constraints is t, where r is the number of wood segments after removing defects, and t is the number of long board blocks to be pieced out. The optimization problem can be written as
f 3 = m a x ( min ( L j ) ) , L j = k q j k l k g l × ( k q j k 1 ) s . t . i q t i 1 , q t i [ 0 ,   1 ] .
The flow chart of solid wood board defect removal/board reconstruction is shown in Figure 2.
The quality of the restitching method can be evaluated as follows:
f 1 = f 1 l k . f 2 = r × f 2 l k . f 3 = r × f 3 l k .

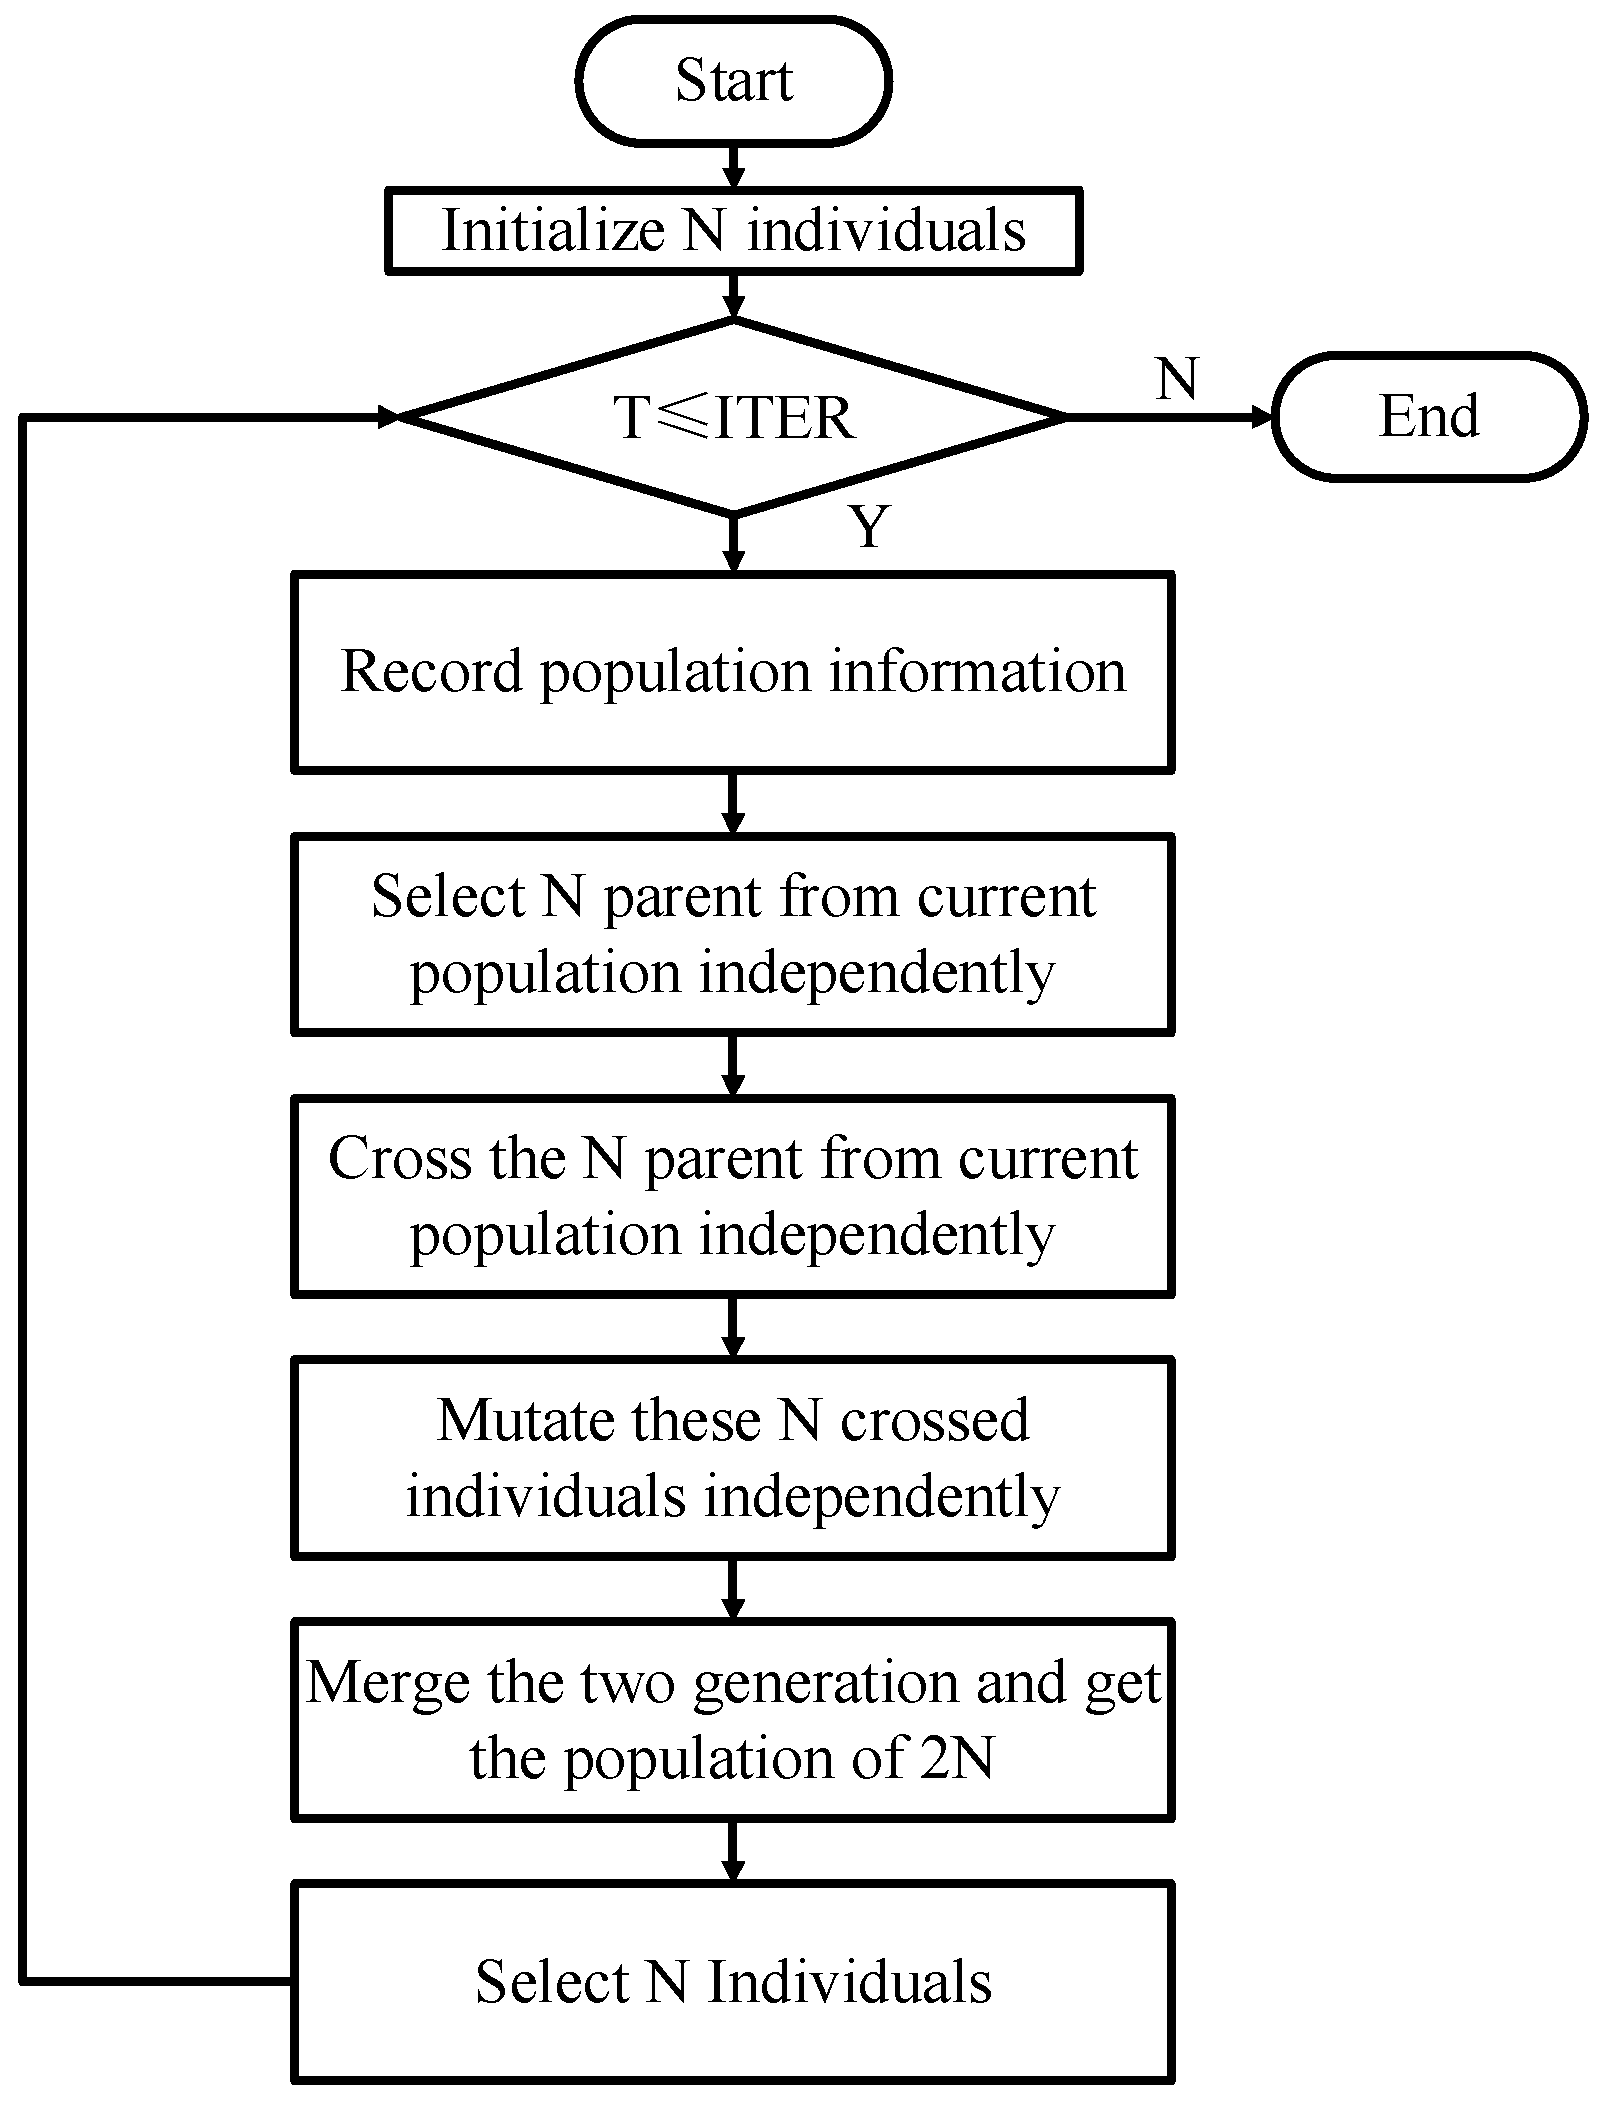
2.3. Elite Retention Strategy Genetic Algorithm
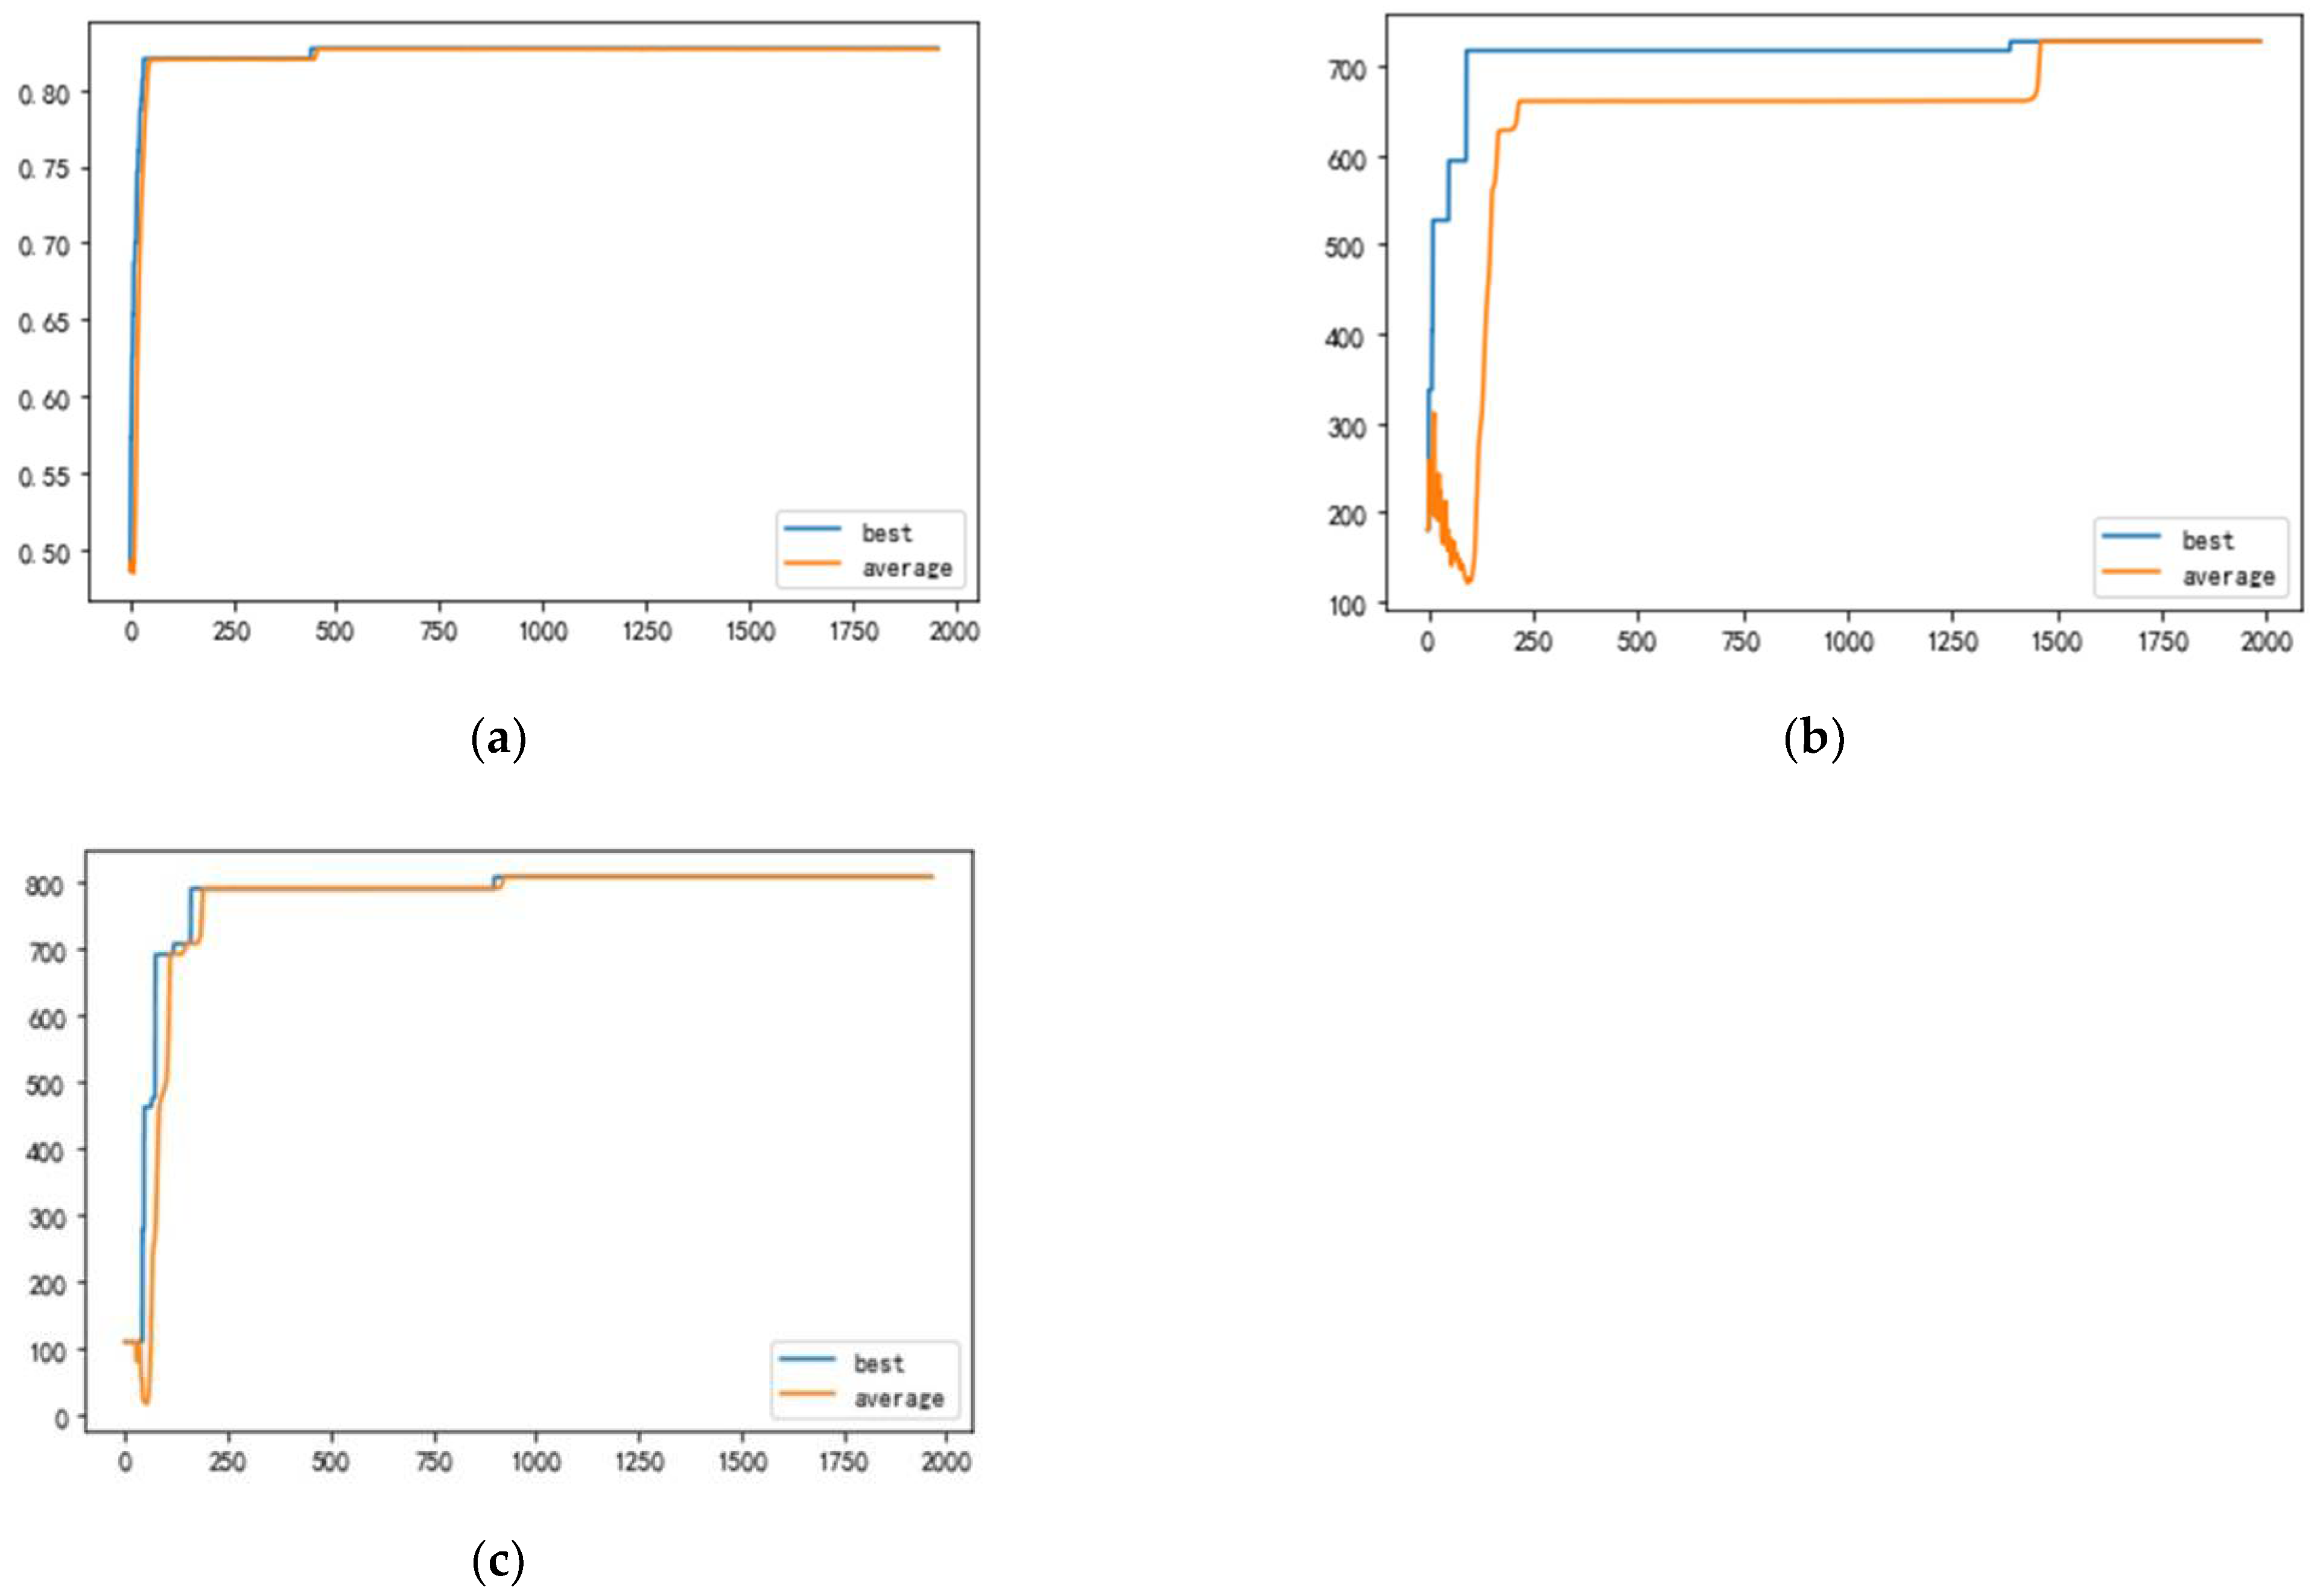
Genes in the genetic algorithm are not necessarily able to truly reflect the nature of the problem to be solved. Thus, each gene is not necessarily independent of each other. Rudolph [19] used the finite Markov chain theory to prove that the canonical genetic algorithm (CGA), which only uses three genetic operators of crossover, mutation, and selection, cannot converge to the global optimal value. This is due to the existence of statistical error, according to the random number generated by the selection, whereby using the proportional selection method may incorrectly reflect the individual fitness selection, and high-fitness individuals may be eliminated. Secondly, crossover and mutation operators may destroy the hidden high-order length and schema in individuals, which may lead to the loss of optimal individuals in the current population in the next generation (which will occur in the evolutionary process).
Elite individuals are the individuals with the highest fitness value searched by the genetic algorithm, which have the best gene structure and excellent characteristics. The advantage of elite retention is that, in the evolutionary process of the genetic algorithm, the optimal individuals will not be lost and destroyed by selection, crossover, and mutation operations. The elite retention algorithm [20] flow chart is presented in Figure 3.
To find the best answer of x k i ,   m j i and m j i in the best result of f 1 ,   f 2 and f 3 , real integer mixed coding was used to encode x k i ,   m j i and m j i and the population was set to 10,000, iteration was set to 2000, the mutation scaling factor of differential evolution was set to 0.6 and the single point crossover probability was set to 0.6 in the elite genetic algorithm.

3. Results

Figure 4 shows five pieces of solid wood board raw materials randomly selected from a batch of SPF (Spruce-pine-fir), plain sawn, which are 1000 mm long, 100 mm wide, and 10 mm thick. Each board has some defects. The defects in the board will have a certain impact on the mechanical properties and aesthetics of the splicing board. Therefore, it is necessary to cut the defects from the board according to certain standard sizes.

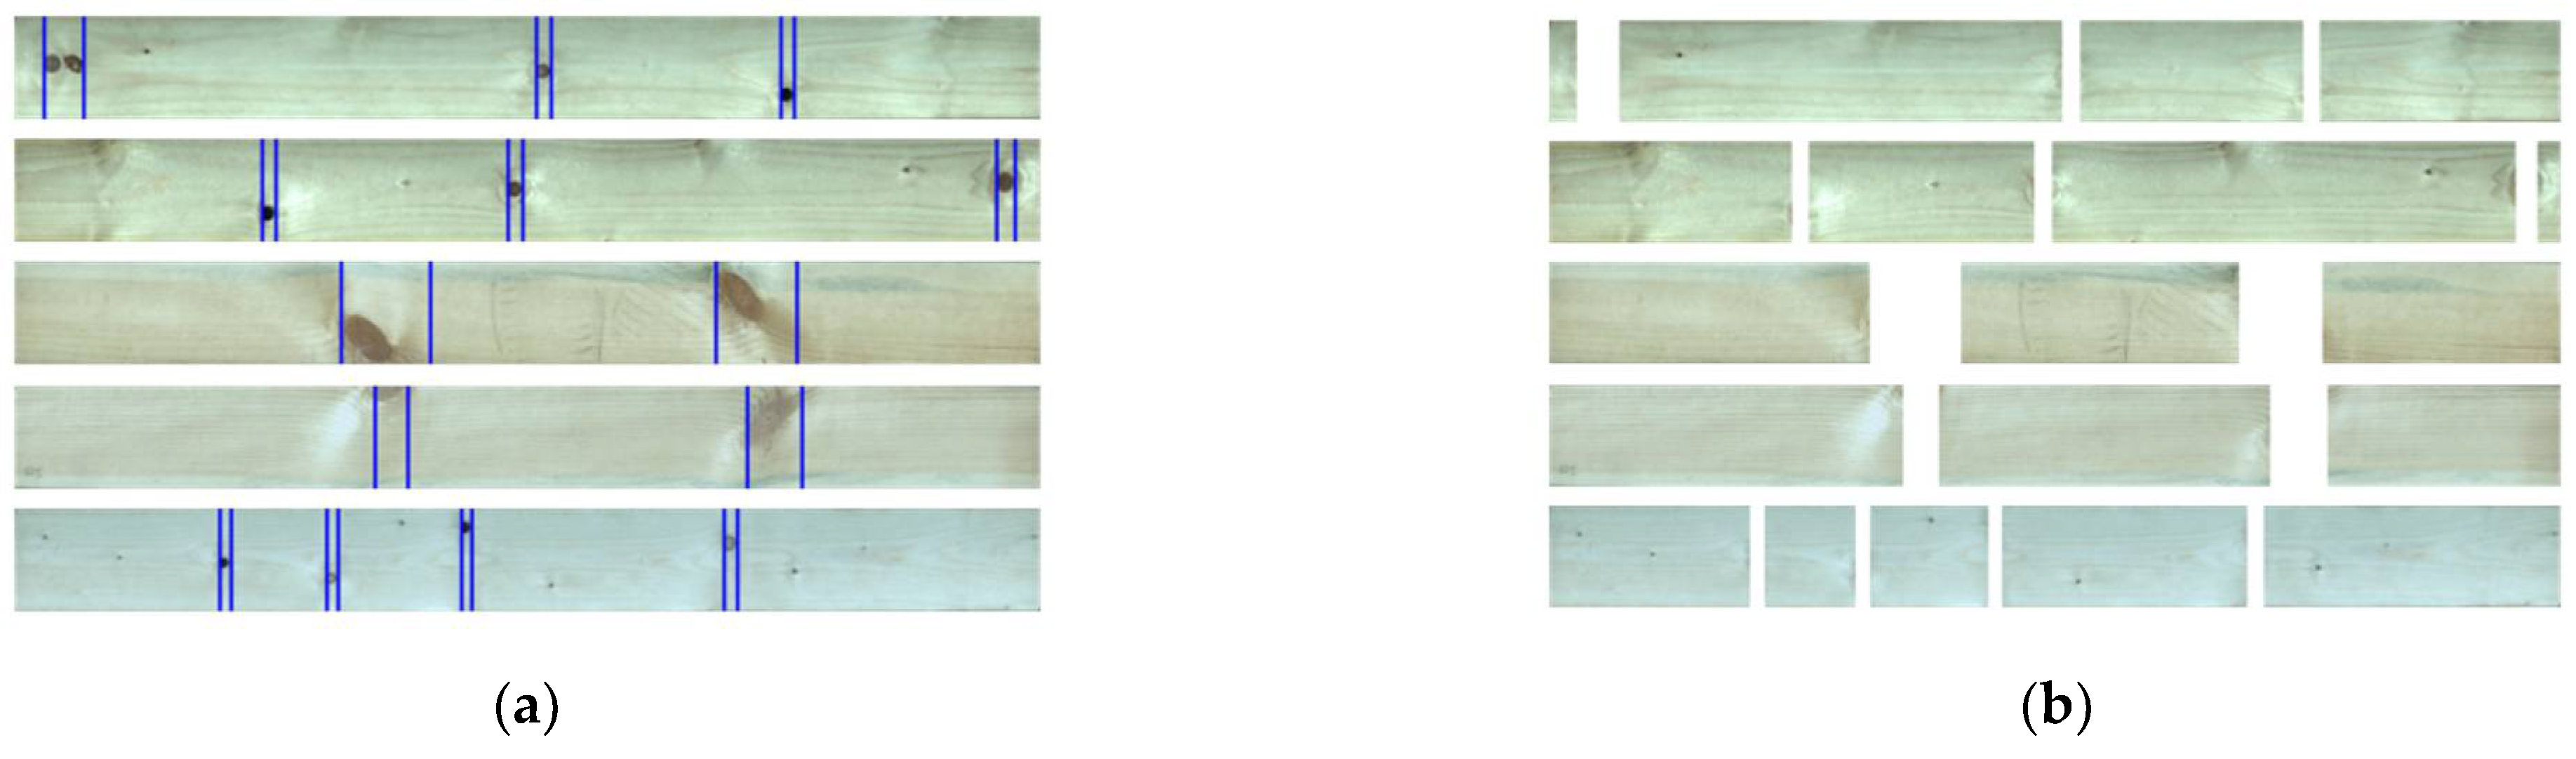
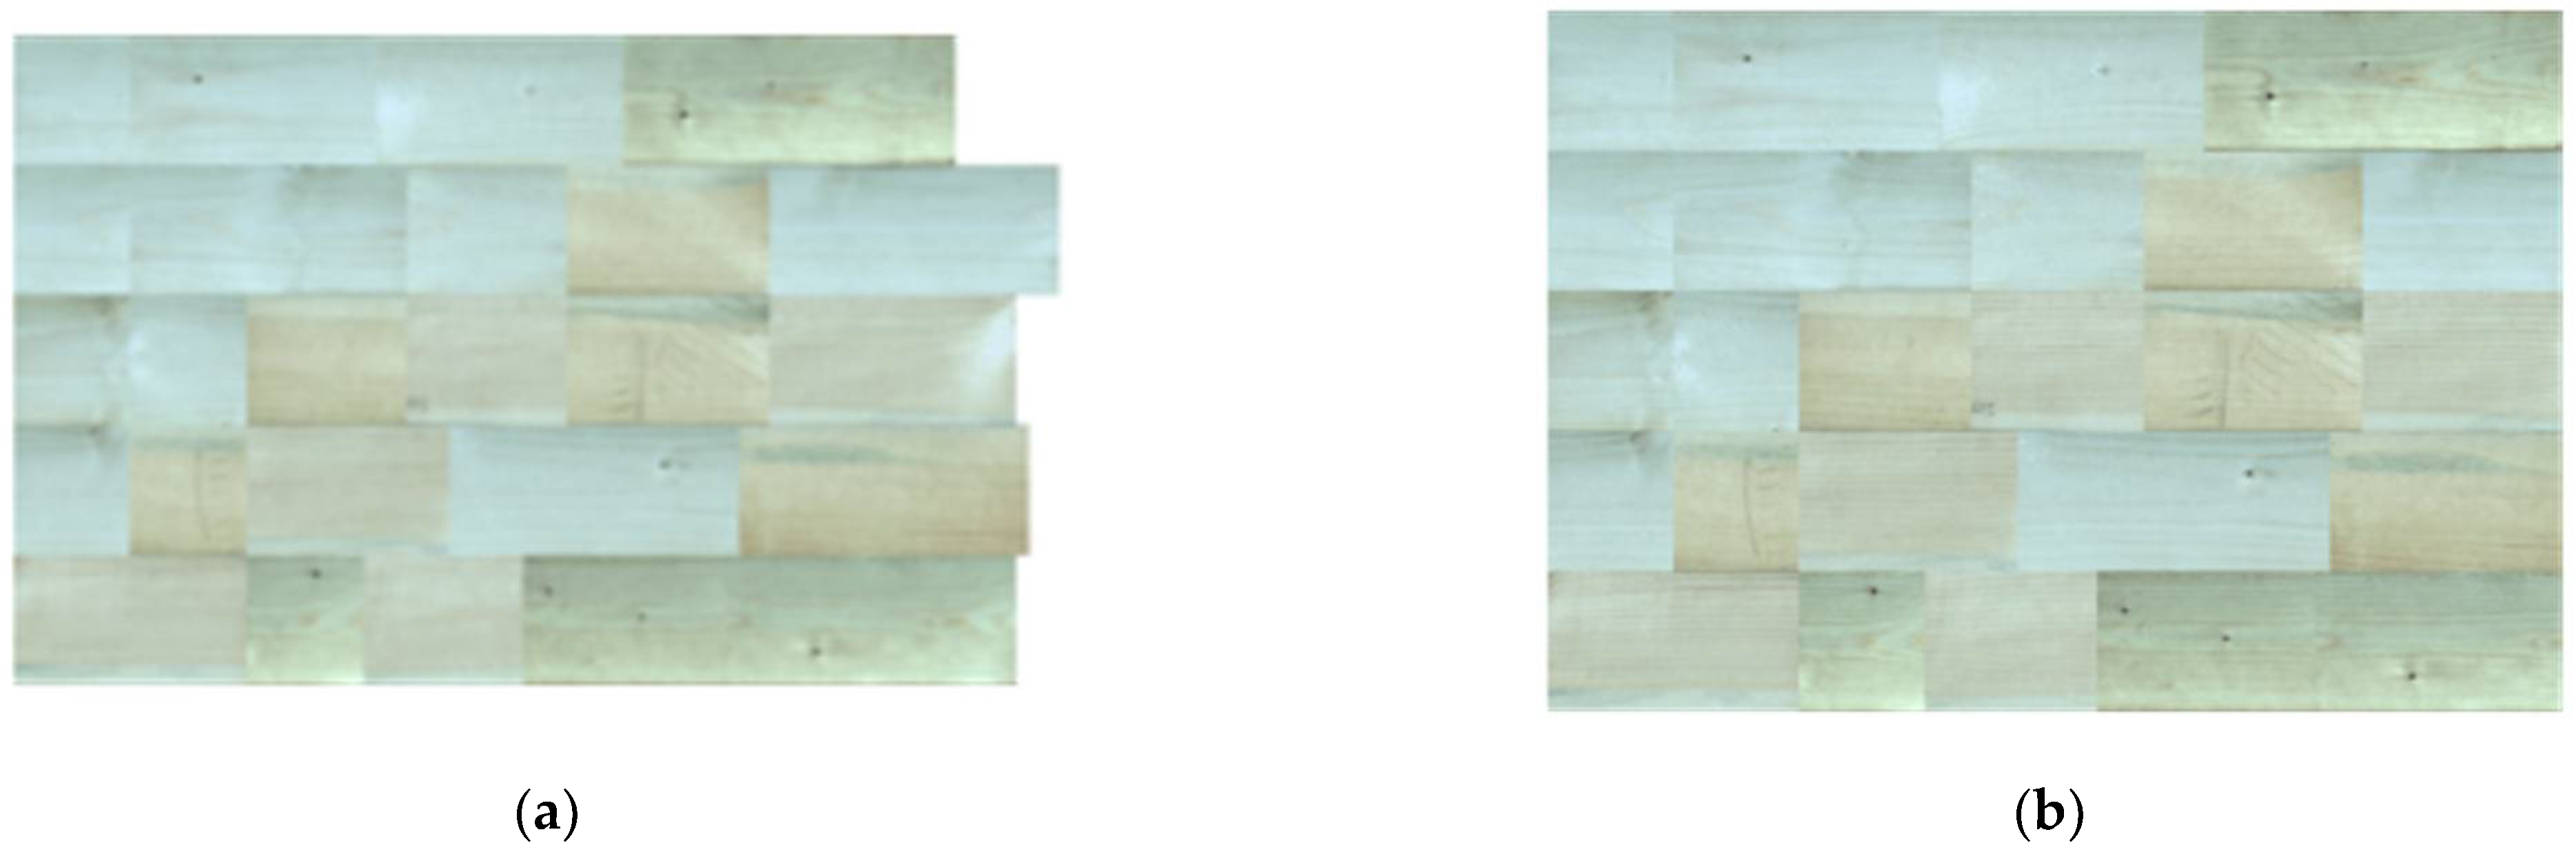
3.1. Solid Wood Splicing Board with Standardized Pieces

According to the principle that knots need to be removed, the target detection algorithm was used to identify the types and sizes of defects, and the cutting point of defects was obtained, as shown in Figure 5a. After the wood defects were removed according to the blue line, several segments of wood were obtained, as shown in Figure 5b. The wood size after sawing is no longer in line with the standard size of processing. Thus, it is necessary to cut it into a standard size.
After removing defects, the length of each segment of each board is listed in Table 1.
There are six standard specifications of the factory, namely, 100 mm, 133 mm, 167 mm, 200 mm, 233 mm, and 267 mm. The genetic algorithm was used to optimize the segments, and the planned cutting points are shown in Figure 6a. The remaining small blocks were sawn, yielding the small blocks shown in Figure 6b. The red lines in Figure 6a are the planned cutting points, and in Figure 6b, the small pieces with standardized length after removing defects are presented.
The number and the standardized lengths of the small pieces obtained is listed in Table 2.
The demanded width was 500 mm. Thus, the small pieces were spliced into rows and then rows were jointed forming a board. As shown in Figure 7, the surface of the board with standardized pieces was: width 500 mm, length 727 mm, and wood utilization rate 79.1%.

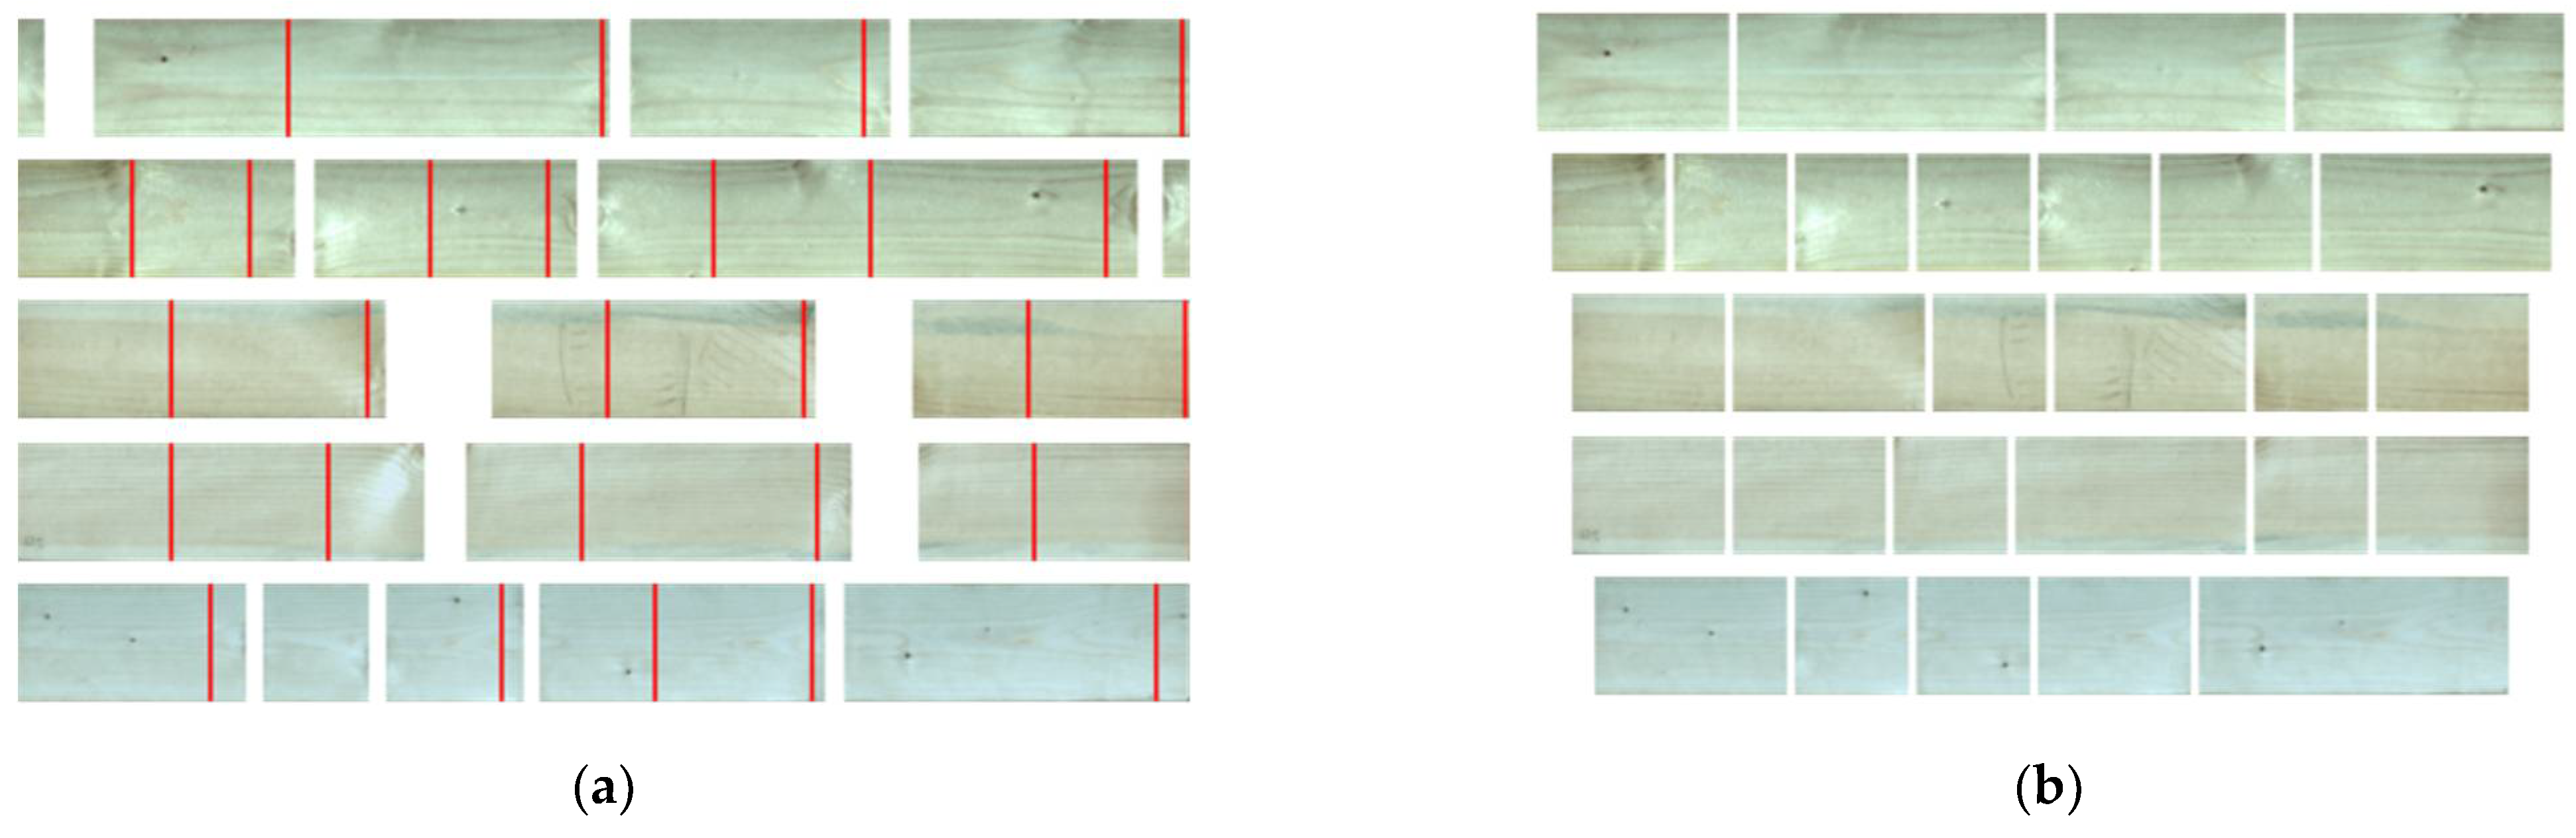
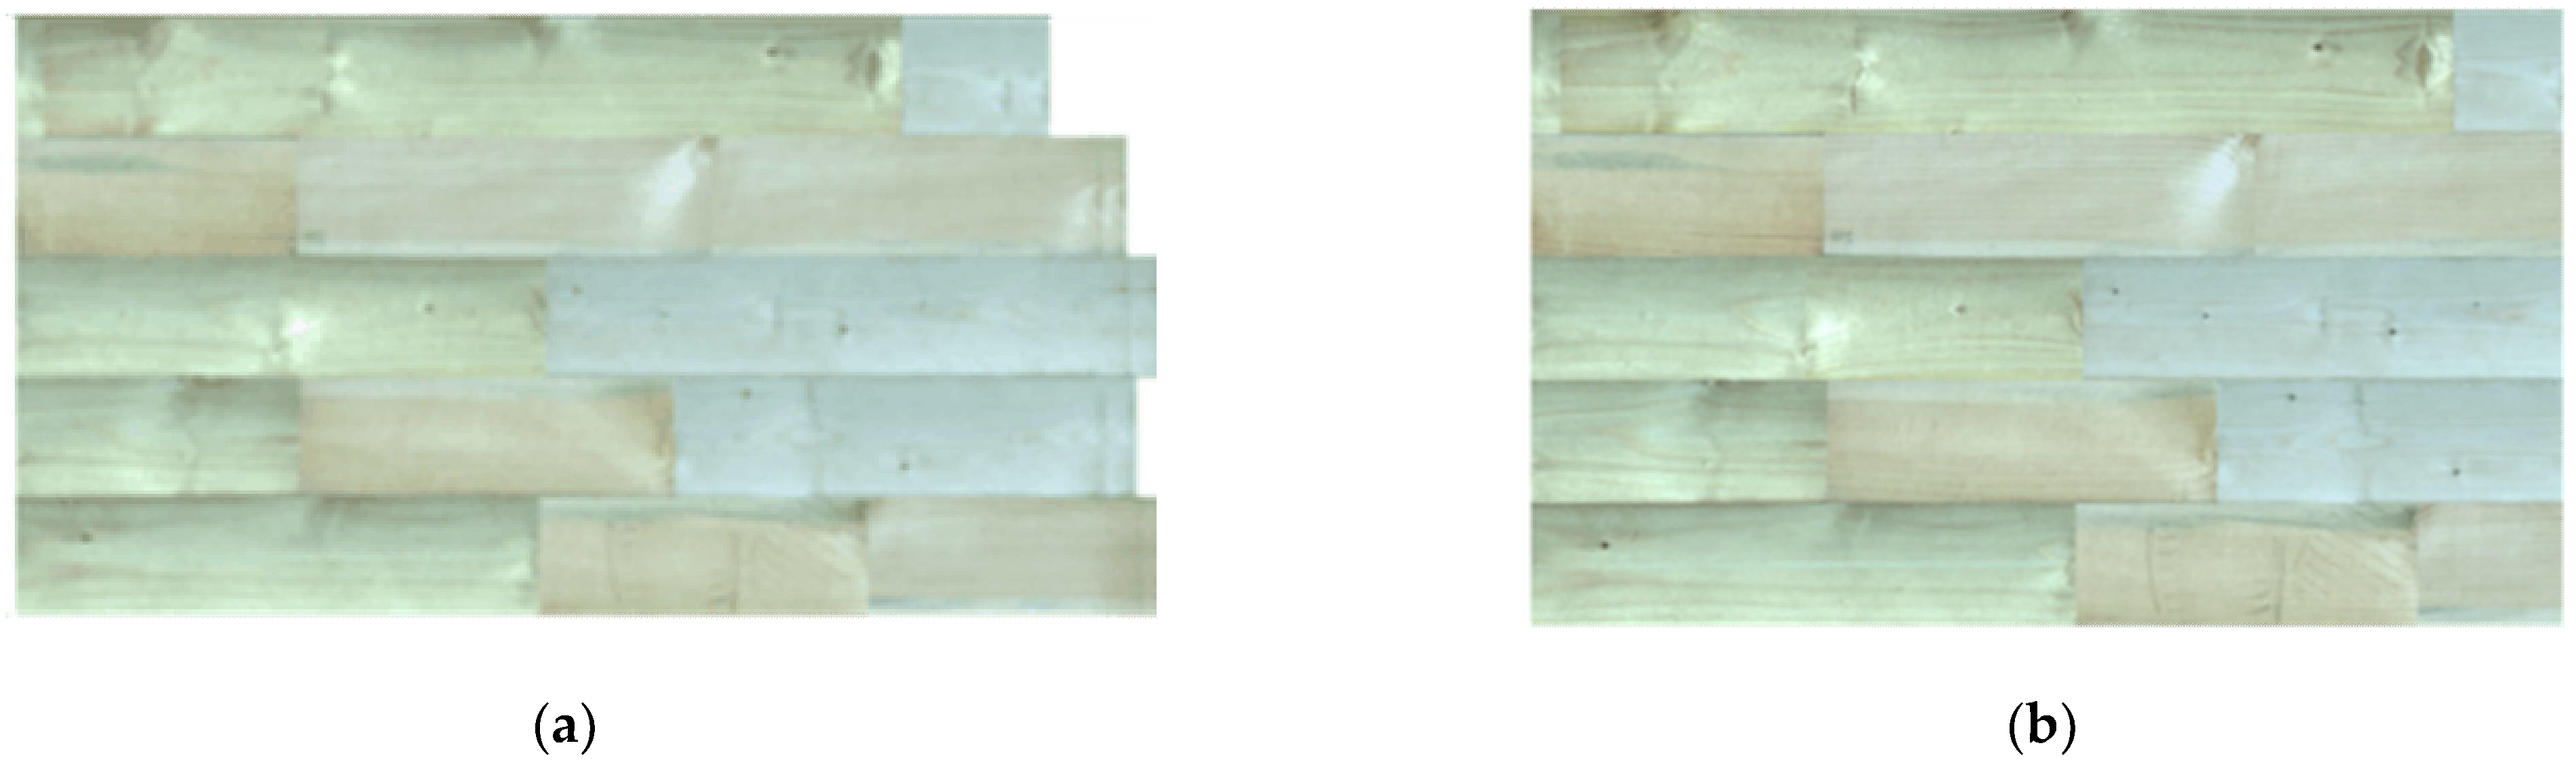
3.2. Solid Wood Splicing Board without Standardized Pieces

Without the standardization process, by directly joining of pieces obtained after defects removing, as shown in Figure 8, the final splicing board would have the following dimensions: width 500 mm, length 814 mm, and wood utilization rate 88.6%.

3.3. Two Methods in Large Scals

Random numbers (1–5), random positions, and random size defects were generated on the 1 m long board. After removing the defects, a small block of solid wood boards with random lengths was obtained. Similarly, the elite retention genetic algorithm was used to arrange 20, 50, and 100 solid wood boards with defects according to two optimization methods. Then different surfaces of the splicing boards were obtained from different number of pieces with defects. In order to reduce the extreme situation in each case, ten optimization experiments were carried out. The best result and average result of each case are both presented in Table 3.
Obviously, the wood utilization rate of the board after the removal of defects was higher without the standardization process. Under the current specifications, the utilization rate of the board processing strategy through the standardization process was about 60–80% at best, while the utilization rate of the nonstandard board processing strategy was about 80–90% at best. Thus, the utilization rate of the board processing strategy without the standardization process planned by the elite retention genetic algorithm could be increased compared with the standardized process. With the increase in production volume, the non-standardized board processing strategy was also improved compared with the standardized board processing strategy. The utilization rate of scales of 20, 50, and 100 were increased by 19.55%, 21.06%, and 14.71%. The flexible sawing and splicing of solid wood board processing on the wood production line can greatly improve the utilization rate of wood.

4. Discussion

Method 1 requires (r + t) × s variables and r + t constraints, while Method 2 requires r × t variables and t constraints. Thus, when
s < r × t r + t ,
Method 1 has fewer variables. In large-scale applications, t is a constant; hence, with the increase in the number of boards, r is usually much larger than t, yielding
s < t 1 + t r t .
Therefore, when s < t, Method 1 requires fewer variables than Method 2. However, l is always larger than s, so Method 1 can obtain higher time and space superiority in processing.
The genetic algorithm objective function increases with the number of iterations according to the curves shown below. The blue curve in Figure 9 is the function value of optimal individuals in the genetic algorithm iteration, and the red curve is the average function value of individuals in the population although the highest board utilization cannot be obtained.
The function value of optimal individuals in Figure 9a is f 1 , which converges quickly, with the best value of 0.83 after 750 generations in the elite genetic algorithm. The function value of optimal individuals in Figure 9b is f 2 , with the best value of 727 after 1390 generations in the elite genetic algorithm. The function value of optimal individuals in Figure 9c is f 3 , with the best value of 814 after 899 generations in the elite genetic algorithm.
Due to the randomness of wood defects, most of the board are difficult to meet the standard specifications after removing defects, so Method 1 performs poorly in large-scale simulation experiments.

5. Conclusions

In this paper, a shortcut method for defect removal in the board splicing of solid wood was proposed, and a mathematical model was established and solved by the genetic algorithm. The utilization ratio of two processing strategies was compared. The effective utilization rate of the board using Method 1 was 79.1%, while the utilization rate when using Method 2 was 88.6%, i.e., an improvement in utilization rate by 12.0%. For the defects randomly generated on 1 m of board, at scales of 20, 50, and 100, the direct planning results also obtained a higher board utilization rate. Compared with two-stage planning, the utilization of wood boards in scales of 20, 50, and 100 were increased by 19.55%, 21.06%, and 14.71%. Thus, the effectiveness of Method 2 is confirmed. In industrial applications, larger scale wood boards will be used, and the elimination of the intermediate standardization process can greatly improve the utilization rate of solid wood.

Author Contributions

Conceptualization, Z.Z. and Y.Y. (Yutu Yang); methodology, Y.Y. (Yutu Yang); software, Z.Z.; validation, Y.Y. (Yabin Yu) and Y.Y. (Yutu Yang); formal analysis, Z.Z.; investigation, Y.Y. (Yutu Yang); resources, Z.Z.; data curation, Y.Y. (Yabin Yu); writing—original draft preparation, Y.Y. (Yutu Yang); writing—review and editing, Y.Y. (Yabin Yu); visualization, Z.Z.; supervision, Y.Y. (Yutu Yang); project administration, Y.Y. (Yutu Yang); funding acquisition, Y.Y. (Yutu Yang) All authors have read and agreed to the published version of the manuscript.

Funding

This research was funded by the 2019 Jiangsu Province Key Research and Development Plan by the Jiangsu Province Science and Technology under grant BE2019112.

Data Availability Statement

Not applicable.

Acknowledgments

In addition to the funds we received, we should also like to thank China Jiangsu Jiangjia Machinery Co., Ltd. (Jiangsu, China) for providing us with materials and support for the image collection.

Conflicts of Interest

The authors declare no conflict of interest.

References

  1. Eslami, H.; Jayasinghe, L.B.; Waldmann, D. Nonlinear three-dimensional anisotropic material model for failure analysis of timber. Eng. Fail. Anal. 2021, 130, 105764. [Google Scholar] [CrossRef]
  2. Aryapratama, R.; Pauliuk, S. Life cycle carbon emissions of different land conversion and woody biomass utilization scenarios in Indonesia. Sci. Total Environ. 2022, 805, 150226. [Google Scholar] [CrossRef] [PubMed]
  3. Tang, M.; Liu, Y.; Ding, F.; Wang, Z. Solution to Solid Wood Board Cutting Stock Problem. Appl. Sci. 2021, 11, 7790. [Google Scholar] [CrossRef]
  4. Sarper, H.; Jaksic, N.I. Evaluation of procurement scenarios in one-dimensional cutting stock problem with a random demand mix. In Proceedings of the 28th International Conference on Flexible Automation and Intelligent Manufacturing (FAIM)—Global Integration of Intelligent Manufacturing and Smart Industry for Good of Humanity, Columbus, OH, USA, 11–14 June 2018; pp. 827–834. [Google Scholar]
  5. Cui, Y.D.; Song, X.; Chen, Y.; Cui, Y.P. New model and heuristic solution approach for one-dimensional cutting stock problem with usable leftovers. J. Oper. Res. Soc. 2017, 68, 269–280. [Google Scholar] [CrossRef] [Green Version]
  6. Cerqueira, G.R.L.; Aguiar, S.S.; Marques, M. Modified Greedy Heuristic for the one-dimensional cutting stock problem. J. Comb. Optim. 2021, 42, 657–674. [Google Scholar] [CrossRef]
  7. Ayres, A.O.C.; Campello, B.S.C.; Oliveira, W.A.; Ghidini, C.T.L.S. A Bi-Integrated Model for coupling lot-sizing and cutting-stock problems. OR Spectr. 2021, 43, 1047–1076. [Google Scholar] [CrossRef]
  8. Wang, W.; Shi, Z.; Shi, L.; Zhao, Q. Integrated optimisation on flow-shop production with cutting stock. Int. J. Prod. Res. 2019, 57, 5996–6012. [Google Scholar] [CrossRef]
  9. Zhu, H.; Xie, C.; Fei, Y.; Tao, H. Attention Mechanisms in CNN-Based Single Image Super-Resolution: A Brief Review and a New Perspective. Electronics 2021, 10, 1187. [Google Scholar] [CrossRef]
  10. Xie, C.; Tao, H. Generating Realistic Smoke Images With Controllable Smoke Components. IEEE Access 2020, 8, 201418–201427. [Google Scholar] [CrossRef]
  11. Xie, C.; Zhu, H.; Fei, Y. Deep coordinate attention network for single image super-resolution. IET Image Processing 2021, 16, 273–284. [Google Scholar] [CrossRef]
  12. Tseng, H.E.; Chang, C.C.; Lee, S.C.; Huang, Y.M. A Block-based genetic algorithm for disassembly sequence planning. Expert Syst. Appl. 2018, 96, 492–505. [Google Scholar] [CrossRef]
  13. Alshibli, M.; El Sayed, A.; Kongar, E.; Sobh, T.M.; Gupta, S.M. Disassembly Sequencing Using Tabu Search. J. Intell. Robot. Syst. 2016, 82, 69–79. [Google Scholar] [CrossRef]
  14. Hacioglu, A. Fast evolutionary algorithm for airfoil design via neural network. AIAA J. 2007, 45, 2196–2203. [Google Scholar] [CrossRef]
  15. Jafari-Marandi, R.; Smith, B.K. Fluid Genetic Algorithm (FGA). J. Comput. Des. Eng. 2017, 4, 158–167. [Google Scholar] [CrossRef]
  16. Li, J.C.; Li, L. An Improvement Proposal of Genetic Algorithms Based on Information Entropy and Game Theory. In Proceedings of the 6th International Conference on Social Networks Analysis, Management and Security (SNAMS), Granada, Spain, 22–25 October 2019; pp. 36–43. [Google Scholar]
  17. e Lopes, I.L.; Araújo, L.A.; Miranda, E.N.; Bastos, T.A.; Gomide, L.R.; Castro, G.P. A comparative approach of methods to estimate machine productivity in wood cutting. Int. J. For. Eng. 2021, 1–13. [Google Scholar] [CrossRef]
  18. Rodríguez Noriega, J.C.; Coronado-Hernández, J.R.; Leottau, S. Waste reduction in Rectangular Figure Cutting using a Genetic Algorithm. Cienc. Y Tecnol. De Buques 2016, 10, 19–26. [Google Scholar] [CrossRef] [Green Version]
  19. Rudolph, G. Convergence analysis of canonical genetic algorithms. IEEE Trans. Neural Netw. 1994, 5, 96–101. [Google Scholar] [CrossRef] [PubMed] [Green Version]
  20. Chen, J.; Xiao, Z. Research on Adaptive Genetic Algorithm Based on multi-population Elite Selection Strategy. In Proceedings of the 2nd IEEE International Conference on Computational Intelligence and Applications (ICCIA), Beijing, China, 8–11 September 2017; pp. 108–112. [Google Scholar]
Figure 1. Image acquisition device: (1) photoelectric sensor, (2) solid wood board, (3) linear light source, (4) CCD camera, (5) belt conveyor, and (6) sample solid wood floorboard.
Forests 13 00026 g001
Figure 2. Defect removal/board reconstruction flow chart.
Forests 13 00026 g002
Figure 3. Elite genetic algorithm flow chart.
Forests 13 00026 g003
Figure 4. Five pieces of wood board.
Forests 13 00026 g004
Figure 5. Defect removal. (a) The cutting points of defects. (b) Segments after removing defects.
Forests 13 00026 g005
Figure 6. Elite retention genetic algorithm sawing results. (a) Planned cutting points. (b) Wood after sawing.
Forests 13 00026 g006
Figure 7. The layout of wood splicing board with standardized pieces. (a) Board spliced by row. (b) Rectangular board.
Forests 13 00026 g007
Figure 8. Board after non-standardized layout. (a) Board spliced by row. (b) Rectangular board.
Forests 13 00026 g008
Figure 9. Genetic algorithm. (a) Cutting from raw board. (b) Arrangement of new board. (c) Shortcut method.
Forests 13 00026 g009
Table 1. Length of each segment of each board.
SourceLengths
From board 127441224241
From board 224022646226
From board 3317278239
From board 4350331234
From board 519993120246297
Table 2. Length of each segment of each board.
Standardardized Lengths (mm)Number of Segments
10010
1335
1674
2003
2334
2671
Table 3. Results of optimization experiments.
Number of BoardsStandardizedNon-Standardized
AverageBestAverageBest
200.44790.64040.68440.8359
500.49550.66370.64650.8743
1000.51220.66630.70340.8134
Publisher’s Note: MDPI stays neutral with regard to jurisdictional claims in published maps and institutional affiliations.

