
The Development and Application of a GIS-Based Tool to Assess Forest Landscape Restoration Effects on Water Conservation Capacity


Abstract
:1. Introduction
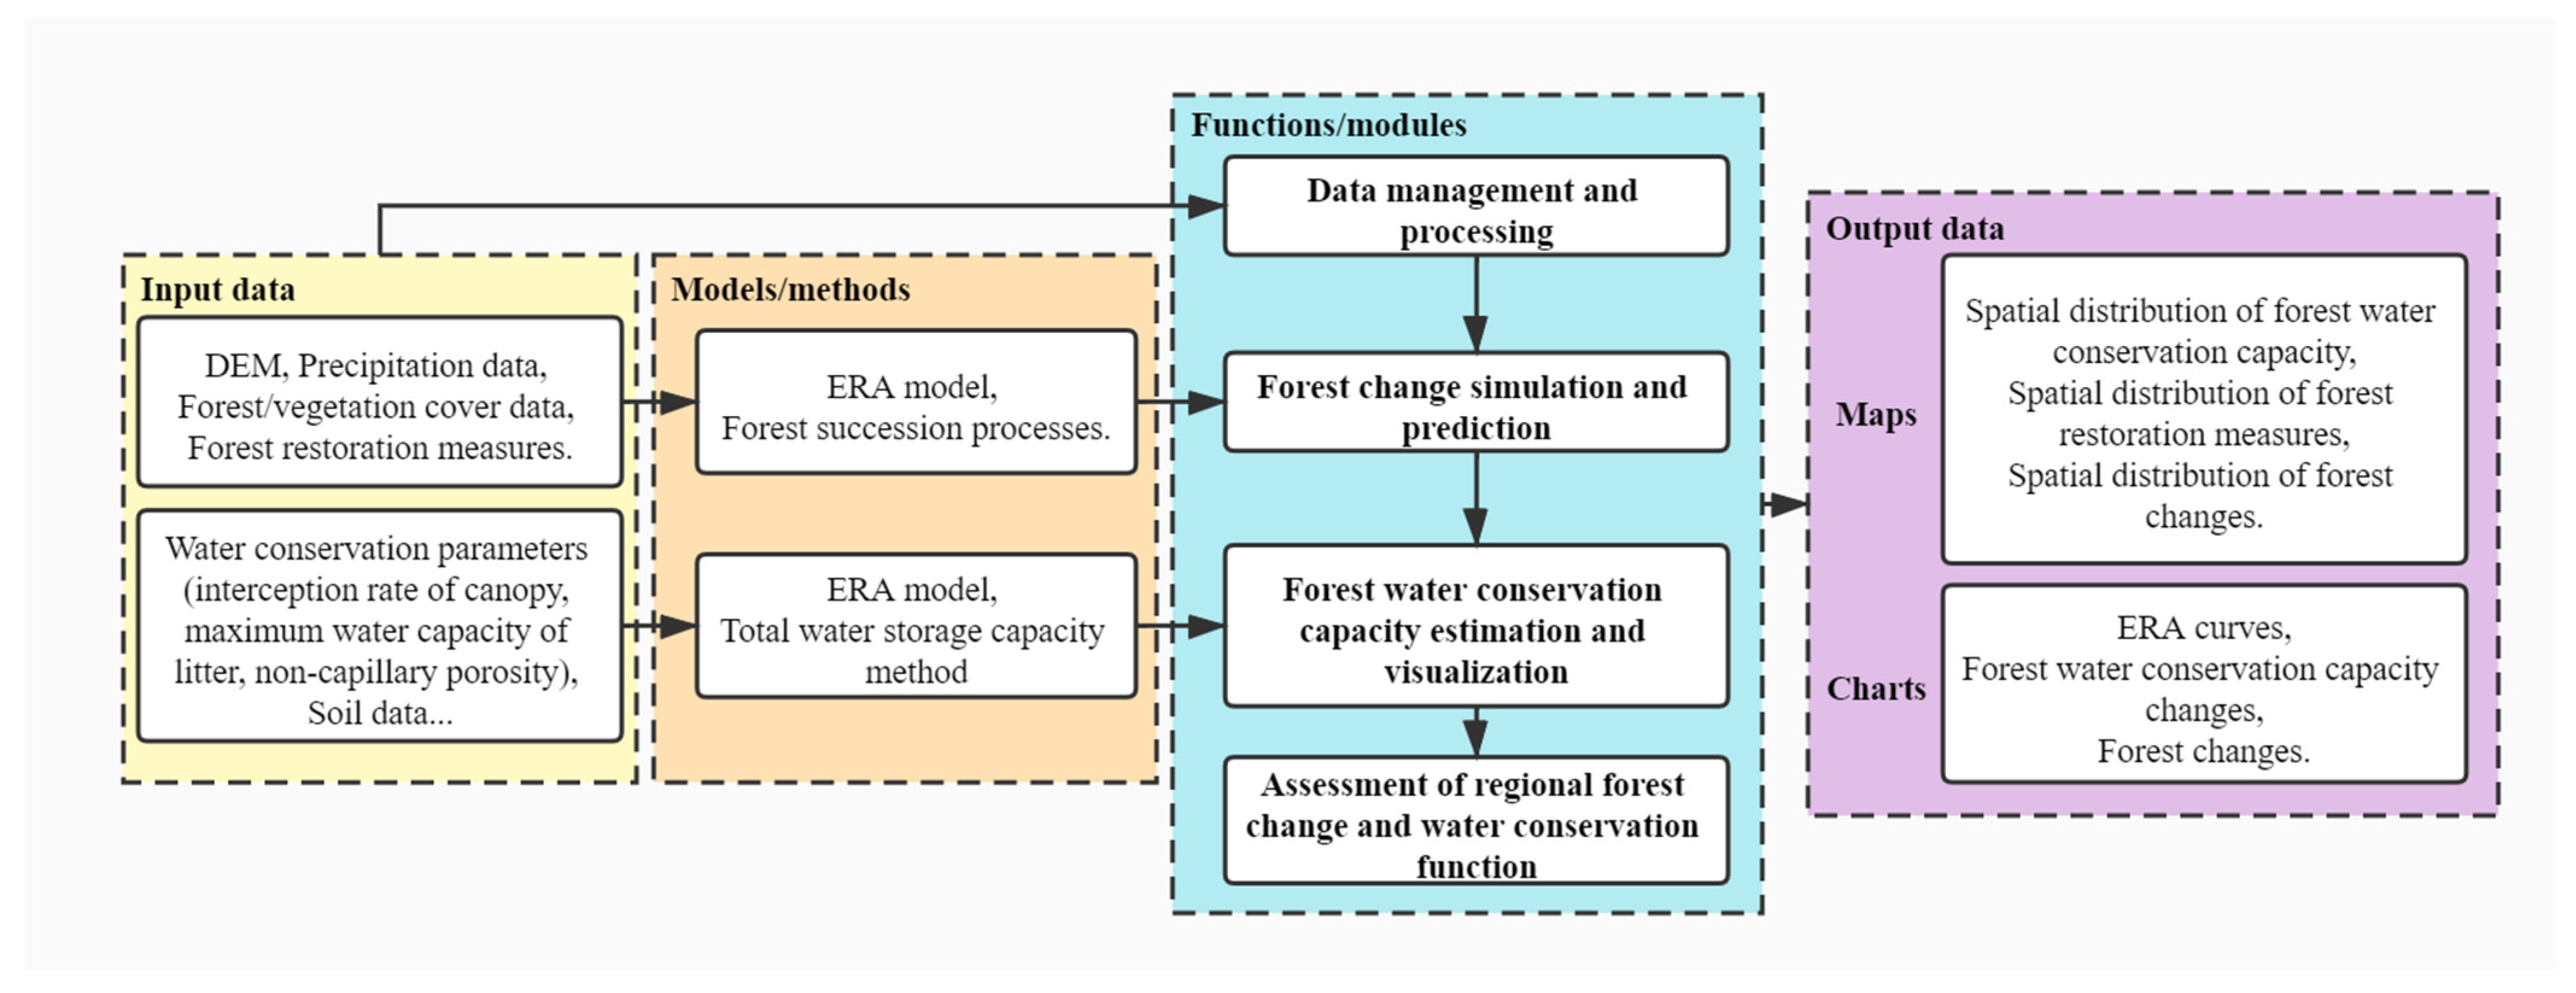
2. Model Design
2.1. Evaluation Procedures
2.2. Model Structures
2.2.1. Data Management and Processing
2.2.2. Forest Change Simulation and Prediction
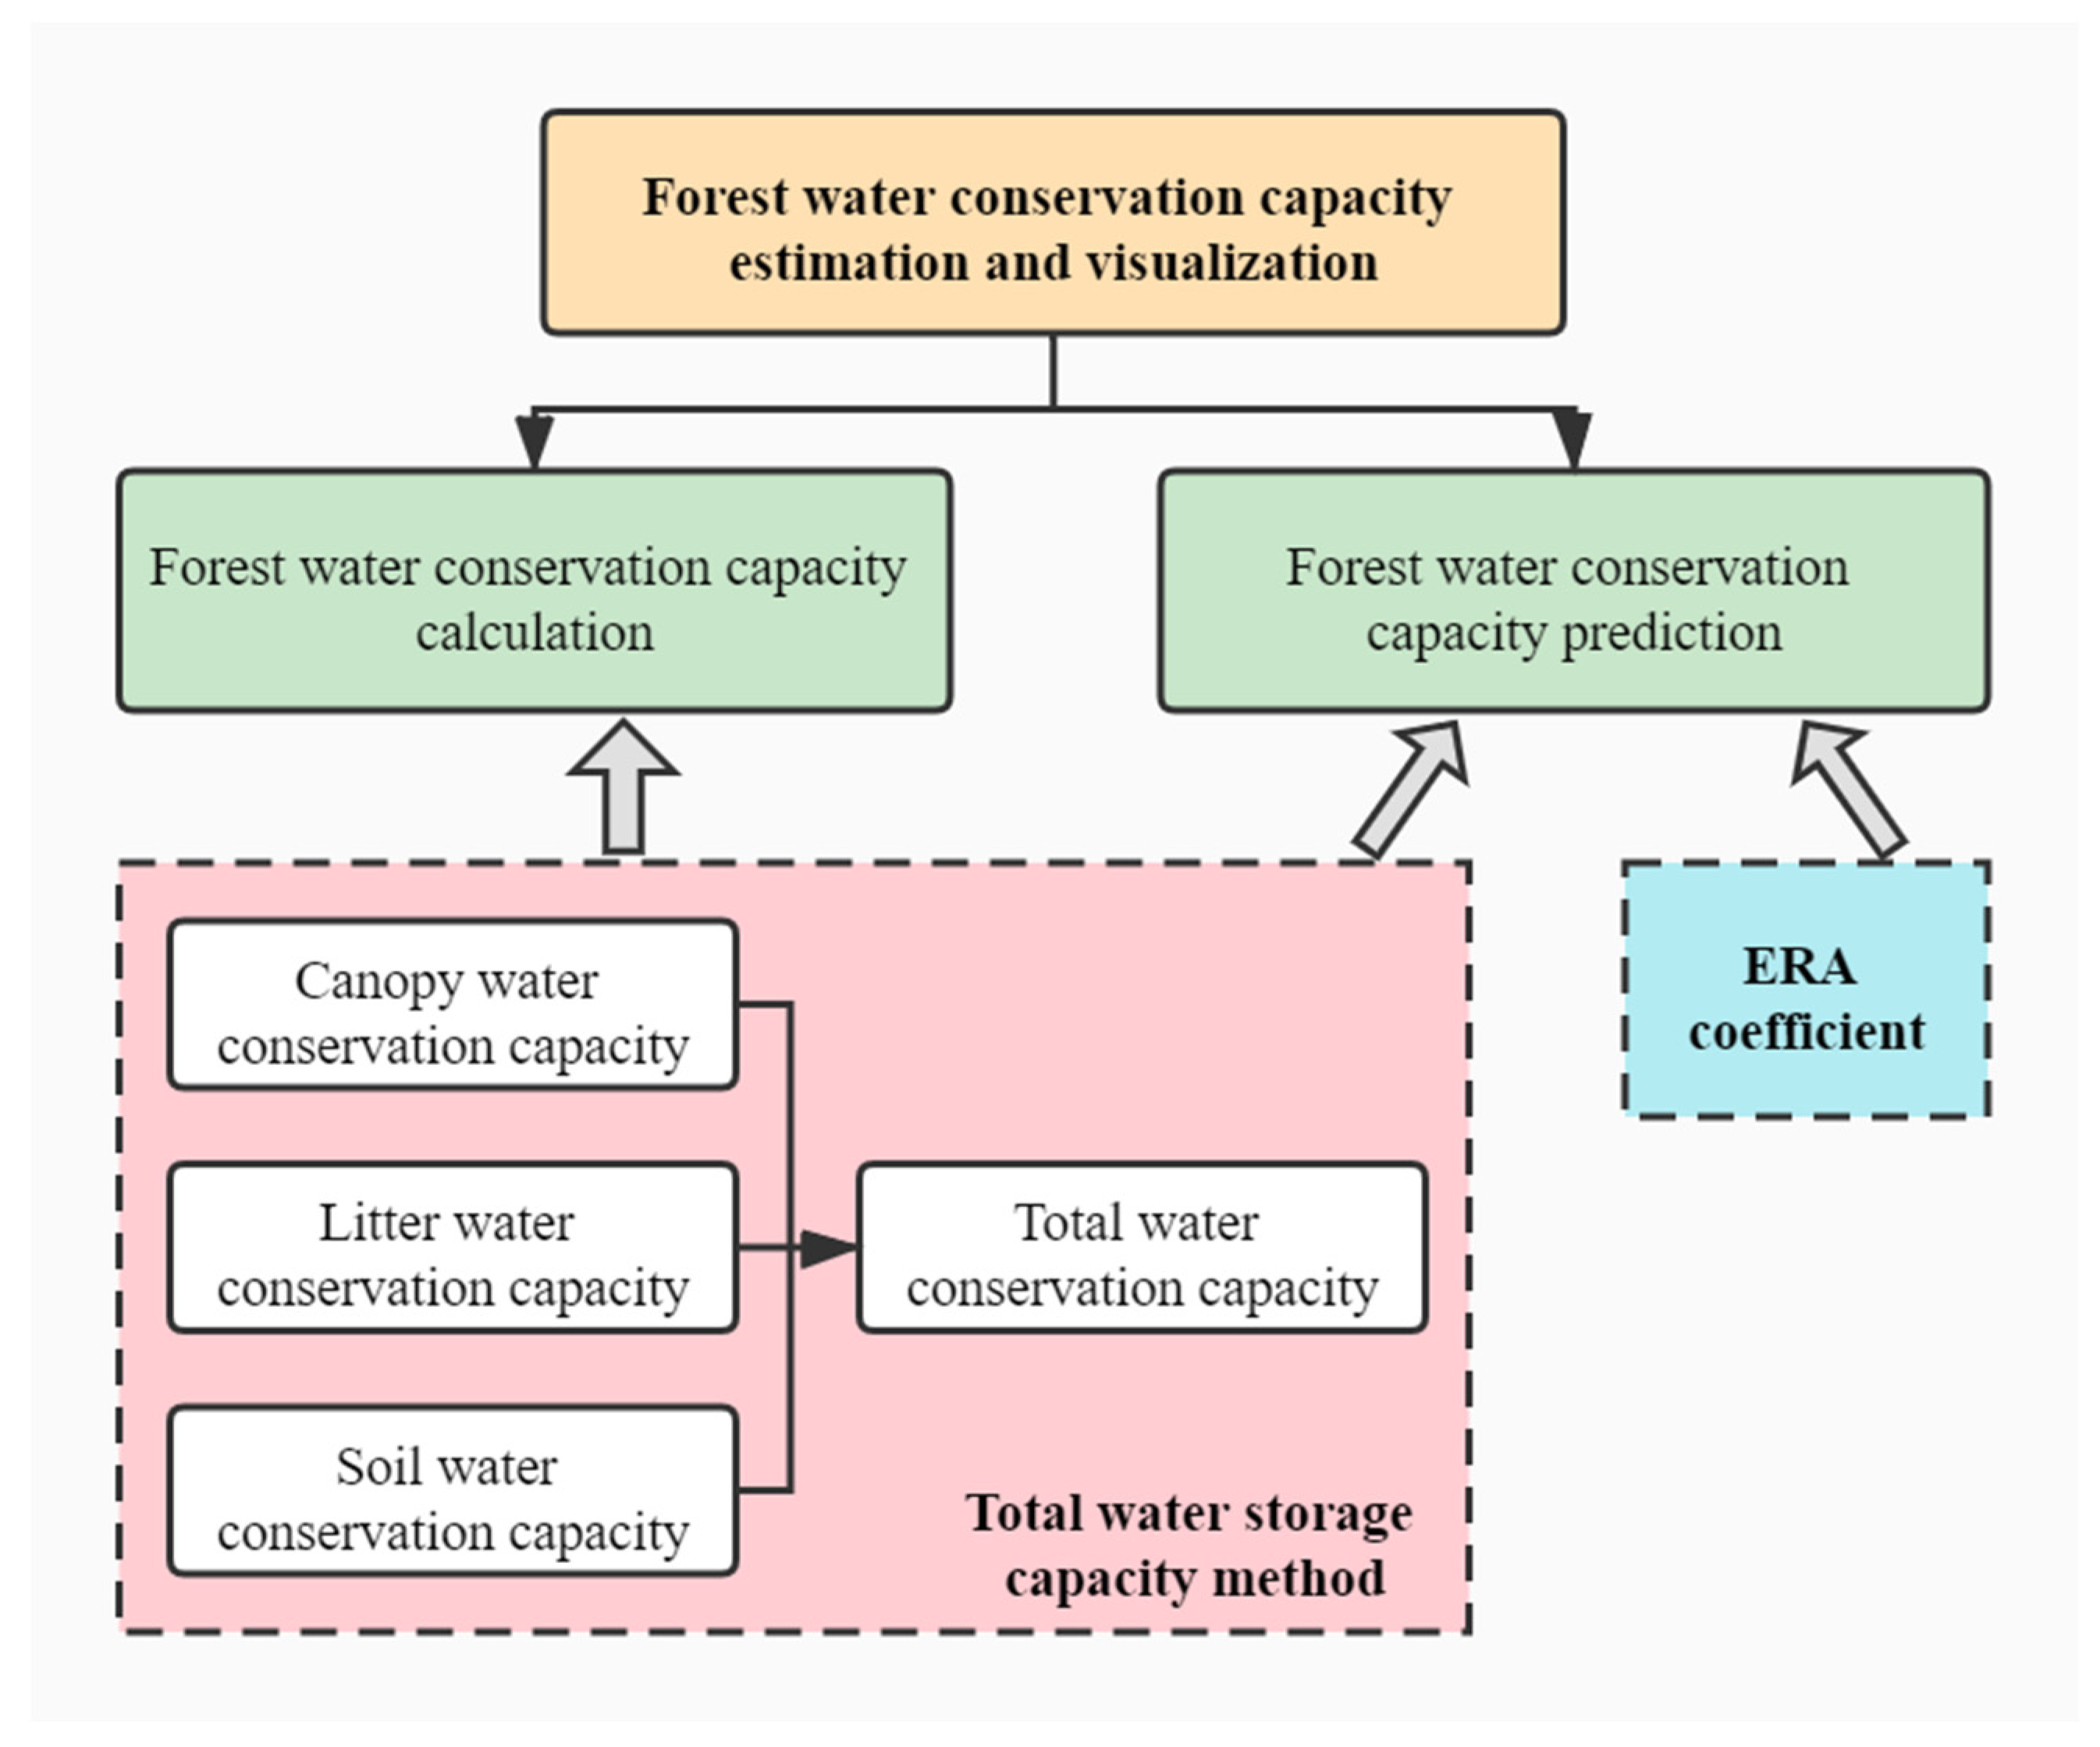
2.2.3. Forest Water Conservation Capacity Estimation and Visualization
3. Model Development
4. Model Application
4.1. Study Area
4.2. Data
4.3. Results
4.3.1. Forest Changes under Forest Restoration Scenarios
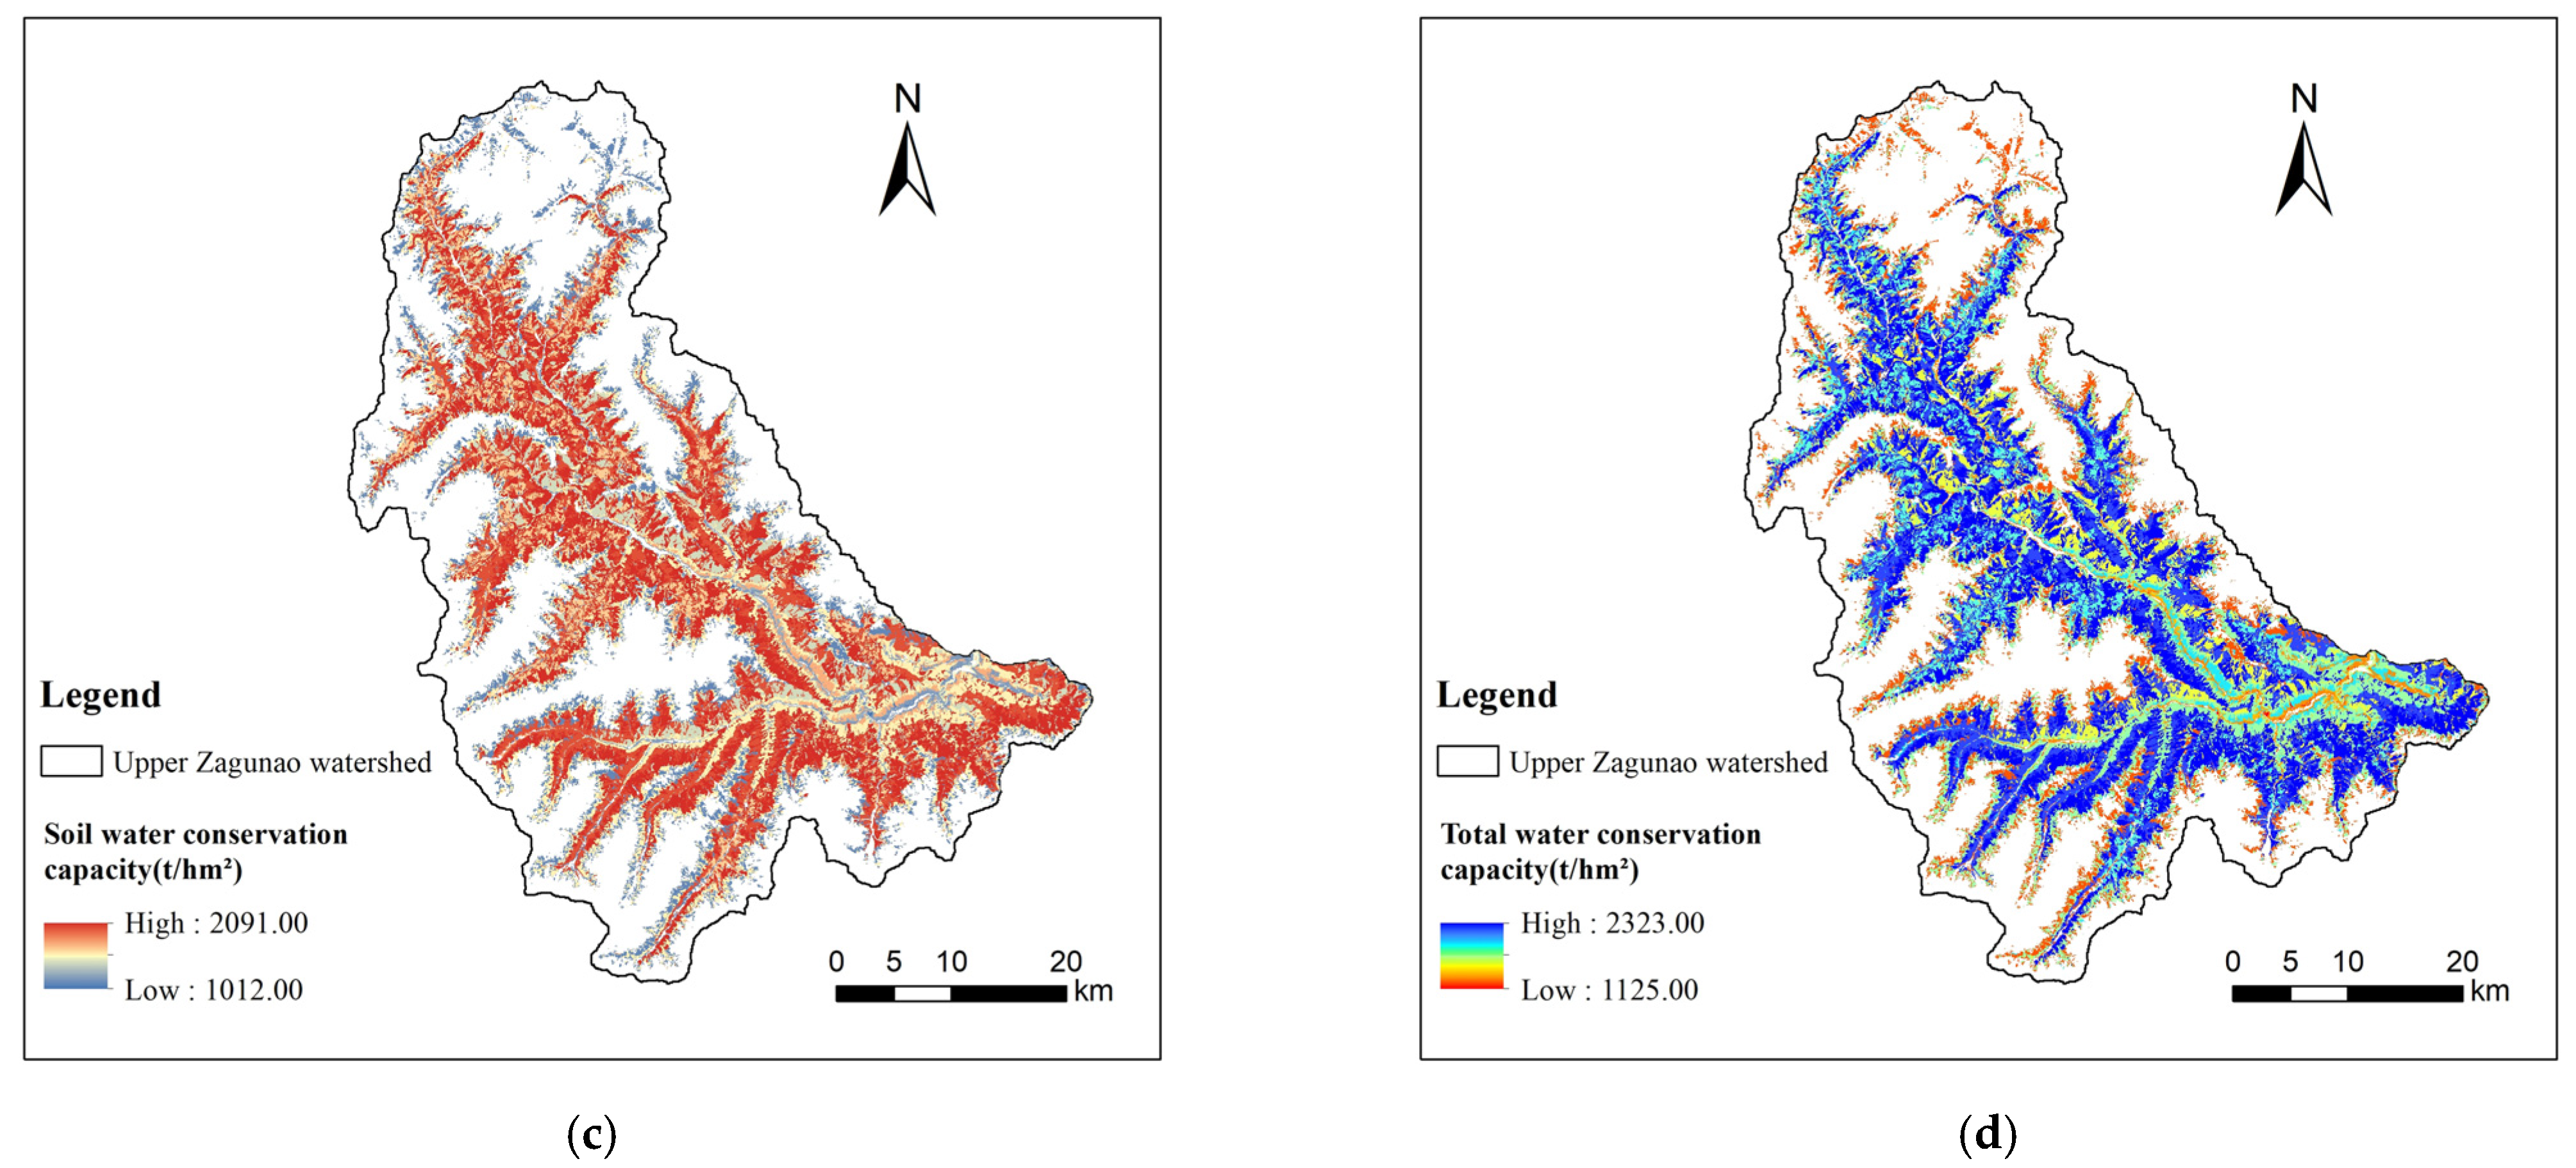
4.3.2. Effects of Forest Restoration Measures on Water Conservation Capacity
5. Limitations
6. Conclusions
Author Contributions
Funding
Institutional Review Board Statement
Informed Consent Statement
Data Availability Statement
Acknowledgments
Conflicts of Interest
Appendix A


References
- Valtera, M.; Schaetzl, R. Pit-mound microrelief in forest soils: Review of implications for water retention and hydrologic modelling. For. Ecol. Manag. 2017, 393, 41–51. [Google Scholar] [CrossRef]
- Oishi, Y. Evaluation of the Water-Storage Capacity of Bryophytes along an Altitudinal Gradient from Temperate Forests to the Alpine Zone. Forests 2018, 9, 433. [Google Scholar] [CrossRef] [Green Version]
- Lee, Y.-S.; Lee, S.; Jung, H.-S. Mapping Forest Vertical Structure in Gong-ju, Korea Using Sentinel-2 Satellite Images and Artificial Neural Networks. Appl. Sci. 2020, 10, 1666. [Google Scholar] [CrossRef] [Green Version]
- Seidl, R.; Spies, T.; Peterson, D.; Stephens, S.; Hicke, J. Searching for resilience: Addressing the impacts of changing disturbance regimes on forest ecosystem services. J. Appl. Ecol. 2016, 53, 120–129. [Google Scholar] [CrossRef] [Green Version]
- Hoelting, L.; Beckmann, M.; Volk, M.; Cord, A. Multifunctionality assessments—More than assessing multiple ecosystem functions and services? A quantitative literature review—ScienceDirect. Ecol. Indic. 2019, 103, 226–235. [Google Scholar] [CrossRef]
- Ferraz, S.; Lima, W.; Rodrigues, C. Managing forest plantation landscapes for water conservation. For. Ecol. Manag. 2013, 301, 58–66. [Google Scholar] [CrossRef]
- Mansourian, S.; Stanturf, J.; Derkyi, M.; Engel, V. Forest Landscape Restoration: Increasing the positive impacts of forest restoration or simply the area under tree cover? Restor. Ecol. 2017, 25, 178–183. [Google Scholar] [CrossRef]
- Chen, X.; He, Y.; Zhang, D.; Zeng, W. Review on the Eco-Efficiency Evaluation of Forest Ecosystem Restoration and Reconstruction in China. Iss. For. Econ. 2008, 28, 192–196. [Google Scholar]
- Yao, X. Quantitative analysis on water retaining benefit of forest for erosion control in Jinzhai county of Anhui province. Soil Water Conserv. China 1996, 4, 23–25, 59–60. [Google Scholar]
- Gong, Y.; Chen, L.; Zhang, J.; Luo, C. Effects of vegetation restoration on channel runoff in the low-mountain and rainstorm area of the upper Jialing River. J. Soil Water Conserv. 2009, 23, 1–5. [Google Scholar]
- Celentano, D.; Rouss, G.; Engel, V.; Zelarayan, M.; Oliveira, E.; Araujo, A.; Moura, E. Degradation of riparian forest affects soil properties and ecosystem services provision in eastern Amazon of Brazil. Land Degrad. Dev. 2017, 28, 482–493. [Google Scholar]
- Sang, W.; Ma, K.; Chen, L.; Zheng, Y. A brief review on forest dynamics models. Chin. Bull. Bot. 1999, 16, 193–200. [Google Scholar]
- Yu, X.; Zhou, B.; Lv, X.; Yang, Z. Evaluation of water conservation function in mountain forest areas of Beijing based on invest model. Sci. Silv. Sin. 2012, 48, 1–5. [Google Scholar]
- Sitch, S.; Prentice, I.; Arneth, A.; Bondeau, A.; Cramer, W.; Kaplan, J.; Levis, S.; Lucht, W.; Sykes, M.; Thonicke, K.; et al. Evaluation of ecosystem dynamics, plant geography and terrestrial carbon cycling in the LPJ dynamic global vegetation model. Glob. Chang. Biol. 2010, 9, 161–185. [Google Scholar] [CrossRef]
- Dai, E.; Wu, Z.; Wang, X.; Fu, H.; Xi, W.; Pan, T. Progress and prospect of research on forest landscape model. J. Geogr. Sci. 2014, 25, 113–128. [Google Scholar] [CrossRef]
- Wang, Y.; Zhuang, D.; Xu, X.; Jiang, D. Design of macro-ecological environment remote sensing monitoring system and the key technologies. Geo-Inf. Sci. 2011, 13, 672–678. [Google Scholar]
- Baskent, E.; Terzioglu, S.; Baskaya, S. Developing and Implementing Multiple-Use Forest Management Planning in Turkey. Environ. Manag. 2008, 42, 37–48. [Google Scholar] [CrossRef]
- Erik, N. A spatial decision support system for long-term forest management planning by means of linear programming and a geographical information system. Scand. J. For. Res. 1997, 12, 77–88. [Google Scholar]
- Liu, Y.; Feng, Z. Research and implementation of forest landscape four-dimensional visual system based on ComGIS. J. Beijing For. Univ. 2005, 4, 36–39. [Google Scholar]
- McVicar, T.; Li, L.; Van Niel, T.; Zhang, L.; Li, R.; Yang, Q.; Zhang, X.; Mu, X.; Wen, Z.; Liu, W.; et al. Developing a decision support tool for China’s re-vegetation program: Simulating regional impacts of afforestation on average annual streamflow in the Loess Plateau. For. Ecol. Manag. 2008, 251, 65–81. [Google Scholar]
- Spiridon, K.; Constantina, I.; Nikos, A.; Alexander, B.; Michael, K. Design of forest management planning DSS for wildfire risk reduction. Ecol. Inf. 2008, 3, 122–133. [Google Scholar]
- Li, S. Research and Development of the Water Conservation Estimation System Based on RS and GIS in the Southern Slope of Qilian Mountains; Qinghai Normal University: Xining, China, 2015. [Google Scholar]
- Wei, X.; Zhang, M. Research Methods for Assessing the Impacts of Forest Disturbance on Hydrology at Large-scale Watersheds. In Landscape Ecology in Forest Management and Conservation: Challenges and Solutions for Global Change; Li, C., Lafortezza, R., Chen, J., Eds.; Springer: Berlin/Heidelberg, Germany, 2011; pp. 119–147. [Google Scholar]
- Zhang, M.; Wei, X.; Sun, P.; Liu, S. The effect of forest harvesting and climatic variability on runoff in a large watershed: The case study in the Upper Minjiang River of Yangtze River basin. J. Hydrol. 2012, 464, 1–11. [Google Scholar] [CrossRef]
- Lin, Y.; Wei, X. The impact of large-scale forest harvesting on hydrology in the Willow watershed of Central British Columbia. J. Hydrol. 2008, 359, 141–149. [Google Scholar] [CrossRef]
- Meng, Z. Evaluation and System Realization for Regional Forest Change and Water Conservation Function; University of Electronic Science and Technology of China: Chengdu, China, 2019. [Google Scholar]
- Li, J.; Shao, Q.; Liu, J. Forest conservation estimation based on the integrated storage capacity method—A case study of Xingguo county in Jiangxi. J. Northw. For. Univ. 2012, 27, 83–87. [Google Scholar]
- Feng, Q.; Liu, X.; Lu, C.; Wu, X.; Pan, H.; Ma, B.; Liu, S. Effects of different forest management regimes on woodland hydrological effects of natural secondary forests in a sub-alpine region of western Sichuan, China. Acta Ecol. Sin. 2016, 36, 5432–5439. [Google Scholar]
- Liu, Y. Research on the Changes of Aboveground Biomass and NPP in Recovery Process for Main Forest Types in Subalpine Region of Western Sichuan; Chinese Academy of Forestry: Beijing, China, 2010. [Google Scholar]
- He, L.; Qiang, W.; Zhang, Y.; Liu, Y.; Liu, B.; Pang, X. Effect of secondary succession on soil water holding capacity of subalpine coniferous forest in western Sichuan, China. Chin. J. Appl. Environ. Biol. 2021, 27, 639–647. [Google Scholar]
- Zhang, Y.; Liu, S.; Luo, C.; Zhang, G.; Ma, J. Water holding capacity of ground covers and soils in different land uses and land covers in subalpine region of Western Sichuan, China. Acta Ecol. Sin. 2009, 29, 627–635. [Google Scholar]
- Xu, Z.; Yang, X.; Chen, J.; Feng, Q.; Li, D.; Li, X.; Cai, L.; Liu, X.; Zhang, L. Effect of thinning on the water conservation capacity of Picea asperata of different ages. Chin. J. Appl. Environ. Biol. 2021, 27, 657–666. [Google Scholar]
- Pang, X.; Bao, W.; Zhang, Y.; Leng, L.; Yuan, Z. Geographical comparison of soil physical properties under Cupressus chengiana forests. Chin. J. Appl. Environ. Biol. 2004, 10, 596–601. [Google Scholar]
- He, S.; Gong, Y.; Zheng, Z. Water conservation capacity of litters in different vegetation restoration patterns in the upper reaches of Minjiang River. Resour. Environ. Yangtze Basin. 2020, 29, 1986–1994. [Google Scholar]
- He, L.; Pang, X. Soil water holding capacity of four typical shrub islands and its influencing factors in subalpine western Sichuan. Chin. J. Appl. Environ. Biol. 2021, 27, 632–638. [Google Scholar]
- Liu, Y.; Wen, Y.; Zhang, Y.; Tan, B.; You, C.; Zhang, L.; Yang, W.; Xu, Z.; Li, H. Soil water-holding dynamic characteristics of six colored-leaf forest communities in the subalpine forest of western Sichuan. Chin. J. Appl. Environ. Biol. 2021, 27, 648–656. [Google Scholar]
- Zhu, W.; Sheng, Z.; Shu, S.; Wang, W.; Li, X. Comprehensive evaluation of ecological function restoration of the natural secondary forests in a sub-alpine region of western Sichuan. Chin. J. Appl. Environ. Biol. 2021, 27, 694–704. [Google Scholar]
- Deng, L. Study on the Scale Transformation of Water Conservation Function of Forest Ecosystem in the Upper Reaches of Minjiang River; University of Electronic Science and Technology of China: Chengdu, China, 2020. [Google Scholar]


| Data | Products | Spatial Resolution | Temporal Resolution | Format | Sources |
|---|---|---|---|---|---|
| Forest map | - | - | yearly | Vector | Western Sichuan Forestry Bureau |
| Land cover | China Cover 2010 | 30 m | yearly | Raster | http://www.geodata.cn/, accessed on 27 August 2021 |
| Precipitation | Daily precipitation | 500 m | daily | Raster | http://data.cma.cn/(ANUSPLIN interpolation, accessed on 27 August 2021) |
| Soil data | HSWD | 1:1,000,000 | yearly | Raster | http://westdc.westgis.ac.cn/, accessed on 27 August 2021) |
| Topography | ASTER DEM | 30 m | yearly | Raster | http://www.gscloud.cn/, accessed on 27 August 2021 |
| Forest Types | Restoration Measures | Dominant Species |
|---|---|---|
| Natural coniferous forest (NCF) | Natural recovery | Abies fabri |
| Planted coniferous forest (PCF) | Thinning out, tending, density adjustment | Picea asperata, cupressus chengiana |
| Natural mixed forest (NMF) | Thinning out, pruning | Abies fabri, betula platyphylla |
| Planted mixed forest (PMF) | Tending (shrub cutting and weeding) | Picea asperata, betula platyphylla |
| Natural evergreen broad-leaved forest (NEBF) | Natural recovery | Quercus semicarpifolia |
| Natural deciduous broad-leaved forest (NDBF) | Clearing, shrub cutting and weeding | Betula platyphylla |
| Alpine shrub (AS) | Clearing, replanting | Salix cupularis |
| Dry valley shrub (DVS) | Clearing | -- |
| Shrub | Natural recovery | -- |
| Landslide area (LA) | Seeding | -- |
| Forest Type | Canopy Water Conservation Capacity (t/hm2) | Litter Water Conservation Capacity (t/hm2) | Soil Water Conservation Capacity (t/hm2) | Total Water Conservation Capacity (t/hm2) |
|---|---|---|---|---|
| NCF | 32.22 | 225.00 | 2315.00 | 2572.22 |
| Forest Type | Age Group | Proportion (in 2010) | Proportion (Natural Recovery in 2030) | Proportion (Artificial Recovery in 2030) |
|---|---|---|---|---|
| Natural evergreen broad-leaved forest (NEBF) | Young | 1.10% | 0 | 0 |
| Middle-aged | 0.17% | 0 | 0 | |
| Near-mature | 0.37% | 1.10% | 1.10% | |
| Mature | 0.43% | 0.54% | 0.54% | |
| Over-mature | 1.70% | 2.13% | 2.13% | |
| Natural coniferous forest (NCF) | Young | 1.07% | 1.07% | 1.07% |
| Middle-aged | 0.51% | 0 | 0 | |
| Near-mature | 0.24% | 0.51% | 0.51% | |
| Mature | 0.04% | 0.24% | 0.24% | |
| Over-mature | 3.09% | 3.13% | 3.13% | |
| Natural deciduous broad-leaved forest (NDBF) | Young | 0.86% | 0 | 0 |
| Near-mature | 0.05% | 0.86% | 0.86% | |
| Mature | 0.74% | 0.05% | 0.05% | |
| Over-mature | 0.01% | 0.75% | 0.75% | |
| Natural mixed forest (NMF) | Young | 8.08% | 0 | 0 |
| Middle-aged | 0.31% | 0 | 0 | |
| Near-mature | 1.85% | 8.08% | 8.08% | |
| Mature | 1.99% | 2.16% | 2.16% | |
| Over-mature | 8.02% | 10.02% | 10.02% | |
| Planted coniferous forest (PCF) | Young | 1.84% | 0 | 0 |
| Middle-aged | 3.88% | 1.84% | 10.87% | |
| Near-mature | 0.04% | 0.09% | 0.09% | |
| Mature | 0 | 3.84% | 3.84% | |
| Planted mixed forest (PMF) | Middle-aged | 0.28% | 0 | 0 |
| Near-mature | 0.28% | 0 | 0 | |
| Mature | 3.95% | 0.56% | 0.56% | |
| Over-mature | 0.06% | 4.01% | 4.01% | |
| Shrub and broad-leaved forest (SBF) | -- | 0 | 0.06% | 0 |
| Planted deciduous broad-leaved forest (PDBF) | Young | 0 | 0 | 0.06% |
| Non-forest | -- | 59.04% | 58.98% | 49.95% |
| Restoration Scenario | Years | Canopy Water Conservation Capacity | Litter Water Conservation Capacity | Soil Water Conservation Capacity | Total Water Conservation Capacity |
|---|---|---|---|---|---|
| Natural | 2010 | 19.80 | 138.29 | 1423.13 | 1580.76 |
| 2015 | 21.48 | 149.97 | 1542.87 | 1714.27 | |
| 2020 | 23.18 | 161.86 | 1665.34 | 1850.26 | |
| 2025 | 24.43 | 170.57 | 1755.09 | 1949.84 | |
| 2030 | 25.23 | 176.22 | 1812.91 | 2014.34 | |
| Artificial | 2010 | 19.80 | 138.29 | 1423.13 | 1580.76 |
| 2015 | 22.46 | 156.88 | 1614.02 | 1793.30 | |
| 2020 | 24.38 | 170.27 | 1751.77 | 1946.44 | |
| 2025 | 25.65 | 179.14 | 1843.18 | 2047.89 | |
| 2030 | 26.61 | 185.83 | 1911.91 | 2124.18 |
Publisher’s Note: MDPI stays neutral with regard to jurisdictional claims in published maps and institutional affiliations. |
© 2021 by the authors. Licensee MDPI, Basel, Switzerland. This article is an open access article distributed under the terms and conditions of the Creative Commons Attribution (CC BY) license (https://creativecommons.org/licenses/by/4.0/).
Share and Cite
Yu, E.; Zhang, M.; Xu, Y.; Zhang, S.; Meng, Z.; Hou, Y. The Development and Application of a GIS-Based Tool to Assess Forest Landscape Restoration Effects on Water Conservation Capacity. Forests 2021, 12, 1291. https://doi.org/10.3390/f12091291
Yu E, Zhang M, Xu Y, Zhang S, Meng Z, Hou Y. The Development and Application of a GIS-Based Tool to Assess Forest Landscape Restoration Effects on Water Conservation Capacity. Forests. 2021; 12(9):1291. https://doi.org/10.3390/f12091291
Chicago/Turabian StyleYu, Enxu, Mingfang Zhang, Yali Xu, Sheng Zhang, Zuozhu Meng, and Yiping Hou. 2021. "The Development and Application of a GIS-Based Tool to Assess Forest Landscape Restoration Effects on Water Conservation Capacity" Forests 12, no. 9: 1291. https://doi.org/10.3390/f12091291