Article

Nitrogen and Phosphorus Distribution and Relationship in Soils and Plants under Different Aged Chinese Fir Plantation

1
Key Laboratory of Southwest China Wildlife Resources Conservation, Ministry of Education (China West Normal University), Nanchong 637009, China
2
State Key Laboratory of Tree Genetics and Breeding, Research Institute of Forestry, Chinese Academy of Forestry, Beijing 100091, China
*
Authors to whom correspondence should be addressed.
Forests 2021, 12(9), 1271; https://doi.org/10.3390/f12091271
Submission received: 16 August 2021 / Revised: 15 September 2021 / Accepted: 15 September 2021 / Published: 17 September 2021
(This article belongs to the Special Issue Forest Soil and Water Biogeochemistry)

Abstract

:
As essential nutrients for plant growth and development, the balance of nitrogen (N) and phosphorus (P) between soils and plants is a key component to ecosystem stability. In this study, we examined the distribution of nutrients in the soils and different organs of Chinese fir (Cunninghamia lanceolata) in Hunan Province, southern China. Additionally, we investigated the nutrient concentrations in soil layers (0–80 cm depth) and in plant organs, and the total biomass of 10-, 20-, and 30-year-old plantations. The results suggested that the nutrients in the soil were aggregated in the surface layer. The highest and lowest values of N concentrations in 0–80 cm soil layers and P concentrations in 0–40 cm soil layers were both in 30-year-old plantations and 20-year-old plantations, respectively. Nitrogen in the organs of Chinese fir in all plantations and P concentrations in the organs of 20- and 30-year-old trees decreased in the following order: leaves, fine roots, coarse roots, and stems. Total biomass (N and P pools of four organs) increased consistently with stand age increase, and N and P pools were the highest in leaves and stems, respectively. There were significant, positive correlations between N and P in the soil (0–80 cm), and organs, respectively, and also between N concentrations of fine roots and that of 0–10 and 10–20 cm soil, respectively. In Chinese fir plantations, concentrations of nutrients in specific tree organs and the soil were correlated positively, which can only partially explain the balance of nutrients within the plant–soil ecosystem. This study suggested that incorrect harvesting patterns may effectively deprive the forest ecosystem of valuable nutrients that would ordinarily have been returned to the soil.

1. Introduction

Nutrients are essential for plant growth [1] such that a shortage can significantly limit plant growth and ecosystem productivity. At the individual plant level, nutrients are absorbed in inorganic form by roots through a series of physiological and biochemical reactions (e.g., assimilation, transportation, aging, recycling, remobilization) [2,3], and are used for building the plant body and driving metabolic processes [4]. At the forest ecosystem level, the plants absorb nutrients from the soil and transform them into important compounds (e.g., protein, nucleic acids, hormones) used for growth and development. Some compounds are retained in vegetation as biomass, while others are returned to the soil as leaf (including branches) and root litter where they further decompose and are converted to nutrients in the soil, which are absorbed by other vegetation [3,5]. The recycling of nutrients not only in individual plants but also in forest ecosystems ensures the balance of nutrients in the ecosystem. For example, a former study suggested overstory trees and understory plants have different nutrient acquisition patterns and nutrient-use efficiencies, but there were significant correlations between the concentrations of carbon (C), nitrogen (N), and phosphorus (P) in soils and plants in the different aged Robinia pseudoacacia forests on the Loess Plateau, China [6].
Soil is the main source of plant nutrients [3], especially N and P; however, soil and plants play different roles in the complex recycling of N and P in forest ecosystems. An optimal balance of N and P between the soil and plants is a key component to sustaining the stability of soil–plant systems. The variation in plant organs’ (leaves, roots, etc.) N and P concentrations is related to function, rates of growth, turnover, and plant life-history strategies of each organ [7]. Specifically, the concentrations of N and P in actively growing parts of the plant are higher than those in structural parts [8,9,10,11,12,13].
As an important native afforestation species widely planted in southern China, Chinese fir (Cunninghamia lanceolata) is famous as a fast-growing species of excellent timber quality and high timber yield with multiple uses, and has a long planting history of over 1000 years [8,10,14,15]. Chinese fir usually decreases soil fertility and deteriorates the forest environment, reducing overall timber productivity [16] as its lifecycle of fast-growth and clear-cutting after maturation removes essential nutrients from the forest ecosystem [10]. For example, the concentration of soil nutrients (N, P, K, Ca, and Mg) was decreased with plantation age in young, middle-aged, and mature plantations of Chinese fir in Youxi, Fujian Province, southern China [16]. Another study suggested that the planting of Chinese fir could reduce the soil fertility compared with the planting of pure and mixed Chinese fir [17]. Similar results were found in the plantation of a secondary forest and a Chinese fir at Huitong, Hunan Province, China [18]. Researchers have studied nutrient distributions in different organs [8,10] and soil layers [10] in different aged Chinese fir plantations. Although numerous studies have quantified and compared the distribution of nutrients in soil and firs, the linkage between soil and fir organs’ nutrients has seldom been documented. In the current study, we hypothesized that concentrations of N and P in Chinese fir and the associated soil are strictly related, and examined the nutrient distribution in soil and fir organs (fine roots, coarse roots, stems, and leaves) in three ages of Chinese fir plantation. Our study aimed to (i) analyze the trend of nutrients in the soil and firs with the stand ages, and (ii) assess the distribution and relationship of the nutrients in the soil and Chinese fir organs.

2. Materials and Methods

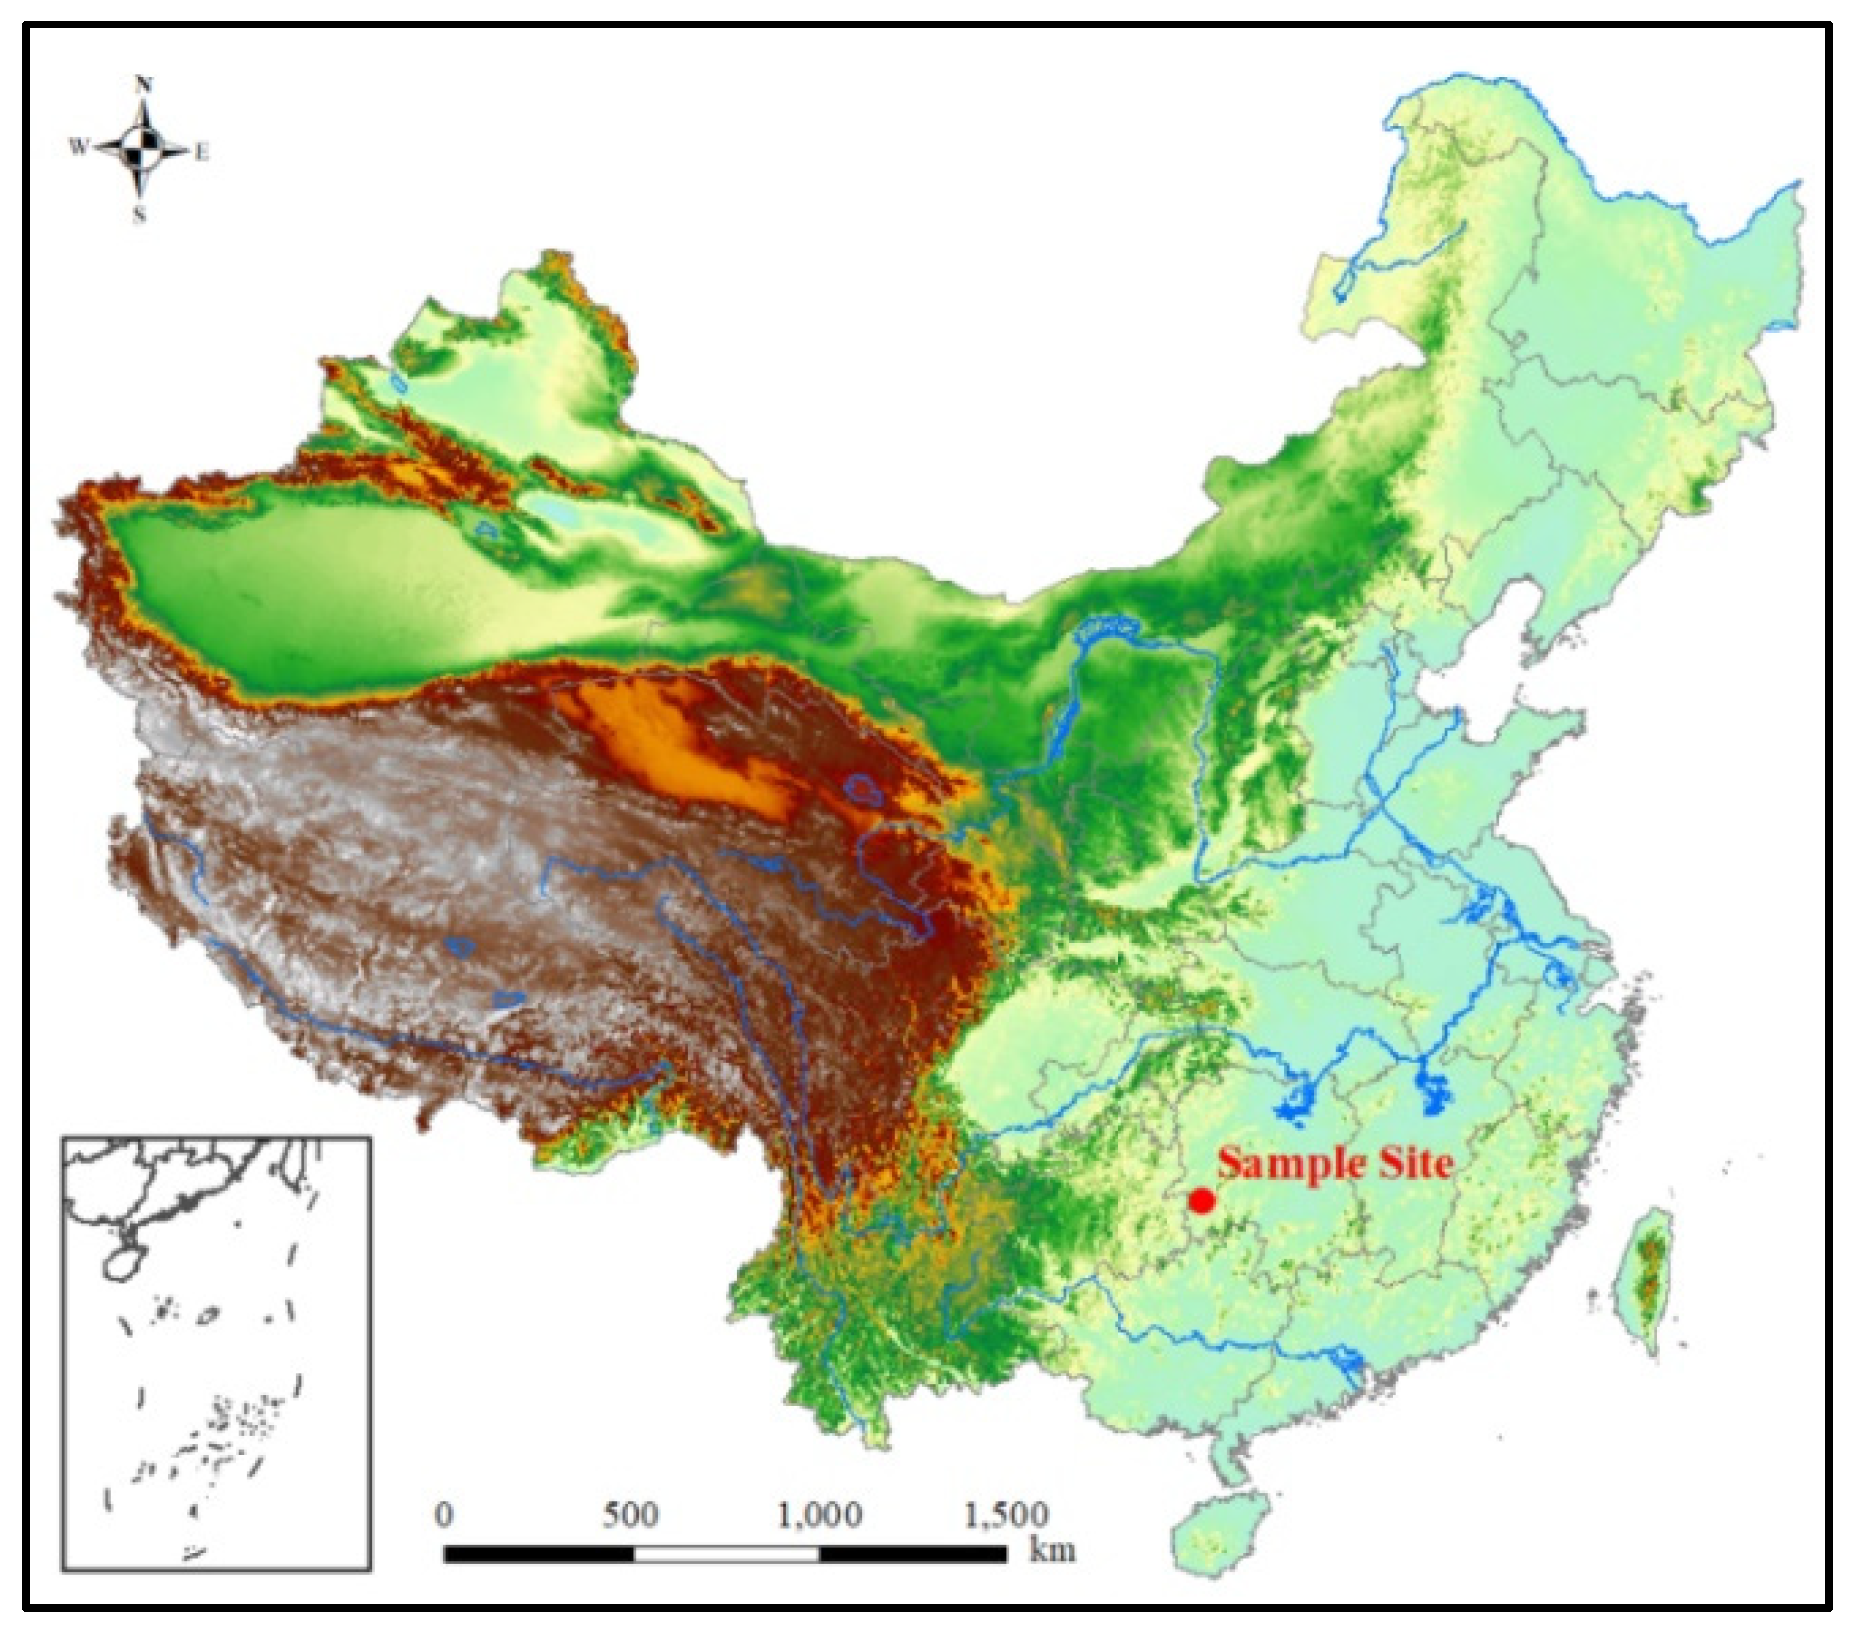
2.1. Study Area and Sampling

The plantations studied were at Moshao Village, Huitong County (26°46′–26°59′ N, 109°48′–109°58′ E), in Hunan Province, southern China (Figure 1). It has a typical humid subtropical climate, and the mean annual precipitation and temperature is 1100–1400 mm, (approximately 67% of which occurs between April and August) and 16.7 °C, respectively. There are over 300 frost-free days (data from meteorological station, located approximately 3 km from the field station). After controlled burning, the stands in this study were all restored with soil preparation (a 40 cm in length × 40 cm in width × 30 cm in height pit was dug along the contour line for planting). The original shrubs and herbaceous plants of stands before the forests were planted were similar, such as Smilax china, Maesa japonica, Ilex purpurea, Cyclosorus parasiticus, and Woodwardia japonica. The soil in three stands was oxisol. which were all developed from grayish green shale according to US Taxonomy [18]. After the survey of forest soils, we found the characteristic of the soil’s vertical distribution, textures, and mineral composition of all stands were almost identical. Consequently, the forest’s growth could be the main reason for the differences in the stands’ soil [18].
In April 2013, we identified the 10-, 20-, and 30-year-old Chinese fir plantations using an increment borer and history of planting records. We drilled more than five whole wood cores to calculate the mean age of the trees [19]. There were only a few understory plants such as Maesa japonica, Stenoloma chusanum, Smilax china, Woodwardia japonica, especially in 20- and 30-year-old plots. In each plantation, we randomly selected three sample plots (20 m × 20 m) to investigate the height and diameter at breast height (DBH) of each tree in the plot (Table S1 for details). In each plot, three soil samples were collected evenly across the diagonal using a soil auger with a diameter of 4.5 cm. Soil columns at depths of 0–10, 10–20, 20–40, 40–60, and 60–80 cm were collected separately and transferred to the laboratory to analyze soil nitrogen and phosphorus content (soil sample A). In the same design, we used a soil auger with diameter of 4.5 cm to sample the fine root (diameter less than 2 mm) by five-point sampling method [20], and three additional soil columns of 60 cm depth (divided into 0–20, 20–40, and 40–60 cm) were randomly sampled of each point (soil sample B).
After soil sampling, we selected three standard trees according to the results of tally stem analysis in each plot and manually excavated the whole root system to harvest the standard tree. In order to check the relationship between the coarse roots’ (d > 2 mm) diameter and biomass, we excavated at least one complete root system with the fine roots’ diameter as 2 mm [21]. Based on the relationship, we estimated the coarse root biomass that we can’t get from the soil. Then the whole coarse root biomass was calculated with biomass from excavated part and biomass from estimated part. Leaves, stems (including branches), and coarse roots were separated to measure the biomass of each section. Sub-samples of fine roots (collected while excavating the root systems), coarse roots (collected following [22]), stems (about 5 cm thick disk at breast height [23]), and leaves (about same weight leaves selected from the upper, middle, and lower parts of canopy in all four directions after the trees were dug down [23]) were collected and transported to the laboratory for further analysis.

2.2. Biomass Estimation of Chinese Fir

To determine the biomass of fine roots, B soil samples were sieved (d < 0.25 mm), soaked, and rinsed to separate the fine roots of Chinese fir using characteristics such as shape, color, and elasticity. Fresh samples of each soil layer were dried at 60 °C for about 24 h to determine the dry biomass of fine roots. Biomass of fine roots (kg ha−1) was calculated as dry biomass of fine roots of each soil core (g)/[π (d/2)2] × 10−5 cm2, where d is 4.5.
Approximately 15% of fresh weight of coarse roots, stems, and leaves was dried to constant weight at 60 °C to obtain the ratio of dry to fresh biomass of each organ. Then, dry weights of organs were estimated as fresh weight × [dry– fresh weight]. Subsequently, an allometric equation was specified for dry biomass and DBH of harvested trees (Table S2), and we used the density of trees and allometric equation in the sample plots to estimate biomass per hectare.

2.3. Analysis of Total Nitrogen and Phosphorous

Soil samples A were air-dried and ground to less than 0.25 mm after removing plant roots, gravel. We milled the dried samples of fine roots, coarse roots, stems, and leaves smaller than 0.25 mm. Total N in soil and Chinese fir was determined by the Kjeldahl method by Kjeldahl analyzer (Kjeltec™ 8400, FOSS, Hillerød, Denmark) [24]. Total P in soil and Chinese fir was measured colorimetrically after digestion with H2SO4 and HClO4 [24], and H2SO4 and H2O2 [25], respectively. N and P pools were calculated using biomass and N and P concentrations in each organ [24]. Total N and P content was calculated for soil and Chinese fir dry weight.

2.4. Statistical Analysis

We used STATGRAPHICS 3.0 (STN, St Louis, MO, USA) to perform all statistical tests. All of the data were tested for normality prior to statistical analysis before being analyzed by two-ways ANOVA with soil depth/age and organ/age of plantations for soil and Chinese fir, respectively. A simple regression analysis revealed relationships between nutrient concentrations in soil and organs, and between nutrient concentrations in the four organs. Significant differences between means were recognized when the p-value of the plantation age F test was less than 0.05. The data were all expressed as means ± SE (n = 3).

3. Results

3.1. Nitrogen and Phosphorus in Soil

Total N concentrations decreased with increasing soil depth (except in the 10–20 cm soil) in all Chinese fir plantations, and were at their lowest and the highest in the 20- and 30-year-old plots, respectively (Figure 2A). Nitrogen concentration (2.25 g kg−1) was highest in the 0–10 cm soil of the 30-year-old plantation (Figure 2A). Concentrations of N in 10- and 20-year-old Chinese fir plantations were significantly higher in the surface layer soil (0–10 and 10–20 cm) than in the other three soil layers (20–40, 40–60, and 60–80 cm) (Figure 2A). However, concentrations of N in 30-year-old plots were significantly higher in the 0–10, 10–20, and 20–40 cm soil layers than the other two soil layers (40–60 and 60–80 cm) (Figure 2A).
Variation in P concentrations between different soil layers of the three plantations was small (between 0.16 and 0.32 g kg−1) (Figure 2B) compared with N concentrations. Overall, P concentrations varied little with soil depth in 20-year-old Chinese firs (0.21 to 0.19 g kg−1); P concentrations in the 10- and 20-year-old plantations decreased with increasing soil depth in the 0–40 cm layers, and were essentially unchanged in the 40–80 cm layers. However, concentrations of P in the 30-year-old plantation decreased with increasing soil depth in the 0–60 cm layers, and the amount in the 60–80 cm layer was higher than in the 40–60 cm layer (Figure 2B). In the 0–10 cm layer, P concentrations were lowest (0.21 g kg−1) in 20-year-old plots and highest (0.32 g kg−1) in 10-year-old plots. In the 10–40 cm layers, P concentrations were lowest in the 20-year-old plots, and the amounts in the 10- and 30-year-old plots were the same (0.24 and 0.21 g kg−1 at 10–20 and 20–40 cm soil layers, respectively). In the 40–80 cm layers, P concentrations were lowest and highest in the 10-and 20-year-old plantations, respectively (Figure 2B).

3.2. Nitrogen and Phosphorus in Chinese Fir

In general, N concentrations varied greatly between different organs in trees of the same age (Figure 3A). Nitrogen concentrations decreased in the following order: leaves, fine roots, coarse roots, and stems (Figure 3A). The N of fine roots and leaves increased with the increasing age of the tree (Figure 3A). Nitrogen concentrations in coarse roots and stems were at their highest in 20-year-old Chinese fir (2.75 g kg−1 and 0.69 g kg−1, respectively) and at their lowest in the 10- (1.47 g kg−1) and 30-year-old (0.61 g kg−1) plantations, respectively (Figure 3A).
Variation trends of P concentrations in each organ in 20- and 30-year-old trees were quite similar to N concentrations, while P concentrations were highest in fine roots, followed by leaves, coarse roots, and stems in 10-year-old trees (Figure 3B). Concentrations of P in fine roots and leaves were highest in 10-year-old (1.12 g kg−1) and 30-year-old (1.05 g kg−1) plantations, respectively, and were both at their lowest in 20-year-old (0.84 g kg−1 and 0.87 g kg−1, respectively) trees. All of the above parameters initially decreased with plantation age (10–20 years old) and then increased with age (20–30 years old) (Figure 3B). Phosphorous concentrations in coarse roots (0.56 g kg−1, 0.38 g kg−1, and 0.26 g kg−1, respectively) and stems (0.24 g kg−1, 0.22 g kg−1, and 0.20 g kg−1, respectively) of Chinese fir decreased with increasing age (Figure 3B).

3.3. Biomass and Nutrient Pool

The biomass of each organ (fine roots, coarse roots, stems, and leaves) in different aged trees is shown in Table 1. The total biomass of the plantation and four organs increased consistently with increasing plantation age but varied greatly among the different organ types (Table 1). The biomass of fine roots and stems were the lowest and the highest percentage of standing biomass among the four organ types, respectively (Table 1). Results showed that the total standing biomass in each organ decreased in order of stems, coarse roots, leaves, and fine roots. Moreover, there were significant differences among different aged trees in the biomass of fine roots (p = 0.022), coarse roots (p < 0.001), leaves (p < 0.001), and total biomass (p < 0.001) (Table 1).
The N and P pools in the four organs and total standing biomass increased consistently with increasing plantation age (except the pool of P in fine roots), and were lowest in fine roots (Figure 4). The pool of N in leaves represented the highest percentage of the total N pool of the plantation (48.3%, 40.6%, and 42.9% in 10-, 20-, and 30-year-old trees, respectively) (Figure 4A), whereas the pool of P in stems represented the highest percentage of the total P pool of the plantation (44.8%, 50.3%, and 54.4% in 10-, 20-, and 30-year-old trees, respectively) (Figure 4B).

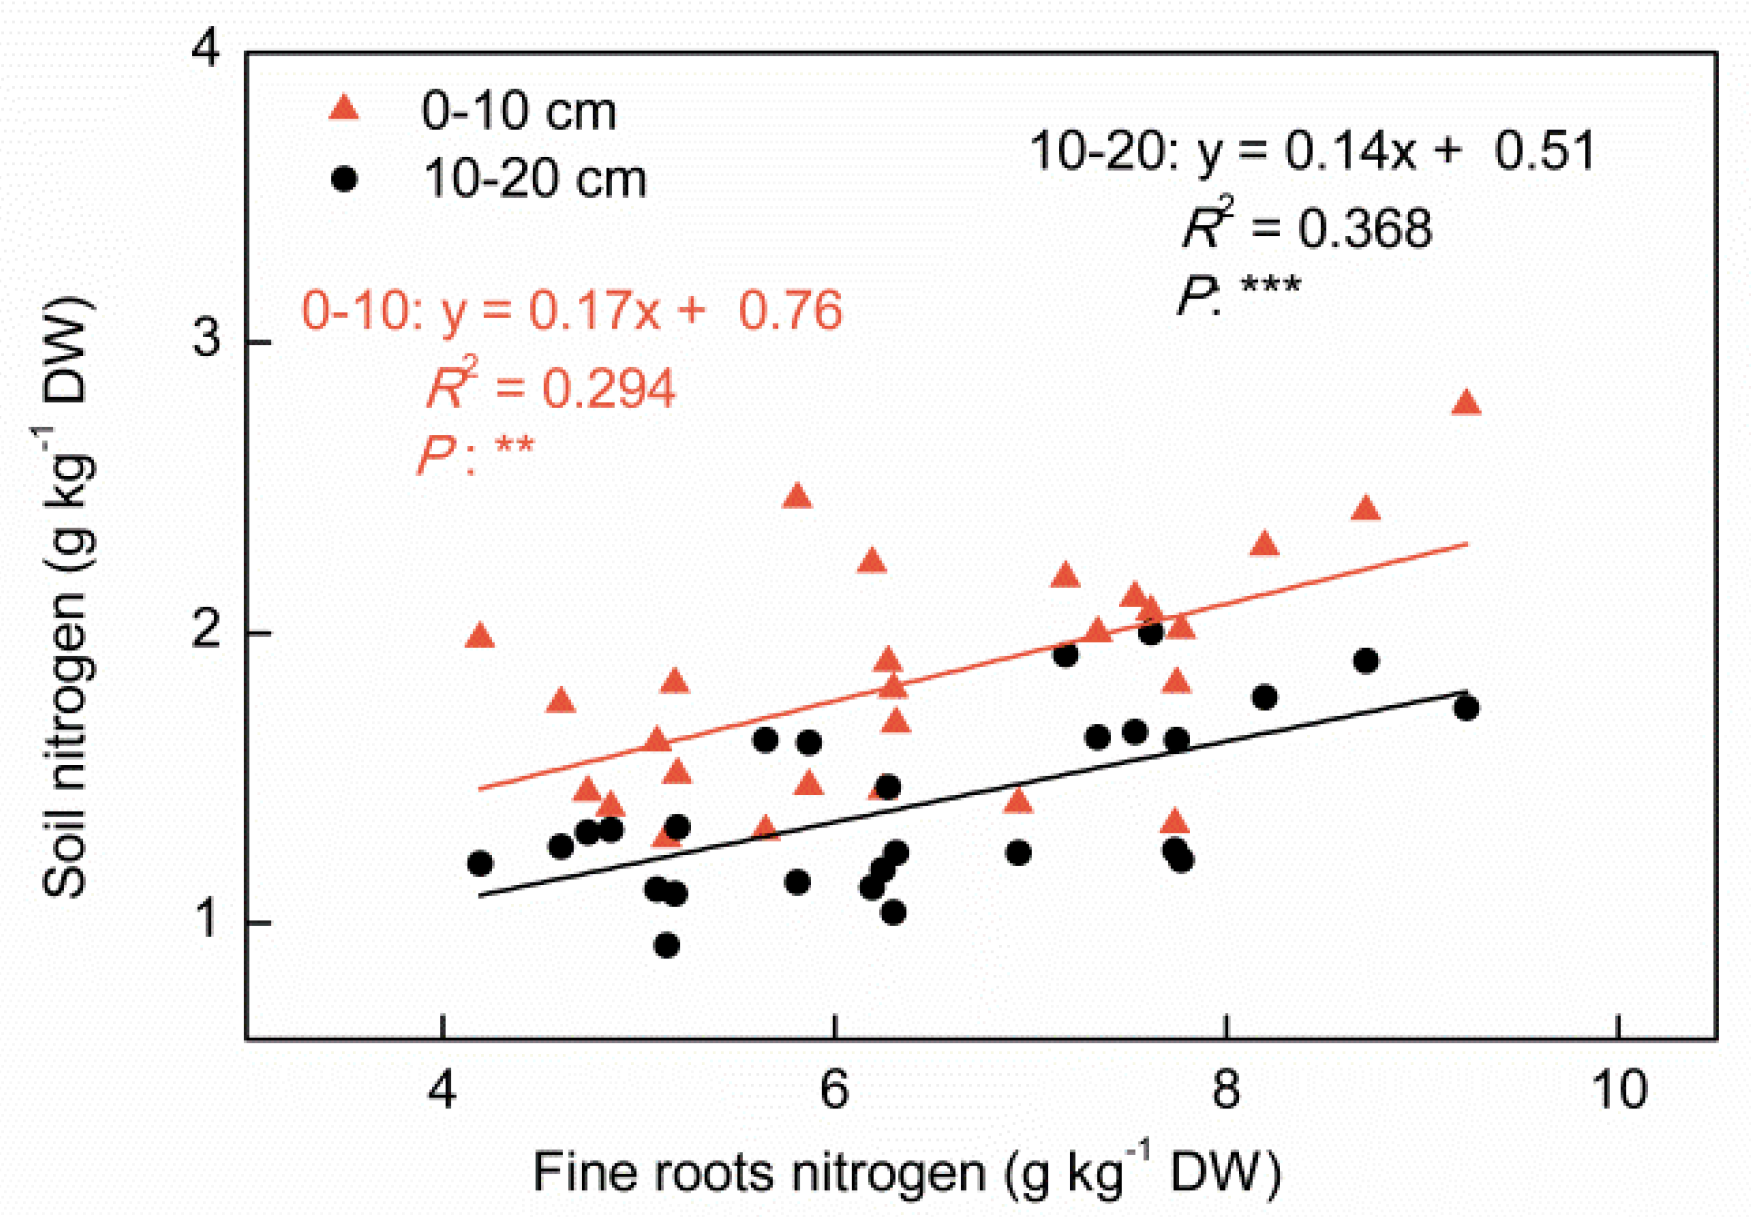
3.4. Correlation between Nutrients

Correlation analyses indicated that N and P concentrations in 0–80 cm soil layers were significantly, positively, linearly correlated (p < 0.001, R2 = 0.32, n = 135, Figure 5A). A significant, positive, linear correlation was also observed between N and P concentrations in whole trees (p < 0.001, R2 = 0.69, n = 108, Figure 5B). Analyses of N and P concentrations in the surface soil (0–10 and 10–20 cm) and organs (fine roots, coarse roots, stems, and leaves) revealed that N concentrations in fine roots were significantly, positively, linearly correlated with N concentrations in 0–10 and 10–20 cm soil (p = 0.002, R2 = 0.294, n = 27; p < 0.001, R2 = 0.368, n = 27, respectively. Figure 6, Table S3) and with P concentrations in the 10–20 cm soil (Table S3).

4. Discussion

4.1. Spatial and Temporal Variation in Soil N and P Content

Our results indicated that total N concentrations in the 0–80 cm soil (Figure 2A), and total P concentrations in the 0–40 cm soil (Figure 2B) of all plantations decreased with increasing soil depth. A similar pattern was reported in Caragana microphylla Lam. [26], Chinese fir (Cunninghamia lanceolata) [27,28], and black locust [29] of the change of soil organic matter was because of the decrease of litter and roots with the increase of soil depth [29]. Additionally, climatic factors, such as temperature and moisture, and organisms [30] are more beneficial to litter decomposition in the upper soil layer than in the deeper soil layers, which leads to N and P enrichment in the surface soil layer. Moreover, N and P in the deeper soil layers result mainly from leaching of surface soil layers and geologic N and P, whereas leaching of N and P decreases with increasing soil depth. As a result, total N and P were more noticeably concentrated in surface soils and decreased with increasing soil depth.
Although many studies have shown that soil nutrient concentrations decrease with plantation age [10,15], this was not observed in this study. Our data showed that N concentrations decreased during the 10–20-year period, and then increased during the 20-year to 30-year period (Figure 2). This might be explained by: (i) during the 10–20-year growth period, Chinese fir grew fast and absorbed large amounts of N, but the rate of litter decomposition was slow [10,15] so that nutrient-return rate in the plantations was slow [8,9,10], which caused lower N concentrations at 20 years than at 10 years, and/or (ii) during the 20–30-year growth period, the demand for N was low as the Chinese fir plantations matured, ca. 25 years old [10], and/or (iii) the amount of litter during the 20–30-year growth period was greater than that during the 10–20-year period, as the litter increased significantly with plantation age [9,15]. A significant, positive, linear correlation was observed between N and P concentrations in soil (0–80 cm) (Figure 5A). This was probably because litter decomposition (e.g., leaves, branches) influences both N and P input in the forest ecosystem [31,32,33]. The absorption of soil N and P by plants kept as stable ratio [34,35], which can partly explains why the N and P in soil were close coupling (Figure 5A).

4.2. Nitrogen and Phosphorous Concentrations in Different Organs and N–P Coupling

Several investigations have shown that the nutrient concentrations in actively growing parts (such as needles, fine roots) is usually higher than in the structural parts (e.g., stem) of trees [12,36,37,38]. A similar result was found in the current study of Chinese fir (Figure 3). The distribution differences in the nutrient (N and P) concentrations in organs (leaves, roots, etc.) are determined by the organ function, rates of organ growth, turnover, and plant life-history strategies [7]. Leaves are the sites of plant photosynthesis and respiration, and high N concentrations are beneficial for photosynthesis [39]. Fine roots are the key driver in nutrient and water acquisition from the soil [40] and are considered to be the most physiologically active parts of the root system [41], so that N and P contents are higher in leaves and fine roots (Figure 3). Nitrogen and P contents are higher in coarse roots than in stems (Figure 3). The functions of coarse roots include transporting nutrients and water, storing photosynthate, and supporting and anchoring the aboveground part [42]; stems transport nutrients, assimilates, and water between the canopy and the roots, and also store nutrients and assimilates [36]. This study suggested that N and P were mostly concentrated in the organs where they were most needed. Many studies have shown that nutrient concentrations in each organ decrease with plantation age [24,43,44], and that reduced organ nutrient concentration is a result of tree aging and an increase in the proportion of cell wall components (e.g., carbonated structures) [43]. Our results demonstrated that N and P concentrations in different organs varied with plantation age, which was also found in some former reports of Chinese fir [8] and other woody plants [24]. In the current study, the highest value of P concentration in 10-year-old trees was in the fine roots but not in leaves (Figure 2B), which mainly depended upon the highest P concentration in the soil of 10-year-old plots (0–40 cm) (Figure 2B).
At the individual plant level, we found a significantly, positive, linear correlation between the concentration of N and P in trees (Figure 5B). A similar pattern was reported in common reeds [13], and 1287 species from 152 seed plant families [7]. This study showed a tight coupling of N and P in Chinese fir, and this pattern of N and P may reflect the general constraints, or allocation rules, governing the partitioning of nutrients among the organs of plants [7,13]. This may be due to the functional coupling characteristics of biological N and P from cells to ecosystems [13,45].

4.3. Biomass Allocation and Distribution Patterns of Nutrient Pools

Total biomass and the biomass of the four organ types increased consistently with increasing plantation age, and stems had the highest proportion of biomass in all of the plantations (Table 1), which was also found in the previous studies of Chinese fir [8,9] and other species [12,38]. Because of the commercial value of plantations and the nutrient loss caused by timber clear-cutting, the stem biomass is critically important for the plantation system [9]. The similar proportion of stem in total biomass (from 70.6% to 73%) of aged trees (Table 1) suggested that clear-cutting seriously destroyed the nutrient material balance of plantation system. Moreover, the proportion of fine roots and leaves in total biomass were significantly decreased with increasing age (Table 1), which maybe the result of functional weakening for the actively growing parts. Nitrogen and P pools differed significantly between the three plantation ages, and increased significantly with plantation age, which was also found in previous studies of Chinese fir [8,9] and other species [12,38]. We found that the increase in nutrient (N and P) pools with increasing age was mainly due to the increment of biomass but not nutrient concentration. A previous study found that distribution patterns of nutrient (N and P) pools followed biomass allocation patterns [45]; however, this was not the case in this study (Table 1, Figure 4). Pools of N in leaves were the highest among the four organs in all ages of plantation (Figure 4A), mainly due to the highest concentrations of N in leaves (Figure 3A). Conversely, stems had the highest P pool of the four organs in all ages of plantation (Figure 4B), mainly due to producing the highest biomass (Table 1). Additionally, the plantation harvesting can gain a lot of commercial value, but the nutrient loss caused by timber clear-cutting cannot be ignored [8], so it is necessary to replenish the plantation properly.

4.4. Relationship between Surface Soil and Nutrient Concentrations

Plants and soil play different roles in the complex recycling of N and P in the forest ecosystem. Former studies suggested that nutrient element composition in both side and nutrient stoichiometric characteristics (N and P content, N:P, etc.) of major functional organs, such as leaves and fine roots, would be maintained by the exchange of nutrient elements in both plants and soil [7,24,46,47]. However, we detected positive effects only on N concentrations in fine roots and in 0–10 and 10–20 cm soil (Figure 6, Table S3). This might be explained by the greater sensitivity of fine roots to soil fertility, as they are the main organ that directly absorbs nutrients from the soil [38], and the main link between the plant and the soil [41]. Moreover, belowground nutrient storage in plants might buffer the ability of other organs to respond to soil fertility [13]. Our results suggest that the relation between major nutrients (i.e., N and P) in the soil and plant organs fluctuated, which is consistent with previous studies [24,46]. This was probably because of: (i) soil samples that only represented a single snapshot of the year, whereas annual nutrient budgets are more likely to reflect biomass production, and/or (ii) the plants growth and nutrient uptake may not only be influenced by the presence of nutrient’s availability but also restricted by other factors, such as temperature, pH, anoxia, microbial activity, or competition [48]. Additionally the imbalance of nutrients between the soil and Chinese fir also suggested commercial value increase in the plantation is not only dependent on the extra nutrients supply but also on the correct forestry management measures, such as stand density management.

5. Conclusions

Soil N and P content were noticeably aggregated in the surface soil layer. Nitrogen concentrations in 0–80 cm and P concentrations in the 0–40 cm first decreased with plantation age in the 10–20-year-old group, and then increased with plantation age in the 20–30-year-old group. Concentrations of N and P were higher in functional organs (i.e., leaves, fine roots) and lower in structural organs (i.e., stems, coarse roots), and were tightly coupled. A tight coupling existed between concentrations of N and P in the 0–80 cm soil and between all organs of the Chinese fir. A significantly, positive, linear correlation between N concentration in fine roots and 0–10 and 10–20 cm soil was detected. The results suggested that (i) soil nutrient concentrations do not decrease with plantation age, (ii) no strong coupling relationships existed between surface soil and nutrient concentrations at the whole plant level, and (iii) the ability of structural organs to respond to soil fertility was buffered by nutrient storage in the Chinese fir.

Supplementary Materials

The following are available online at https://www.mdpi.com/article/10.3390/f12091271/s1, Table S1: General characteristics of different aged Chinese fir plantations, Table S2: Biomass allometric equation of different aged Chinese fir plantations, Table S3: Correlations between the nutrients in soil (0–10 and 10–20 cm) and fine roots and leaves.

Author Contributions

Conceptualization, Z.Y. and Z.L.; methodology, Z.Y. and Z.L.; validation, Z.Y. and Z.L.; investigation, Z.Y.; resources, Z.Y.; writing—original draft preparation, Z.Y.; writing—review and editing, Z.Y. and Z.L.; project administration, Z.Y. All authors have read and agreed to the published version of the manuscript.

Funding

This work was supported by the State Key Basic Research Development Program (2012CB416902), the Specialized Research Fund for the Doctoral Program of Higher Education of China (20130204110012) and the Scientific Research Foundation of China West Normal University (18Q045).

Institutional Review Board Statement

Not applicable.

Informed Consent Statement

Not applicable.

Data Availability Statement

Data are contained within the article.

Acknowledgments

We thank Shuangfei Song, Xiuyong Zhang, Ke Huang, and many others for their help during field sampling, and also thank Yi Zhang (Northwest A&F University, China) for the valuable revision of the manuscript.

Conflicts of Interest

The authors declare no conflict of interest.

References

  1. Crous, K.Y.; Ósvaldsson, A.; Ellsworth, D.S. Is phosphorus limiting in a mature Eucalyptus woodland? Phosphorus fertilisation stimulates stem growth. Plant Soil 2015, 391, 293–305. [Google Scholar] [CrossRef]
  2. López-Arredondo, D.L.; Leyva-González, M.A.; González-Morales, S.I.; López-Bucio, J.; Herrera-Estrella, L. Phosphate nutrition: Improving low-phosphate tolerance in crops. Annu. Rev. Plant Biol. 2014, 65, 95–123. [Google Scholar] [CrossRef] [PubMed]
  3. Rennenberg, H.; Wildhagen, H.; Ehlting, B. Nitrogen nutrition of poplar trees. Plant Biol. 2010, 12, 275–291. [Google Scholar] [CrossRef]
  4. Yang, X.J.; Huang, Z.Y.; Zhang, K.L.; Cornelissen, J.H.C. C:N:P stoichiometry of Artemisia species and close relatives across Northern China: Unraveling effects of climate, soil and taxonomy. J. Ecol. 2015, 103, 1020–1031. [Google Scholar] [CrossRef]
  5. Shen, J.B.; Yuan, L.X.; Zhang, J.L.; Li, H.G.; Bai, Z.H.; Chen, X.P.; Zhang, W.F.; Zhang, F.S. Phosphorus dynamics: From soil to plant. Plant Physiol. 2011, 156, 997–1005. [Google Scholar] [CrossRef] [Green Version]
  6. Zhang, W.; Liu, W.C.; Xu, M.P.; Deng, J.; Han, X.H.; Yang, G.H.; Feng, Y.Z.; Ren, G.X. Response of forest growth to C:N:P stoichiometry in plants and soils during Robinia pseudoacacia afforestation on the Loess Plateau, China. Geoderma 2019, 337, 280–289. [Google Scholar] [CrossRef]
  7. Kerkhoff, A.J.; Fagan, W.F.; Elser, J.J.; Enquist, B.J. Phylogenetic and growth form variation in the scaling of nitrogen and phosphorus in the seed plants. Am. Nat. 2006, 168, 103–122. [Google Scholar] [CrossRef] [Green Version]
  8. Chen, H.J. Biomass and nutrient distribution in a Chinese-fir plantation chronosequence in southwest Hunan, China. For. Ecol. Manag. 1998, 105, 209–216. [Google Scholar] [CrossRef]
  9. Ma, X.Q.; Liu, C.J.; Ilvesniemi, H.; Carl, J.W.; Liu, A.Q. Biomass, litterfall and the nutrient fluxes in Chinese fir stands of different age in subtropical China. J. For. Res. 2002, 13, 165–170. [Google Scholar]
  10. Ma, X.Q.; Heal, K.V.; Liu, A.Q.; Jarvis, P.G. Nutrient cycling and distribution in different-aged plantations of Chinese fir in Southern China. For. Ecol. Manag. 2007, 243, 61–74. [Google Scholar] [CrossRef]
  11. Xue, L. Nutrient cycling in a Chinese-fir (Cunninghamia lanceolata) stand on a poor site in Yishan, Guangxi. For. Ecol. Manag. 1996, 89, 115–123. [Google Scholar] [CrossRef]
  12. Zhao, Q.; Liu, X.Y.; Zeng, D.H. Aboveground biomass and nutrient allocation in an age-sequence of Larix olgensis plantations. J. For. Res. 2011, 22, 71–76. [Google Scholar] [CrossRef]
  13. Li, L.; Zerbe, S.; Han, W.; Thevs, N.; Li, W.; He, P.; Schmitt, A.O.; Liu, Y.; Ji, C. Nitrogen and phosphorus stoichiometry of common reed (Phragmites australis) and its relationship to nutrient availability in northern China. Aquat. Bot. 2014, 112, 84–90. [Google Scholar] [CrossRef]
  14. Zhang, W.D.; Wang, X.F.; Wang, S.L. Fate of Chinese-fir litter during decomposition as a result of inorganic N additions. Appl. Soil Ecol. 2014, 74, 30–36. [Google Scholar] [CrossRef]
  15. Zhou, L.; Shalom, A.-D.D.; Wu, P.; Li, S.; Jia, Y.; Ma, X. Litterfall production and nutrient return in different-aged Chinese fir (Cunninghamia lanceolata) plantations in South China. J. For. Res. 2015, 26, 79–89. [Google Scholar] [CrossRef]
  16. Huang, Y.; Wang, S.L.; Feng, Z.W.; Ouyang, Z.Y.; Wang, X.; Feng, Z. Changes in soil quality due to introduction of broad-leaf trees into clear-felled Chinese fir forest in the mid-subtropics of China. Soil Use Manag. 2004, 20, 418–425. [Google Scholar] [CrossRef]
  17. Wang, Q.K.; Wang, S.L. Soil microbial properties and nutrients in pure and mixed Chinese fir plantations. J. For. Res. 2008, 19, 131–135. [Google Scholar] [CrossRef]
  18. Wang, Q.K.; Wang, S.L.; Yu, X.J. Decline of soil fertility during forest conversion of secondary forest to Chinese fir plantations in subtropical China. Land Degrad. Dev. 2011, 22, 444–452. [Google Scholar] [CrossRef]
  19. Wang, W.J.; Qiu, L.; Zu, Y.G.; Su, D.X.; An, J.; Wang, H.Y.; Zheng, G.Y.; Sun, W.; Chen, X.Q. Changes in soil organic carbon, nitrogen, pH and bulk density with the development of larch (Larix gmelinii) plantations in China. Glob. Chang. Biol. 2011, 17, 2657–2676. [Google Scholar]
  20. Tong, R.; Zhou, B.Z.; Jiang, L.N.; Ge, X.G.; Cao, Y.H. Spatial patterns of leaf carbon, nitrogen, and phosphorus stoichiometry and nutrient resorption in Chinese fir across subtropical China. Catena 2021, 201, 105221. [Google Scholar] [CrossRef]
  21. Kalliokoski, T.; Nygren, P.; Sievanen, R. Coarse root architecture of three boreal tree species growing in mixed stands. Silva Fenn. 2008, 42, 189–210. [Google Scholar] [CrossRef] [Green Version]
  22. Hellsten, S.; Helmisaari, H.S.; Melin, Y.; Skovsgaard, J.P.; Kaakinen, S.; Kukkola, M.; Saarsalmi, A.; Petersson, H.; Akselsson, C. Nutrient concentrations in stumps and coarse roots of Norway spruce, Scots pine and silver birch in Sweden, Finland and Denmark. For. Ecol. Manag. 2013, 290, 40–48. [Google Scholar] [CrossRef]
  23. Cao, Y.; Chen, Y.M. Coupling of plant and soil C:N:P stoichiometry in black locust (Robinia pseudoacacia) plantations on the Loess Plateau, China. Trees 2017, 31, 1559–1570. [Google Scholar] [CrossRef]
  24. Li, H.; Li, J.; He, Y.L.; Li, S.J.; Liang, Z.S.; Peng, C.H.; Polle, A.; Luo, Z.B. Changes in carbon, nutrients and stoichiometric relations under different soil depths, plant tissues and ages in black locust plantations. Acta Physiol. Plant. 2013, 35, 2951–2964. [Google Scholar] [CrossRef]
  25. Zhou, J.; Jiao, F.C.; Wu, Z.C.; Li, Y.Y.; Wang, X.M.; He, X.W.; Zhong, W.Q.; Wu, P. OsPHR2 is involved in phosphate-starvation signaling and excessive phosphate accumulation in shoots of plants. Plant Physiol. 2008, 146, 1673–1686. [Google Scholar] [CrossRef] [PubMed] [Green Version]
  26. Dong, X.W.; Zhang, X.K.; Bao, X.L.; Wang, J.K. Spatial distribution of soil nutrients after the establishment of sand-fixing shrubs on sand dune. Plant Soil Environ. 2009, 55, 288–294. [Google Scholar] [CrossRef] [Green Version]
  27. Liao, Y.C.; McCormack, M.L.; Fan, H.B.; Wang, H.M.; Wu, J.P.; Tu, J.; Liu, W.F.; Guo, D.L. Relation of fine root distribution to soil C in a Cunninghamia lanceolata plantation in subtropical China. Plant Soil 2014, 381, 225–234. [Google Scholar] [CrossRef]
  28. Luan, J.W.; Xiang, C.H.; Liu, S.R.; Luo, Z.S.; Gong, Y.B.; Zhu, X.L. Assessments of the impacts of Chinese fir plantation and natural regenerated forest on soil organic matter quality at Longmen mountain, Sichuan, China. Geoderma 2010, 156, 228–236. [Google Scholar] [CrossRef]
  29. Cao, Y.; Zhang, P.; Chen, Y.M. Soil C:N:P stoichiometry in plantations of N-fixing black locust and indigenous pine, and secondary oak forests in Northwest China. J. Soil. Sediment. 2018, 18, 1478–1489. [Google Scholar] [CrossRef]
  30. Houlton, B.Z.; Morford, S.L. A new synthesis for terrestrial nitrogen inputs. Soil 2014, 1, 497–540. [Google Scholar]
  31. Blanco, J.A.; Imbert, J.B.; Castillo, F.J. Nutrient return via litterfall in two contrasting Pinus sylvestris forests in the Pyrenees under different thinning intensities. For. Ecol. Manag. 2008, 256, 1840–1852. [Google Scholar] [CrossRef]
  32. Kavvadias, V.A.; Alifragis, D.; Tsiontsis, A.; Brofas, G.; Stamatelos, G. Litterfall, litter accumulation and litter decomposition rates in four forest ecosystems in northern Greece. For. Ecol. Manag. 2001, 144, 113–127. [Google Scholar] [CrossRef]
  33. Yang, Y.S.; Guo, J.F.; Chen, G.; Xie, J.S.; Gao, R.; Li, Z.; Jin, Z. Litter production, seasonal pattern and nutrient return in seven natural forests compared with a plantation in southern China. Forestry 2005, 78, 403–415. [Google Scholar] [CrossRef] [Green Version]
  34. Long, M.; Wu, H.H.; Smith, M.D.; Pierre La, K.J.; Lü, X.T.; Zhang, H.Y.; Han, X.G.; Yu, Q. Nitrogen deposition promotes phosphorus uptake of plants in a semi-arid temperate grassland. Plant Soil 2016, 408, 475–484. [Google Scholar] [CrossRef]
  35. Yu, Q.; Elser, J.J.; He, N.P.; Wu, H.H.; Chen, Q.S.; Zhang, G.M.; Han, X.G. Stoichiometric homeostasis of vascular plants in the Inner Mongolia grassland. Oecologia 2011, 166, 1–10. [Google Scholar] [CrossRef]
  36. Helmisaari, H.S.; Siltala, T. Variation in nutrient concentrations of Pinus sylvestris stems. Scand. J. For. Res. 1989, 4, 443–451. [Google Scholar] [CrossRef]
  37. Iivonen, S.; Kaakinen, S.; Jolkkonen, A.; Vapaavuori, E.; Linder, S. Influence of long-term nutrient optimization on biomass, carbon, and nitrogen acquisition and allocation in Norway spruce. Can. J. For. Res. 2006, 36, 1563–1571. [Google Scholar] [CrossRef]
  38. Liu, X.L.; Xu, H.Y.; Berninger, F.; Luukkanen, O.; Li, C.Y. Nutrient distribution in Picea likiangensis trees growing in a plantation in West Sichuan, Southwest China. Silva Fenn. 2004, 38, 235–242. [Google Scholar] [CrossRef] [Green Version]
  39. Reich, P.; Walters, M.; Tjoelker, M.; Vanderklein, D.; Buschena, C. Photosynthesis and respiration rates depend on leaf and root morphology and nitrogen concentration in nine boreal tree species differing in relative growth rate. Funct. Ecol. 1998, 12, 395–405. [Google Scholar] [CrossRef]
  40. Xiang, W.H.; Wu, W.; Tong, J.; Deng, X.W.; Tian, D.L.; Zhang, L.; Liu, C.; Peng, C.H. Differences in fine root traits between early and late-successional tree species in a Chinese subtropical forest. Forestry 2013, 86, 343–351. [Google Scholar] [CrossRef]
  41. Borja, I.; De Wit, H.A.; Steffenrem, A.; Majdi, H. Stand age and fine root biomass, distribution and morphology in a Norway spruce chronosequence in southeast Norway. Tree Physiol. 2008, 28, 773–784. [Google Scholar] [CrossRef]
  42. Guo, L.; Chen, J.; Cui, X.H.; Fan, B.H.; Lin, H. Application of ground penetrating radar for coarse root detection and quantification: A review. Plant Soil 2013, 362, 1–23. [Google Scholar] [CrossRef] [Green Version]
  43. Peri, P.L.; Gargaglione, V.; Pastur, G.M. Dynamics of above- and below-ground biomass and nutrient accumulation in an age sequence of Nothofagus antarctica forest of Southern Patagonia. For. Ecol. Manag. 2006, 233, 85–99. [Google Scholar] [CrossRef]
  44. Yang, Y.H.; Luo, Y.Q. Carbon: Nitrogen stoichiometry in forest ecosystems during stand development. Glob. Ecol. Biogeogr. 2011, 20, 354–361. [Google Scholar] [CrossRef]
  45. Yan, Z.B.; Kim, N.Y.; Han, W.X.; Guo, Y.L.; Han, T.S.; Du, E.Z.; Fang, J.Y. Effects of nitrogen and phosphorus supply on growth rate, leaf stoichiometry, and nutrient resorption of Arabidopsis thaliana. Plant Soil 2014, 388, 147–155. [Google Scholar] [CrossRef]
  46. Ladanai, S.; Ågren, G.I.; Olsson, B.A. Relationships between tree and soil properties in Picea abies and Pinus sylvestris forests in Sweden. Ecosystems 2010, 13, 302–316. [Google Scholar] [CrossRef] [Green Version]
  47. Xiao, L.; Liu, G.B.; Li, P.; Xue, S. Ecological stoichiometry of plant-soil-enzyme interactions drives secondary plant succession in the abandoned grasslands of Loess Plateau, China. Catena 2021, 202, 105302. [Google Scholar] [CrossRef]
  48. Gusewell, S.; Koerselman, W. Variation in nitrogen and phosphorus concentrations of wetland plants. Perspect. Plant Ecol. 2002, 5, 37–61. [Google Scholar] [CrossRef]
Figure 1. Location of study area in Hunan Province, southern China.
Forests 12 01271 g001
Figure 2. Concentrations of soil total nitrogen (A) and total phosphorus (B) of all Chinese fir plantations. The uppercase letters on the bars indicate significant difference between different aged plantations in the same soil layer, while the lowercase letters indicate significant difference among soil layers (0–10, 10–20, 20–40, 40–60, and 60–80 cm) in plots with same age. *, **, ***, and ns were indicated p < 0.05, p < 0.01, p < 0.001, and no significance, respectively.
Forests 12 01271 g002
Figure 3. Concentrations of total nitrogen (A) and phosphorus (B) in fine roots (F roots), coarse roots (C roots), stems, and leaves of all Chinese fir. The uppercase letters on the bars indicate significant difference between different aged trees of the same organs, while the lowercase letters indicate significant difference among organs in trees with same age. *, **, ***, and ns were indicated p < 0.05, p < 0.01, p < 0.001, and no significance, respectively.
Forests 12 01271 g003
Figure 4. The N (A) and P (B) pools (dry weight, kg ha−1) of all Chinese fir. The uppercase letters on the bars indicate significant difference between different aged trees of the same organs, while the lowercase letters indicate significant difference among organs in trees with same age. *, **, ***, and ns were indicated p < 0.05, p < 0.01, p < 0.001, and no significance, respectively.
Forests 12 01271 g004
Figure 5. Correlation between nitrogen and phosphorus concentrations of all soil layers ((A) n = 135) and all plant organs ((B) n = 108), respectively. *** was indicated p < 0.001.
Forests 12 01271 g005
Figure 6. Correlation between 0–10 (red triangle) and 10–20 cm (black dot) soil nitrogen concentration and fine roots’ nitrogen concentrations (n = 27). ** and *** were indicated p < 0.01 and p < 0.001, respectively.
Forests 12 01271 g006
Table 1. Biomass (dry weight, kg ha−1) and allocation (%) of fine roots, coarse roots, stems and leaves of different aged Chinese fir. The uppercase letters on the bars indicate significant difference between different aged trees of the same organs, while the lowercase letters indicate significant difference among organs in trees with same age. *, ***, and ns were indicated p < 0.05, p < 0.001, and no significance, respectively.
Age (Years)Fine RootsCoarse RootsStemsLeavesTotalp-Value
107.8 ± 1.8 B b
(1.9)
70.8 ± 27.0 C b
(17.1)
292.2 ± 84.0 B a
(70.6)
43.0 ± 13.6 C b
(10.4)
413.7 ± 71.8 C a
(100)
***
208.9 ± 1.1 A d
(0.7)
261.7 ± 10.6 B c
(20.7)
896.9 ± 91.5 B b
(70.9)
98.1 ± 15.1 B d
(7.7)
1265.6 ±67.1 B a
(100)
***
3014.0 ± 3.0 A e
(0.6)
473.1 ± 40.0 A c
(19.9)
1738.1 ± 98.1 A b
(73.0)
156.3 ± 15.0 A d
(6.5)
2381.5 ± 47.5 A a
(100)
***
p-value****ns******
Publisher’s Note: MDPI stays neutral with regard to jurisdictional claims in published maps and institutional affiliations.

