Article

Soil Metaproteomics as a Tool for Environmental Monitoring of Minelands

by
Felipe Costa Trindade
1,2,
Markus Gastauer
1,3,
Silvio Junio Ramos
1,
Cecílio Frois Caldeira
1,
Josiney Farias de Araújo
3,
Guilherme Oliveira
1 and
Rafael Borges da Silva Valadares
1,2,*
1
Instituto Tecnológico Vale, Belém 66055-090, PA, Brazil
2
Programa de Pós-Graduação em Biotecnologia Aplicada à Agropecuária, Universidade Federal Rural da Amazônia, Belém 66055-110, PA, Brazil
3
Programa de Pós-Graduação em Ecologia, Laboratório de Ecologia de Produtores Primários, Universidade Federal do Pará, Belém 66075-110, PA, Brazil
*
Author to whom correspondence should be addressed.
Forests 2021, 12(9), 1158; https://doi.org/10.3390/f12091158
Submission received: 11 June 2021 / Revised: 27 July 2021 / Accepted: 20 August 2021 / Published: 26 August 2021
(This article belongs to the Special Issue Forest Soil–Plant–Microorganisms Interactions)

Abstract

:
Opencast mining drastically alters the landscape due to complete vegetation suppression and removal of topsoil layers. Precise indicators able to address incremental changes in soil quality are necessary to monitor and evaluate mineland rehabilitation projects. For this purpose, metaproteomics may be a useful tool due to its capacity to shed light on both taxonomic and functional overviews of soil biodiversity, allowing the linkage between proteins found in soil and ecosystem functioning. We investigated bacterial proteins and peptide abundance of three different mineland rehabilitation stages and compared it with a non-rehabilitated site and a native area (evergreen dense forest) in the eastern Amazon. The total amount of identified soil proteins was significantly higher in the rehabilitating and native soils than in the non-rehabilitated site. Regarding soil bacterial composition, the intermediate and advanced sites were shown to be most similar to native soil. Cyanobacteria and Firmicutes phyla are abundant in the early stages of environmental rehabilitation, while Proteobacteria population dominates the later stages. Enzyme abundances and function in the three rehabilitation stages were more similar to those found in the native soil, and the higher accumulation of many hydrolases and oxidoreductases reflects the improvement of soil biological activity in the rehabilitating sites when compared to the non-rehabilitated areas. Moreover, critical ecological processes, such as carbon and nitrogen cycling, seem to return to the soil in short periods after the start of rehabilitation activities (i.e., 4 years). Metaproteomics revealed that the biochemical processes that occur belowground can be followed throughout rehabilitation stages, and the enzymes shown here can be used as targets for environmental monitoring of mineland rehabilitation projects.

1. Introduction

Despite economic and social benefits, open cast mining drastically alters the landscape due to complete vegetation suppression and removal of topsoil layers [1]. Thus, Brazil’s environmental laws require the measurement of rehabilitation impacts on biodiversity and natural resources [2]. Given the complexity of the rehabilitation process and the monitoring of mined lands, metaproteomics can be a valuable tool in environmental monitoring [3] of these areas.
Metaproteomics describes the profile of identified proteins of soil organisms [4,5], helping to assess the recovery of the soil microbial community [6], which is a crucial step in the rehabilitation of degraded soils [7]. Soil microbial activity and diversity play important roles in sustainability by keeping essential functions in soil health, involving carbon and nutrient cycling [8]. Changes in microbial community can precede detectable changes in soil physicochemical properties, thereby providing early signs of environmental stress or ecological environment evolution in the mining area [7]. The metabolic and cellular information provided by metaproteomics may be useful for tracking the responses of a microbial community of soils subjected to different soil uses and management [9]. In this way, metaproteomics permits the linkage between the presence of soil microorganisms’ proteins with ecosystem functioning [9].
Since proteins are molecules responsible for functional activities in an organism, a variety of information can be accessed about metabolic pathways, defense mechanisms, metabolic energy, plant-microorganism interactions, and nutrient cycling [10,11]. Although the metaproteomic technique reveals relevant biochemical and ecological information, soil protein extraction is challenging [12], and different approaches and protocols have been used over the years in order to obtain feasible protein extraction in quantitative and qualitative terms [12].
Differential accumulation of proteins and processes related to environmental conditions gradients of soil organic matter (SOM) and vegetal cover were observed in previous soil metaproteomics studies [13,14]. Detection of Cyanobacteria proteins involved in carbon fixation was shown only in soils characterized by low vegetation cover and harsh conditions [13]. Additionally, the authors found a variety of proteins related to SOM transformation in forest soil, characterized by high vegetation cover and high SOM content. These gradients of environmental conditions are verified through the rehabilitation stages in mineland rehabilitation [15], and metaproteomics can monitor biochemical processes and soil microorganisms that occur since the beginning of environmental rehabilitation.
Rehabilitation of a mined area is successful when healthy and self-sustaining ecosystems are able to develop [6]. Success can be measured by comparing different rehabilitation stages with native areas as a reference [15,16]. In the active rehabilitation of Amazonian sand mines [15], each rehabilitation status has specific environmental variables that are expected to reach the native reference condition with the rehabilitation practices and time [15]. We hypothesize that the proteins of soil organisms also converge to the native condition with rehabilitation time and that data present here can integrate a set of variables in upcoming rehabilitation studies.
This work aims to demonstrate metaproteomics as a tool in the environmental monitoring of areas under rehabilitation, formerly sand extraction mines in the eastern Amazon, using a native area as a reference and a non-rehabilitated site as a negative control. We hypothesized that (i) proteins identified in each rehabilitation stage would allow us to make inferences about overall soil biological status and (ii) the more advanced the rehabilitation stage is, the greater the similarity of soil bacterial abundance and enzyme functions of the rehabilitation areas with the native reference area.

2. Materials and Methods

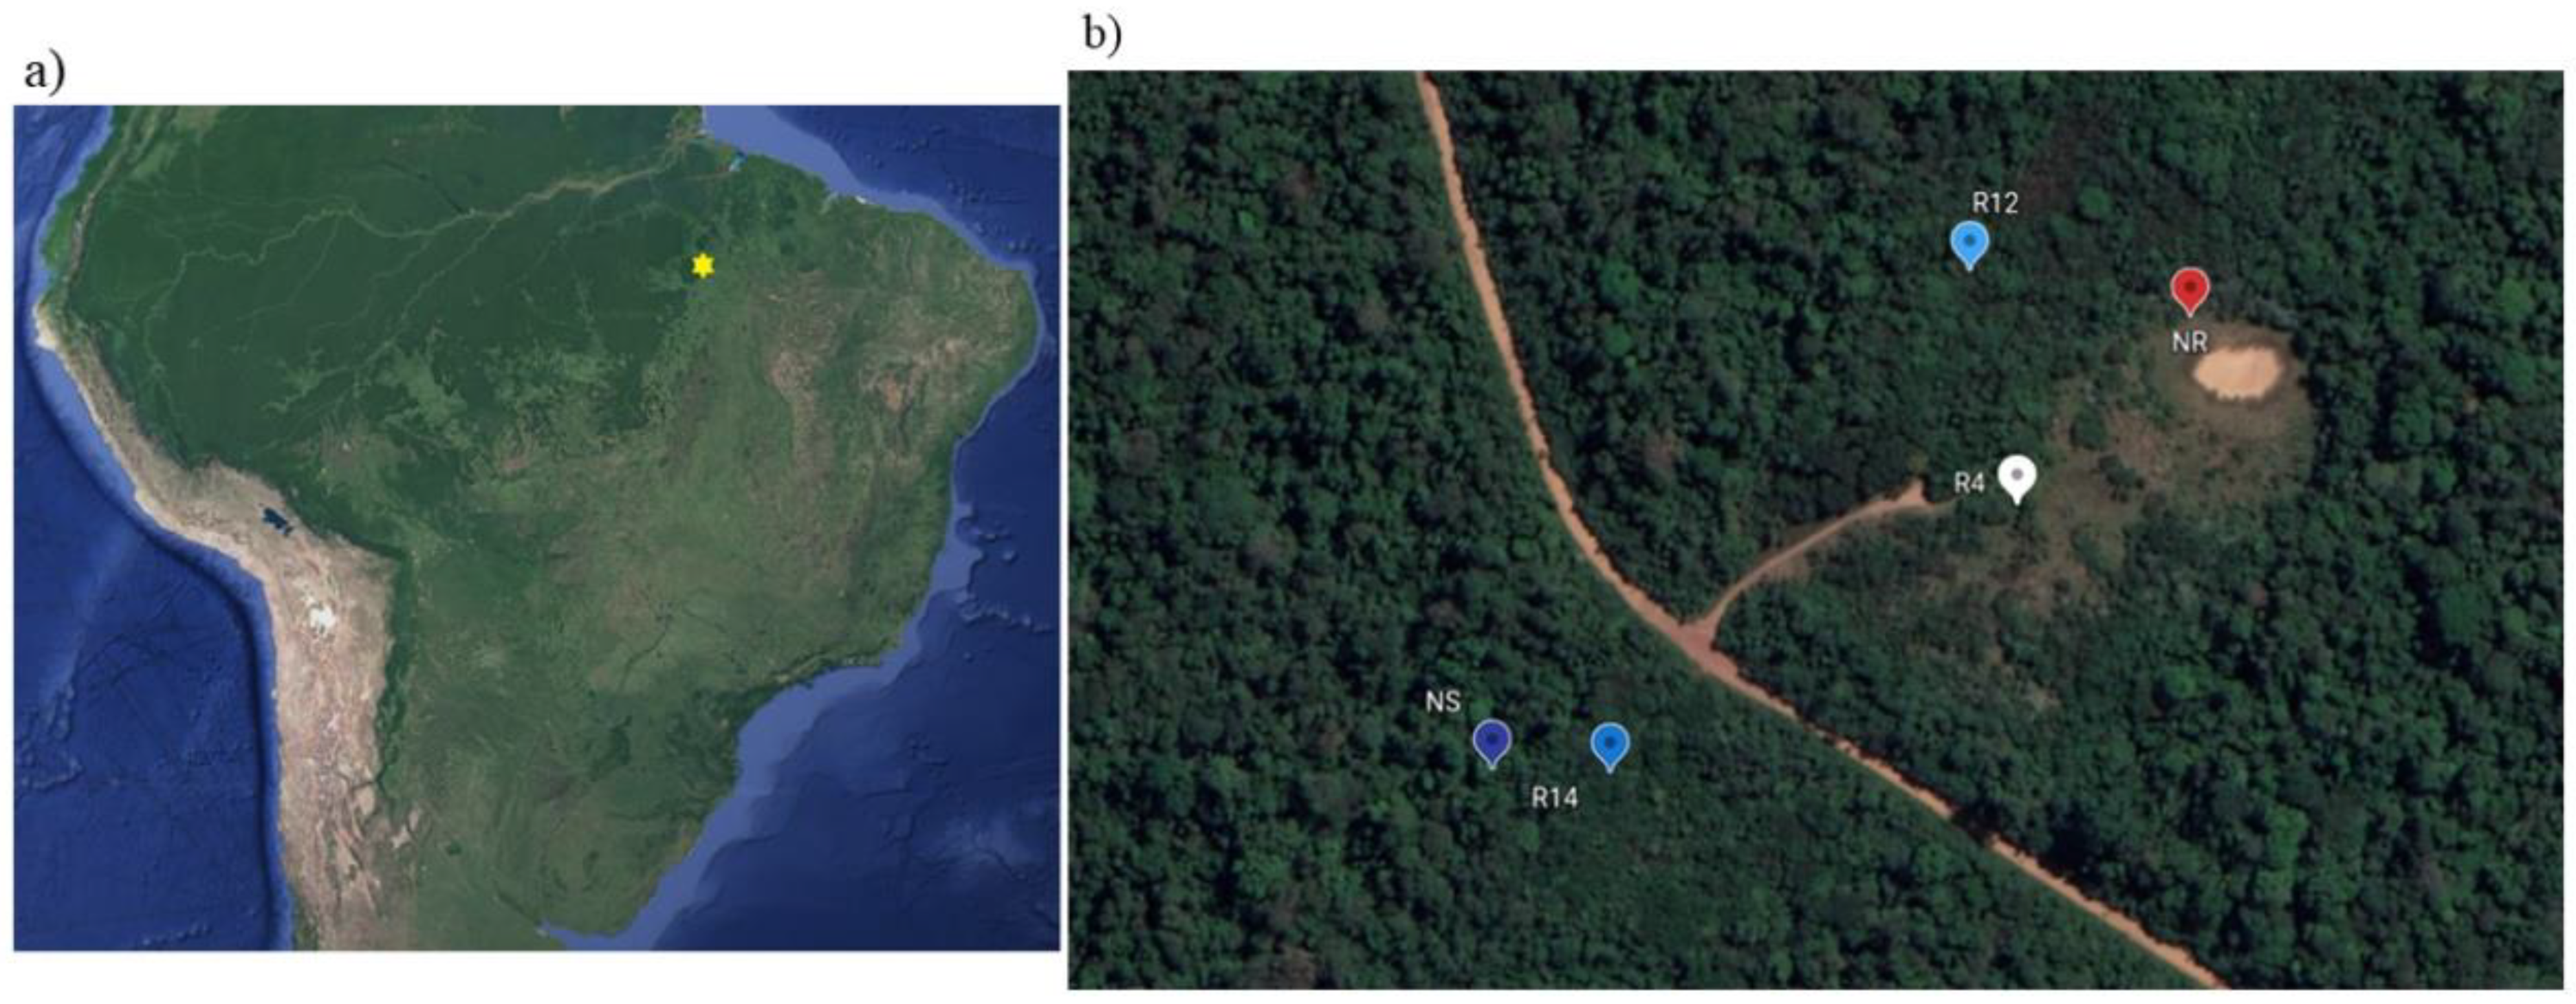
2.1. Study Area and Rehabilitation Activities

The study was conducted in the Carajás National Forest, Parauapebas—PA, Brazil. The region’s climate is tropical and warm, with rainy summers and dry winters; tropical wet-dry climate (Aw) in the Köppen classification [17]. The most abundant soil types found in these areas are oxisols, cambisols, and argisols, with a predominance of open ombrophilous forest and dense ombrophilous forest [18].
Three sand extraction pits (formed by sandstones), located near the Vale Ferrosos Carajás Complex mines, were filled with mining waste from a nearby granite mine located south of the sandstones. After filling the sand extraction pits, the areas were flattened. For its revegetation, forest topsoil was distributed and planted with seedlings, and native species were sown [15].
A 50 cm topsoil layer (including organic and litter layers) of dense forest was removed, similar to the rehabilitation reference. After vegetation suppression, to avoid degradation of the applied topsoil, 30 cm was immediately and homogeneously distributed with a crawler in the rehabilitation areas. The topsoil had low nutrient content, especially P, Ca, and Mg, and required correction to optimize plant growth [15]. At non-rehabilitated (NR) sites, no rehabilitation activities were carried out. A summary of the rehabilitation techniques employed is presented in Table 1; more details are found in Gastauer et al. [15]. The standardized rehabilitation protocol ensures that the time since the onset of rehabilitation activities was the main difference among rehabilitation stages.

2.2. Soil Sampling

Soil sampling was performed at a 0–10 cm depth, with five sampling points in every three plots of 10 × 20 m, totaling three composite samples (three replicates) for each rehabilitation stage and native sites. The geographic location, rehabilitation stage, and age of the study sites are presented in Table 2 and Figure 1.

2.3. Environmental Data

The SOM was measured by the potassium dichromate method (K2Cr2O7) [19]. The leaf area index (LAI) was calculated as an indirect measure of canopy closure in each plot of the rehabilitation and reference sites. An LAI-2200C (LI-COR Inc., Lincoln, NE, USA) was used, following the manufacturer’s instructions, where readings above the canopy (sky conditions) were continuously measured by a sensor in a vegetation-free location. A second sensor was used to capture two readings below the canopy at each corner and in the center of each plot, i.e., ten readings below the canopy for each plot. The readings below the canopy were taken one meter above the ground surface. Soil respiration was measured as CO2 effluxes using an LI-6400 system (LI-COR Inc.). Polyvinyl chloride (PVC) collars (10.2 cm in diameter, 4.4 cm in height) were inserted 3 cm into the soil surface to support the soil CO2 flux chamber. In each plot, three PVC collars were installed 2 m from each other and at least 0.5 m away from tree trunks to avoid the trees’ effects on soil respiration. More details on this method can be found in Gastauer et al. [15].

2.4. Soil Protein Extraction and Identification

For the metaproteomics analysis, soil samples from the three plots were homogenized before protein extraction to yield 3 g of one composite sample per rehabilitation stage. Plant debris was removed from the soil. Protein isolation was performed according to Wang et al. [20], with some modifications described in Trindade et al. [5], such as using polyvinylpolypyrrolidone (PVPP) and dithiothreitol (DTT) to improve protein identification. The soil suspension was sonicated on ice prior to phenol extraction step and ammonium acetate precipitation. Protein pellets were cleaned with ice-cold acetone and ice-cold ethanol and then digested with trypsin. Samples were submitted to five-step fractionating liquid chromatography in a NanoAcquity 2D-UPLC® System (Waters, Milford, MA, USA).
Each sample was loaded into the NanoAcquity UPLC® System equipped with 2D online dilution technology. The first chromatographic dimension of the peptide fraction was ascertained under basic (pH = 10) conditions in a BEH C18 300 Å, 5 μM 300 um × 50 mm reverse phase column (XBridgeTM, Waters Corp.). This was performed at a flow rate of 2 μL/min. Eluent A was aqueous 20 mM formic acid (FA) (pH = 10) and eluent B was neat acetonitrile. All samples were analyzed using a five-step fractionation method. The fractions were eluted from the first dimension using a composition of 10.8, 14.0, 16.7, 20.4, or 65% of eluent B, respectively. The fractionation process was programmed to start immediately after completion of sample loading (20 min at 10 μL/min with 3% B). Each first-dimension elution step was performed with 20 min run time using a flow rate of 2 μL/min. Eluent peptide was mixed online with 10 μL/min of 0.1% trifluoroacetic acid solution (1:10 dilution) before being trapped in the trapping column (100 μm × 100 mm), packed with 1.7 μm 100 Å silica-based C18 (Symmetry, Waters Corp, Milford, MA, USA) [21].
The mobile phase for the second chromatographic dimension was 0.1% FA in water (mobile phase A) and 0.1% FA in ACN (mobile phase B). The second-dimension column was 100 μm × 10 mm C18 packed with changed surface hybrid (CSH) 1.8 mm particles (Acquity UPLC M-Class CSH C18, Waters Corp., Milford, MA, USA). The flow rate for the second-dimension separation was 400 nL min−1, while the column was maintained at 55 °C. A 40-min gradient from 3 to 40% B was used to separate peptides in the second separation dimension. The column was then washed using 90% B for 1 min and equilibrated with 3% B for 7 min before returning to the next step of fractionation [21]. This setup was coupled to a NanoLock ESI-Q-ToF SYNAPT G2-S (Waters) mass spectrometer, configured to operate in a positive mode with continuous fragmentation (MSE), with the collision energy ranging from 5 to 40 eV.
Mass spectra were acquired in continuum mode over an m/z range of 50–1200, using a capillary voltage of 2.6 KV, source temperature of 100 °C, source offset voltage of 100 V, cone gas flow of 50 L/h and cone voltage of 40 V. The spectral acquisition time at each energy setting was 0.5 s. A solution of 0.2 μM Glu1-fibrinopeptide (785.8427 Da) was used as a lock-mass solution, delivered at a flow rate of 0.5 μL/min using an auxiliary pump of the liquid chromatography system. The lock-mass was sampled every 30 s using 0.1 s scans over the same mass range [21].
Raw data were processed using Proteinlynx Global Server (PLGS) version 3.0.2 (Waters Corp, Milford, MA, USA). For that, searches were performed in PLGS against a custom database composed of sequences from the Bacteria, Plants, and Fungi UniprotKB-reviewed databases (containing 336,171 bacteria sequences, 6347 plant sequences, and 33,362 fungal sequences). Carbamidomethylation on C-term (+57) was set as fixed modification and variable modifications were set as following: −1 on (Amidation + C-TERM), +1 on N (Deamidated), +16 on M (Oxidation), +80 on (Phosphoryl + STY), +98 on STY (Phosphoryl STY).
The results of PLGS were exported to Scaffold Proteome Software version 4.6.1 (Proteome Software, Portland, OR) to allow validation and visualization [22]. The false discovery rate (FDR) was calculated by the PeptideProphet and Proteinprophet algorithms [23]. Peptides were accepted when calculated FDR was lower than 6.6%; for proteins we defined a threshold of 3.3%. Functional analysis of the proteins was obtained from the software Unipept version 4.0 using default parameters [24]. For that, peptides datasets were submitted into the Unipept web application (https://unipept.ugent.be/datasets, accessed on 1 June 2020) to obtain Gene Ontology (GO) terms, Enzyme Commission (EC) numbers, and taxonomic classification. Finally, a phylogenetic tree was constructed using the lowest common ancestor (LCA) method based on the list of identified peptides. We also visualized differences between samples based on a functional or taxonomic composition by using the Unipept desktop application [25]. More details on the proteomics workflow are presented in Supplementary Material S1.

2.5. Data Analysis

To verify significant differences between the environmental data of the areas, one-way ANOVA followed by the posthoc Tukey test with p < 0.05 in R software was carried out. The same analysis was carried out to verify significant differences in the amount of identified proteins (Table S1) between rehabilitation stages, using three technical replicates for each composite sample. We used the unweighted pair group method with arithmetic mean (UPGMA) and the Bray-Curtis distance index for clustering analysis of bacterial peptide abundance. Functional enzyme clustering analysis was performed using the UPGMA method and Manhattan distance index utilizing the Enzyme Commission number (EC number) classification, where the subgroup abundance (EC number level 2) was calculated based on the respective EC number level 1 values (Table S2). In this functional analysis, we considered the proteins from all soil organisms, i.e., bacteria, fungi, and plants found in the soil metaproteome of each rehabilitation stage. Spearman’s Rank correlations between bacterial peptide abundance and environmental values were observed (Table S3).

3. Results

3.1. Environmental Variables

The environmental variables observed in this work (Table 3) showed higher values (p < 0.05) for SOM in the intermediate and advanced rehabilitation areas and native areas than in the NR and early rehabilitation stages. As expected, a linear increase in vegetation coverage measured through the LAI was observed according to the rehabilitation time. We observed greater biological activity in the early rehabilitation soil for soil respiration, followed by the advanced rehabilitation area R14, which differed significantly from the NR area (p < 0.05).

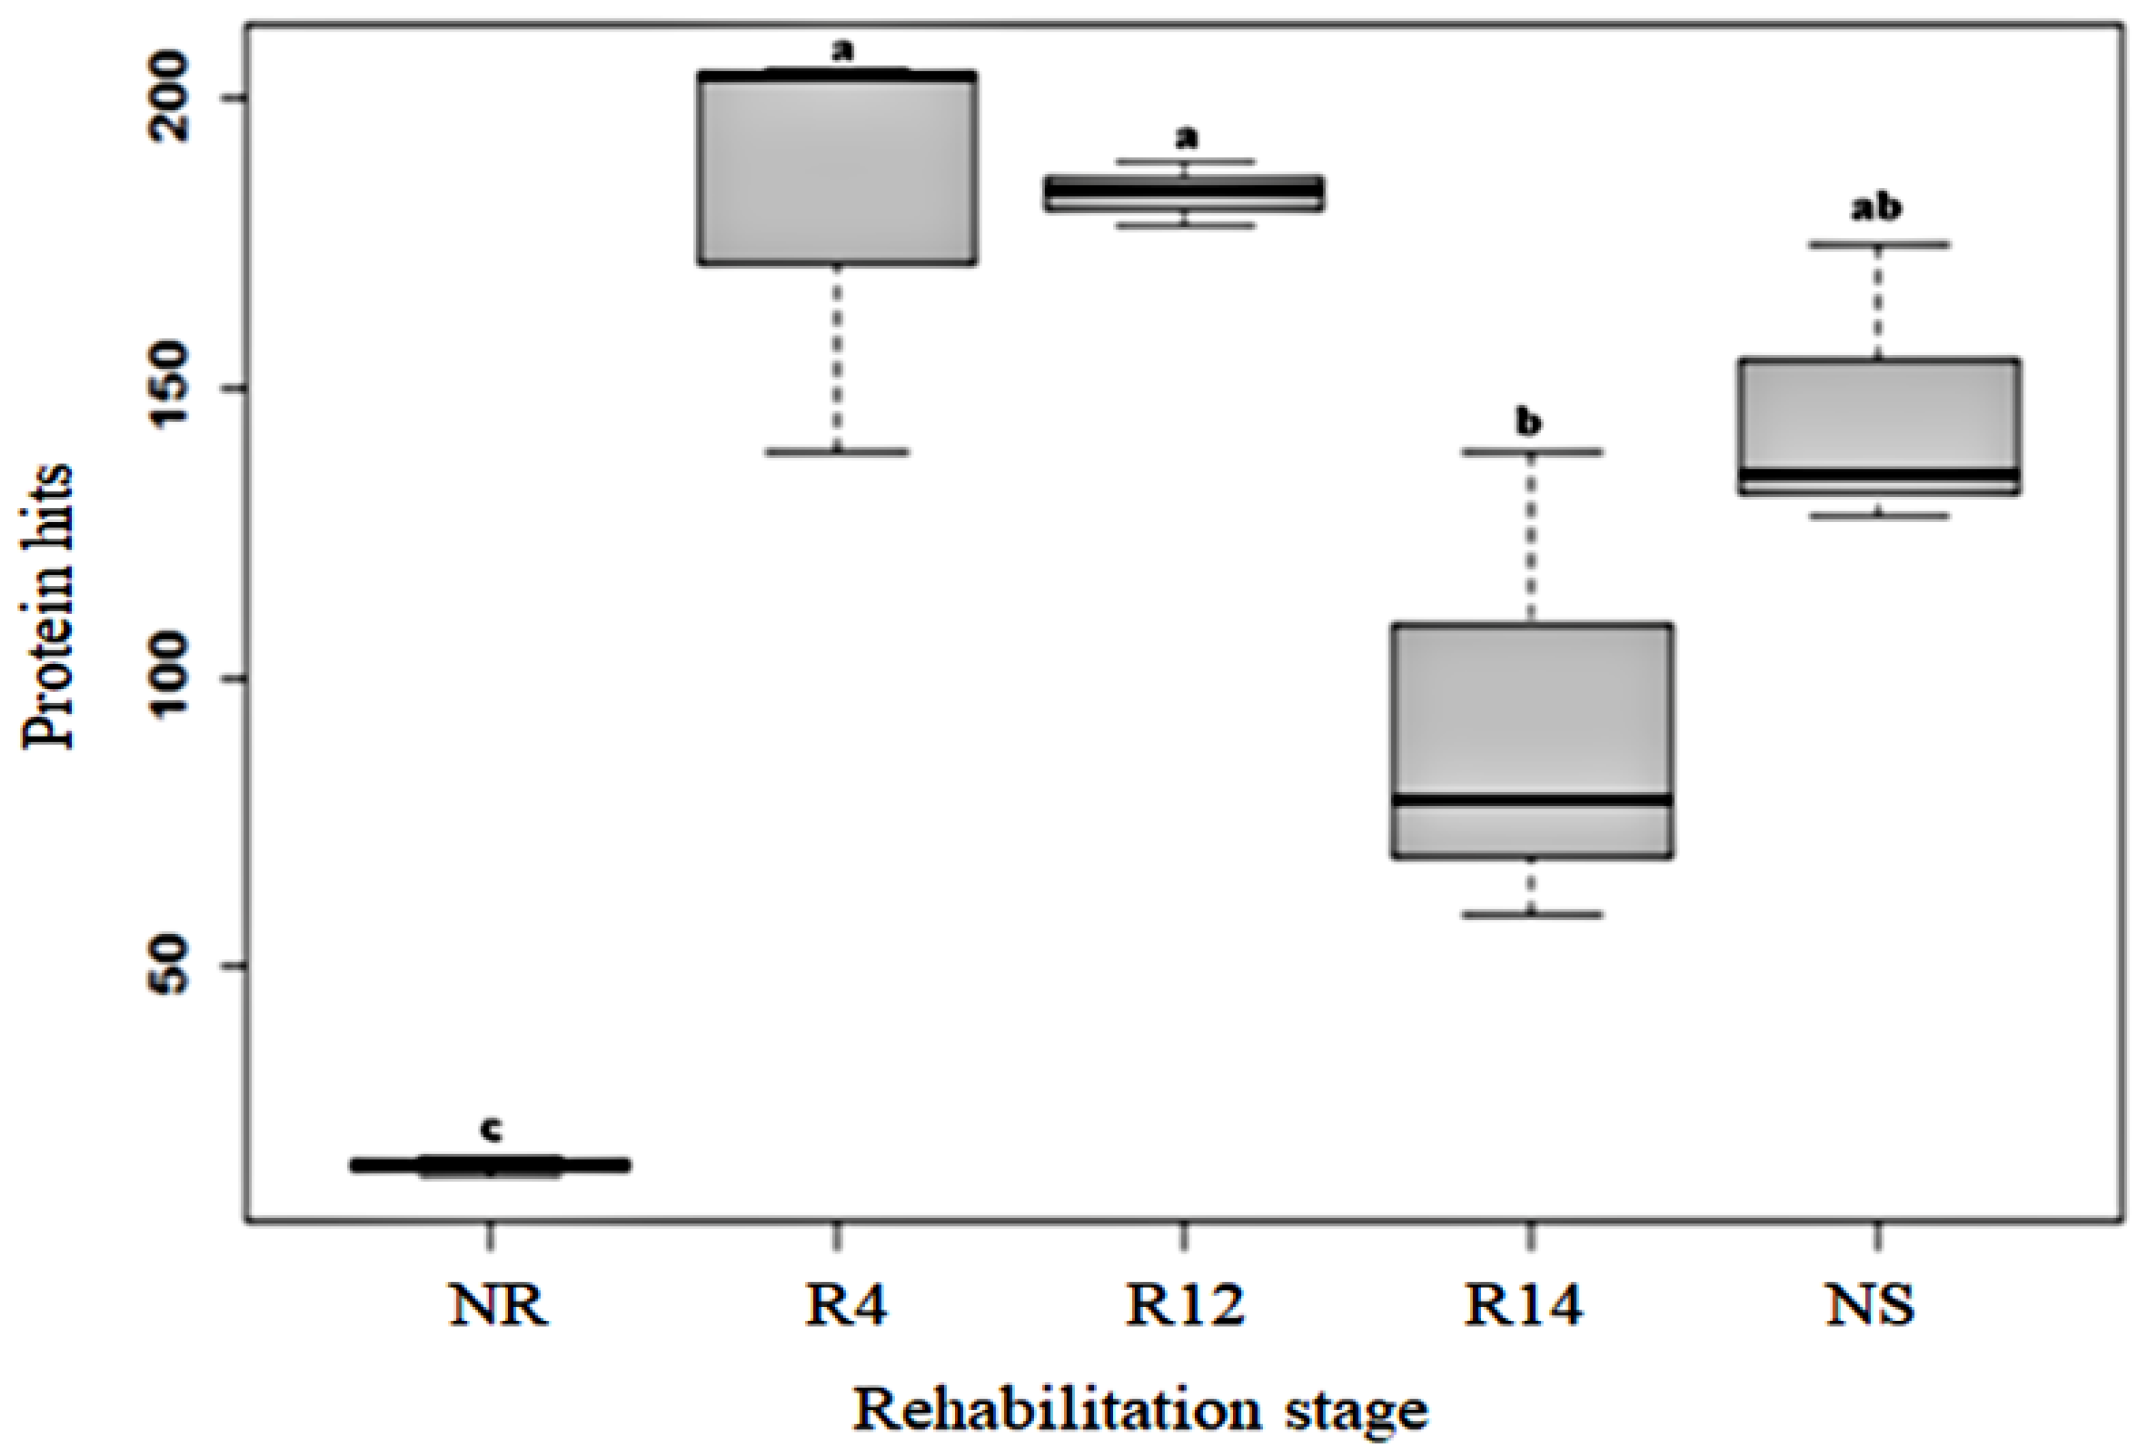
3.2. Amount of Identified Proteins

The total amount of identified soil proteins was higher in the revegetated areas R4 (336), R12 (329), R14 (216), and the native (291) area than in the NR area (40) (Figure 2). Although R14 had a lower protein amount than R4 and R12, it did not differ significantly from native soil (NS), and NS did not differ significantly from areas under rehabilitation (p < 0.05).

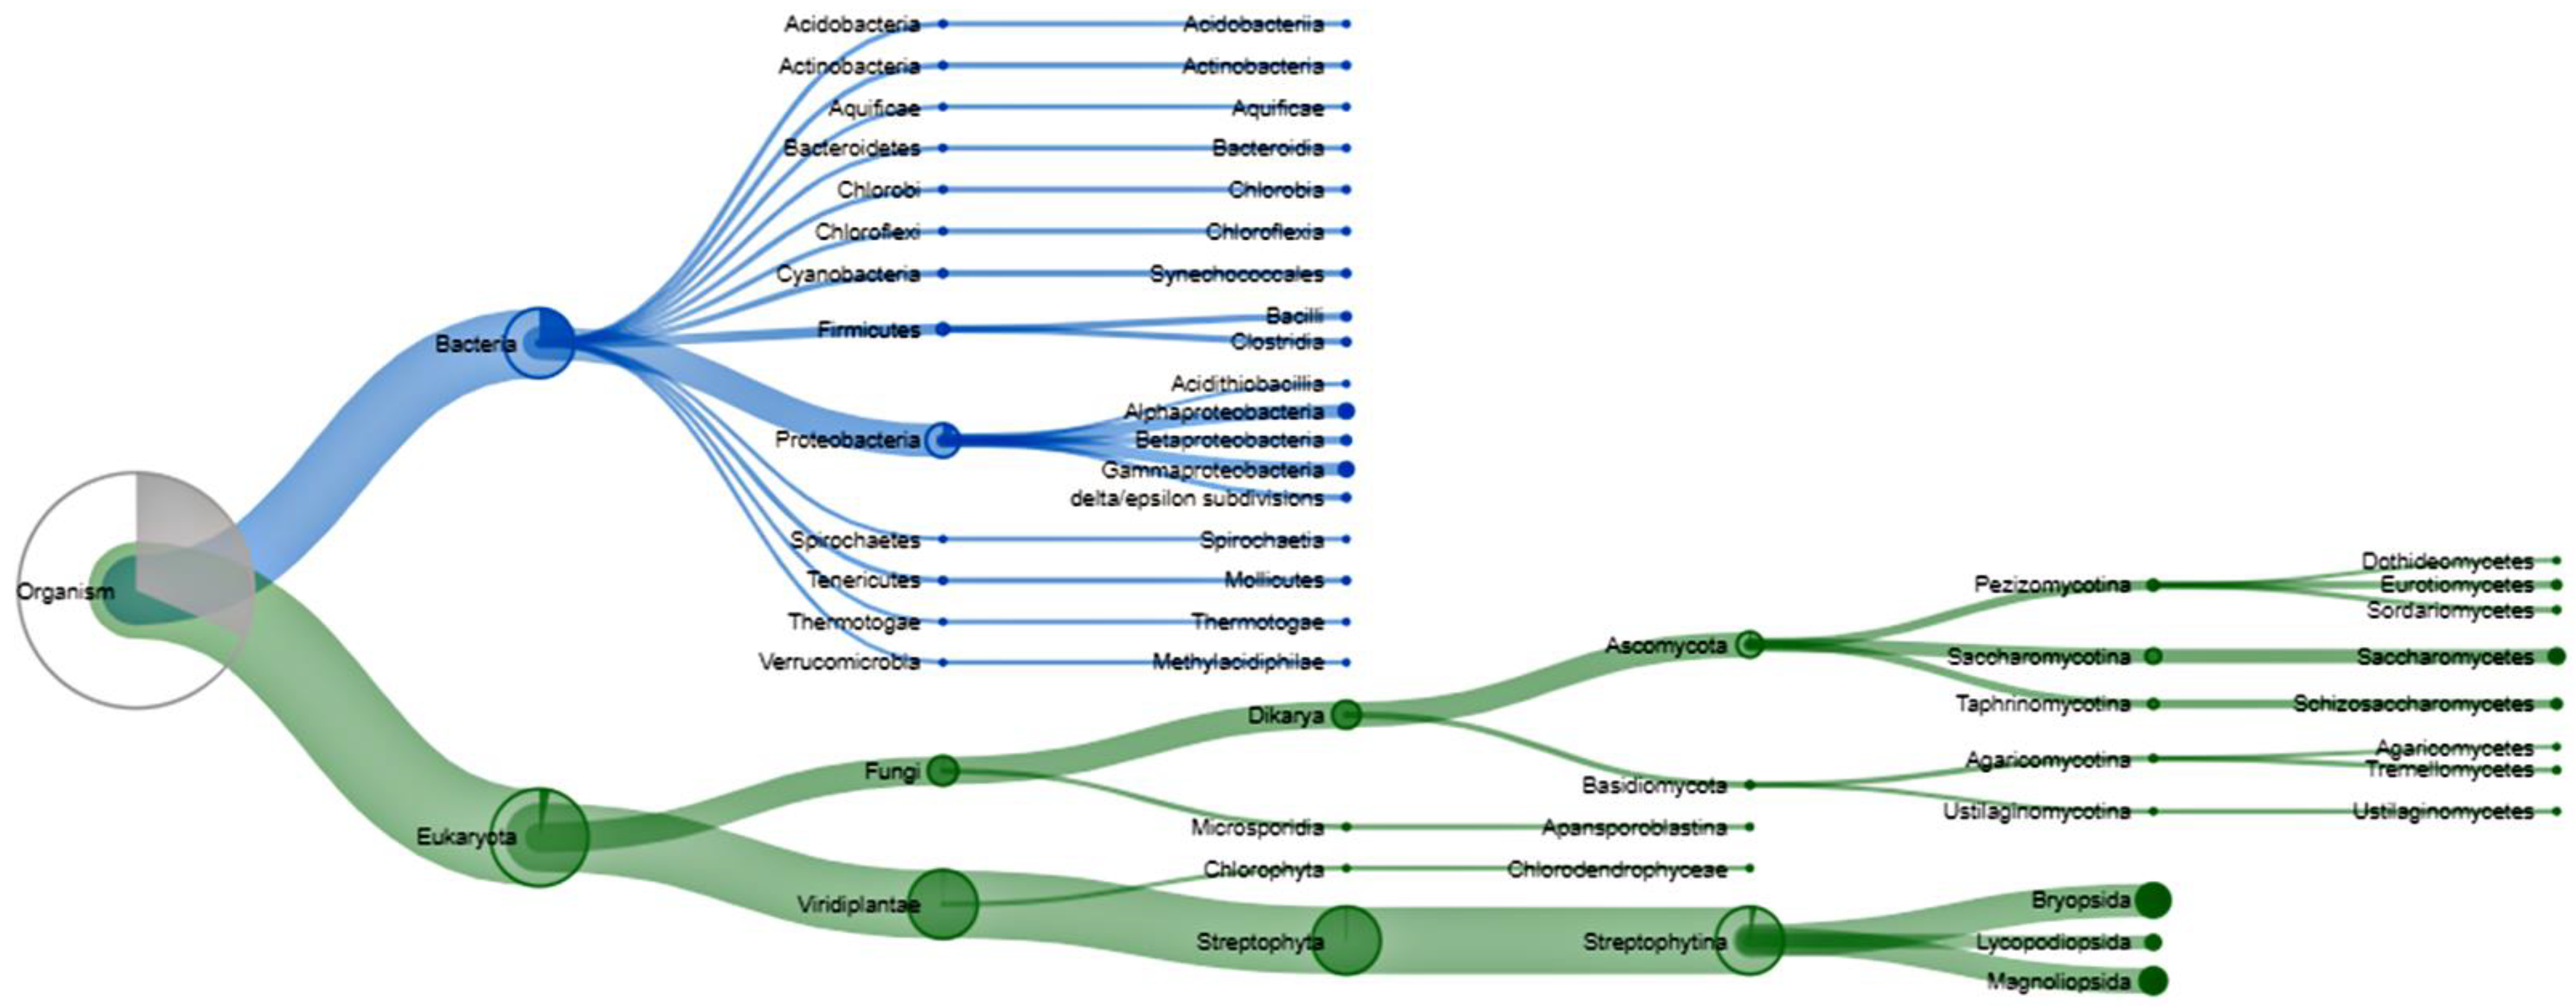
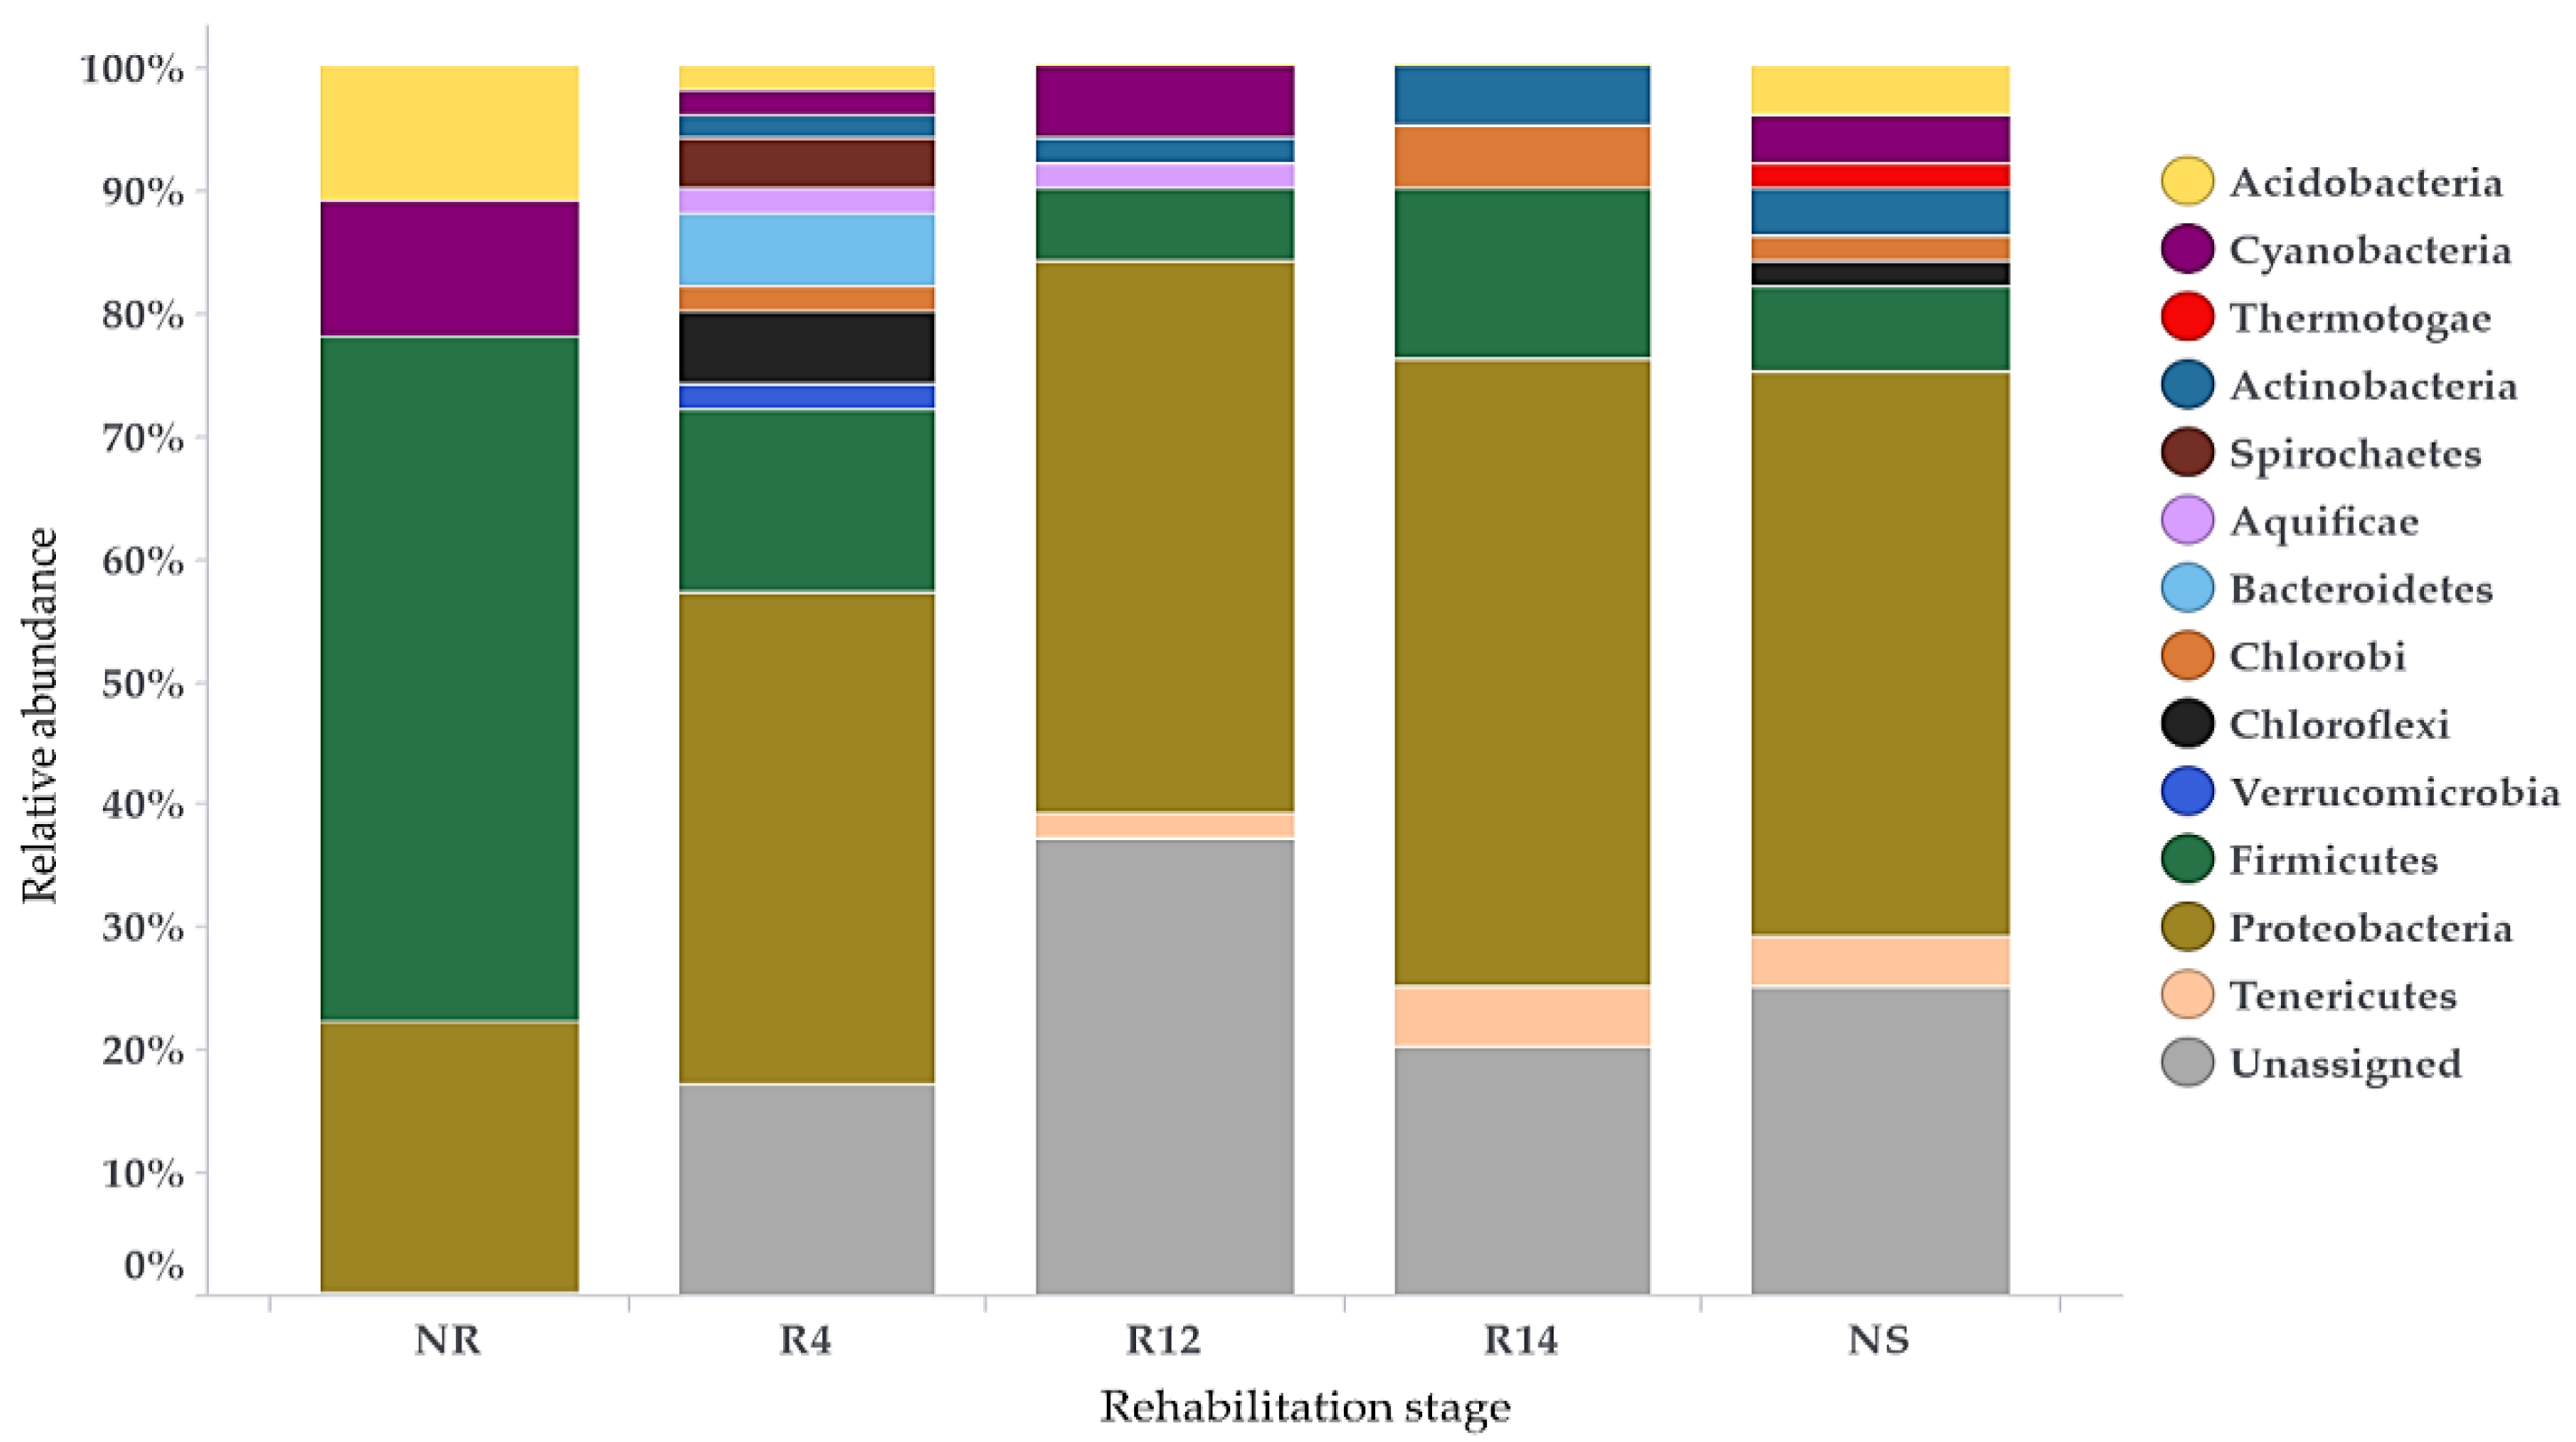
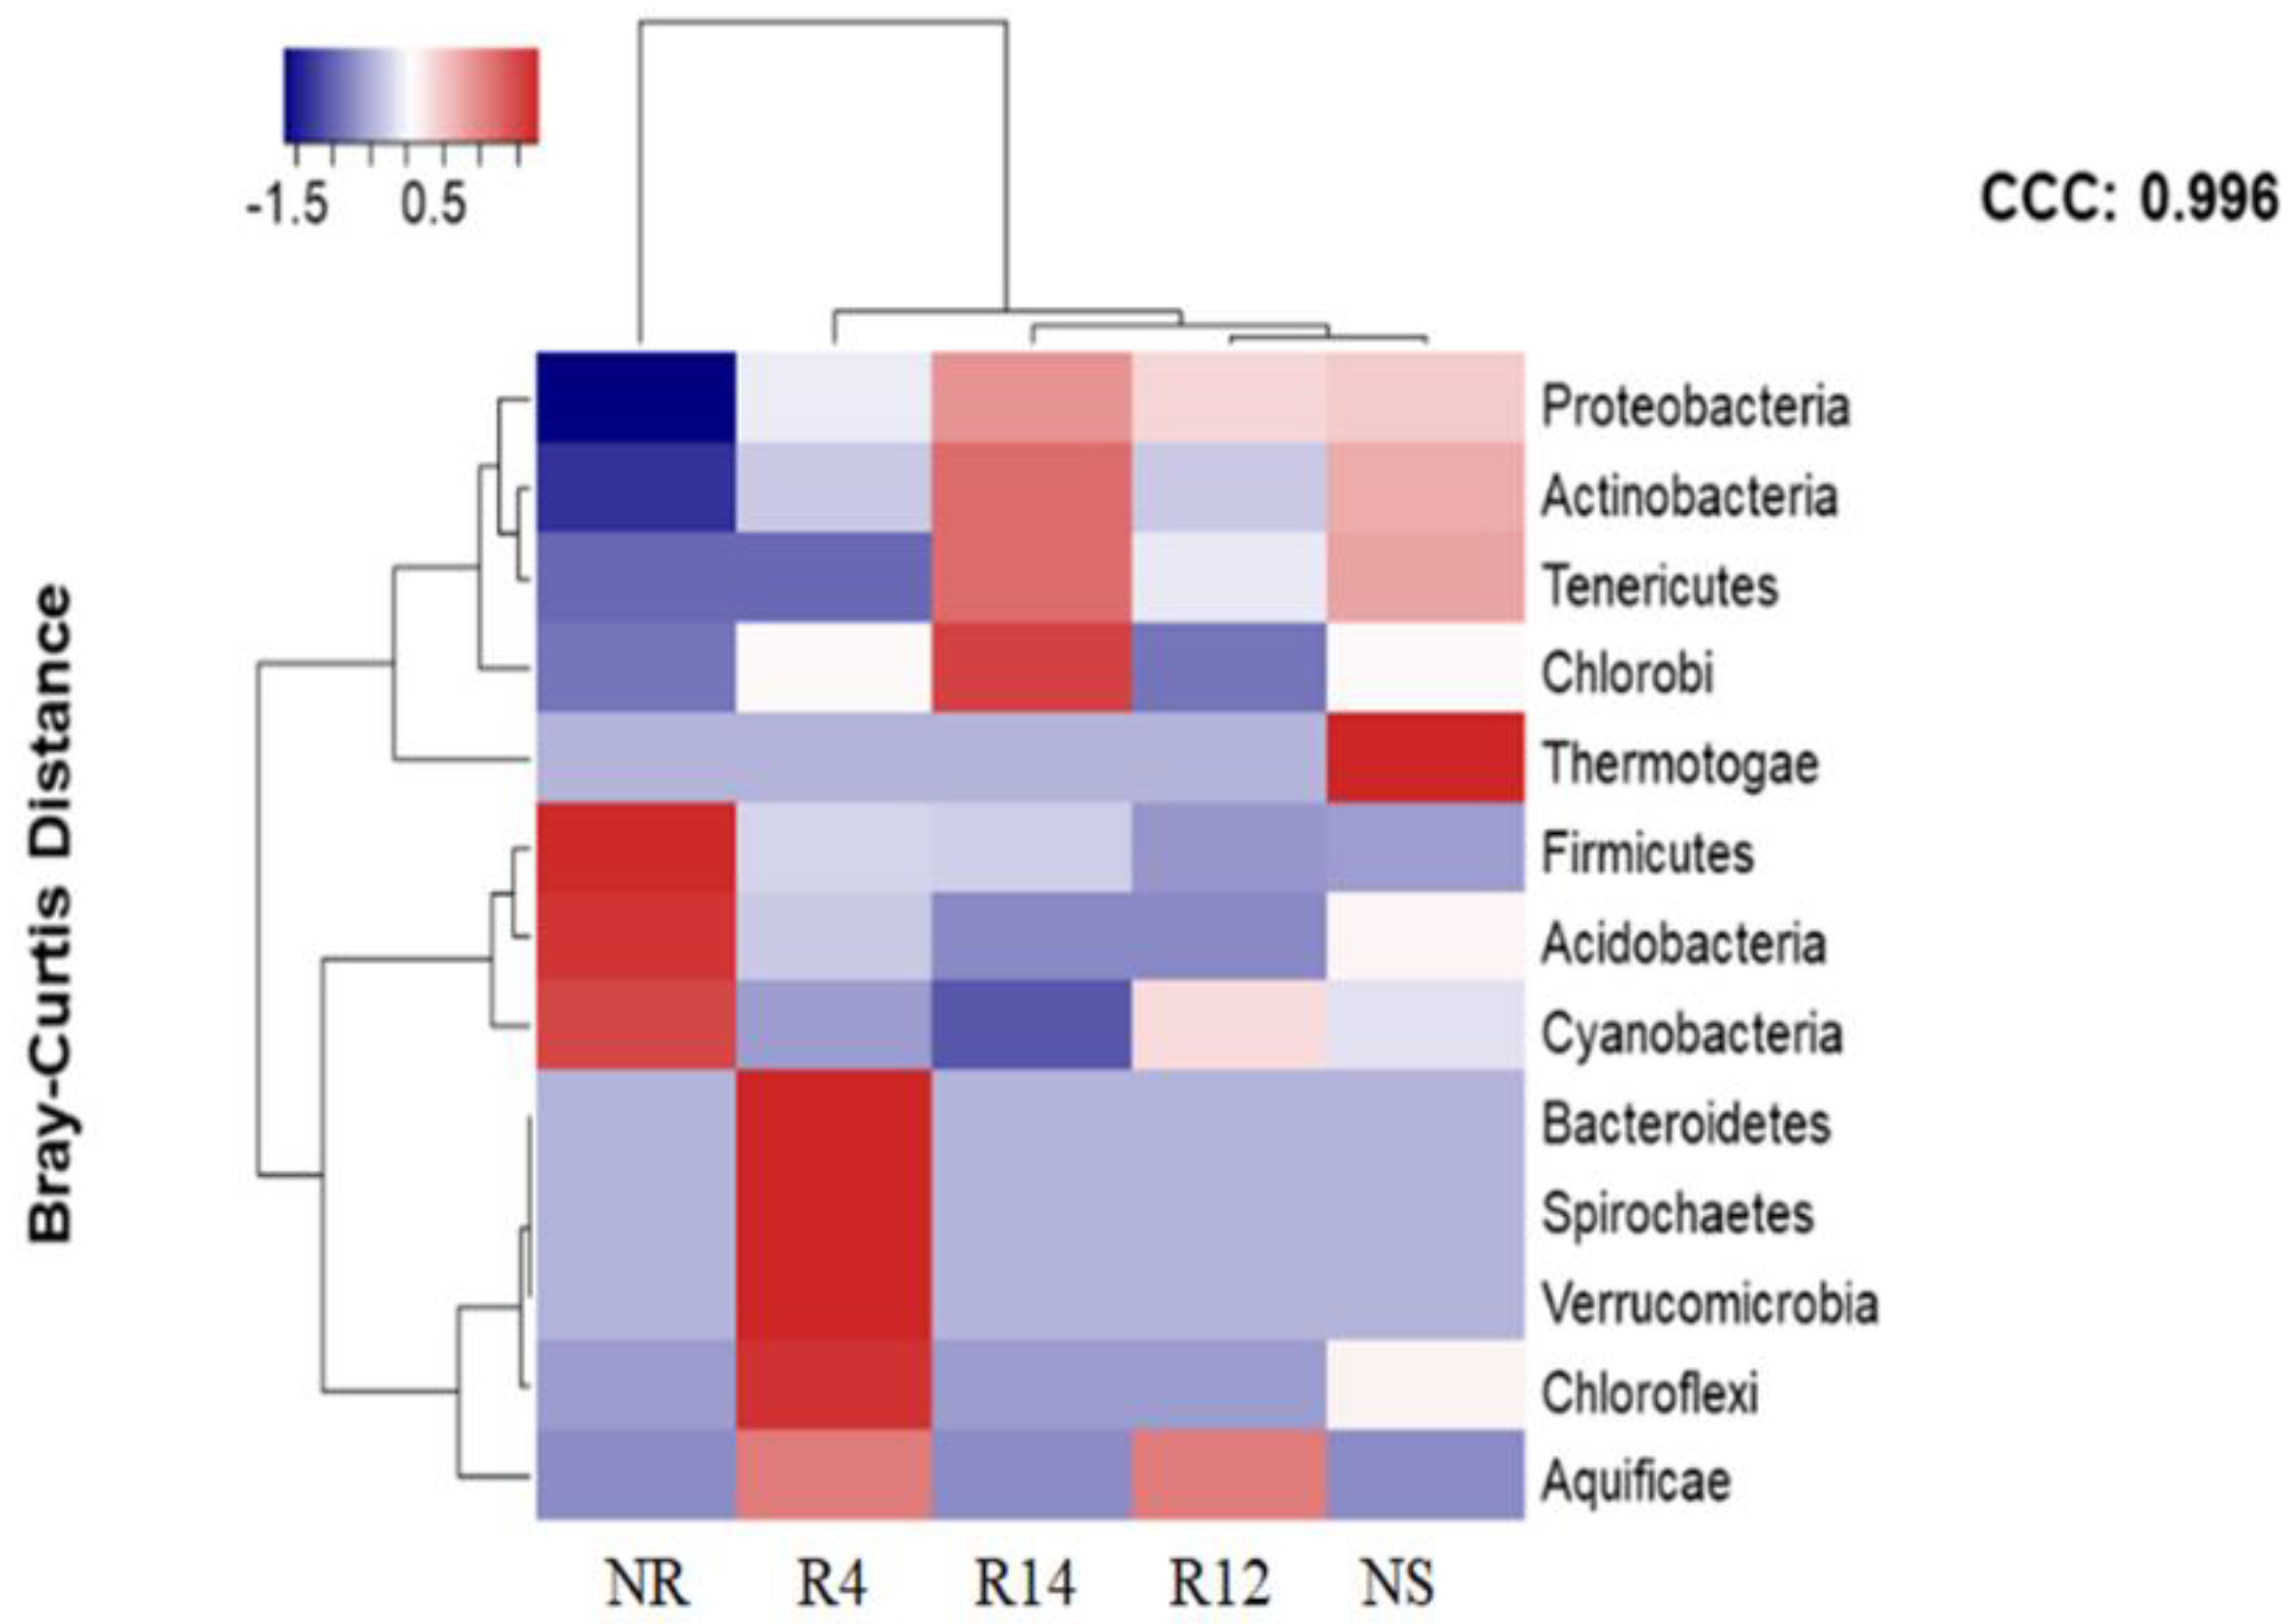
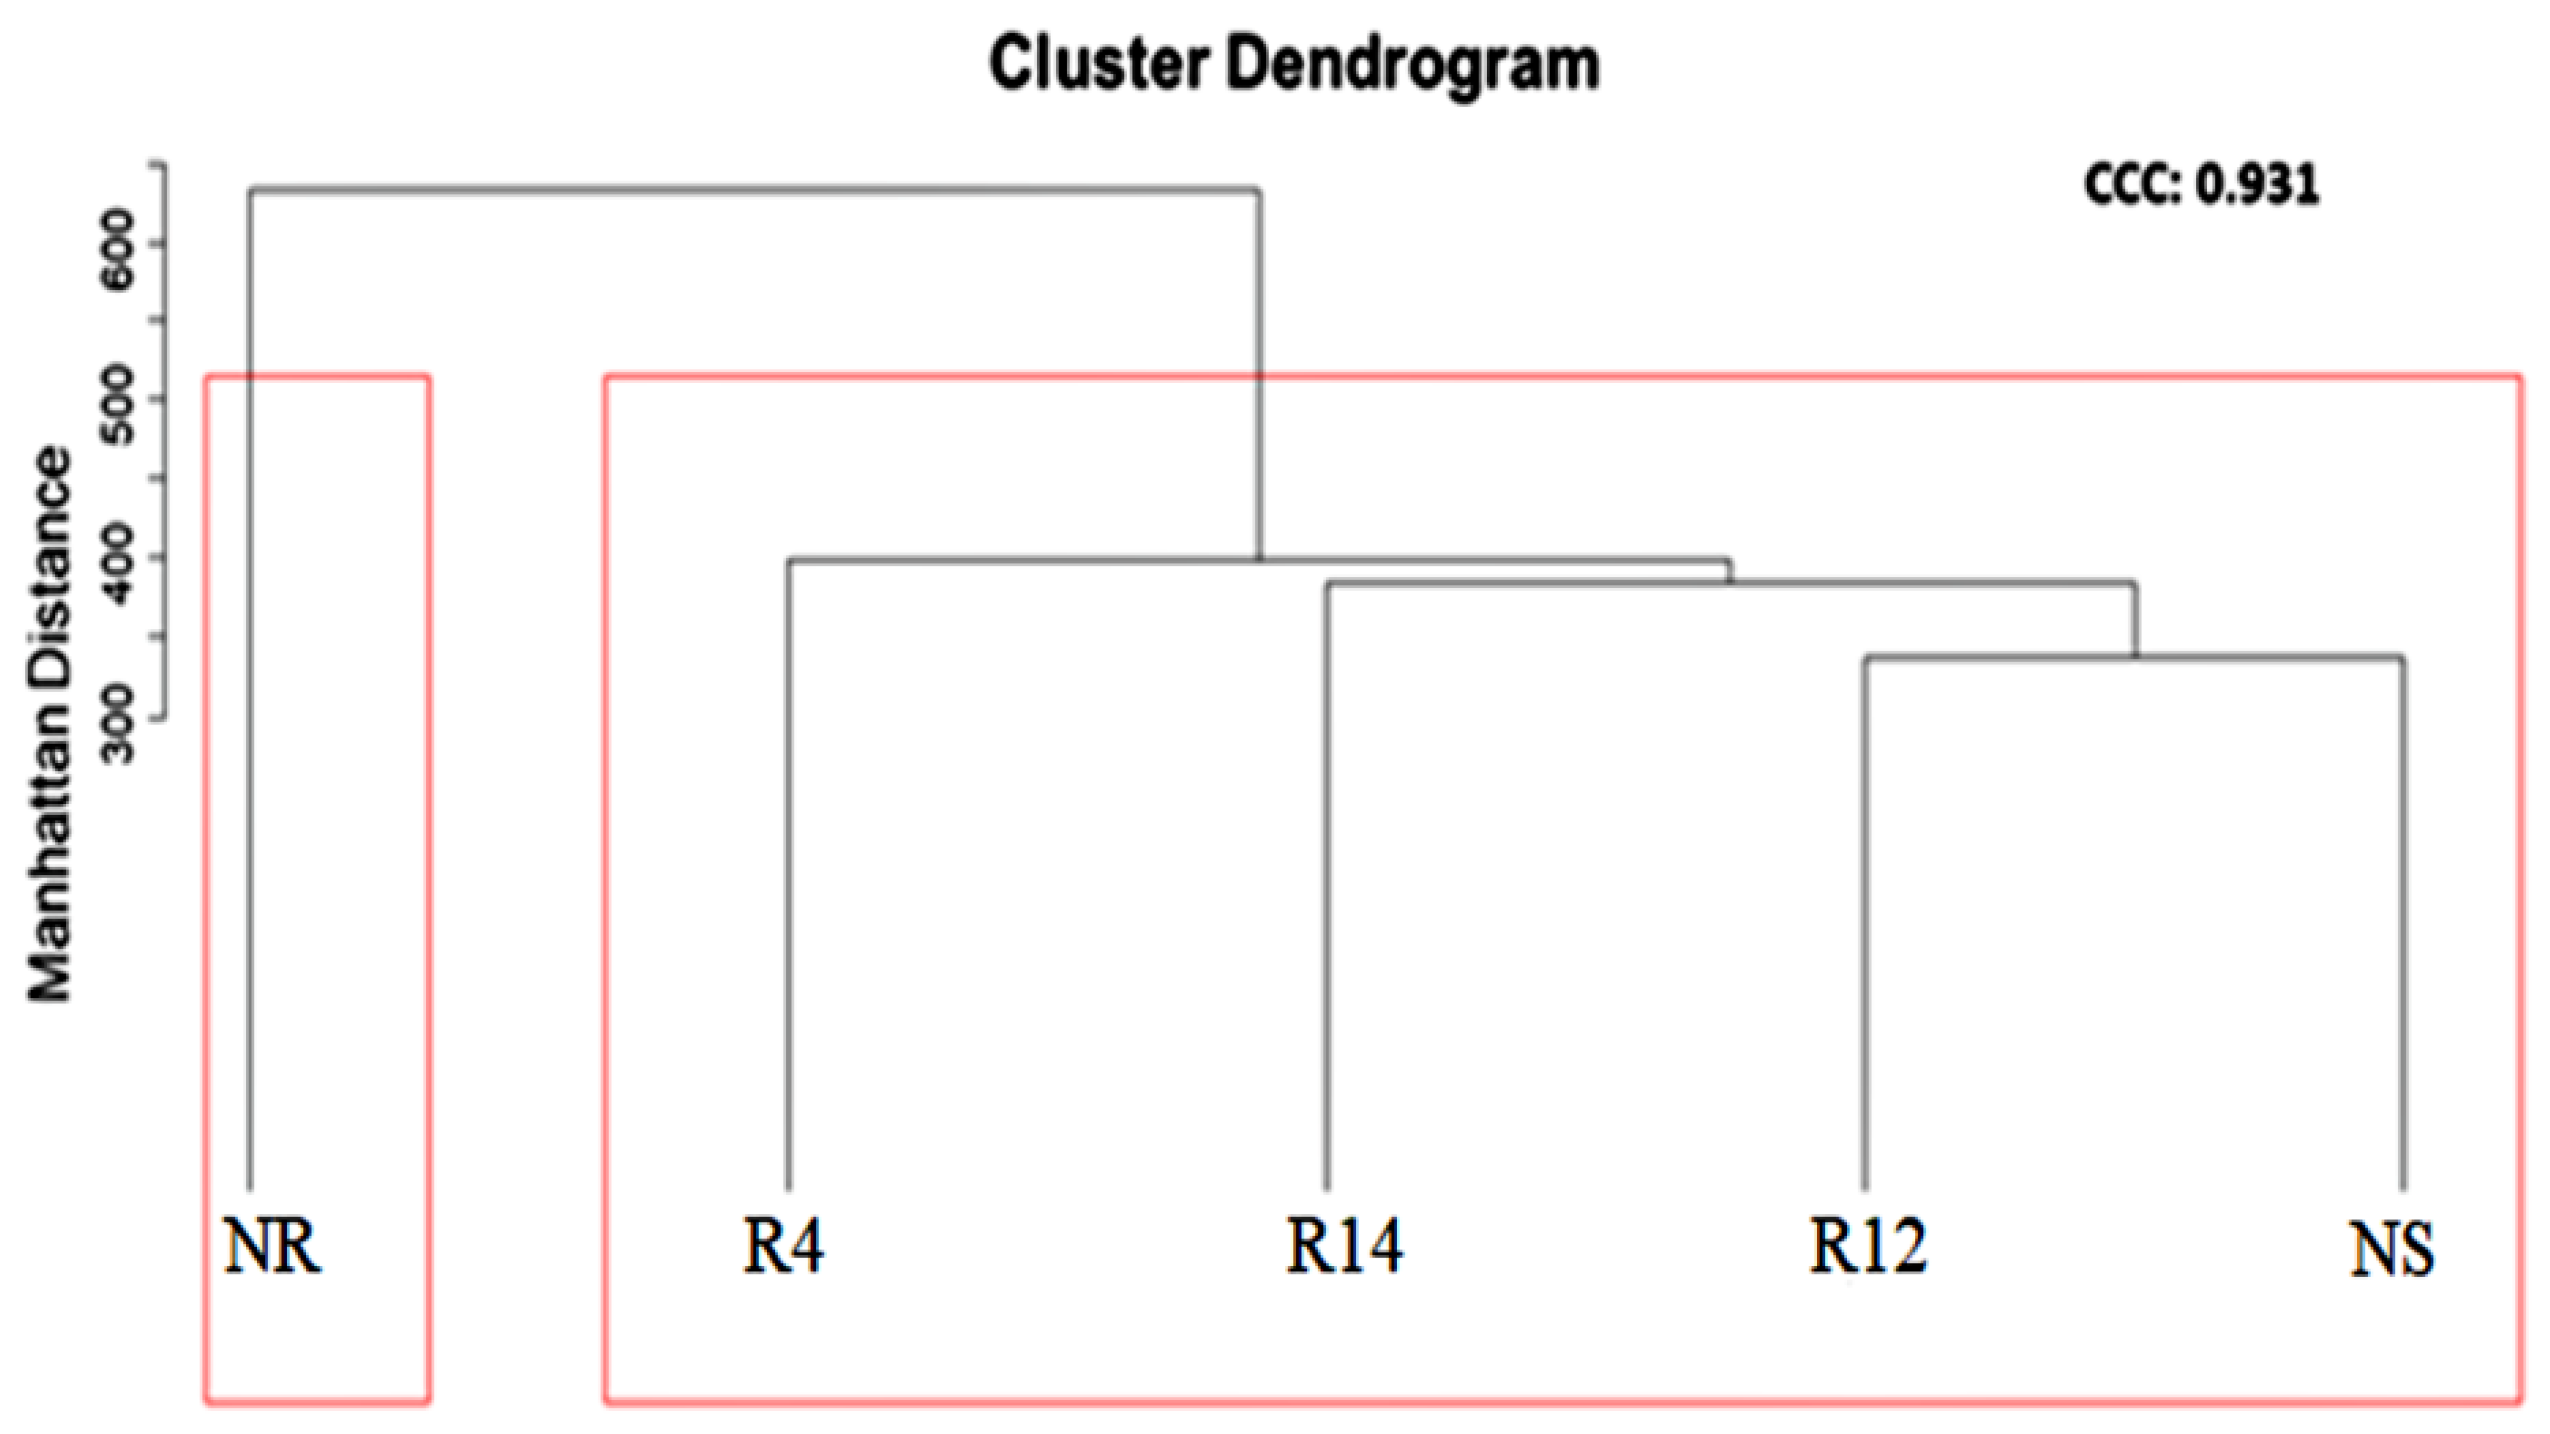
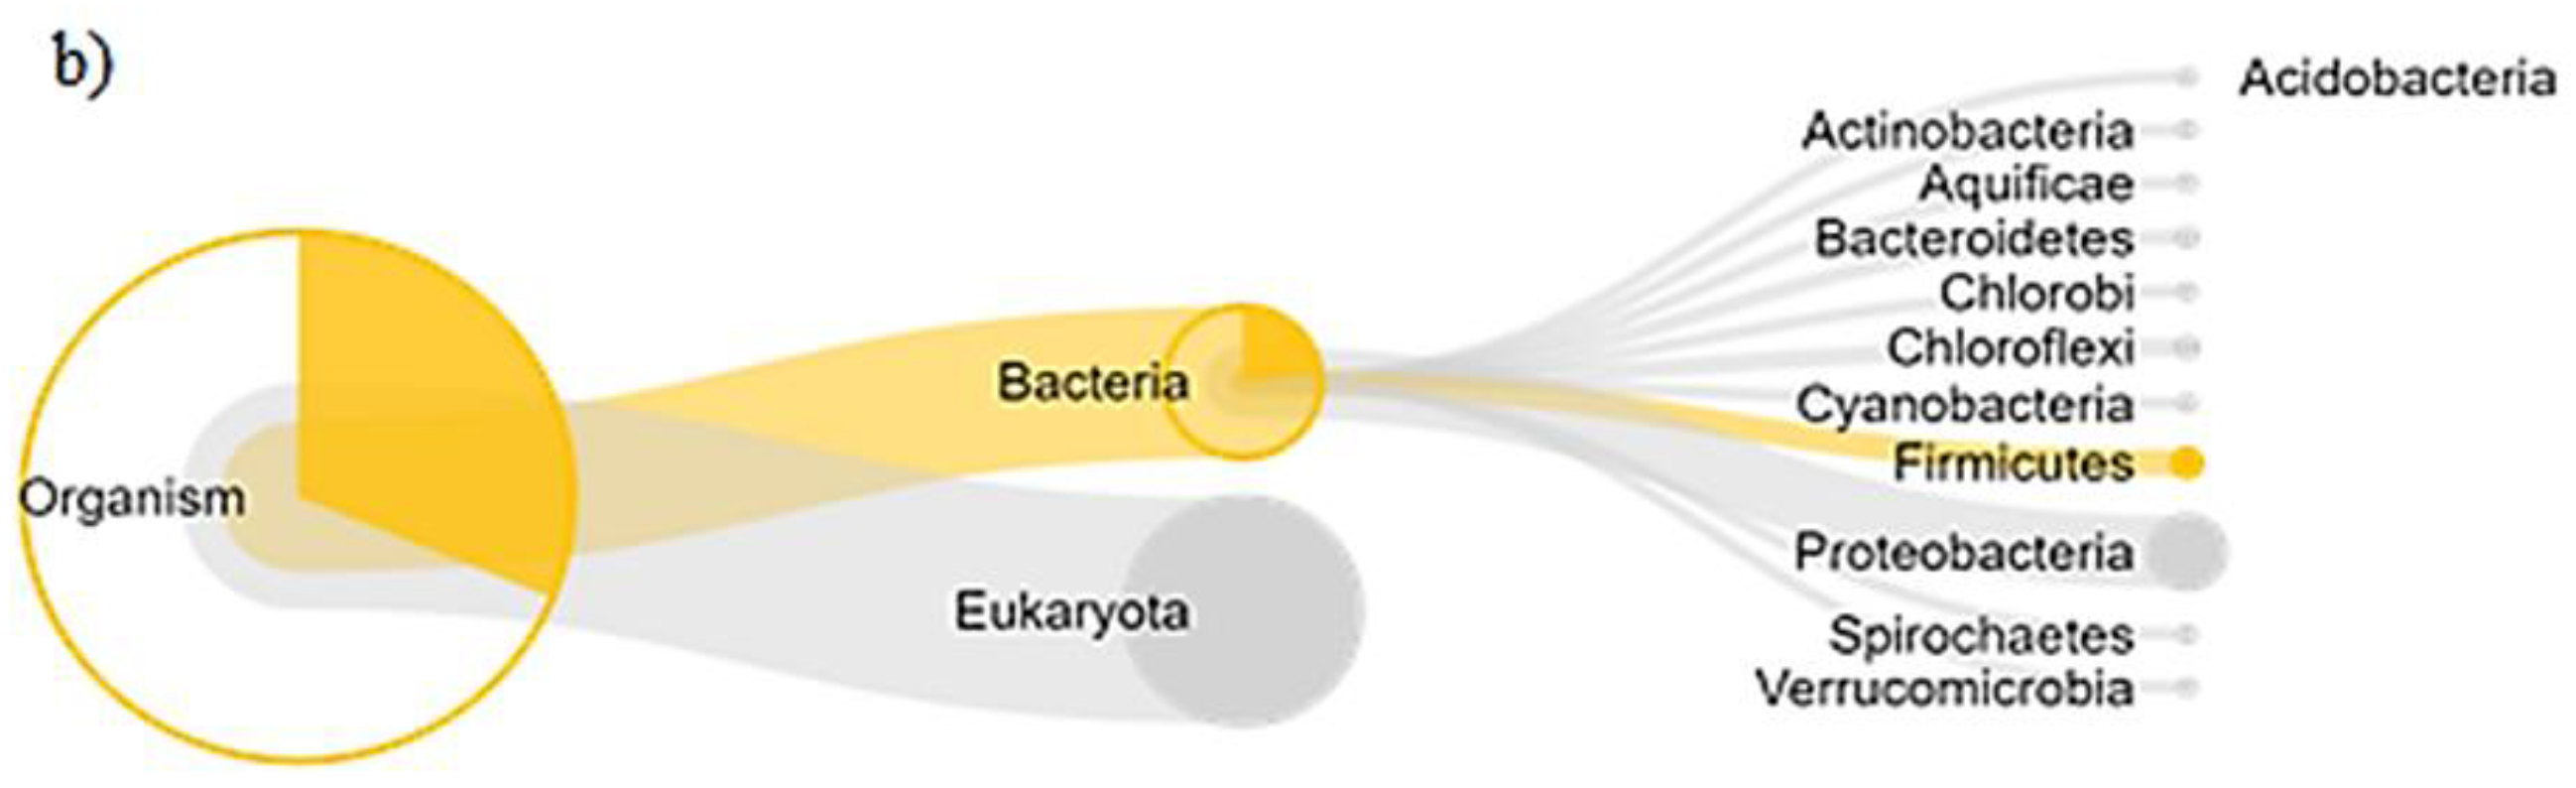
3.3. Bacterial Populations during Rehabilitation

Regarding the taxonomic classification, 29% of the peptides were assigned to bacteria, 10.9% to fungi, and 28.5% to plants; 31.6% of the peptides were not assigned to any of the three kingdoms. A detailed phylogenetic tree based on the peptide abundance in each taxonomic level is shown in Figure 3.
In the present study, 13 bacterial phyla were identified (Figure 4). Considering the removal of plant debris from the soil, low fungi abundance, and the higher proportion of peptides being associated with bacteria, we investigated the taxonomic and functional classification of bacteria in greater detail.
The results showed that the phyla Proteobacteria and Firmicutes were represented in all areas, with Proteobacteria being the most representative phylum in rehabilitation and native areas. In the non-rehabilitated site, we observed the highest number of identified peptides belonging to Firmicutes. Chlorobi, Tenericutes, and Actinobacteria completed the list of bacterial phyla identified in R14 and were also found in the reference area (Figure 4). The phyla found in rehabilitation area R12 also matched those of the NS reference, except Aquificae phylum, which was detected only in R12 and R4.
We observed greater similarities in the structure of the active bacterial community from R14 and R12 with the native soil (Figure 5). In the dendrogram, soil from rehabilitation areas and the native forest were grouped together, whilst the non-rehabilitated site was the most dissimilar soil. Considering all technical replicates, the clustering analyses of the active bacterial community show a higher similarity between the rehabilitating minelands and native soils when compared to non-rehabilitated sites (Figure S1).

3.4. Functional Similarity of Enzymes of Soil Organisms during Rehabilitation

It was possible to verify the functional similarity of the areas by using cluster analysis based on the abundance of each enzyme subclasses in the EC classification. The areas under rehabilitation grouped together with the native soil and differed significantly from the NR area, forming two groups (Figure 6). The clustering analyses of the hydrolases (Figure S2), oxidoreductases (Figure S3), or all enzymes abundance (Figure S4) confirmed the higher similarity of rehabilitating sites with native soils, such as observed in the soil bacteria taxonomic composition.
Hydrolases (EC 3.-) and oxidoreductases (EC 1.-) are the most studied classes of enzymes when evaluating SOM transformation and nutrient cycling processes [26,27]. These transformations of SOM and nutrient cycling enable the assimilation of simple molecules by microorganisms and plants through the roots [28]. Enzymes recognized in the literature for participating in nutrient cycling and SOM transformation that were found in the soils in this study are listed in Table 4. Their abundances among the rehabilitation stages can be viewed in Figures S2–S4.

4. Discussion

4.1. Higher Protein Content in the Native and Rehabilitation Stages Indicates Improvement of Soil Biological Attributes during Environmental Rehabilitation

The number of soil proteins in the rehabilitation and native areas differed significantly from that in the area without intervention (NR) (Figure 2), indicating the positive influence of the rehabilitation techniques used in the rehabilitation areas. The amelioration of environmental conditions and enhancement of the soil quality [15] may have favored the accumulation of microbial biomass [29], SOM, and therefore proteins in the soil of the rehabilitation areas. Among these techniques are topsoil (transferred from the native area to the areas under rehabilitation), fertilizers, planting of seedlings, and the sowing of native species.
The increased protein content in the soil, even in early rehabilitation (Figure 2), shows an improvement of soil biological attributes during environmental rehabilitation. Soil enzymes and microorganisms are responsive to changes in soil use and management [8], being good indicators of soil quality. The identified peptides are most related to the so-called active microbiota, which allows a better understanding of what is happening in the soils.

4.2. Bacterial Populations during Rehabilitation

The high number of identified bacterial phyla together with the high protein content and soil respiration observed in the R4 area indicate the high activity and diversity of soil microorganisms in this area. The recent rehabilitation activities carried out in this area and unoccupied niches [30,31] at the beginning of secondary succession might have driven favorable conditions for the initial development of soil microbiota.
It is likely that the increase in vegetation cover, SOM, and the stabilization of soil physical and chemical conditions throughout the rehabilitation chronosequence, have driven changes in soil microbial community, favoring taxa more adapted to local conditions. Over time, bacterial community structure became more similar to what is found in NS, which is highly desirable progress in the rehabilitation process [7,32]. Additionally, the highest abundance of Proteobacteria peptides was found in the R12, R14, and NS areas, which had greater vegetation coverage (Table 3). Indeed, there was a positive correlation of Proteobacteria abundance with LAI and SOM (Spearman’s Rank correlation coefficient ρ = 0.55 and ρ = 0.49, respectively). On the other hand, the abundance of peptides associated with the phylum Firmicutes was greater in the NR soil, followed by the early rehabilitation area. These findings agree with Banning et al. [33], who observed an increasing trend in Proteobacteria abundance and a reduction in Firmicutes abundance throughout the rehabilitation of mined areas. In addition, Sun et al. [34] found a predominance of Firmicutes in an unrecovered copper tailings area compared to revegetated areas, where a greater abundance of the phylum Proteobacteria was verified.
Bacteria of the Betaproteobacteria class were verified in the rehabilitation soils and NS (Supplementary Material S1—Figure S5), while in the NR soil, with the lowest SOM content, the presence of this bacterial class was not observed. Corroborating our findings is the discussion by Fierer et al. [35] regarding the abundance of Betaproteobacteria responding positively to higher SOM contents. It is also important to highlight some bacterial taxa related to the carbon cycle. Peptides from the phylum Chlorobi were detected in the R14 area and NS; additionally, the photosynthetic family Chlorobiaceae [36] was found in both areas and may contribute to the fixation of C in these soils. In Sun et al. [34], a predominance of the phylum Chlorobi was observed in revegetated copper mining areas compared to nonrecovered areas. In our work, this phylum was also associated with a greater abundance of vegetation, i.e., in the R14 area and NS. Furthermore, bacteria from the phylum Actinobacteria were detected in the R4, R12, and R14 rehabilitation stages, and they were also detected in NS (Figure 4); these bacteria are notable mediators in the degradation of lignin and the formation of humus [37], thus actively contributing to the increase in the soil carbon stock in the analyzed areas.
Given the biochemical processes carried out through soil bacteria and considering the increment in the SOM content and vegetation cover throughout environmental rehabilitation, we assume that the convergence of the bacterial community structure towards reference sites indicates positive progress in the ecological rehabilitation of these areas. Furthermore, the different peptide abundances of bacterial phyla between the studied areas and the presence-absence of specific groups of bacteria between the rehabilitation stages may be used as molecular indicators of environmental rehabilitation.

4.3. Protein Functional Analysis in the Community of Soil Organisms

In addition to checking for the presence of certain soil organisms, the great benefit of the metaproteomics technique is to confirm relevant ecological characteristics of these organisms by relating cellular responses to phylogenetic variations in the soil community [9]. For example, given the biological processes (Table S4) of “response to organic substances” (GO: 0010033) and “lipopolysaccharide transport” (GO: 0015920), we can describe how Betaproteobacteria (Figure 7) are responding to the SOM content in the R4 soil. On the other hand, the process “spore biosynthesis” (GO: 0030435) in Firmicutes, a phylum of greater abundance in NR soil, confirms the resistance of these bacteria to critical environments conditions [13].
Based on the clustering of enzyme abundances, the greater similarity of rehabilitating soils with native reference soil (rather than nonrehabilitated soil) may reflect the recovery of biochemical processes carried out by soil microbe enzymes since the beginning of rehabilitation. This shows that metaproteomics can detect these changes earlier when compared with SOM, LAI, or other environmental recovery indicators [6,7], such as physical and chemical soil properties [7,8].
The P700 enzyme from photosystem 1 (EC 1.97.1.12) was detected only in the NR soil, and the nitrogenase enzyme (EC 1.18.6.1) was detected only in R4. The presence of these proteins indicates an ecological adaptation of the microorganisms by fixing the elements C and N in response to the low levels of these nutrients in the NR and R4 soils [13], helping to recover the areas under rehabilitation by incorporating these elements in the soil.
In the present study, important hydrolases were found, such as cellulose hydrolysis (EC 3.2.1.4) in R4 and NS, and glycosides hydrolysis such as beta-glucosidase (EC 3.2.1.21) in NS and alpha-glucosidase (EC 3.2.1.20) in R4. The first randomly hydrolyzes the cellulose molecule, releasing oligosaccharides of varying degrees of polymerization, whereas the enzymes beta-glucosidase (EC 3.2.1.21) and alpha-glucosidase (EC 3.2.1.20) break down low-molecular-mass oligosaccharides to produce monosaccharides, the main energy source for soil microorganisms [28,38]. Thus, we can observe in the R4 and NS soils enzymes involved in the complete transformation of cellulose, an organic compound that contains a relevant C stock necessary for the growth and survival of soil microorganisms [39]. The enzyme arabinogalactan endo-beta-1,4-galactanase (EC 3.2.1.89) found in NS participates in the breakdown of hemicellulose present in the cell wall of plants [40,41], thus contributing to the carbon cycling of plant structures deposited in the soil.
The oxidoreductases lactate dehydrogenase (EC 1.1.1.8 and 1.1.2.4), glyceraldehyde-3-phosphate dehydrogenase (EC 1.2.1.12), and malate dehydrogenase (EC 1.1.1.40) found in areas NR, R4, R12, and R14, respectively, catalyze the oxidation of organic matter inside the cell participating in metabolic pathways [13]. Furthermore, dehydrogenases have been used as a general indicator of microbial activity in soils [13]. Peptidases (EC 3.4.-.-) play a relevant role in soil nitrogen mineralization by recycling the nitrogen contained in proteins available to plants and microorganisms [42,43]. The urease enzyme (EC 3.5.1.5) detected in NS is directly related to the content of SOM [44] and the activity of a wide diversity of soil microorganisms [8].
Enzymes involved in phosphorus cycling, sphingomyelin phosphodiesterase (EC 3.1.4.12), exoribonuclease II (EC 3.1.13.1), and phosphodiesterase I (EC 3.1.4.1) have been found in the R12 and R14 rehabilitation stages. These enzymes participate in nucleic acid phosphorus cycling in the case of exoribonuclease II and phospholipids in the case of the two identified phosphodiesterases [41,45], and are important indicators of the restoration of natural p cycling.
Here we present information about land rehabilitation based on the identification of proteins in a chronosequence of mineland rehabilitation. These proteins can integrate a set of indicators of environmental rehabilitation and land-use changes [16], especially concerning the recovery of essential biochemical processes that underlie soil quality and life on earth [8]. Further studies may be carried out by testing different protein extraction protocols to try to obtain greater coverage of the metaproteome of the sampled soils. These results may also be compared to a wide variety of environmental variables (e.g., soil temperature [46], soil microbial biomass [47], the metabolic coefficient (qCO2) [47], among others [46,47,48]) for the development of ecological guides that help to understand and model the responses of soil ecosystem to different land uses [10], such as mining and its rehabilitation measures.

5. Conclusions

In the analyzed sites, the soil bacterial composition tends to recover with time, being closer to the native forest than in the non-rehabilitated sites. Functional analysis of soil enzymes confirmed the higher similarity of rehabilitating sites with native reference soil, when compared to the non-rehabilitated sites, indicating the rapid recovery of soil biochemical functions such as carbon and nitrogen cycling during the progress of environmental rehabilitation. The soil metaproteomic analysis presented here showed that active mineland rehabilitation might re-establish important ecosystem processes in short periods (i.e., 4 years). Furthermore, the enzymes shown here can be used as targets in environmental monitoring in upcoming studies of landscape rehabilitation.

Supplementary Materials

The following are available online at https://www.mdpi.com/article/10.3390/f12091158/s1, Table S1: Identified proteins database, Table S2: Enzymes abundance, Table S3: Spearman’s Rank correlations between environmental variables and proteomic data obtained by Unipept 4.0 peptide analysis, Table S4: Biological processes abundance, Table S5: Peptide list used for functional and taxonomic analysis in Unipept 4.0 and Unipept Desktop, Figure S1: Bacteria taxa abundance, Figure S2: Hydrolases abundance, Figure S3: Oxidoreductases abundance, Figure S4: All enzymes abundance, Supplementary Material S1: Proteomic protocol, Peptide abundance in the phyla, classes, and order of bacteria (Figure S5).

Author Contributions

Conceptualization, F.C.T., R.B.d.S.V. and G.O.; methodology, F.C.T., M.G., S.J.R., C.F.C. and R.B.d.S.V.; software, F.C.T., R.B.d.S.V. and J.F.d.A.; validation, M.G., S.J.R., C.F.C., J.F.d.A. and R.B.d.S.V.; formal analysis, F.C.T., R.B.d.S.V. and J.F.d.A.; investigation, F.C.T., M.G., S.J.R., C.F.C. and R.B.d.S.V.; resources, G.O.; data curation, F.T and R.B.d.S.V.; writing—original draft preparation, F.C.T.; writing—review and editing, M.G., S.J.R., C.F.C. and R.B.d.S.V.; visualization, M.G., S.J.R., C.F.C., J.F.d.A. and R.B.d.S.V.; supervision, R.B.d.S.V.; project administration, G.O.; funding acquisition, G.O. All authors have read and agreed to the published version of the manuscript.

Funding

This work was carried out in the context of Canga Plant Genomics project, with funding from Vale SA (RBRS000603.85).

Data Availability Statement

Protein report and Peptide reports supporting proteomic data are available as Supplementary Material. Proteomic data can be found and downloaded at the MassIVE repository, entry MSV000087821 (ftp://massive.ucsd.edu/MSV000087821/, accessed on 15 July 2021).

Acknowledgments

FCT acknowledges a mastership scholarship from CAPES. GO is a CNPq fellow 443 (307479/2016-1) and received funding from CAPES (88887.130628/2016-00). S.J.R. also thanks a CNPq fellowship (grant number 307.166/2019-8). All authors are grateful for helpful support from the Vale Meio Ambiente team.

Conflicts of Interest

The authors declare no conflict of interest.

References

  1. Losfeld, G.; L’Huillier, L.; Fogliani, B.; Jaffré, T.; Grison, C. Mining in New Caledonia: Environmental stakes and restoration opportunities. Environ. Sci. Pollut. Res. 2014, 22, 5592–5607. [Google Scholar] [CrossRef]
  2. Gastauer, M.; Filho, P.W.M.S.; Ramos, S.J.; Caldeira, C.F.; Silva, J.R.; Siqueira, J.O.; Neto, A.E.F. Mine land rehabilitation in Brazil: Goals and techniques in the context of legal requirements. Ambio 2019, 48, 74–88. [Google Scholar] [CrossRef]
  3. Abiraami, T.V.; Singh, S.; Nain, L. Soil metaproteomics as a tool for monitoring functional microbial communities: Promises and challenges. Rev. Environ. Sci. Bio/Technol. 2020, 19, 73–102. [Google Scholar] [CrossRef]
  4. Biswas, R.; Sarkar, A. ‘Omics’ Tools in Soil Microbiology: The State of the Art. Microb. Rejuvenation Polluted Environ. 2018, 3, 35–64. [Google Scholar]
  5. Trindade, F.C.; Ramos, S.J.; Gastauer, M.; Saraiva, A.M.M.; Caldeira, C.F.; Oliveira, G.; Valadares, R.B.D.S. Metaproteomes reveal increased capacity for stress tolerance of soil microbes in ferruginous tropical rocky outcrops. Pedobiologia 2020, 81, 150664. [Google Scholar] [CrossRef]
  6. Garris, H.W.; Baldwin, S.A.; Van Hamme, J.; Gardner, W.C.; Fraser, L.H. Genomics to assist mine reclamation: A review. Restor. Ecol. 2016, 24, 165–173. [Google Scholar] [CrossRef]
  7. Li, Y.; Wen, H.; Chen, L.; Yin, T. Succession of Bacterial Community Structure and Diversity in Soil along a Chronosequence of Reclamation and Re-Vegetation on Coal Mine Spoils in China. PLoS ONE 2014, 9, e115024. [Google Scholar] [CrossRef]
  8. Cardoso, E.J.B.N.; Vasconcellos, R.L.F.; Bini, D.; Miyauchi, M.Y.H.; Dos Santos, C.A.; Alves, P.R.L.; De Paula, A.M.; Nakatani, A.S.; Pereira, J.D.M.; Nogueira, M.A. Soil health: Looking for suitable indicators. What should be considered to assess the effects of use and management on soil health? Sci. Agric. 2013, 70, 274–289. [Google Scholar] [CrossRef] [Green Version]
  9. Bastida, F.; Selevsek, N.; Torres, I.F.; Hernández, T.; García, C. Soil restoration with organic amendments: Linking cellular functionality and ecosystem processes. Sci. Rep. 2015, 5, 15550. [Google Scholar] [CrossRef] [PubMed] [Green Version]
  10. Bastida, F.; Jehmlich, N. It’s all about functionality: How can metaproteomics help us to discuss the attributes of ecological relevance in soil? J. Proteom. 2016, 144, 159–161. [Google Scholar] [CrossRef] [PubMed]
  11. Zampieri, E.; Chiapello, M.; Daghino, S.; Bonfante, P.; Mello, A. Soil metaproteomics reveals an inter-kingdom stress response to the presence of black truffles. Sci. Rep. 2016, 6, 25773. [Google Scholar] [CrossRef] [PubMed] [Green Version]
  12. Tartaglia, M.; Bastida, F.; Sciarrillo, R.; Guarino, C. Soil Metaproteomics for the Study of the Relationships Between Microorganisms and Plants: A Review of Extraction Protocols and Ecological Insights. Int. J. Mol. Sci. 2020, 21, 8455. [Google Scholar] [CrossRef] [PubMed]
  13. Bastida, F.; Hernandez, T.; García, C. Metaproteomics of soils from semiarid environment: Functional and phylogenetic information obtained with different protein extraction methods. J. Proteom. 2014, 101, 31–42. [Google Scholar] [CrossRef] [PubMed]
  14. Bastida, F.; García, C.; von Bergen, M.; Moreno, J.L.; Richnow, H.; Jehmlich, N. Deforestation fosters bacterial diversity and the cyanobacterial community responsible for carbon fixation processes under semiarid climate: A metaproteomics study. Appl. Soil Ecol. 2015, 93, 65–67. [Google Scholar] [CrossRef]
  15. Gastauer, M.; Caldeira, C.F.; Ramos, S.J.; Silva, D.F.; Siqueira, J. Active rehabilitation of Amazonian sand mines converges soils, plant communities and environmental status to their predisturbance levels. Land Degrad. Dev. 2019, 31, 607–618. [Google Scholar] [CrossRef]
  16. Gastauer, M.; Caldeira, C.F.; Ramos, S.J.; Trevelin, L.C.; Jaffé, R.; Oliveira, G.; Vera, M.P.O.; Pires, E.; Santiago, F.L.D.A.; Carneiro, M.A.C.; et al. Integrating environmental variables by multivariate ordination enables the reliable estimation of mineland rehabilitation status. J. Environ. Manag. 2020, 256, 109894. [Google Scholar] [CrossRef]
  17. Viana, P.L.; Mota, N.F.D.O.; Gil, A.D.S.B.; Salino, A.; Zappi, D.; Harley, R.M.; Ilkiu-Borges, A.L.; Secco, R.; Almeida, T.E.; Watanabe, M.; et al. Flora das cangas da Serra dos Carajás, Pará, Brasil: História, área de estudos e metodologia. Rodriguésia 2016, 67, 1107–1124. [Google Scholar] [CrossRef]
  18. Instituto Brasileiro de Geografia e Estatística—IBGE. Manual Técnico da Vegetação Brasileira. Manuais Téc. Geociênc. 2012, 2, 275. [Google Scholar]
  19. Donagema, G.K.; Campos, D.V.B.; Calderano, S.B.; Teixeira, W.G.; Viana, J.H.M. Manual de Métodos de Análise do Solo, 2nd ed.; Centro Nacional de Pesquisa de Solos: Rio de Janeiro, Brazil, 2011. [Google Scholar]
  20. Wang, W.; Vignani, R.; Scali, M.; Cresti, M. A universal and rapid protocol for protein extraction from recalcitrant plant tissues for proteomic analysis. Electrophoresis 2006, 27, 2782–2786. [Google Scholar] [CrossRef]
  21. Nascimento, S.V.D.; Magalhães, M.M.; Cunha, R.L.; Costa, P.H.D.O.; Alves, R.C.D.O.; De Oliveira, G.C.; Valadares, R.B.D.S. Differential accumulation of proteins in oil palms affected by fatal yellowing disease. PLoS ONE 2018, 13, e0195538. [Google Scholar] [CrossRef] [Green Version]
  22. Searle, B.C. Scaffold: A bioinformatic tool for validating MS/MS-based proteomic studies. Proteomics 2010, 10, 1265–1269. [Google Scholar] [CrossRef]
  23. Nesvizhskii, A.I.; Keller, A.; Kolker, E.; Aebersold, R. A Statistical Model for Identifying Proteins by Tandem Mass Spectrometry abilities that proteins are present in a sample on the basis. Anal. Chem. 2003, 75, 4646–4658. [Google Scholar] [CrossRef] [PubMed]
  24. Mesuere, B.; Debyser, G.; Aerts, M.; Devreese, B.; Vandamme, P.; Dawyndt, P. The Unipept metaproteomics analysis pipeline. Proteomics 2015, 15, 1437–1442. [Google Scholar] [CrossRef] [PubMed]
  25. Verschaffelt, P.; Bossche, T.V.D.; Martens, L.; Dawyndt, P.; Mesuere, B. Unipept Desktop: A Faster, More Powerful Metaproteomics Results Analysis Tool. J. Proteome Res. 2021, 20, 2005–2009. [Google Scholar] [CrossRef] [PubMed]
  26. Miralles, I.; Domingo, F.; Cantón, Y.; Trasar-Cepeda, C.; Leirós, M.C.; Gil-Sotres, F. Hydrolase enzyme activities in a successional gradient of biological soil crusts in arid and semi-arid zones. Soil Biol. Biochem. 2012, 53, 124–132. [Google Scholar] [CrossRef]
  27. Bautista-Cruz, A.; Ortiz-Hernández, Y.D. Hydrolytic soil enzymes and their response to fertilization: A short review. Comun. Sci. 2015, 6, 255. [Google Scholar] [CrossRef]
  28. Zago, L.D.M.S.; Oliveira, R.N.; Bombonatto, A.K.G.; Moreira, L.M.D.O.; Melo, E.N.D.P.; Caramori, S.S. Enzimas Extracelulares de Solos de Cerrado como Bioindicadores de Qualidade em Áreas Agricultáveis em Goiás, Brasil. Front. J. Soc. Technol. Environ. Sci. 2016, 5, 104–127. [Google Scholar] [CrossRef]
  29. Starke, R.; Jehmlich, N.; Bastida, F. Using proteins to study how microbes contribute to soil ecosystem services: The current state and future perspectives of soil metaproteomics. J. Proteom. 2019, 198, 50–58. [Google Scholar] [CrossRef]
  30. Lekevičius, E. Vacant niches in nature, ecology, and evolutionary theory: A mini-review. Ekologija 2009, 55, 165–174. [Google Scholar] [CrossRef]
  31. Yang, Y.; Weiner, J.; Wang, G.; Ren, Z. Convergence of community composition during secondary succession on Zokor rodent mounds on the Tibetan Plateau. J. Plant Ecol. 2017, 11, 453–464. [Google Scholar] [CrossRef] [Green Version]
  32. Gastauer, M.; Silva, J.R.; Junior, C.F.C.; Ramos, S.J.; Souza-Filho, P.W.M.; Neto, A.E.F.; Siqueira, J.O. Mine land rehabilitation: Modern ecological approaches for more sustainable mining. J. Clean. Prod. 2018, 172, 1409–1422. [Google Scholar] [CrossRef]
  33. Banning, N.C.; Gleeson, D.; Grigg, A.H.; Grant, C.D.; Andersen, G.; Brodie, E.L.; Murphy, D.V. Soil Microbial Community Successional Patterns during Forest Ecosystem Restoration. Appl. Environ. Microbiol. 2011, 77, 6158–6164. [Google Scholar] [CrossRef] [Green Version]
  34. Sun, X.; Zhou, Y.; Tan, Y.; Wu, Z.; Lu, P.; Zhang, G.; Yu, F. Restoration with pioneer plants changes soil properties and remodels the diversity and structure of bacterial communities in rhizosphere and bulk soil of copper mine tailings in Jiangxi Province, China. Environ. Sci. Pollut. Res. 2018, 25, 22106–22119. [Google Scholar] [CrossRef]
  35. Fierer, N.; Bradford, M.; Jackson, R.B. Toward an Ecological Classification of Soil Bacteria. Ecology 2007, 88, 1354–1364. [Google Scholar] [CrossRef]
  36. Madigan, M.T.; Schaaf, N.A.V.; Sattley, W.M. The Chlorobiaceae, Chloroflexaceae, and Heliobacteriaceae. In Modern Topics in the Phototrophic Prokaryotes; Springer Science and Business Media LLC: Berlin, Germany, 2017; pp. 139–161. [Google Scholar]
  37. Eisenlord, S.; Zak, D. Simulated Atmospheric Nitrogen Deposition Alters Actinobacterial Community Composition in Forest Soils. Soil Biol. Biochem. 2009, 74, 1157–1166. [Google Scholar] [CrossRef] [Green Version]
  38. Castro, A.M.D.; Junior, N.P. Produção, propriedades e aplicação de celulases na hidrólise de resíduos agroindustriais. Quim. Nova 2010, 33, 181–188. [Google Scholar] [CrossRef]
  39. Makoi, J.H.; Ndakidemi, P.A. Selected soil enzymes: Examples of their potential roles in the ecosystem. Afr. J. Biotechnol. 2008, 7, 3. [Google Scholar]
  40. Shallom, D.; Shoham, Y. Microbial hemicellulases. Curr. Opin. Microbiol. 2003, 6, 219–228. [Google Scholar] [CrossRef]
  41. Yao, Q.; Li, Z.; Song, Y.; Wright, S.J.; Guo, X.; Tringe, S.G.; Tfaily, M.M.; Paša-Tolić, L.; Hazen, T.C.; Turner, B.L.; et al. Community proteogenomics reveals the systemic impact of phosphorus availability on microbial functions in tropical soil. Nat. Ecol. Evol. 2018, 2, 499–509. [Google Scholar] [CrossRef] [Green Version]
  42. Bach, H.-J.; Munch, J.C. Identification of bacterial sources of soil peptidases. Biol. Fertil. Soils 2000, 31, 219–224. [Google Scholar] [CrossRef]
  43. Vranova, V.; Rejsek, K.; Formánek, P. Proteolytic activity in soil: A review. Appl. Soil Ecol. 2013, 70, 23–32. [Google Scholar] [CrossRef]
  44. Adetunji, A.T.; Lewu, F.; Mulidzi, R.; Ncube, B. The biological activities of β-glucosidase, phosphatase and urease as soil quality indicators: A review. J. Soil Sci. Plant Nutr. 2017, 17, 794–807. [Google Scholar] [CrossRef] [Green Version]
  45. Carter, D.O.; Yellowlees, D.; Tibbett, M. Autoclaving kills soil microbes yet soil enzymes remain active. Pedobiologia 2007, 51, 295–299. [Google Scholar] [CrossRef]
  46. Bastida, F.; Crowther, T.W.; Prieto, I.; Routh, D.; García, C.; Jehmlich, N. Climate shapes the protein abundance of dominant soil bacteria. Sci. Total. Environ. 2018, 640, 18–21. [Google Scholar] [CrossRef] [PubMed]
  47. Malik, A.A.; Puissant, J.; Buckeridge, K.; Goodall, T.; Jehmlich, N.; Chowdhury, S.; Gweon, H.S.; Peyton, J.M.; Mason, K.E.; Van Agtmaal, M.; et al. Land use driven change in soil pH affects microbial carbon cycling processes. Nat. Commun. 2018, 9, 3591. [Google Scholar] [CrossRef]
  48. Schneider, T.; Keiblinger, K.M.; Schmid, E.; Sterflinger-Gleixner, K.; Ellersdorfer, G.; Roschitzki, B.; Richter, A.; Eberl, L.; Zechmeister-Boltenstern, S.; Riedel, K. Who is who in litter decomposition? Metaproteomics reveals major microbial players and their biogeochemical functions. ISME J. 2012, 6, 1749–1762. [Google Scholar] [CrossRef] [PubMed] [Green Version]
Figure 1. (a) A hexagonal spot points to the Carajás National Forest, Parauapebas—PA, Brazil. (b) Five spots show where a sample of each rehabilitation stage was collected; the image was taken from 1.726 m altitude. Google Earth images. For the site codes, please refer to Table 2.
Forests 12 01158 g001
Figure 2. Amount of proteins identified by rehabilitation stage. According to the Tukey test, data followed by the same letter do not differ significantly (p < 0.05).
Forests 12 01158 g002
Figure 3. Peptide-based dendrogram constructed by Unipept 4.0 using all peptides with protein matches in this study. The phylogenetic tree was constructed using the lowest common ancestor (LCA) method. The circles’ sizes refer to the peptide abundance for each taxonomic level.
Forests 12 01158 g003
Figure 4. Relative abundance of peptides per phylum of bacteria in soils from each rehabilitation stage. It was built on peptides data obtained from the Unipept 4.0 software.
Forests 12 01158 g004
Figure 5. Clustering based on the relative abundance of peptides from bacterial phyla. The Bray−Curtis distance index was used, cophenetic correlation coefficient (CCC) = 0.996. Heatmap function in R. The color scale shows the phyla abundance between areas.
Forests 12 01158 g005
Figure 6. Area clustering based on enzyme abundance distributed in EC number subclasses (level 2) was built with the Manhattan distance index using the hclust function in R software. A cutoff was determined to separate the areas into two groups. Cophenetic correlation coefficient = 0.931.
Forests 12 01158 g006
Figure 7. Unipept treeview examples of detected biological processes that can confirm ecological attributes of some bacteria taxa. The highlighted part shows detected peptides related to a specific biological process. (a) Lipopolysaccharide transport (GO: 0015920) and “response to organic substances” (GO: 0010033) detected in Betaproteobacteria in R4 soil; (b) “spore biosynthesis” (GO: 0030435) detected in Firmicutes in R4 soil.
Forests 12 01158 g007aForests 12 01158 g007b
Table 1. Summary of the rehabilitation techniques employed in the three rehabilitation stages.
Rehabilitation TechniquesDescription
LimingStudy sites were limed, 1.5 t of dolomitic lime per ha, 45 days before planting
PlantingSeeds and seedlings from 15 to 20 native species, comprising both pioneer and nonpioneer species, were planted at a planting density of 1700 seedlings/ha
Fertilizing300 g of NPK fertilizer (4-14-8)
enriched with fritted glass material (FTE BR 12 containing the micronutrients S, B, Cu, Mn, and Zn) and 1 kg of dried manure were applied
OtherUntil canopy closure, the herbaceous layer surrounding the seedlings was mowed every three to four months
Table 2. Geographic location, rehabilitation stage, and timing of the initiation of rehabilitation activities of the study sites.
Study SiteRehabilitation StageOnset of Rehabilitation ActivitiesLatitudeLongitude
NRNonrehabilitated-−6.09634−50.2279
R4Early rehabilitation (4 years)2014−6.09711−50.2286
R12Intermediate rehabilitation
(12 years)
2006−6.09613−50.2288
R14Advanced rehabilitation
(14 years)
2004−6.09821−50.2303
NSNative soil (reference)-−6.09821−50.2308
Table 3. Mean and standard deviation of environmental variables analyzed in this work for each rehabilitation stage. Means followed by the same letter did not differ significantly in the Tukey test (p < 0.05).
Rehabilitation StageSOM (%)LAISoil Respiration (µmol CO2 m−2 s−1)
NR0.833 ± 0.272 b0.274 ± 0.007 d1.121 ± 0.354 b
R41.097 ± 0.197 b0.579 ± 0.469 d4.896 ± 1.985 a
R122.343 ± 0.511 a3.105 ± 0.387 c2.887 ± 0.710 a,b
R141.917 ± 0.211 a4.650 ± 0.217 b4.654 ± 1.334 a
NS2.453 ± 0.133 a5.513 ± 0.292 a3.690 ± 0.431 a,b
SOM: soil organic matter; LAI: leaf area index.
Table 4. Enzymes involved in nutrient cycling and SOM transformation found in the present study.
Name (EC Number)FunctionEcological SignificanceRehabilitation Stage
Photosystem I (1.97.1.12)Carbon fixationCarbon fixation by cyanobacteria in the poorest SOM content areaNR
D-lactate dehydrogenase (1.1.1.28)Transformation of organic matterTransformation of organic matter through microbial metabolismNR
(1.1.2.4) R4
Peptidases (3.4.-.-)Hydrolysis of peptides to amino acidsMineralization/Nitrogen cyclingNR, R4, R12, R14, NS
Cysteine endopeptidases (3.4.22.-)Hydrolysis of peptides to amino acidsNitrogen cyclingR4, R12
Aminopeptidases (3.4.11.-)Hydrolysis of peptides to amino acidsNitrogen cyclingR4, R14, NS
Serine endopeptidases (3.4.21.-)Hydrolysis of peptides to amino acidsNitrogen cyclingNR, R4, R12, R14, NS
Metallocarboxypeptidases (3.4.17.-)Hydrolysis of peptides to amino acidsNitrogen cyclingR12, R14
Dipeptidyl-peptidase (3.4.14.-)Hydrolysis of peptides to amino acidsNitrogen cyclingR12
Metalloendopeptidases (3.4.24.-)Hydrolysis of peptides to amino acidsNitrogen cyclingR14, NS
Omega peptidase (3.4.19.-)Hydrolysis of peptides to amino acidsNitrogen cyclingNS
Aspartic endopeptidase (3.4.23.-)Hydrolysis of peptides to amino acidsNitrogen cyclingNS
Nitrogenase (1.18.6.1)Converts N2 to NH3Nitrogen fixation in the early rehabilitation area, with low SOM content. Nitrogen cycling.R4
Beta-amylase (3.2.1.2)Hydrolysis of (1->4)-alpha-d-glucosidic linkages in polysaccharidesCarbon cyclingR4
Sulfate adenylyltransferase (2.7.7.4)Participates in assimilatory sulfate reductionSulfur cyclingR4
Cellulase (3.2.1.4)Cellulose degradation with release of glucoseCarbon cyclingR4, NS
Alpha-glucosidase (3.2.1.20)Catalyzes the hydrolysis of o-glycosyl bonds in hemicelluloseCarbon cyclingR4
Glyceraldehyde-3-phosphate dehydrogenase (1.2.1.12)Transformation of organic matterTransformation of organic matter through microbial metabolismR12
Sphingomyelin phosphodiesterase (3.1.4.12)Phospholipase activityPhosphorus cyclingR12
Malate dehydrogenase (1.1.1.40)Transformation of organic matterTransformation of organic matter through microbial metabolismR14
Exoribonuclease II (3.1.13.1)Exonucleolytic cleavage to yield nucleoside 5′-phosphatesPhosphorus cyclingR14, NS
Phosphodiesterase I (3.1.4.1)Hydrolyses both ribonucleotides and deoxyribonucleotidesPhosphorus cyclingR14
Arabinogalactan endo-beta-1,4-galactanase (3.2.1.89)Hydrolyses (1->4)-beta-d-galactosidic linkagesCarbon cyclingNS
Urease (3.5.1.5)Organic N mineralization to ammoniaNitrogen cyclingNS
Beta-glucosidase (3.2.1.21)Hydrolyzes maltose and cellobiose to glucoseCarbon cyclingNS
NR: nonrehabilitated; R4: early rehabilitation (4 years); R12: intermediate rehabilitation (12 years); R14: advanced rehabilitation (14 years); NS: native soil.
Publisher’s Note: MDPI stays neutral with regard to jurisdictional claims in published maps and institutional affiliations.

