Article

Bioclimatic Suitability of Actual and Potential Cultivation Areas for Jacaranda mimosifolia in Chinese Cities

1
Landscape Department, College of Coastal Agricultural Sciences, Guangdong Ocean University, Zhanjing 524088, China
2
China Eucalypt Research Centre, Chinese Academy of Forestry, Zhanjiang 524022, China
3
Department of Social Sciences, Education University of Hong Kong, Tai Po, Hong Kong, China
4
Key Laboratory for Forensic Technology of Wildlife, State Forestry Administration, Nanjing Forest Police College, Nanjing 210023, China
*
Authors to whom correspondence should be addressed.
Forests 2021, 12(7), 951; https://doi.org/10.3390/f12070951
Submission received: 1 June 2021 / Revised: 8 July 2021 / Accepted: 15 July 2021 / Published: 19 July 2021
(This article belongs to the Section Urban Forestry)

Abstract

:
Jacaranda mimosifolia is regarded as a prized ornamental tree in the urban landscape with attractive, abundant and long-lasting violet-colored flowers and graceful tree form. It has been widely cultivated in recent years in many Chinese cities. However, the lack of scientific and practical guidance to cultivate the exotic species has brought about planting failures in some areas, incurring substantial economic losses and landscape decline. A comprehensive understanding of the current spatial pattern and climatic conditions of J. mimosifolia in China can inform species choice, planting and management. We collected data on the geographical coordinates of 257 planting cities and acquired additional information from the literature and field surveys. The limiting factors for cultivation were investigated using principal component analysis (PCA) of 19 bioclimatic parameters of the sampled sites. The potentially suitable habitats were predicted by BIOCLIM modeling using eight selected ecological-important climatic parameters. We found that the present cultivated areas were focused in the low-altitude parts of the subtropical zone, mainly covering the provinces of Yunnan, Sichuan, Guangxi, Guangdong and Fujian. The PCA results indicated that temperature was the clinching determinant of the current cultivation patterns, especially annual mean temperature, the minimum temperature of the coldest month and the mean temperature of the warmest quarter. Moisture was a necessary but not critical secondary factor. The predicting model for potential habitats was graded as “excellent” by objective validation measures. The findings can provide science-based evidence to plan the expansion of the biogeographical range of cultivation into hitherto unplanted cities and rationalize urban tree introduction and management practices.

1. Introduction

The introduction of landscape trees for urban greening can enrich the local plant diversity and improve the environmental quality [1,2,3]. Most introduced trees have been chosen for their ornamental traits to enhance the urban landscape and define the landscape character of neighborhoods and roads. Notable cases include the cherries (Cerasus yedoensis ((Matsum.) A.N. Vassiljeva) and Cerasus serrulata ((Lindl.) Loudon ‘Kanzan’) of the Central Park in New York, the ginkgoes (Ginkgo biloba L.) of the Yoyogi Park in Tokyo, the London planes (Platanus acerifolia (Aiton) Willd.) of Nanjing’s main streets and the rain trees (Albizia saman (Jacq.) Merr.) of the East Coast Parkway of Singapore. These tree groups constitute the signature ingredients of the urban landscape and contribute to maintaining the urban ecosystem [4,5].
Global environmental change, especially urbanization, has induced considerable reorganization of the world’s biota patterns. Deliberate species movements and introductions have brought benefits and harms to the local and regional ecology. The age of colonization, global trade and transport of goods and people ushered in massive transfers and exchanges of flora between regions near and far. Such spatial shifts will become increasingly necessary due to continued population and urban growth [6,7]. The preference for non-natives could raise the proportion of exotic species, especially in cities [4,8,9,10]. From conceptual and practice perspectives, it is helpful to address the key ecological and arboricultural issues engendered in the alien tree cohort [11,12]. Such knowledge could enhance the beneficial ecological, landscape and amenity tree functions, and inform the choice and care of exotic trees.
Compared with the breeding of new varieties, tree introduction can provide benefits quickly [13]. To successfully establish an alien plant outside its natural range, both intrinsic and extrinsic factors must be considered. It is important to find a reasonably good match between the natural ecological amplitude of the introduced species and the recipient areas’ environmental conditions [7,14]. Selecting species to tackle local environmental stresses could reduce management burdens and enhance benefits [15,16]. Temperature and precipitation are significant determinants of macro-scale biogeographical distributions. In urban areas, the minimum annual temperature can restrict the distribution of tree species, whereas the precipitation deficit could be offset by irrigation [17]. The low-temperature threshold apparently sets the latitudinal limit for urban trees. However, the continued poleward migration of hardiness zones in response to recent climate change has altered opportunities for ornamental trees [18]. Species with limited latitudinal spread could benefit from an expanded potential biogeographical range [19]. Urban tree establishment has been delimited by the minimum temperature of the coldest month [20], the average temperature of the coldest month and the sum of negative temperatures [21]. Plant introduction experience and theory [22] call for assessing the environmental conditions of the recipient areas to reduce establishment failure and economic loss.
Methods of evaluating tree suitability to the climate of the destination site have been earnestly studied [13,15,16]. Climate can allow the analysis of species distribution patterns using ecologically important bioclimatic indicators [17,18,19]. These include single indicators such as annual mean temperature, coldest and hottest monthly mean temperature, extreme low temperature, annual precipitation, seasonal precipitation, etc. [20,21,22]. Composite climate indices have also been applied, such as Penman’s, Thornthwaite’s, Holdridge’s and Kira’s [23,24]. A comprehensive analysis of the target plant’s climatic amplitude and tolerance range can inform an effective introduction strategy. GIS technology offers a powerful tool for analyzing spatial data, patterns and relationships [17,25,26,27]. The current species distribution models mainly include BIOCLIM, Ecological Niche Factor Analysis (ENFA), Maximum Entropy (MaxEnt) and Genetic Algorithm for Rule-set Production (GARP) [28,29], and each has certain preferences [28,30,31,32]. BIOCLIM is an envelope-style method that defines a multi-dimensional environmental space where a species can occur using only occurrence data [33]. Since BIOCLIM is supported by DIVA-GIS [26], it has been widely used in species distribution modeling research [33,34,35].
Jacaranda mimosifolia D. Don in Bignoniaceae, commonly known as jacaranda, blue jacaranda, black poui or fern tree, is native to subtropical south-central South America (especially in Argentina, Bolivia and Southern Brazil) [36]. The deciduous tree, reaching 20 m in height, produces attractive, abundant and long-lasting violet-colored flowers in late spring to early summer. Accompanied by graceful bipinnate compound leaves and elegant tree form, it has been widely cultivated in the warmer parts of the world [37]. At present, the research on jacaranda has mainly concentrated on its use as a garden ornamental [38], cultivation [39], propagation [40,41,42], environmental tolerance [43], phytochemistry [44], medicinal use [45,46], ecological function [47] and environmental monitoring applications [47,48].
In recent years, J. mimosifolia has become a favorite garden and urban greening tree in China (Figure 1). Every year, the media rush to report its charming blooms. Unfortunately, the introduction of J. mimosifolia to some Chinese cities was not preceded by an ecological suitability analysis. Cases of mismatch have led to tree failure and substantial economic waste. There is no documentation of the year when J. mimosifolia was introduced into China. Based on our age estimation of the large trees, the species has been cultivated in China for at least 80 years. Most trees would have adapted to the climate in current cultivated areas of China. In this study, we investigated three issues: (1) the current distribution of cultivated areas in China, (2) limiting climatic factors in cultivated areas, and (3) suitable cultivation areas. The study results could provide a scientific basis to expand its cultivation to its potential biogeographical range and ensure good performance in other Chinese cities.

2. Materials and Methods

2.1. Data Sources

The geographical distribution records of J. mimosifolia were collected from several sources (at the county level), including NSII (National Specimen Information Infrastructure, http://www.nsii.org.cn/2017/) (accessed on 5 January 2020), GBIF (the Global Biodiversity Information Facility, https://www.gbif.org/zh/) (accessed on 5 January 2020), relevant literature and documents (from government departments), and our field surveys in 2012–2020. After removing ambiguous or repetitive data, 257 planting cities of J. mimosifolia in total were kept for subsequent analyses. All distribution records were converted to digital geographic coordinates (WGS-84) by LocaSpace Viewer v 4.05, generating a comprehensive current distribution map of cultivation in China (Figure 2).
Data for 19 bioclimatic variables (2.5 min resolution) were extracted from DIVA-GIS 7.5, the database of which was provided by WorldClim (http://www.worldclim.org) (accessed on 14 August 2020) [49]. Temperature and precipitation characteristics and their seasonal variations can be derived or computed from the environmental variables of WorldClim, which have been widely used in predicting potential species distributions [21]. These are ecologically important variables that can explain annual trends, seasonality and species adaptation to temperature and precipitation extremes [17]. These variables may also be used to characterize the distribution of species at larger scales such as continental [50]. Meanwhile, basic climate data, including annual mean temperature, extreme high temperature, extreme low temperature, annual precipitation, monthly average precipitation, etc., were gathered from the China Meteorological Data Service Centre (CMDSC) (http://data.cma.cn) (accessed on 15 December 2020) and local government websites.

2.2. Variable Selection

Some of the 19 bioclimatic variables are likely to be correlated with each other. Their Pearson correlation coefficients (r) were tested for multicollinearity to avoid highly correlated variables (r = 1, r = −1, r = 0 denote completely positive, negative and no correlation, respectively) [51,52]. All pairs with r < 0.80 were selected, and those with r > 0.80 were selected only for ecological importance [27]. Finally, 8 bioclimatic variables were enlisted to predict the suitability of J. mimosifolia planting in China (Table 1).
However, all 19 bioclimatic variables were used in the principal component analysis (PCA) to explore the climatic limitations of the current cultivated distribution. As the different scales of the initial variables could affect the PCA results, the variables were z-standardized [53]. The main climatic factors were determined by the results of the PCA regarding the top four climatic variables of PC1 and PC2.

2.3. Bioclimatic Indices

Species distribution areas are principally governed by thermal and hydric parameters [54]. The bioclimatic characterization was conducted using Kira’s warmth index (WI) [55,56], Kira’s coldness index (CI) [57,58], and Holdridge’s annual biotemperature (ABT) [59,60] and aridity index (AI) [61,62]. Using these more complex or compound bioclimatic indices can avoid the inconsistencies caused by simple parameters like mean annual temperature and annual precipitation. Their equations are:
Kira’s Warmth Index: WI = ∑(Ti − 10) (Ti > 10 °C)
Kira’s Coldness Index: CI = ∑(10 − Ti) (Ti < 10 °C)
Holdridge annual biotemperature: ABT = ∑Ti/12 (0 °C < Ti < 30 °C)
Aridity index: AI = MAP/(MAT + 33)
Biological aridity/humidity index: BK = MAP/(WI + 40) (WI ≤ 80 mm/°C.month) or
BK = 2 MAP/(WI + 120) (WI > 80mm/°C.month)
where Ti refers to the monthly mean temperature (°C), and MAT and MAP denote mean annual temperature (°C) and mean annual precipitation (mm), respectively.
Kira’s model is well suited to the vegetation of the temperate and sub-frigid zones [63]. According to the distribution status of forests in China, the model was modified by raising the biological temperature from 5 °C to 10 °C [64]. The modified model, with a better simulation effect on the vegetation in subtropical zones, was used in our study.
To present the suitable areas of the optimum ranges of J. mimosifolia in China, the peak width at half height (PWH) was applied [65].
Optimum ranges:
XPWH/2, X + PWH/2
PWH = 2.354 * S
where X and S denote the mean of each climatic factor and the standard deviation.

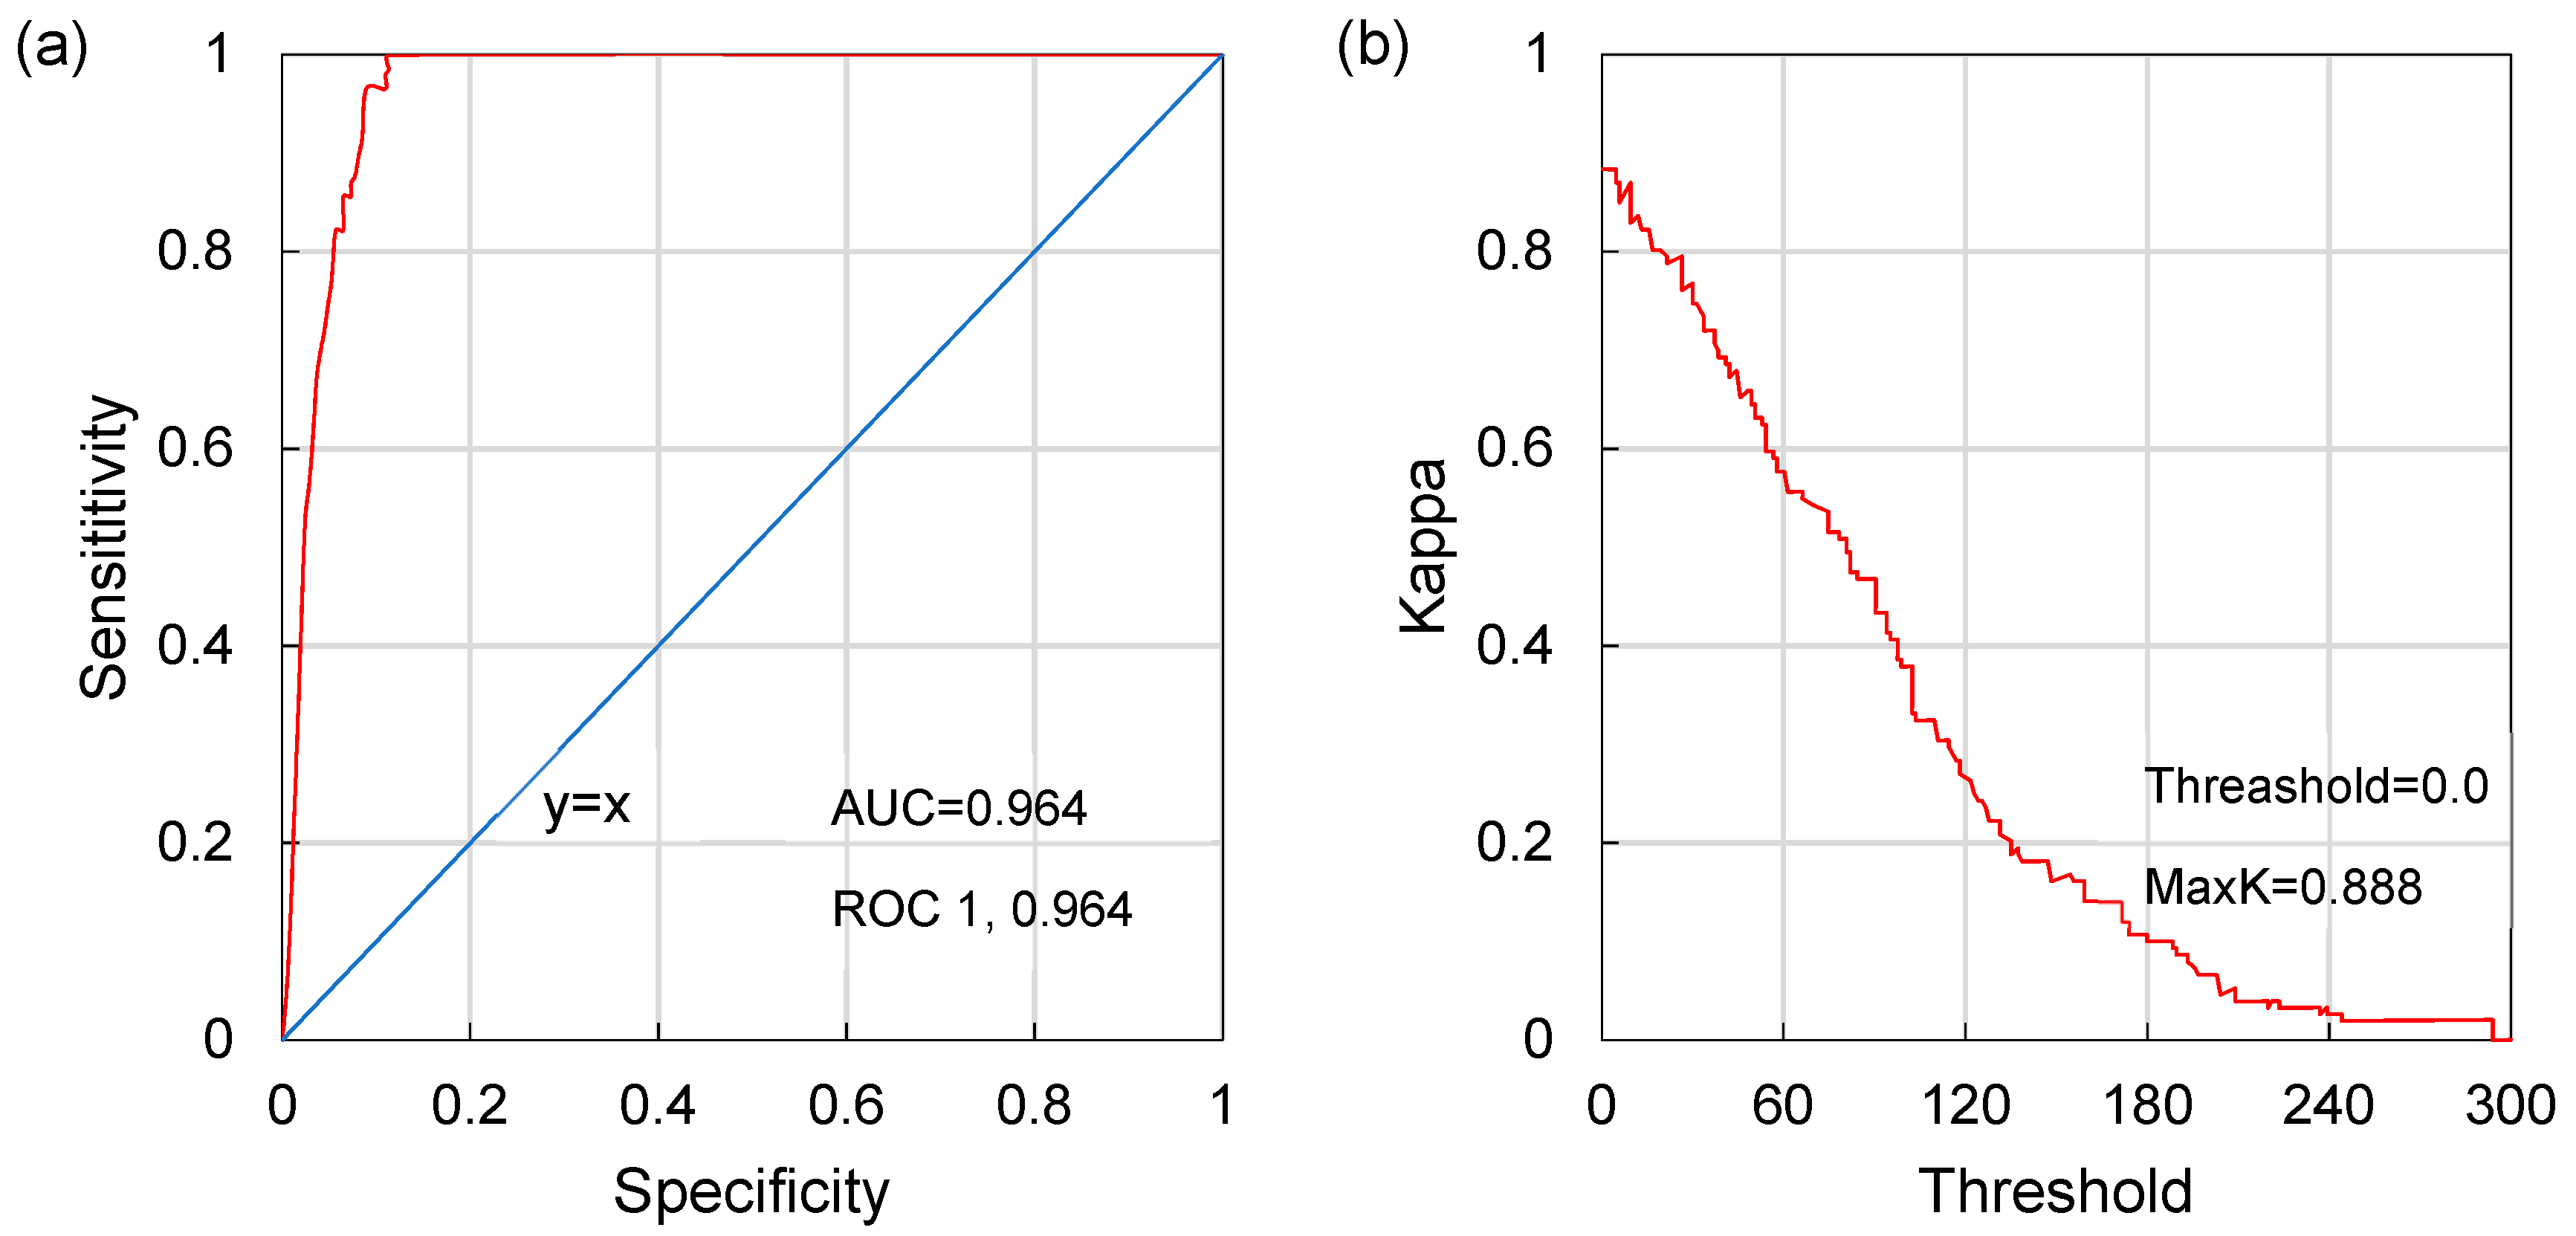
2.4. Modeling Procedures and Validation

The BIOCLIM model was created using the DIVA-GIS 7.5 implementation [26]. BIOCLIM is a frequency distribution-based algorithm that collects the values of each bioclimatic vector from all occurrence localities and organizes them into a composite frequency distribution [22]. We used 25% of randomly chosen points as test data to verify the models, and the remaining 75% were used to train the models. This procedure was repeated 10 times, and the mean values of sensitivity, specificity, kappa and AUC in DIVA-GIS 7.5 were used to determine the models’ accuracy. BIOCLIM has been used in various research, including species surveys, environmental preparation, invasive plant or animal risk assessment, historical distribution reconstruction and climate change impact assessments [32,33,66,67].

3. Results

3.1. Current Cultivated Areas

The 257 planting cities, the literature and the field survey showed that the extensively cultivated region of J. mimosifolia covered 11 provinces (or equivalent autonomous regions) in the southern part of China. From east to west, they included Taiwan, Fujian, Jiangxi, Guangdong, Hong Kong, Guangxi, Hainan, Guizhou, Chongqing, Sichuan and Yunnan (Figure 2). The southernmost point of the cultivated distribution was Sanya, Hainan (109.7° E, 18.3° N), the northernmost point was Mianyang, Sichuan (104.6° E, 31.5° N), the easternmost point was Taipei, Taiwan (121.6° E, 25.1° N), and the westernmost point was Longchuan, Yunnan (97.8° E, 24.2° N). Generally, the cultivated areas were mainly distributed in the south and middle subtropical zones, accompanied by a small tropical zone.
Despite the broad geographical spread of J. mimosifolia, most planting cities were concentrated in five provinces, namely Yunnan, Sichuan, Guangxi, Guangdong and Fujian (Figure 2). Yunnan had the largest number of planting cities with the most widespread distribution spread in most provinces. Greater concentration was detected in the eastern parts, such as Kunming, Yuxi and Wenshan. In Sichuan, the planting cities were found mainly in the eastern part, especially in Chengdu and its surrounding areas, and in Panzhihua. In Guangxi, except for the northwestern part, cultivation was recorded in all major cities, with Nanning, Liuzhou, and Guilin as focal examples. In Guangdong, cultivation was centered in the Pearl River Delta region, with outliers in Zhanjiang in the west and Chaoshan in the east. In Fujian, the cultivation extended largely along the southeast coast from Longyan-Zhangzhou to Fuzhou.
In addition to the concentrated distributions in the five provinces mentioned above, other locations had spatially dispersed to sporadic records. They did not form distribution hotspots, restricted to 1 to 10 planting cities per province. For instance, only one record was registered in Xinyi, Guizhou, and four records in Taiwan, such as Taipei and Changhua. Chongqing, with 10 planting cities, had the best record in this secondary group. Overall, the horizontal cultivation areas of the species could be interpreted in terms of regional-scale topography, mainly concentrated south of the Nanling Mountains and east of the Wuyi Mountains, with an extension to the Yunnan-Guizhou Plateau and the Sichuan Basin.
The altitudinal distribution of J. mimosifolia (Figure 3) could be divided into two zones: high altitude (>800 m) and low altitude (<800 m). The lowest cultivation elevation was Nansha, Guangdong (~0 m), and the highest was Yongsheng, Yunnan (~2300 m). The elevation of cultivated areas was lower in the southeast coastal area of Fujian, the Pearl River Delta region of Guangdong, most areas of Guangxi and the Sichuan Basin. Yunnan’s vertical distribution was elevated due to the overall topographic layout of China, with a progressive increase in height from the east coast towards the west inland. The altitudinal distribution pattern indicated 93, 47, 30 and 87 planting cities at 0–200 m, 200–400 m, 400–800 m and >800 m, respectively, accounting for 36.2%, 18.3%, 11.7% and 33.8% of the planting cities, respectively. Although most trees were planted in the low altitude zone, the notable presence in the high-altitude zone, which spread over a wide range (800–2300 m), signified the successful adaptation of the species to the mountain climate.

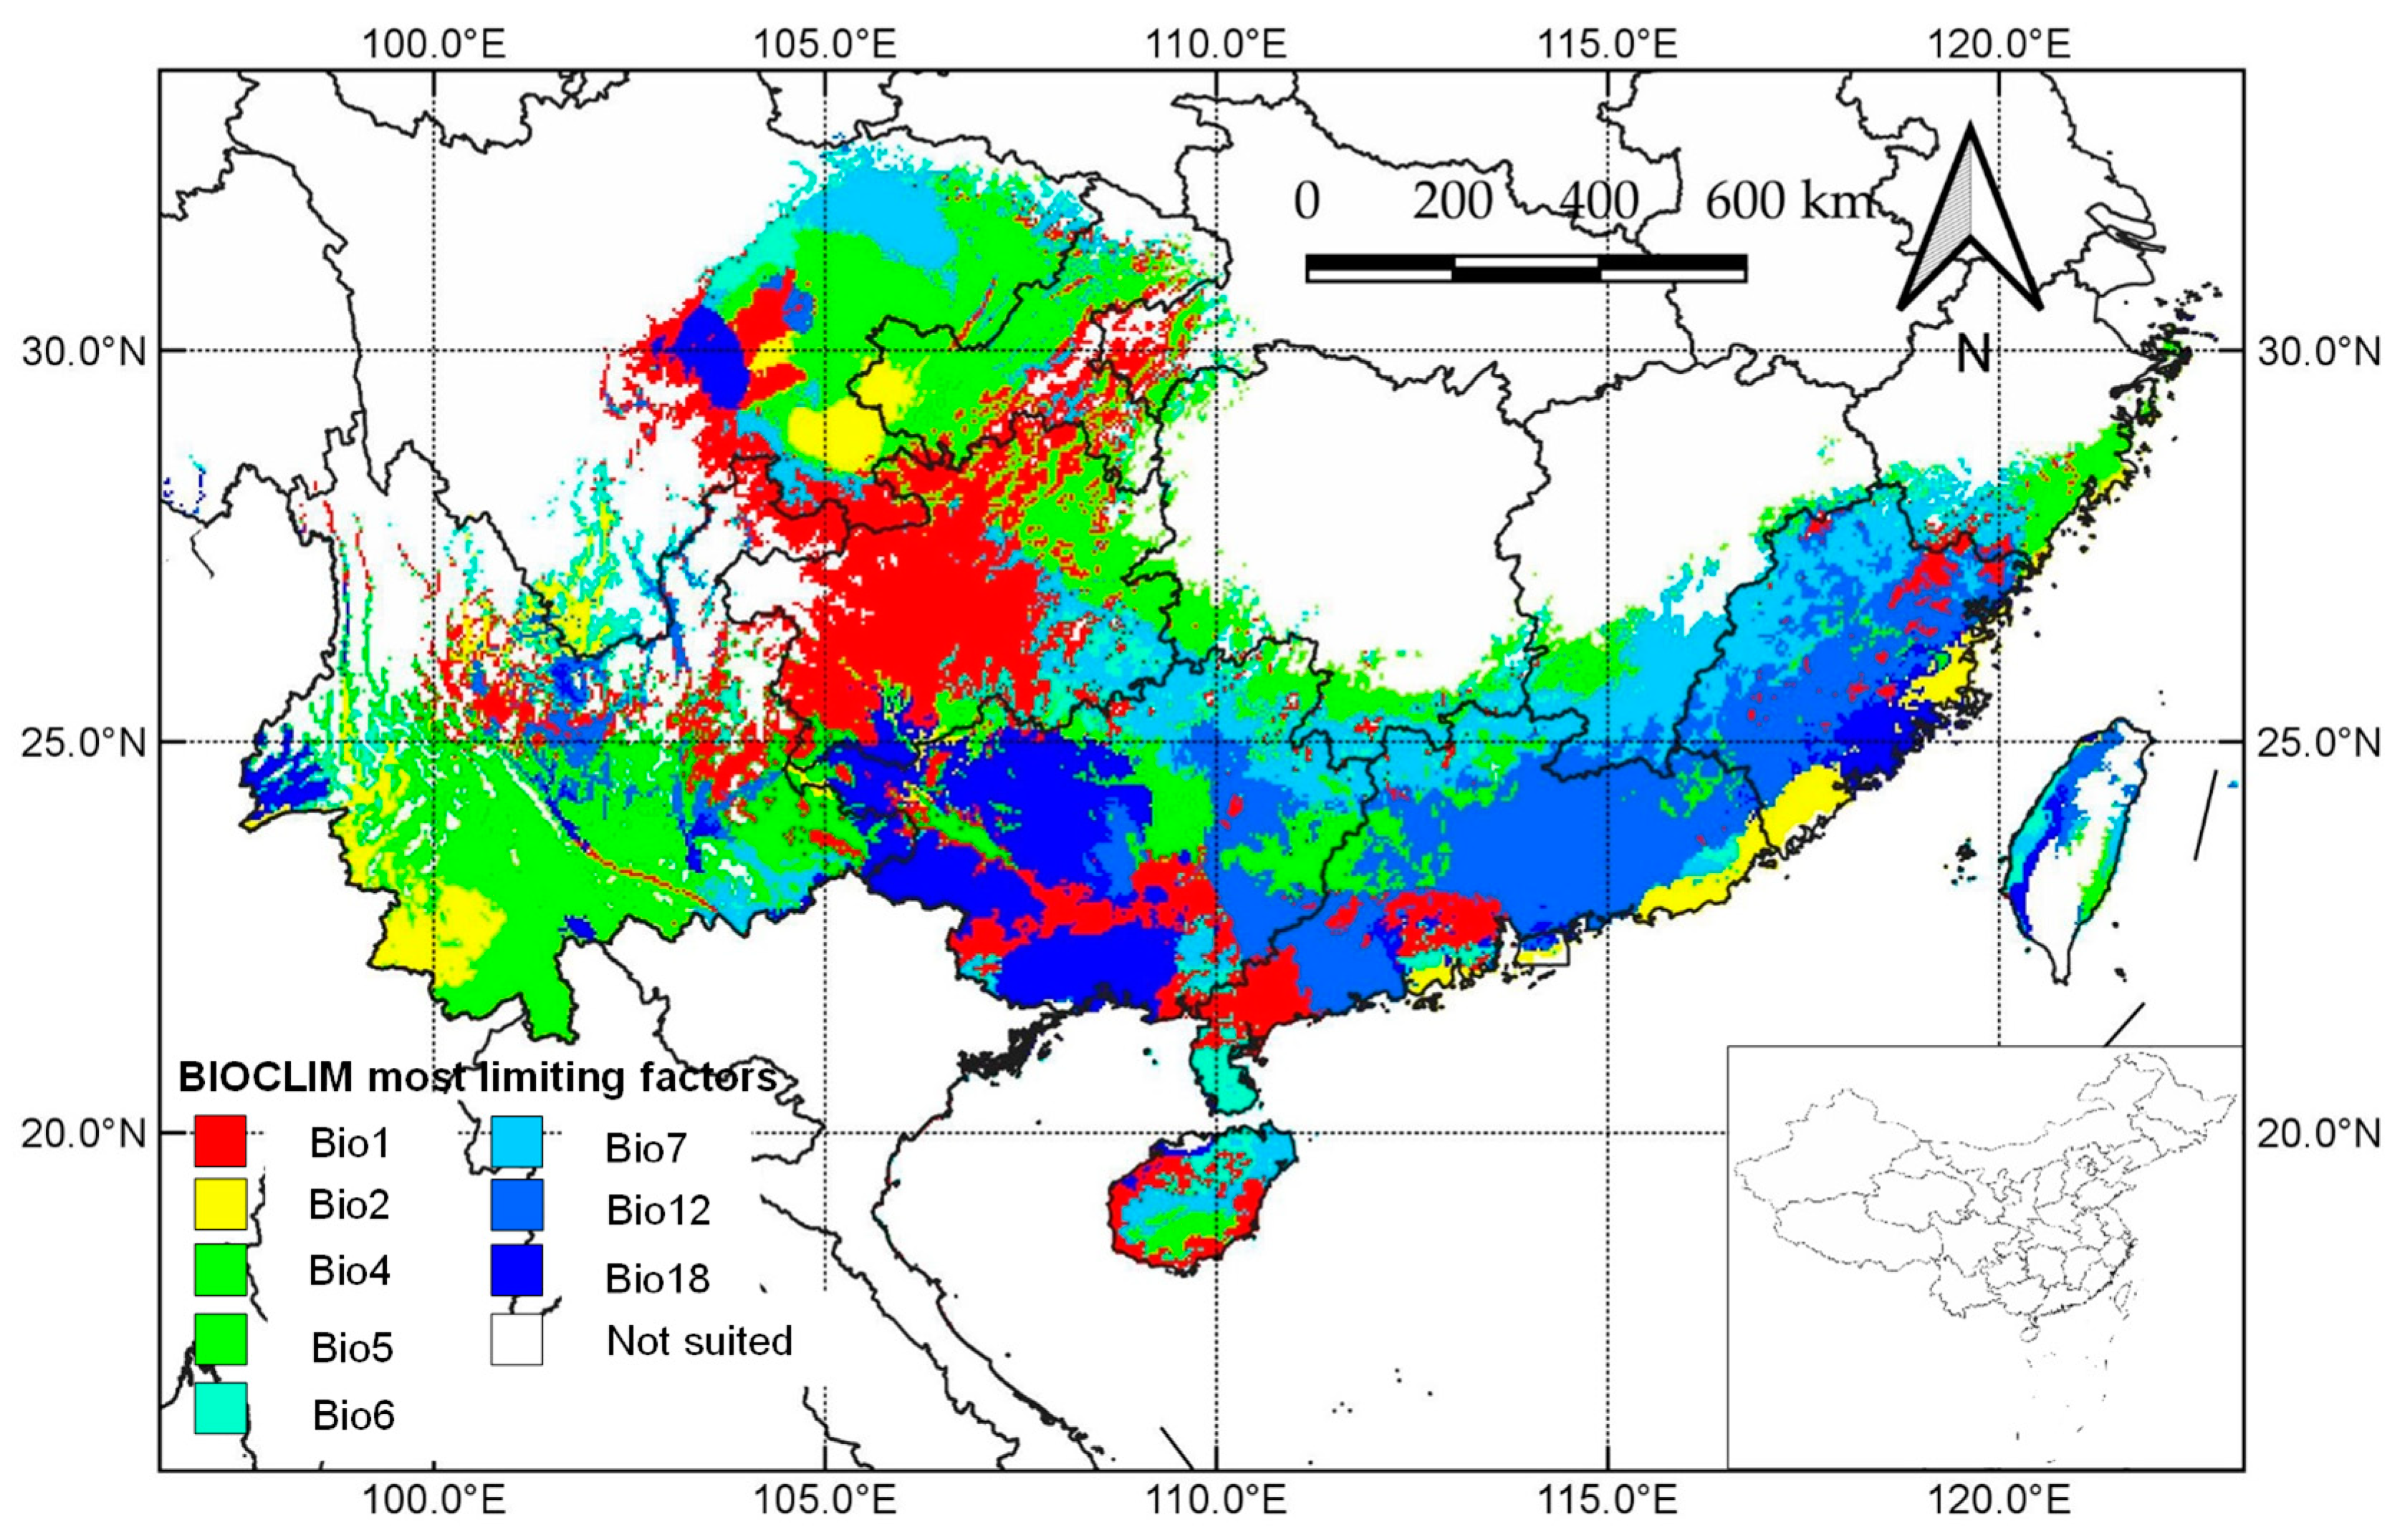
3.2. Climatic Factors Controlling Cultivated Areas

The 19 bioclimatic variables, explored by PCA to extract quantitative information on the variation patterns, yielded seven principal components (PCs or factors). Table 2 displays the eigenvalues and ratios of explained variance, which decreased progressively from PC1 to PC7. The first four PCs accounted for 96.4% of the variance; the last three, only a small proportion. Only those PCs contributing >5% of the overall variance could be interpreted [53].
Projection of the variables on the factor planes revealed that the first three axes of the PCs explained 47.1%, 23.5% and 12.6% of the total variance (cumulative variance more than 80%). Therefore, the main effects on the cultivated distribution of J. mimosifolia should be contributed by the first three PCs (Table 2). PC1 was dominated by three temperature variables, namely annual mean temperature (0.291), minimum temperature of the coldest month (0.288) and mean temperature of the warmest quarter (0.288), in conjunction with annual precipitation (0.283). PC1 was the most important factor, accounting for 47.1% of the total variance, mainly indicating the direct and crucial influence of temperature. PC2 indicated the notable effect of temperature seasonality (−0.445), associated with isothermality (0.375), annual temperature range (−0.373) and the mean of the coldest quarter (0.297). It mainly reflected the quarterly to annual temperature range and extremes. PC3 was mainly linked to precipitation, including precipitation of the wettest month (0.428), precipitation of the warmest quarter (0.418), precipitation of the wettest month (0.414) and annual precipitation (0.287). It was exclusively related to precipitation at different time scales. In PC4, precipitation of the driest month (−0.412) and precipitation of the driest quarter (−0.404) were negatively correlated, representing extreme moisture deficit conditions. The contributions of the remaining PCs at <5% were minor.

3.3. Main Climatic Parameters and Suitable Ranges

The statistics of the eight dominant bioclimatic parameters, indicated by PC1 and PC2 (Table 3), showed seven variables related to temperature and one related to moisture. For temperature, the optimum ranges of annual mean temperature, isothermality, temperature seasonality and annual temperature range were 16.39–22.34 °C, 25.47–46.83 °C, 429.17–715.87 °C, and 20.85–27.38 °C, respectively. These data indicated that J. mimosifolia was less tolerant of cold conditions and preferred a warm climate. In terms of moisture, the distribution range for annual precipitation was 890.08–1699.96 mm, suggesting that J. mimosifolia had a certain demand for moisture. Regarding the vegetation–climate indices, the suitable range of Kira’s warmth index, Holdridge’s annual biotemperature, the aridity index and biological aridity were 87.74–153.78, 17.17–22.84, 17.74–31.45 and 7.96–13.24, respectively. In addition, the coefficients of variation of the minimum temperature of the coldest month and Kira’s coldness index were more prominent, with 53.54% and 236.05%, respectively. In general, the suitable cultivation habitats were mainly located in areas with adequate warmth and moisture.

3.4. Modeling Suitable Cultivation Areas

Using DIVA-GIS 7.5, the suitable cultivation areas of J. mimosifolia according to the current environmental conditions projected by the BIOCLIM model are presented in Figure 4. The results show that the area from latitude 18° N to 33° N and from longitude 97° E to 122° E is the primary potential habitat in China. All the suitable habitats (including low, medium, high, very high and excellent habitat suitability) were mainly located in the provinces of Taiwan, Zhejiang, Fujian, Guangdong, Jiangxi, Hunan, Guangxi, Hainan, Guizhou, Chongqing, Sichuan, Yunnan and southeast of Tibet. Thus, the predicted potential biogeographical range covered a larger area than the current distribution area.
The suitable habitats demonstrated some notable spatial patterns: (1) Very high and excellent habitat suitability (the presence probability was 10.0% to 35.0%; red and orange in Figure 4) was primarily located in four areas: (a) southeast China, from east Guangdong to most parts of Fujian; (b) from northwest Guangdong extending westward to Guangxi and south Guizhou, being particularly evident in Guangxi and Guizhou; (c) from the Sichuan Basin to southeast Sichuan; and (d) some scattered areas in Yunnan. (2) High habitat suitability (the presence probability was 5.0% to 10.0%; yellow in Figure 4) included the west side of the Wuyi Mountains in Fujian, south Jiangxi, the west side of the Pearl River Delta region and west Guangdong, south Guangxi (not including the coastal areas), both sides of the Nanling Mountains, west Chongqing, north Sichuan, and west and southeast Yunnan. (3) Finally, medium and low habitat suitability (the presence probability was 0% to 5.0%; light green and dark green in Figure 4) embraced Taiwan, Hainan, most of Jiangxi, north Fujian, south Zhejiang, most of Hunan, northeast Chongqing and Sichuan, northeast and southeast Guizhou, and northwest Yunnan.
Notably, Fujian, Guangdong, Guangxi, Sichuan and a few parts of Yunnan should have better habitat suitability for J. mimosifolia in the current climate in China. Jiangxi, Zhejiang, Hunan and Tibet were not present in the current records of planting cities, suggesting the notable potential to expand the current biogeographical range. The narrow coastal strip, the wide strip at the northern latitudinal limit, tropical Hainan and the high mountains of Taiwan displayed low suitability.
We produced the modeled distribution maps using the BIOCLIM/Most Limiting Factor model to detect climatic suitability areas and gain insight into the limiting factors of the cultivation patterns of J. mimosifolia (Figure 5). The bioclimatic variables most significantly affected the cultivation patterns were: temperature seasonality (the standard deviation of the mean monthly temperature multiplied by 100) (Bio4), the maximum temperature of the warmest month (Bio5), the minimum temperature of the coldest month (Bio6) and annual precipitation (Bio12). Of these critical variables, Bio4 was one of the most important limiting factors determining the northern and southern limits of the potential cultivation distribution. Meanwhile, extreme temperatures (Bio5 and Bio6) also considerably affected the extent of suitable habitats. The climatic effects on the suitable habitats were synergistic and appeared to be more complex.
The performance of the BIOCLIM model was assessed with the threshold independent area under the receiver operating characteristics curve (ROC) statistics (AUC) (Figure 6). AUC values ranged from 0 to 1, and the AUC threshold was divided into four categories: fail (0.5–0.6), poor (0.6–0.7), fair (0.7–0.8), good (0.8–0.9) and excellent (0.9–1.0) [68]. Therefore, the accuracy of the predictions of suitable habitats for J. mimosifolia under the current climate was found to be excellent (AUC = 0.964) (Figure 6a). Kappa was also applied to test the accuracy of the model. Offering a consistency test, it has been widely used in model evaluations, taking the species distribution rate, sensitivity and specificity into account, and generating values in the range of 0 to +1 [31]. When the kappa value is greater than 0.6, the consistency is significant; a larger value denotes higher prediction accuracy [69]. In this study, the kappa was 0.888 (Figure 6b), which could be interpreted as very good agreement between the model and the test data, and was consistent with the AUC. Both test results demonstrated that the chosen bioclimatic variables accurately predicted the suitable habitats for J. mimosifolia in China.

4. Discussion

The geographical distribution patterns of plants have resulted from a combination of climate, hydrology, soil, human activities and other factors over a long period [16,70]. Climate is the most significant factor in determining the geographical distribution of plants at the regional scale [71,72]. The influence of climate on species growth is an integrated and long-term process, especially temperature and moisture. They can affect the metabolic processes of photosynthesis, respiration and transpiration, and the synthesis and transport of organic constituents to affect the growth of plants. Ultimately, they establish the species’ distribution area [73]. Therefore, by exploring the effects of moisture, temperature and vegetation–climate indicators on the cultivated distribution of J. mimosifolia in China, combined with the species distribution model (BIOCLIM), we were able to identify the key climatic factors limiting its actual and potential distribution. These findings could explain the performance of the species under different climatic scenarios and provide hints for tree care. They could also inform the arboricultural practice of introducing and promoting this species in other cities.

4.1. Geographical Distribution Pattern of J. mimosifolia in China

Understanding the geographical distribution of species can assist many ecological and environmental applications, especially plant introduction and conservation. Firstly, it can find specific habitats for the target species, including those with a high economic value, such as tea oil camellia (Camellia oleifera Abel) [74], soyabean (Glycine max (L.) Merr.) [75] and drumstick tree (Moringa oleifera Lam.) [76], and provide an empirical reference for extending their cultivation to other places. Secondly, it can protect endangered plants, providing a scientific basis for their in situ conservation and relocation, such as leaved water croton (Homonoia riparia Lour.) [27], tulips (Tulipa L. spp.) [77] and featherbells (Stenanthium gramineum (Ker Gawl.) Morong) [78]. As an ornamental plant, J. mimosifolia has been introduced and cultivated in nearly 100 countries and regions in Asia, North America and Oceania [41]. According to the geographical distribution data (Figure 2), the cultivated area of J. mimosifolia in China is concentrated in the subtropical region (25° ± 5° N), extending from the coastal areas of the eastern and southern parts to the southwest inland where the hydrothermal conditions are plentiful.
The cultivated distribution area of J. mimosifolia in China can be roughly divided into two parts (Figure 2): southeast and southwest. The southeast part mainly covers the coastal areas of Fujian, Guangdong and Guangxi. These three provinces are situated near the Tropic of Cancer, influenced by the monsoon circulation and topography, forming a typical warm-humid subtropical monsoon climate. The region has enabling climatic conditions and is endowed with plentiful heat and moisture resources. Most areas have an annual accumulated temperature ≥10 °C of between 5000 and 7600 °C, and are frost-free throughout the year [79]. Although Fujian is located at a slightly higher latitude, its southeastern coastal region still enjoys a typical southern subtropical climate.
The southwest part mainly covers Yunnan, Sichuan and Chongqing. The cultivated areas of J. mimosifolia in Sichuan and Chongqing, mainly distributed in their southeast, are influenced by the Pacific southeast monsoon, which brings a warm-humid subtropical climate [80]. However, the climatic regime in the cultivated area in Yunnan is more complicated, encompassing a subtropical monsoon climate, a tropical monsoon climate, a highland mountain climate, etc. Moreover, its climate is characterized by a wide diurnal temperature range, distinct wet and dry seasons, and considerable vertical changes in temperature due to the pronounced relative relief of Yunnan’s mountainous terrain [81].
Regarding the altitudinal distribution pattern of J. mimosifolia in China, more than 60% of the planting cities are located at low altitudes (<800 m) (Figure 3), indicating its preference for warmth. Overall, the cultivated areas are concentrated in subtropical areas with abundant thermal conditions.

4.2. Key Climatic Parameters Limiting the Northward Spread of J. mimosifolia

The limitation of species distribution by climatic parameters is complex, so it is important to identify the key ones that play a decisive role. Principal component analysis has been widely used as an effective tool to determine the dominant climatic parameters in plant distribution studies [23,82]. In PC1 and PC2 (Table 2), seven variables were related to temperature and only one to moisture. The annual mean temperature, the minimum temperature of the coldest month and the mean temperature of the warmest quarter in PC1 positively affected J. mimosifolia’s distribution. Isothermality and the mean temperature of the coldest quarter also had the same effect in PC2. However, the effects of temperature seasonality and annual temperature range on the distribution of J. mimosifolia were negative in PC2, which indicated that it preferred areas with a relatively small temperature range. This result also aptly illustrated the current distribution pattern of J. mimosifolia in Chinese cities. The results showed that temperature imposed a greater influence on distribution, reflecting a preference for a warm ecological habitat.
Our statistical analysis indicated that the minimum temperature of the coldest month and the mean temperature of the coldest quarter were not lower than 5 °C and 10 °C, respectively (Table 3). Thus, the low-temperature extreme in winter constituted a clinching factor limiting the northward distribution, analogous to the latitudinal poleward restriction of other woody plants [83,84]. Under chilling stress, J. mimosifolia is intolerant of prolonged 4 °C low temperatures. This response was demonstrated by various physiological indicators, which changed drastically with prolonged 4 °C stress, and the damage rate caused by 4 °C low temperatures was much greater than the repair rate [43].
In this study, the moisture parameters were less important than the temperature ones. In terms of moisture, only annual precipitation was incorporated in PC1 as one of the key climatic parameters, and the remaining moisture variables were ranked lower in importance than temperature (Table 2). Precipitation was the simplest climatic indicator that could be used as a proxy for aridity to reflect the dryness and humidity. Places with precipitation of >800 (900) mm in China were rated as humid zones [85]. The annual precipitation in the cultivated area of J. mimosifolia had a mean annual precipitation of >1200 mm (Table 3). Therefore, according to the precipitation indices, the cultivation area of J. mimosifolia is in the humid zone of China. Moreover, the precipitation of the warmest quarter accounted for >50% of the annual precipitation (Table 3), indicating that most precipitation was concentrated in the summer. Hence, the Pacific humid southeast monsoon in summer, bringing abundant precipitation to the cultivated areas of J. mimosifolia, is instrumental in its successful growth.
Ni studied the vegetation–climate interactions of China based on Kira’s indices, finding that the range and limit of WI, CI and BK for the subtropical evergreen broadleaf forest zone were 80–150, −25–0 and 10–15, respectively [64]. The values of the above three indices for J. mimosifolia were 120.76, 0.73, and 10.60, respectively, which fell within the ranges (Table 3). The value of AI was much higher than for the tree species in the north or high altitude in China (Picea spp.) [86], offering corroborative evidence that the cultivated areas of J. mimosifolia were relatively humid [62].
Therefore, according to the comparative analysis of various climatic indices in the cultivated areas of J. mimosifolia, the species had a natural ecological amplitude falling squarely in the tropical and subtropical zones. Its biogeographical range is largely circumscribed by high sensitivity to low temperature, and its tolerance of water restrictions was somewhat less important than temperature.

4.3. Suitable Cultivation Areas of J. mimosifolia in China

The accuracy of the evaluation results for this species’ suitable habitat depended on the data validity, the representativeness of the environmental variables and the sample size [28,30,51,87]. Unavoidable autocorrelation may exist among the environmental variables, causing over-fitting of the model and bias in the simulation results. In this study, we tackled this issue by using PAST 4.05 software for correlation analysis of the 19 bioclimatic variables [88], eliminating bioclimatic variables with correlation coefficients greater than 0.8, and finally retaining eight variables as inputs in the BIOCLIM model to improve the reliability of the simulation.
In similar studies, 87 geographical records of Prunus dielsiana C. K. Schneid. were applied to model its potential distribution pattern in subtropical China. The AUC and kappa values were 0.975 and 0.870, which displayed the high performance of BIOCLIM [89]. The distribution patterns of 192 woody plant species in Israel, analyzed using BIOCLIM, found that 50–75 observations were sufficient to obtain the maximal accuracy [25]. The effective sample size obtained in this study at 257 far exceeded the thresholds mentioned above, and the AUC was 0.964 (Figure 6a), which was much higher than the value of the random test (0.5). Therefore, the accuracy of our model was deemed to be credible. The results of our model can provide a reliable scientific basis to plan further cultivation of J. mimosifolia in other Chinese cities, aiming to fill the potential biogeographical range and maximize its spatial spread based on our model predictions.
Why were the better landscaping effects of J. mimosifolia found in the southwest rather than the southeast part of the current distribution pattern? In the United States, the flowering and growth of J. mimosifolia were stunted on the California coast due to heat shortages combined with cool ocean winds [90]. This phenomenon is a good indication that J. mimosifolia demands a warm climate and shuns a cool ambience. However, is it true that a warmer climate can usher in a corresponding improvement in growth? According to recent field survey results, J. mimosifolia could complete its life history in all the current cultivated areas in China. However, its flowering and landscape performance varied greatly in different areas. The flowering in the tropical coastal zone represented by Hainan Island (mean annual temperature: 22–27 °C) and the nearby Leizhou Peninsula (22.7–23.5 °C) was significantly less than in the subtropical and elevated Kunming in Yunnan province in southwest China (15 °C). The excessively high mean annual temperature in the tropical zone might not be conducive to the flowering of J. mimosifolia. Flower bud initiation in J. mimosifolia requires at least 1 month of cool temperatures (15 °C), while more than 3 months of cooling vernalization are required for normal flowering [91,92]. Therefore, this result concurred with the model prediction of suitable habitats (Figure 4 and Figure 5).
However, winter temperatures that are too low has restricted the cultivation areas of J. mimosifolia in China [93] (Figure 5). Mature trees of J. mimosifolia survived with little to no apparent damage in the United States where the winter temperatures could drop to −12 °C (10 °F) for several hours at a time [90]. However, J. mimosifolia did not perform as well at as low temperatures in China as in the US, as it would be damaged by frost and suffer dieback under −3 °C [38]. Moreover, our modeling results demonstrated its distribution in frost-free or largely frost-free areas (Figure 4). This finding illustrated that the cold tolerance performance of J. mimosifolia in China was weaker than in North America. Thus, our modeling and climatic index analysis verified that low temperature was the main limiting factor of its northward range extension in China.
Mapping a climatological variable that closely correlates with the patterns of plant survival is a commonly adopted method of visualizing the spatial patterns of low-temperature biological events [94]. Based on the Hardiness Zone Map illustrated by Widrlechner [95], the optimal cultivation areas of J. mimosifolia in China stretch from Zones 10a to 11a under the current climate.

4.4. Ecological Invasion Alert and Science-Based Plant Introduction

It should be noted that the actual planting of J. mimosifolia in potentially suitable habitats does not only depend on climatic conditions. It is also contingent on cultural factors such as the socioeconomic regime, the standard of horticultural production technology and the quality of arboricultural practice. The expansion of J. mimosifolia cultivation is also influenced by soil quality, soil moisture storage, geographical characteristics, the trees’ genetic constitution, cultivar selection, anthropogenic activities and historical reasons [42].
Originally introduced as an ornamental plant to other parts of the world, J. mimosifolia had achieved differential establishment success in different regions. However, it has caused a bio-invasive situation in some areas outside cities. For instance, J. mimosifolia has naturalized and spread aggressively into the semi-arid savanna along perennial rivers in South Africa [96,97]. A similar invasion also occurred in Queensland (Australia), Hawaii, Chile’s Juan Fernandez Islands, Kenya, Tanzania and Zambia [98].
J. mimosifolia is a fast-growing tree that can quickly re-sprout after injury or pruning. It is deep-rooted and aggressive; once it has established, few plants or crops can grow under it [37]. It may form seedling thickets under planted trees, allowing the species to spread and obliterate other plants, and reduce local biodiversity. Therefore, in tree introduction programs, the principle of “the right tree for the right place” and the priority of ecological protection should be science-based to avoid biological invasion and other environmental impacts [99].

5. Conclusions

In this study, the distribution patterns of the current cultivation of J. mimosifolia in China were evaluated in detail for the first time. The key climatic parameters of the cultivation areas were analyzed to provide a basis for simulating the potentially suitable habitats using the BIOCLIM modeling tool. We found that the cultivated areas were mainly located in the subtropical zone in the south China region, which could be divided into the southeastern and southwestern parts. Except for Yunnan, Sichuan and other places with a higher elevation, J. mimosifolia was mainly cultivated in low-altitude areas below 800 m. However, its extensive extension into the high altitude areas (>800 m) indicated an adaptation to somewhat lower temperatures in the active growing season.
The key climatic factors limiting its cultivation were temperature, especially annual mean temperature, the minimum temperature of the coldest month and the mean temperature of the warmest quarter. Areas with extremely low temperatures below 0 °C in winter can significantly impact the cultivation of J. mimosifolia. The moisture factor, which is relatively less critical, reflected the primary ecological demand for warmth in conjunction with a humid climate. The current study found that using 257 occurrence records of planting cities and eight selected climatic variables, the cultivation distribution patterns of J. mimosifolia could be reliably modeled using BIOCLIM. The results can predict potentially suitable habitats under the current climate conditions. The predicted potential biogeographical range is larger than the present actual range, indicating ample opportunities to expand the cultivation areas to other provinces and cities. The findings could also explain the disparate growth performance in the current planting areas and determine better matches in its future expansion into hitherto non-planting cities. Overall, our analytical findings can provide a theoretical reference to rationalize plant introduction practices and optimize urban vegetation management.

Author Contributions

Conceptualization, C.X. and C.J.; methodology, G.Z.; software, C.X.; formal analysis, D.L.; investigation, X.L., P.Z., D.L. and J.Q.; resources, G.Z.; data curation, X.L., P.Z. and J.Q.; writing—original draft preparation, C.X.; writing—review and editing, C.X. and C.J.; project administration, G.Z.; funding acquisition, G.Z. All authors have read and agreed to the published version of the manuscript.

Funding

This research was funded by the Fundamental Research Funds for the Central Non-profit Research Institution of CAF(CAFYBB2019MB004) and the Guangdong Forestry Science and Technology Innovation Project (2018KJCX024).

Data Availability Statement

The data presented in this study are available on request from the corresponding author.

Acknowledgments

We would like to thank the staff members from the monitoring points in different parts of China who monitored the growth of the target plants for several years.

Conflicts of Interest

The authors declare no conflict of interest.

References

  1. Çoban, S.; Yener, Ş.D.; Bayraktar, S. Woody plant composition and diversity of urban green spaces in Istanbul, Turkey. Plant Biosyst. Int. J. Deal. Asp. Plant Biol. 2021, 155, 83–91. [Google Scholar] [CrossRef]
  2. Jim, C.Y.; Liu, H.T. Species diversity of three major urban forest types in Guangzhou City, China. For. Ecol. Manag. 2001, 146, 99–114. [Google Scholar] [CrossRef]
  3. Loram, A.; Thompson, K.; Warren, P.H.; Gaston, K.J. Urban domestic gardens (XII): The richness and composition of the flora in five UK cities. J. Veg. Sci. 2008, 19, 321–330. [Google Scholar] [CrossRef]
  4. Sjöman, H.; Östberg, J.; Bühler, O. Diversity and distribution of the urban tree population in ten major Nordic cities. Urban For. Urban Green. 2012, 11, 31–39. [Google Scholar] [CrossRef] [Green Version]
  5. Zisenis, M. Alien plant species: A real fear for urban ecosystems in Europe? Urban Ecosyst. 2015, 18, 355–370. [Google Scholar] [CrossRef]
  6. Donaldson, J.E.; Hui, C.; Richardson, D.M.; Robertson, M.P.; Webber, B.L.; Wilson, J.R.U. Invasion trajectory of alien trees: The role of introduction pathway and planting history. Glob. Chang. Biol. 2014, 20, 1527–1537. [Google Scholar] [CrossRef] [PubMed]
  7. Maurel, N.; Hanspach, J.; Kühn, I.; Pyšek, P.; van Kleunen, M. Introduction bias affects relationships between the characteristics of ornamental alien plants and their naturalization success. Glob. Ecol. Biogeogr. 2016, 25, 1500–1509. [Google Scholar] [CrossRef] [Green Version]
  8. Moro, M.F.; Westerkamp, C. The alien street trees of Fortaleza (NE Brazil): Qualitative observations and the inventory of two districts. Ciência Florest. 2011, 21, 789–798. [Google Scholar] [CrossRef] [Green Version]
  9. Xie, C.P. Tree diversity in urban parks of Dublin, Ireland. Fresenius Environ. Bull. 2018, 27, 8695–8708. [Google Scholar]
  10. Kowarik, I. Urban ornamentals escaped from cultivation. In Crop Ferality and Volunteerism; CRC Press: Boca Raton, FL, USA, 2005; pp. 97–121. [Google Scholar] [CrossRef]
  11. Richardson, D.M.; Rejmánek, M. Trees and shrubs as invasive alien species—A global review. Divers. Distrib. 2011, 17, 788–809. [Google Scholar] [CrossRef]
  12. Čeplová, N.; Lososová, Z.; Kalusová, V. Urban ornamental trees: A source of current invaders; a case study from a European City. Urban Ecosyst. 2017, 20, 1135–1140. [Google Scholar] [CrossRef]
  13. Zhu, H.F.; Zhang, C.Q.; Gong, X. A summary on plant introduction and acclimatization research. Guihaia 2003, 23, 52–60. [Google Scholar] [CrossRef]
  14. Lenzner, B.; Magallón, S.; Dawson, W.; Kreft, H.; König, C.; Pergl, J.; Pyšek, P.; Weigelt, P.; van Kleunen, M.; Winter, M.; et al. Role of diversification rates and evolutionary history as a driver of plant naturalization success. New Phytol. 2021, 229, 2998–3008. [Google Scholar] [CrossRef] [PubMed]
  15. Wan, J.N.; Mbari, N.J.; Wang, S.W.; Liu, B.; Mwangi, B.N.; Rasoarahona, J.R.E.; Xin, H.P.; Zhou, Y.D.; Wang, Q.F. Modeling impacts of climate change on the potential distribution of six endemic baobab species in Madagascar. Plant Divers. 2021, 43, 117–124. [Google Scholar] [CrossRef] [PubMed]
  16. Van de Ven, C.M.; Weiss, S.B.; Ernst, W.G. Plant species distributions under present conditions and forecasted for warmer climates in an arid mountain range. Earth Interact. 2007, 11, 1–33. [Google Scholar] [CrossRef]
  17. Abdelaal, M.; Fois, M.; Fenu, G.; Bacchetta, G. Using MaxEnt modeling to predict the potential distribution of the endemic plant Rosa arabica Crép. in Egypt. Ecol. Inform. 2019, 50, 68–75. [Google Scholar] [CrossRef]
  18. Deb, C.R.; Jamir, N.; Kikon, Z.P. Distribution prediction model of a rare orchid species (Vanda bicolor Griff.) using small sample size. Am. J. Plant Sci. 2017, 8, 1388–1398. [Google Scholar] [CrossRef]
  19. Araújo, M.B.; Luoto, M. The importance of biotic interactions for modelling species distributions under climate change. Glob. Ecol. Biogeogr. 2007, 16, 743–753. [Google Scholar] [CrossRef]
  20. Zhang, D.S.; Liu, M. Introduction dynamics of landscape trees in Shanghai during the recent 55 years based on climatic envelope model. Chin. Landsc. Archit. 2018, 34, 118–123. [Google Scholar] [CrossRef]
  21. Wei, B.; Wang, R.L.; Hou, K.; Wang, X.Y.; Wu, W. Predicting the current and future cultivation regions of Carthamus tinctorius L. using MaxEnt model under climate change in China. Glob. Ecol. Conserv. 2018, 16, e00477. [Google Scholar] [CrossRef]
  22. Kabaš, E.; Batanjski, V.; Glasnović, P.; Vicić, D.; Tanasković, A.; Kuzmanovic, N.; Lakusic, D.; Šinžar-Sekulić, J. Towards detecting bioclimatic niche—Species distribution modelling in four maple species (Acer spp.). Acta Bot. Croat. 2014, 73, 401–417. [Google Scholar] [CrossRef] [Green Version]
  23. Fang, J.; Lechowicz, M.J. Climatic limits for the present distribution of beech (Fagus L.) species in the world. J. Biogeogr. 2006, 33, 1804–1819. [Google Scholar] [CrossRef]
  24. Ni, J. An introduction to bioclimatic factors in global change research. Quat. Sci. 2017, 37, 431–441. [Google Scholar] [CrossRef]
  25. Kadmon, R.; Farber, O.; Danin, A. A systematic analysis of factors affecting the performance of climatic envelope models. Ecol. Appl. 2003, 13, 853–867. [Google Scholar] [CrossRef]
  26. Villordon, A. GIS on the cheap: DIVA-GIS and other free data visualization tools for research. HortScience 2006, 41, 497–520. [Google Scholar] [CrossRef] [Green Version]
  27. Yi, Y.J.; Cheng, X.; Yang, Z.F.; Zhang, S.H. Maxent modeling for predicting the potential distribution of endangered medicinal plant (H. riparia Lour) in Yunnan, China. Ecol. Eng. 2016, 92, 260–269. [Google Scholar] [CrossRef]
  28. Hernandez, P.A.; Graham, C.H.; Master, L.L.; Albert, D.L. The effect of sample size and species characteristics on performance of different species distribution modeling methods. Ecography 2006, 29, 773–785. [Google Scholar] [CrossRef]
  29. Silva, L.D.; Costa, H.; de Azevedo, E.B.; Medeiros, V.; Alves, M.; Elias, R.B.; Silva, L. Modelling native and invasive woody species: A comparison of ENFA and MaxEnt applied to the Azorean forest. In Proceedings of the International Conference on Dynamics, Games and Science, Porto, Portugal, 17–21 February 2014; pp. 415–444. [Google Scholar]
  30. Wisz, M.S.; Hijmans, R.J.; Li, J.; Peterson, A.T.; Graham, C.H.; Guisan, A.; NCEAS Predicting Species Distributions Working Group. Effects of sample size on the performance of species distribution models. Divers. Distrib. 2008, 14, 763–773. [Google Scholar] [CrossRef]
  31. Segurado, P.; Araújo, M.B. An evaluation of methods for modelling species distributions. J. Biogeogr. 2004, 31, 1555–1568. [Google Scholar] [CrossRef]
  32. Ahmed, N.; Atzberger, C.; Zewdie, W. Species Distribution Modelling performance and its implication for Sentinel-2-based prediction of invasive Prosopis juliflora in lower Awash River basin, Ethiopia. Ecol. Process. 2021, 10, 18. [Google Scholar] [CrossRef]
  33. Booth, T.H.; Nix, H.A.; Busby, J.R.; Hutchinson, M.F. Bioclim: The first species distribution modelling package, its early applications and relevance to most current MaxEnt studies. Divers. Distrib. 2014, 20, 1–9. [Google Scholar] [CrossRef]
  34. Beaumont, L.J.; Hughes, L.; Poulsen, M. Predicting species distributions: Use of climatic parameters in BIOCLIM and its impact on predictions of species’ current and future distributions. Ecol. Model. 2005, 186, 251–270. [Google Scholar] [CrossRef]
  35. Booth, T.H. Why understanding the pioneering and continuing contributions of BIOCLIM to species distribution modelling is important. Austral Ecol. 2018, 43, 852–860. [Google Scholar] [CrossRef] [Green Version]
  36. Felizardo, M.P.; Merlo, G.R.; Maia, G.D. Modeling drying kinetics of Jacaranda mimosifolia seeds with variable effective diffusivity via diffusion model. Biosys. Eng. 2021, 205, 234–245. [Google Scholar] [CrossRef]
  37. Nick, P. Jacaranda mimosifolia (Jacaranda). Available online: https://www.cabi.org/isc/datasheet/29212#tosummaryOfInvasiveness (accessed on 8 May 2021).
  38. Jia, P. Landscape tree Species: Jacaranda mimosifolia. China Flower Hortic. 2008, 4, 24–25. [Google Scholar]
  39. Liu, X.F.; Li, X.M.; Zhang, P.J.; Zhang, G.W. The preliminary Introduction of Jacaranda mimosifolia provenances to Zhanjiang. Eucalypt Sci. Technol. 2016, 33. [Google Scholar] [CrossRef]
  40. Oliveira, J.R.d.; Costa, C.A.S.d.; Bezerra, A.M.E.; Abud, H.F.; de Lucena, E.M.P. Characterization of seeds, seedlings and initial growth of Jacaranda mimosifolia D. Don.(Bignoniaceae). Rev. Árvore 2018, 42, e420403. [Google Scholar] [CrossRef]
  41. Alves, G.; Peruchi, A.; Agostini, K. Pollination in urban area: The Jacaranda mimosifolia D. Don (Bignoniaceae) case study. Bioikos 2010, 24, 31–41. [Google Scholar]
  42. Miyajima, I.; Mata, D.; Kobayashi, N.; Facciuto, G.; Soto, S.; Hagiwara, J.C.; Serpa, J.C.; Escandon, A. Practical Method of Propagating Jacaranda mimosifolia by Cuttings. J. Jpn. Soc. Hortic. Sci. 2004, 73, 137–139. [Google Scholar] [CrossRef]
  43. Zhou, J.; Zeng, X.Y.; He, W.; Li, J.Y.; Zhang, W.; Li, X.Q. Mechanism of chilling injury in Jacaranda acutifolia Humb.et Bonpl. under chilling stress. Southwest China J. Agric. Sci. 2016, 29, 74–80. [Google Scholar] [CrossRef]
  44. Naz, R.; Roberts, T.H.; Bano, A.; Nosheen, A.; Yasmin, H.; Hassan, M.N.; Keyani, R.; Ullah, S.; Khan, W.; Anwar, Z. GC-MS analysis, antimicrobial, antioxidant, antilipoxygenase and cytotoxic activities of Jacaranda mimosifolia methanol leaf extracts and fractions. PLoS ONE 2020, 15, e0236319. [Google Scholar] [CrossRef]
  45. Sidjui, L.S.; Zeuko’o, E.M.; Toghueo, R.M.K.; Noté, O.P.; Mahiou-Leddet, V.; Herbette, G.; Fekam, F.B.; Ollivier, E.; Folefoc, G.N. Secondary metabolites from Jacaranda mimosifolia and Kigelia africana (Bignoniaceae) and their anticandidal activity. Rec. Nat. Prod. 2014, 8, 307. [Google Scholar]
  46. Aguirre-Becerra, H.; Pineda-Nieto, S.A.; García-Trejo, J.F.; Guevara-González, R.G.; Feregrino-Pérez, A.A.; Álvarez-Mayorga, B.L.; Pastrana, D.M.R. Jacaranda flower (Jacaranda mimosifolia) as an alternative for antioxidant and antimicrobial use. Heliyon 2020, 6, e05802. [Google Scholar] [CrossRef] [PubMed]
  47. Brignole, D.; Drava, G.; Minganti, V.; Giordani, P.; Samson, R.; Vieira, J.; Pinho, P.; Branquinho, C. Chemical and magnetic analyses on tree bark as an effective tool for biomonitoring: A case study in Lisbon (Portugal). Chemosphere 2018, 195, 508–514. [Google Scholar] [CrossRef] [PubMed]
  48. Olowoyo, J.O.; Van Heerden, E.; Fischer, J. Investigating Jacaranda mimosifolia tree as biomonitor of atmospheric trace metals. Environ. Monit. Assess. 2010, 164, 435–443. [Google Scholar] [CrossRef] [PubMed]
  49. Hijmans, R.J.; Cameron, S.E.; Parra, J.L.; Jones, P.G.; Jarvis, A. Very high resolution interpolated climate surfaces for global land areas. Int. J.Climatol. A J. R. Meteorol. Soc. 2005, 25, 1965–1978. [Google Scholar] [CrossRef]
  50. Yue, Y.J.; Zhang, P.Y.; Shang, Y.R. The potential global distribution and dynamics of wheat under multiple climate change scenarios. Sci. Total Environ. 2019, 688, 1308–1318. [Google Scholar] [CrossRef] [PubMed]
  51. Sillero, N. What does ecological modelling model? A proposed classification of ecological niche models based on their underlying methods. Ecol. Model. 2011, 222, 1343–1346. [Google Scholar] [CrossRef]
  52. Cao Pinna, L.; Axmanová, I.; Chytrý, M.; Malavasi, M.; Acosta, A.T.R.; Giulio, S.; Attorre, F.; Bergmeier, E.; Biurrun, I.; Campos, J.A.; et al. The biogeography of alien plant invasions in the Mediterranean Basin. J. Veg. Sci. 2021, 32, e12980. [Google Scholar] [CrossRef]
  53. Janžekovič, F.; Novak, T. PCA—A Powerful Method for Analyze Ecological Niches. In Principal Component Analysis—Multidisciplinary Applications; Sanguansat, P., Ed.; InTech: Rijeka, Croatia, 2012; pp. 127–142. [Google Scholar] [CrossRef] [Green Version]
  54. Federici, F.; Pignatti, S. The warmth index of Kira for the interpretation of vegetation belts in Italy and SW. Australia two regions with Mediterranean type bioclimates. Vegetatio 1991, 93, 91–99. [Google Scholar] [CrossRef]
  55. Nagai, S.; Saitoh, T.M.; Miura, T. Peak autumn leaf colouring along latitudinal and elevational gradients in Japan evaluated with online phenological data. Int. J. Biometeorol. 2020, 64, 1743–1754. [Google Scholar] [CrossRef]
  56. Yim, Y.J.; Kira, T. Distribution of forest vegetation and climate in the Korean peninsula.: I. Distribution of some indices of thermal climate. Jpn. J. Ecol. 1975, 25, 77–88. [Google Scholar] [CrossRef]
  57. Krestov, P.V.; Nakamura, Y. Climatic controls of forest vegetation distribution in Northeast Asia. Ber. Reinhold-Tüxen-Ges. 2007, 19, 131–145. [Google Scholar]
  58. Chiu, C.A.; Chiou, C.R.; Lin, J.R.; Lin, P.H.; Lin, C.T. Coldness index does not indicate the upper limit of evergreen broad-leaved forest on a subtropical island. J. For. Res. 2014, 19, 115–124. [Google Scholar] [CrossRef]
  59. Szelepcsényi, Z.; Breuer, H.; Kis, A.; Pongrácz, R.; Sümegi, P. Assessment of projected climate change in the Carpathian Region using the Holdridge life zone system. Theor. Appl. Climatol. 2018, 131, 593–610. [Google Scholar] [CrossRef]
  60. Li, G.Q.; Wen, Z.M.; Guo, K.; Du, S. Simulating the effect of climate change on vegetation zone distribution on the Loess Plateau, Northwest China. Forests 2015, 6, 2092–2108. [Google Scholar] [CrossRef] [Green Version]
  61. Liu, Y.S.; Quan, C. Late Cenozoic climates of low-latitude East Asia: A paleobotanical example from the Baise Basin of Guangxi, southern China. Palaeoworld 2017, 26, 572–580. [Google Scholar] [CrossRef]
  62. Quan, C.; Han, S.; Utescher, T.; Zhang, C.; Liu, Y.S. Validation of temperature–precipitation based aridity index: Paleoclimatic implications. Palaeogeogr. Palaeoclimatol. Palaeoecol. 2013, 386, 86–95. [Google Scholar] [CrossRef]
  63. Si, S.B.; Cao, F.X.; Peng, J.Q.; Xu, R.X. Determination of northern distribution boundary and relationship with climate parameters for Rhodomyrtus tomentosa in China. J. Cent. South Univ. For. Technol. 2012, 32, 162–165. [Google Scholar] [CrossRef]
  64. Ni, J. Development of Kira’ s indices and its application to vegetation-climate interaction study of China. J. Appl. Ecol. 1997, 8, 161–170. [Google Scholar]
  65. Hong, B.G.; Li, S.Z. The preliminary study of the correlations between the distribution of main everygreen broad-leaf tree species in Jiangsu and climates. Acta Ecol. Sin. 1981, 1, 105–111. [Google Scholar]
  66. Stewart, S.B.; Elith, J.; Fedrigo, M.; Kasel, S.; Roxburgh, S.H.; Bennett, L.T.; Chick, M.; Fairman, T.; Leonard, S.; Kohout, M.; et al. Climate extreme variables generated using monthly time-series data improve predicted distributions of plant species. Ecography 2021, 44, 626–639. [Google Scholar] [CrossRef]
  67. Li, Z.R.; Zhu, Z.F.; Wu, Y. Scale dependency of pseudo-absences selection and uncertainty in climate scenarios matter when assessing potential distribution of a rare poppy plant Meconopsis punicea Maxim. under a warming climate. Glob. Ecol. Conserv. 2020, 24, e01353. [Google Scholar] [CrossRef]
  68. Swets, J.A. Measuring the accuracy of diagnostic systems. Science 1988, 240, 1285–1293. [Google Scholar] [CrossRef] [PubMed] [Green Version]
  69. Xie, C.X.; Sun, C.Z.; Zhang, D.F.; Guo, J.; Wu, M.L.; ZHang, Q. Predicting the global areas for potential distribution of Gastrodia elata based on ecological niche models. Chin. J. Plant Ecol. 2017, 41, 770–778. [Google Scholar] [CrossRef]
  70. Chen, Y.; Yang, X.; Yang, Q.; Li, D.; Long, W.; Luo, W. Factors affecting the distribution pattern of wild plants with extremely small populations in Hainan Island, China. PLoS ONE 2014, 9, e97751. [Google Scholar] [CrossRef] [Green Version]
  71. Kosanic, A.; Anderson, K.; Harrison, S.; Turkington, T.; Bennie, J. Changes in the geographical distribution of plant species and climatic variables on the West Cornwall peninsula (South West UK). PLoS ONE 2018, 13, e0191021. [Google Scholar] [CrossRef] [Green Version]
  72. Huang, E.H.; Chen, Y.X.; Fang, M.; Zheng, Y.; Yu, S.X. Environmental drivers of plant distributions at global and regional scales. Glob. Ecol. Biogeogr. 2021, 30, 697–709. [Google Scholar] [CrossRef]
  73. Nievola, C.C.; Carvalho, C.P.; Carvalho, V.; Rodrigues, E. Rapid responses of plants to temperature changes. Temperature (Austin) 2017, 4, 371–405. [Google Scholar] [CrossRef]
  74. He, F.; He, B. Cultivated distribution and site classification for camellia oleifera. Sci. Silvae Sin. 2002, 38, 64–72. [Google Scholar] [CrossRef]
  75. Takahashi, Y.; Li, X.H.; Qiu, L.J.; Tsukamoto, C.; Wang, K.J. Identification of saponin composition and their geographical distribution in Chinese cultivated soybean (Glycine max). Euphytica 2017, 213, 175. [Google Scholar] [CrossRef]
  76. Popoola, J.; Obembe, O. Local knowledge, use pattern and geographical distribution of Moringa oleifera Lam. (Moringaceae) in Nigeria. J. Ethnopharmacol. 2013, 150, 682–691. [Google Scholar] [CrossRef]
  77. Wilson, B.; Dolotbakov, A.; Burgess, B.J.; Clubbe, C.; Lazkov, G.; Shalpykov, K.; Ganybaeva, M.; Sultangaziev, O.; Brockington, S.F. Central Asian wild tulip conservation requires a regional approach, especially in the face of climate change. Biodivers. Conserv. 2021, 30, 1705–1730. [Google Scholar] [CrossRef]
  78. Edgin, B. Status and Distribution of Illinois Populations of Stenanthium gramineum (Ker-Gawl.) Morong, Grass-Leaved Lily (Liliaceae): An Endangered Plant in Illinois. Castanea 2004, 69, 216–225. [Google Scholar] [CrossRef]
  79. Dai, S.P.; Li, H.L.; Liu, H.Q.; Liu, E.P. The spatio-temporal change characteristics of agriculture climate resources in southern china under the background of global warming. Chin. J. Agric. Resour. Reg. Plan. 2014, 35, 52–60. [Google Scholar] [CrossRef]
  80. Zhang, L.Y.; Mao, W.S.; Pang, B. Characteristics of climate change in Chengdu Plain. J. Chengdu Univ. Inf. Technol. 2020, 35, 179–187. [Google Scholar] [CrossRef]
  81. Pu, J.C.; Huang, Z.Y.; Gao, M. Relationship between climatic characteristics and planting suitability of main cash crops in Yunnan. J. Meteorol. Res. Appl. 2021, 42, 53–57. [Google Scholar] [CrossRef]
  82. Ighbareyeh, J.M.H.; Carmona, E.C.; Ortiz, A.C.; Suliemieh, A.A.-R.A.; Ighbareyeh, M.M.H.; Daraweesh, A.A.-Q.M. Analysis of physical factors of climate and bioclimate and their effects on almonds production to increase the economy in Hebron area of Palestine. Arab. J. Geosci. 2018, 11, 683. [Google Scholar] [CrossRef]
  83. Prentice, I.C.; Cramer, W.; Harrison, S.P.; Leemans, R.; Monserud, R.A.; Solomon, A.M. Special paper: A global biome model based on plant physiology and dominance, soil properties and climate. J. Biogeogr. 1992, 19, 117–134. [Google Scholar] [CrossRef]
  84. Woodward, F.I.; Williams, B.G. Climate and plant distribution at global and local scales. Vegetatio 1987, 69, 189–197. [Google Scholar] [CrossRef]
  85. Zhang, C.J.; Liao, Y.M.; Song, Y.L. The progress of dry–wet climate divisional research in China. Earth Sci. 2020, 9, 8–15. [Google Scholar] [CrossRef]
  86. Zhang, X.W.; Wang, J.R.; Wang, M.H.; Yang, Y.; Zhao, C.M. Dominant climatic factors influencing the geographical distribution pattern of Picea in China. Sci. Silvae Sin. 2020, 56, 1–11. [Google Scholar] [CrossRef]
  87. Syfert, M.M.; Smith, M.J.; Coomes, D.A. The effects of sampling bias and model complexity on the predictive performance of MaxEnt species distribution models. PLoS ONE 2013, 8, e55158. [Google Scholar] [CrossRef]
  88. Hammer, Ø.; Harper, D.A.; Ryan, P.D. PAST: Paleontological statistics software package for education and data analysis. Palaeontol. Electron. 2001, 4, 9. [Google Scholar]
  89. Zhu, H.; Yi, X.G.; Li, Y.F.; Duan, Y.F.; Wang, X.R.; Zhang, L.B. Limiting climatic factors in shaping the distribution pattern and niche differentiation of Prunus dielsiana in subtropical China. J. For. Res. 2020, 1–11. [Google Scholar] [CrossRef]
  90. Brenzel, K.N. Sunset Western Garden Book; Sunset Publishing Group: Southern Progress’s Menlo Park, CA, USA, 2007. [Google Scholar]
  91. Liu, X.F.; Li, X.M.; Zhang, P.J.; Xu, Y.X.; Fang, L.; Zhang, G.W. Research progress of Jacaranda mimosifolia and the development prospects. Eucalypt Sci. Technol. 2015, 32, 51–55. [Google Scholar] [CrossRef]
  92. Miyajima, I.; Takemura, C.; Kobayashi, N.; Soto, M.S.; Facciuto, G. Flower bud initiation and Development of Jacaranda mimosifolia (Bignoniaceae) in Japan. In Proceedings of the VII International Symposium on New Floricultural Crops 1000, Buenos Aires, Argentina, 22–25 November 2011; pp. 71–76. [Google Scholar]
  93. Jenerette, G.D.; Clarke, L.W.; Avolio, M.L.; Pataki, D.E.; Gillespie, T.W.; Pincetl, S.; Nowak, D.J.; Hutyra, L.R.; McHale, M.; McFadden, J.P.; et al. Climate tolerances and trait choices shape continental patterns of urban tree biodiversity. Glob. Ecol. Biogeogr. 2016, 25, 1367–1376. [Google Scholar] [CrossRef]
  94. Widrlechner, M.P.; Daly, C.; Keller, M.; Kaplan, K. Horticultural applications of a newly revised USDA plant Hardiness Zone Map. Am. Soc. Hortic. Sci. 2012, 22, 6–19. [Google Scholar] [CrossRef] [Green Version]
  95. Widrlechner, M.P. Interactive Gardening and Plant Hardiness Zone Map for China. Available online: https://www.plantmaps.com/interactive-china-plant-hardiness-zone-map-celsius.php (accessed on 6 May 2021).
  96. Richardson, D.M.; Van Wilgen, B.W. Invasive alien plants in South Africa: How well do we understand the ecological impacts? S. Afr. J. Sci. 2004, 100, 45–52. [Google Scholar]
  97. Zimmermann, H.G.; Moran, V.C.; Hoffmann, J. Biological control in the management of invasive alien plants in South Africa, and the role of the Working for Water Programme. S. Afr. J. Sci. 2004, 100, 34–40. [Google Scholar]
  98. Witt, A.; Luke, Q. Guide to the Naturalized and Invasive Plants of Eastern Africa; CABI: Nairobi, Kenya, 2017. [Google Scholar]
  99. Velasco-Jiménez, M.J.; Alcázar, P.; Cariñanos, P.; Galán, C. Allergenicity of the urban green areas in the city of Córdoba (Spain). Urban For. Urban Green. 2020, 49, 126600. [Google Scholar] [CrossRef]
Figure 1. Landscape and botanical features of Jacaranda mimosifolia in China. Its ornamental and botanical features are displayed: (a) flowers; (b) bipinnate compound leaves and fruit; (ce) trees in bloom and tree form in Yibin (Sichuan), Xiamen (Fujian) and Kunming (Yunnan), respectively.
Forests 12 00951 g001
Figure 2. Spatial distribution of the current cultivated areas of J. mimosifolia in the south China region. Each dot in the map denotes a city where the planting of jacaranda was recorded.
Forests 12 00951 g002
Figure 3. Vertical distribution pattern of the planting cities of J. mimosifolia grouped by 11 provinces in China. Using 800 m as the dividing line for cultivation areas of J. mimosifolia at different altitudes, the distribution can be classified into low-altitude and high-altitude zones.
Forests 12 00951 g003
Figure 4. Distribution pattern of habitat suitability of J. mimosifolia in China based on the current climate. The results were obtained from the predictions of BIOCLIM using DIVA-GIS. Different colors from grey to red denote the gradation from low to high habitat suitability, and hence the probability of occurrence.
Forests 12 00951 g004
Figure 5. Distribution patterns of the limiting factors for the cultivation of J. mimosifolia. The selected eight bioclimatic variables, shown in different colors, exerted the greatest effect on predicting suitable habitats in the south China region. Refer to Table 1 for the meaning of the bioclimatic variables.
Forests 12 00951 g005
Figure 6. Prediction validation by (a) ROC and (b) kappa for BIOCLIM.
Forests 12 00951 g006
Table 1. Eight of the original 19 bioclimatic variables were selected for modeling the suitable habitats of J. mimosifolia in China.
Bioclimatic VariableAbbreviationUnitData Source
Annual mean temperatureBio1°CCMDSC
Mean diurnal rangeBio2°CWorldClim
Temperature seasonality aBio4-WorldClim
Max. temperature of warmest monthBio5°CCMDSC
Min. temperature of coldest monthBio6°CCMDSC
Annual temperature rangeBio7°CWorldClim
Annual precipitationBio12mmCMDSC
Precipitation of warmest quarterBio18mmWorldClim
a Temperature seasonality = standard deviation × 100.
Table 2. The factor loadings of the first seven principal components concerning the 19 bioclimatic variables.
Bioclimatic VariablePC 1PC 2PC 3PC 4PC 5PC 6PC 7
Bio1 Annual mean temperature0.2910.112 −0.236 0.122 0.163 −0.036 0.020
Bio2 Mean diurnal range a−0.198 0.241 −0.067 −0.248 0.577 0.062 −0.074
Bio3 Isothermality b −0.145 0.375−0.114 −0.215 0.283 0.089 −0.050
Bio4 Temperature seasonality c 0.051 −0.4450.148 0.126 0.063 −0.092 0.039
Bio5 Max. temperature of warmest month0.254 −0.214 −0.149 0.178 0.346 −0.124 −0.050
Bio6 Min. temperature of coldest month0.2880.129 −0.218 0.153 −0.171 −0.019 0.041
Bio7 Annual temperature range d −0.098 −0.3730.118 −0.009 0.557 −0.102 −0.101
Bio8 Mean temperature of wettest quarter0.266 −0.079 −0.114 0.3260.148 0.599 0.062
Bio9 Mean temperature of driest quarter0.246 0.237 −0.253 −0.042 0.044 −0.295 0.064
Bio10 Mean temperature of warmest quarter0.288−0.169 −0.131 0.192 0.145 −0.110 0.033
Bio11 Mean temperature of coldest quarter0.217 0.297−0.269 0.033 0.081 −0.020 0.005
Bio12 Annual precipitation0.2830.106 0.287−0.078 0.018 −0.089 −0.254
Bio13 Precipitation of wettest month0.195 0.180 0.4280.102 0.086 −0.309 0.216
Bio14 Precipitation of driest month0.255 −0.105 0.097 −0.4120.016 0.361 0.257
Bio15 Precipitation seasonality e −0.231 0.185 0.153 0.3290.145 0.058 0.761
Bio16 Precipitation of wettest quarter0.198 0.211 0.4140.090 0.116 −0.144 −0.053
Bio17 Precipitation of driest quarter0.264 −0.095 0.101 −0.4040.025 0.257 0.202
Bio18 Precipitation of warmest quarter0.146 0.238 0.4180.181 0.006 0.331 −0.328
Bio19 Precipitation of coldest quarter0.261 −0.103 0.031 −0.404 −0.044 −0.247 0.245
Eigenvalue8.951 4.472 2.400 1.727 0.808 0.242 0.178
Variance %47.108 23.539 12.630 9.091 4.250 1.274 0.934
Cumulative %47.108 70.647 83.277 92.368 96.618 97.892 98.826
(1) Bold and underlined values indicated the most influential variables for the first four components. (2) a Mean diurnal range = mean of monthly (max. temp–min. temp); b isothermality= (Bio2/Bio7) × 100; c temperature seasonality = standard deviation × 100; d annual temperature range = Bio5–Bio6; e precipitation seasonality = coefficient of variation.
Table 3. Descriptive statistics of the main bioclimatic parameters in the cultivated areas of J. mimosifolia in China.
Bioclimatic VariableMeanStandard DeviationMaxMinVariation Coefficient %Optimum Range
Bio1 Annual mean temperature19.372.5325.7612.3813.0516.39–22.34
Bio3 Isothermality 36.159.0755.0523.3525.1025.47–46.83
Bio4 Temperature seasonality572.52121.79803.27279.1821.27429.17–715.87
Bio6 Min. temperature of coldest month6.353.4017.40−0.6053.54-
Bio7 Annual temperature range24.112.7730.5014.5011.4920.85–27.38
Bio10 Mean temperature of warmest quarter25.762.8029.0718.8310.8622.46–29.05
Bio11 Mean temperature of coldest quarter11.833.1221.883.8326.348.16–15.50
Bio12 Annual precipitation1295.02344.042742.00677.0026.57890.08–1699.96
WI Kira’s warmth index120.7628.05193.1954.7123.2387.74–153.78
CI Kira’s coldness index0.731.7314.600.00236.05-
ABT Holdridge’s annual biotemperature20.002.4126.1013.3412.0517.17–22.84
AI Aridity index24.595.8250.0712.4423.6817.74–31.45
BK Biological aridity10.602.2420.515.1421.157.96–13.24
Publisher’s Note: MDPI stays neutral with regard to jurisdictional claims in published maps and institutional affiliations.

