Article

Phenotypic Variability and Differences in the Drought Response of Norway Spruce Pendula and Pyramidalis Half-Sib Families

by
Marius Budeanu
1,*,
Ecaterina Nicoleta Apostol
2,*,
Emanuel Besliu
1,
Vlad Emil Crișan
1 and
Any Mary Petritan
1
1
National Institute for Research and Development in Forestry “Marin Drăcea”, Brașov Research Station, 13 Cloșca Street, 500040 Brașov, Romania
2
National Institute for Research and Development in Forestry “Marin Drăcea”, Voluntari, 128 Eroilor Blvd., 077190 Ilfov, Romania
*
Authors to whom correspondence should be addressed.
Forests 2021, 12(7), 947; https://doi.org/10.3390/f12070947
Submission received: 14 June 2021 / Revised: 13 July 2021 / Accepted: 15 July 2021 / Published: 19 July 2021
(This article belongs to the Section Genetics and Molecular Biology)

Abstract

:
In a changing climate, forest managers need to select productive and climate-change-resilient tree species and provenances. Therefore, assessing the growth response of provenances growing in field trials to climate provides useful information for identifying the more appropriate provenance or variety. To determine the genetic gain through selection of the most productive and resilient families and to decipher the role of crown forms of Norway spruces (Picea abies (L.) Karst.), we used 24 families with a classical crown (pyramidalis) and 24 with a narrow crown (pendula) from eight provenances, growing in a 25-year-old comparative trial. The annual wood characteristics (ring width and early- and latewood), the wood resistance (expressed by latewood proportion (LWP)), and the growth response to climate of the two spruce crown forms were investigated. No significant differences between the two spruce forms were found regarding the ring width characteristics. However, three pendula families of Stâna de Vale I provenance exhibited the highest LWP and could be included in a future selection strategy, the respective trait having also high heritability. Radial growth was positively and significantly correlated with previous September and current July precipitation and negatively with current June temperature. Both spruce forms showed good recovery capacity after a drought event.

1. Introduction

In the central, high-altitude, and especially northern European forests, in the last 50 years, an increasing trend in trees growth was recorded [1,2,3,4], most likely because of improved forest management, the use of genetically improved forest reproductive materials in afforestation [5,6], and the better-quality environmental conditions due to increasing air temperature and precipitation [7,8]. In eastern and central Europe, especially at low altitude, drought has induced a decline in Norway spruce stands in the last 30 years, visually observed by needles yellowing and growth reduction [9,10,11,12]. In contrast, at high altitudes in the Carpathian Mountains, increases in the radial growth of Norway spruce stands have been registered [13,14,15]. Norway spruce (Picea abies (L.) Karst.), one of the most important tree species in Europe, has been shown to also be affected by windstorms [16] and bark beetle [17], especially in pure stands and outside of its natural distribution range, at low altitude [18].
Improving the resistance of Norway spruce by promoting the provenances and intraspecific varieties that show superior resistance to windstorms and snow breaks is one of the concerns of geneticists. Recent analyses performed by sequencing the genome of representative spruce populations showed the need for high genetic diversity in the populations, an essential condition in adapting to climate change [19].
Trees’ annual radial increases and how they are influenced by climatic conditions, especially by air temperature and precipitation, have been the subject of numerous research studies [20,21,22,23]. Studies combining genetic and dendrochronological investigations have focused on the designation of valuable provenances, either for high radial growth or for better wood strength, expressed by the percentage of latewood, wood density, or other mechanical properties of wood (modulus of elasticity, resistance to torsion, bending, and shearing) [24,25,26,27]. The narrow-crown Norway spruce ideotype (Picea abies f. pendula), investigated especially in Finland [28,29,30] and Romania [31,32], has remarkably higher strength compared with the classical form of spruce (pyramidalis variety), which recommends it for afforestation works instead of the pyramidalis variety.
By analyzing the radial increases and wood resistance (expressed using the latewood proportion) of 24 Norway spruce narrow-crown families compared with 24 with classical-crown species in the Măneciu half-sib trial, in the southern Carpathians, at the age of 25 years, we aimed (1) to determine the genetic gain that may result from the selection of the best families for growth and, especially, for wood strength. Additionally to this objective, the correlations of wood characteristics with biometrical traits were investigated in an attempt to simplify forward selection by directing it to biometrical traits; (2) to assess if the two spruce forms differ in their radial growth response to the climatic variables.

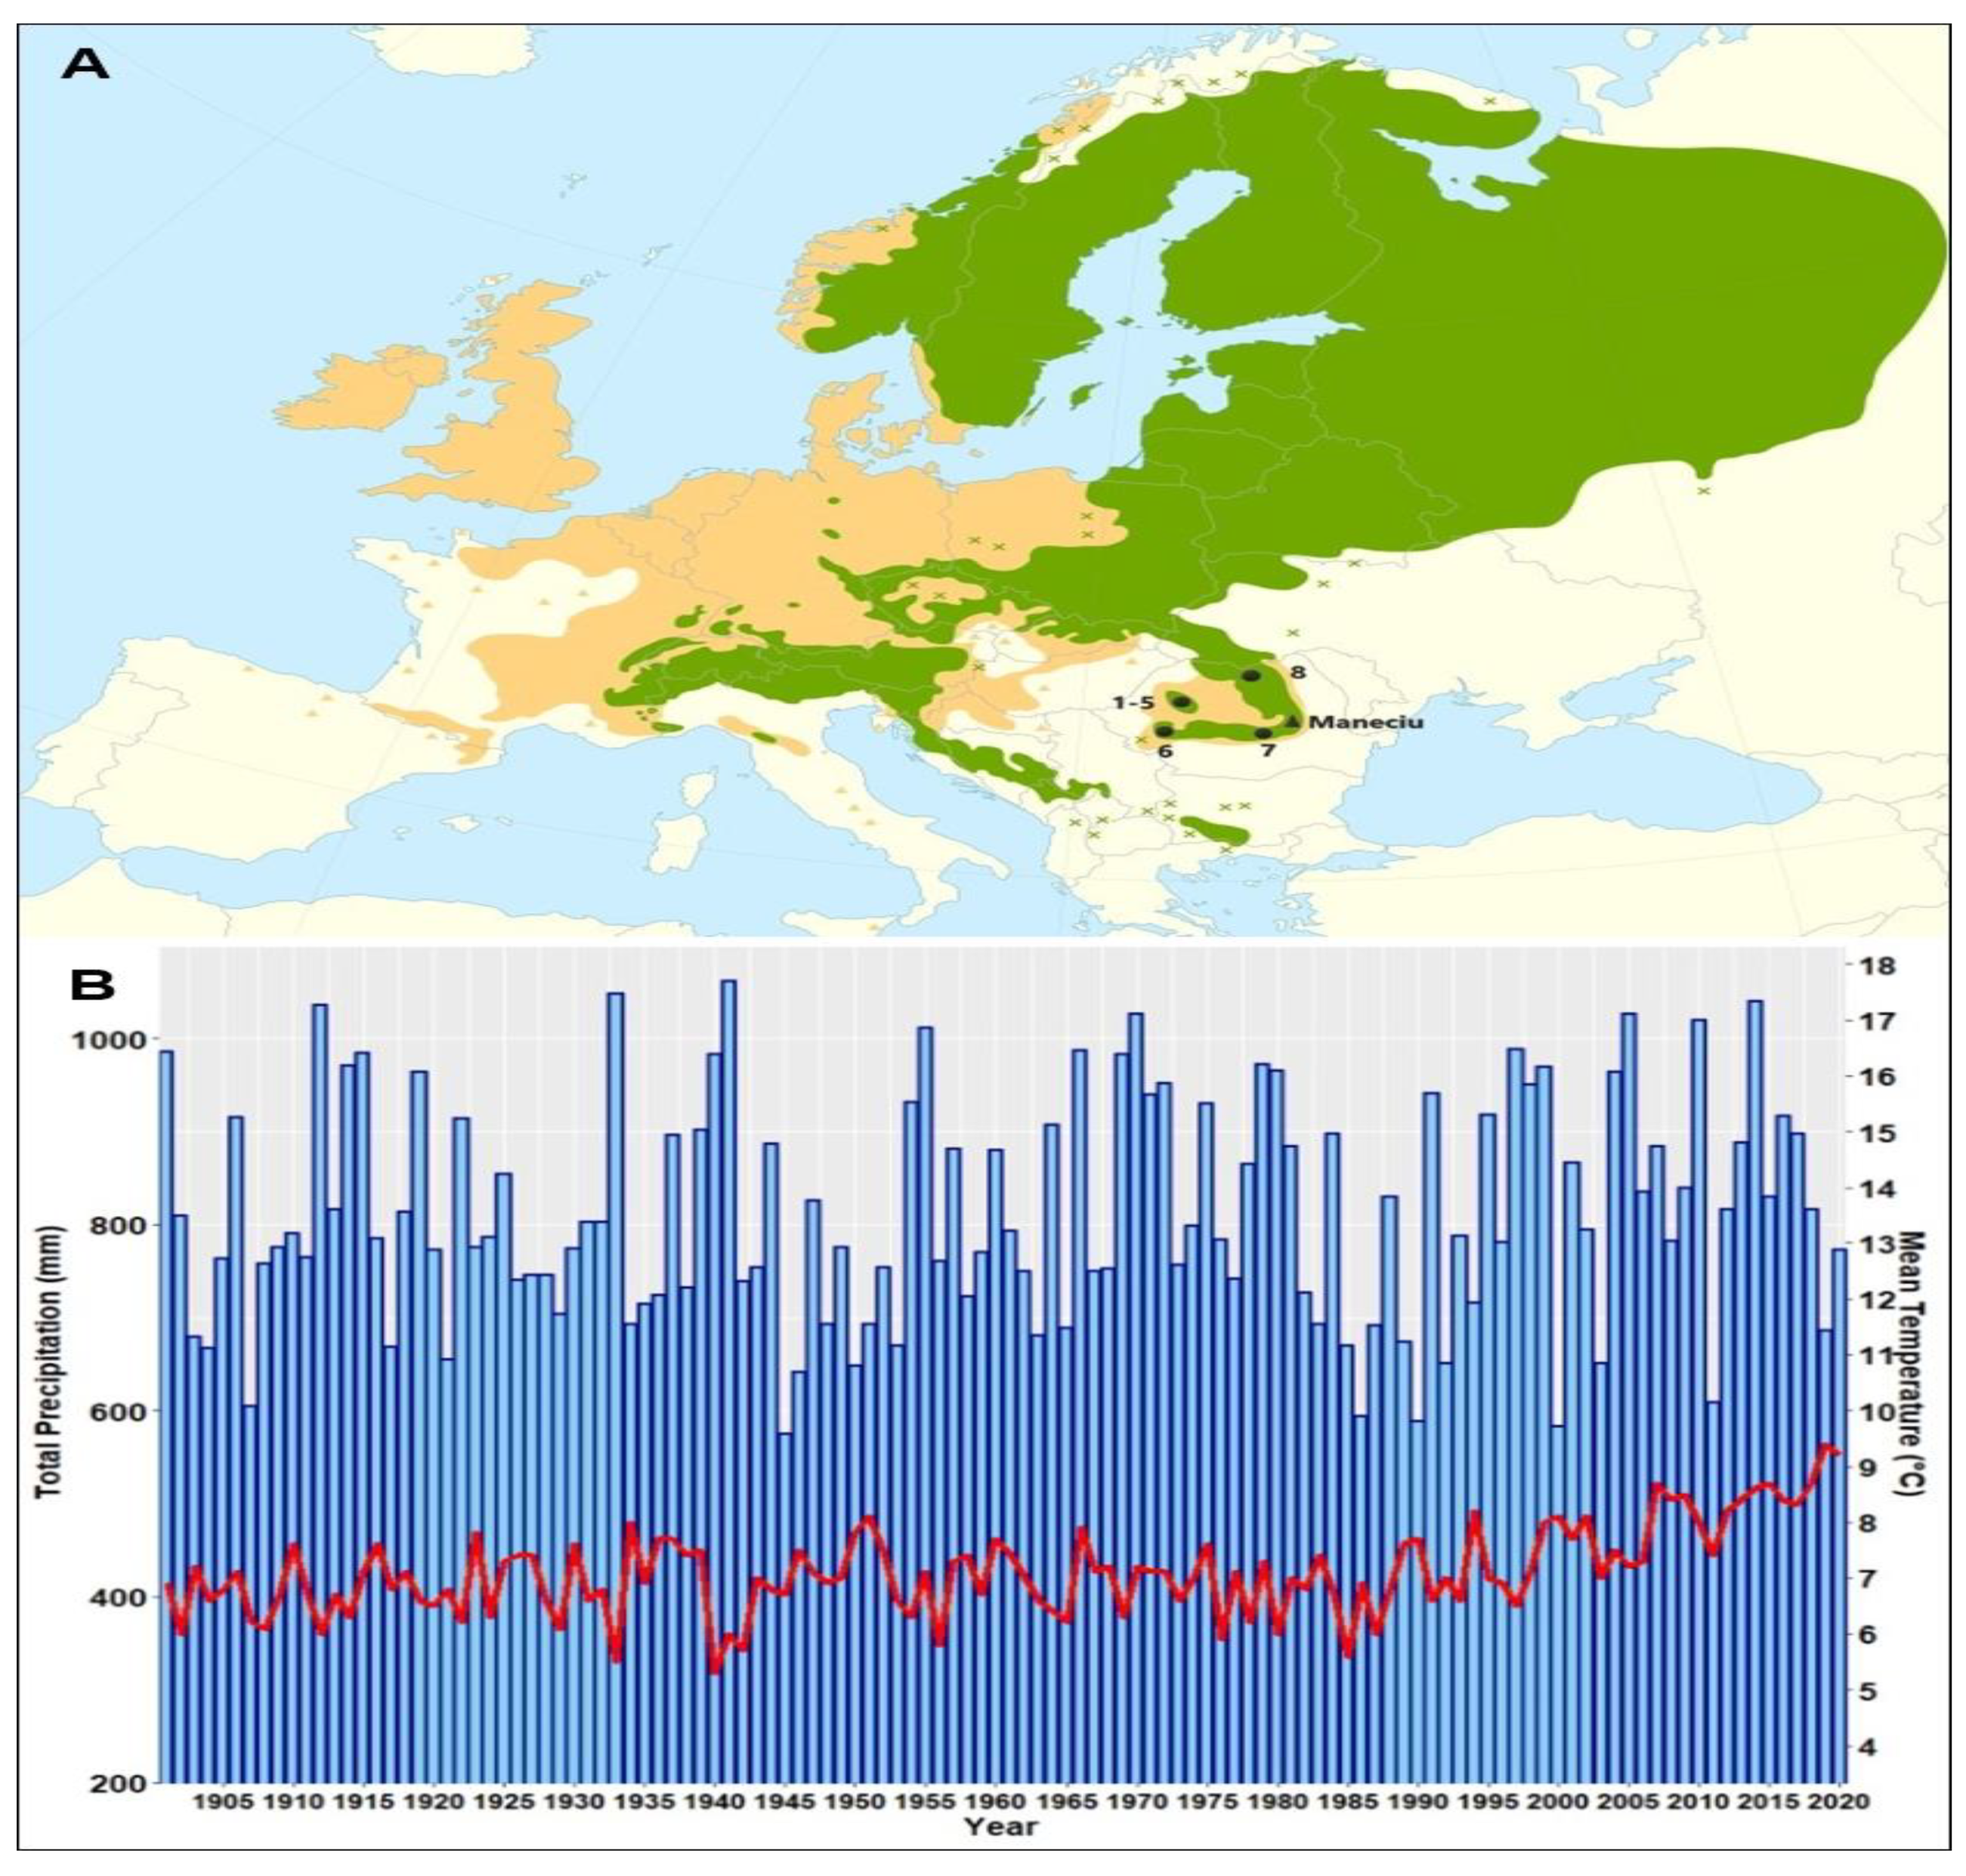
2. Materials and Methods

Seeds of eight Norway spruce provenances collected from 48 trees (24 pendula and 24 pyramidalis, three for each form in each provenance, located at a minimum 50 m between them; first a pendula tree was selected and the closest pyramidalis one, then the second and the third pair) were used to establish the Măneciu half-sib comparative trial in the spring of 1994 (Table 1). The seeds were harvested and stored separately per tree, each of them representing the mother tree of a family. The environmental conditions of the provenance origins are different, especially between the first five and the others. A 1075 m difference in altitude corresponds to a thermal amplitude of 6.7 °C and a rainfall difference of 430 mm [32].
Six of the eight provenances originated from the western Romanian Carpathians (five from Apuseni Mountains: Stâna de Vale (1–2), Izbuc (3–4), Cetățile Ponorului (5), and one, Bozovici (6), from the Banat Mountains), one from the Curvature Carpathians (7-Horoaba, the local provenance of the Măneciu trial), and the last one (Cucureasa, 8) from the eastern Carpathians (Figure 1A).
The Măneciu half-sib trial is located at the boundary between the eastern and southern Carpathians, the area known in Romania as the Curvature Carpathians, at the lower altitudinal limit of Norway spruce’s natural distribution, with a spruce-fir-beech phytoclimatic floor [32]. The trial is administrated by forest district Măneciu and was established in the production unit IV Suzana, plot 69V, on an area of 1.1 ha. The biotope is represented by a mountain mixed spruce–fir–beech forest of medium productivity on a eutricambosoil. The natural forest type is a normal beech with mull flora, with superior productivity. The slope has a southern exposition, 10° inclination, at an altitude of 820 m [33]. For the investigated period (1994–2020), the average annual temperature was 8.0 °C and the sum of annual precipitation was 846 mm [34]. Whereas the precipitation showed no clear trend within the last century, the mean temperature has increased in the last 20 years (Figure 1B).
An incomplete balanced design was used, with four replications (blocks) and 4–12 seedlings per subdivided plots, in which each of the eight provenances were represented by descendants obtained from seeds harvested from three pendula and three pyramidalis spruce trees, resulting in a total of 48 families (codes: 1–24 = pendula, 25–48 = pyramidalis). The trees were planted in 2 by 2 m spacing.
At the end of 2020, from 4 trees of each of the 48 families, one in each replication, a core was extracted using 5 mm increment borers at breast height from the trees with a diameter at breast height (dbh) closest to the average value of trees growing in the respective subplot. The drill direction was sloped parallel stem radii, to avoid wood compression and tension. Cores were dried and sanded with subsequently finer granularity until a good identification of tree rings was achieved. Next, the cores were scanned at 2400 dpi using an Epson Expression 12,000 XL, and the ring width (RW), earlywood (EW, wood formed in the early stage of the growing season) and latewood (LW, wood formed in the late period of the growing season and consisting of stronger cell walls) were measured using CooRecorder software [36]. The tree-ring series was cross-dated using the CDendro program [36]. The LWP was calculated as the LW proportion of RW. Subsequently, all series of individual growth were standardized to achieve a transformation of a series of nonstationary growth using a number of stationary indices with an average of 1 and a relatively constant variance [37]. To eliminate the influence of age, a cubic spline function with a 67% frequency of the series length was applied [38,39]. The dimensionless standardized ring width indices (RWIs) were subsequently combined into mean chronology for each Norway spruce form using the biweight robust mean [38,40]. The standardization and chronology development were performed using detrend and chron functions from the dplrR package [41] in the R environment [42].
The quality of the resulting mean chronologies (RWI) of each Norway spruce form were described for the common period (2001–2020) using different dendrochronological statistical parameters (ar 1 = first-order autocorrelation, IC = interseries correlations, EPS = expressed population signal, and Rbar = mean correlation between trees) (Table 1). With EPS values higher than 0.85, the resulted chronologies for each spruce form can be regarded as reliable to calculate the growth–climate correlations (Table 1). The climatic data for the period were downloaded from the Climatic Research Unit (CRU) website [34]. To characterize the regional climate change from the Măneciu trial, the trends in the CRU monthly mean temperature and summed precipitation for the 1901–2020 period were computed (Figure 1). For a better expression of the climate favorability range, a number of climatic indices were calculated:
-
De Martonne aridity index: AI = P × (T + 10)−1, where P is the amount of the annual precipitation and T is the average annual temperature; the optimal for spruce is in the range of 40–60 [43].
-
Ellenberg Quotient: Eq = Tw × 1000 × P−1, where Tw represents the temperature of the warmest month of the year [44]. Ellenberg and Leuschner [44] set an ideal threshold for beech–fir (also valid for spruce) favorability for Eq values lower than 20.
-
Standardized precipitation index (SPI): g ( x ) = 1 β α Г ( α )   x α 1 e x / β , for x > 0, where α is a shape parameter, β is a scale parameter, x is the precipitation amount, and Г(α) is the gamma function. The SPI index uses a probability density function of the gamma distribution to determine the wet or drought periods for a certain period of time based on the precipitation records [45,46,47].
To quantify the climate–growth relationships, the RWIs of both Norway spruce forms were correlated against monthly climate variables (temperature, precipitation, and SPI). For each climatic variable, data from the preceding June until the current September were correlated with the current-year RWI. The analyses were performed using the treeclim package [48] in the R environment [42].
To evaluate if the two Norway spruce forms respond differently to the climatic extremes, we calculated the resistance (Rt), resilience (Rs), and recovery (Rc) indices according to Lloret et al. [49] for 2012, the year with the lowest growth in the 2001–2020 period. Resistance (Rt) describes the tree incremental growth reduction during drought (Rt = 1, trees are not affected by drought; Rt < 1, trees are affected by drought). Rt = Dr/preDr, whereas Dr is the ring width during drought and preDr is the mean annual increase in the three years before the drought event. Recovery (Rc = postDr/Dr) is the ratio between the mean annual increment of the three consecutive years after a drought year (postDr) and the ring width during drought and describes how a tree can recover after a drought period. Resilience (Rs = postDr/preDr) describes the capacity of a tree to reach pre-drought increment after a drought event with Rs = 1 for full restoration and Rs < 1 indicating lasting growth reductions. Rs is described by the ratio of the increase in the three years after drought (postDr) to before drought (preDr). All drought response indicators were calculated for the untransformed ring width series [47,50]. These indices were calculated in R using the pointRes package [51]. Comparisons of different variables between the pendula and pyramidalis trees were performed using the t-test, or the Mann–Whitney U-test when the variables did not follow normal distribution.
The half-sib family mean heritability ( h F 2 ) was determined to express the genetic inheritance, using [52]: h F 2 = σ A 2 σ Ph 2 2 = σ f 2 σ f 2 + σ fxr 2 r + σ e 2 rxn , where σ A 2 is the additive genetic variance, σ Ph 2 is the phenotypic variance, σ f 2 is the family variance, σ fxr 2 is the family × replication interaction variance, σ e 2 is the residual variance, r is the number of replications, and n is the number of seedlings/plot.
The genetic gain was calculated at 10% selection intensity, as [53,54]:
Δ G = i   ×   h 2 × σ P , where i is the selection intensity, h2 is the heritability, and σP is the phenotypic standard deviation.
The data were statistically processed using breedR (a genetic package of the R program) [42,55]. For SPI, MDM software was used [46].

3. Results

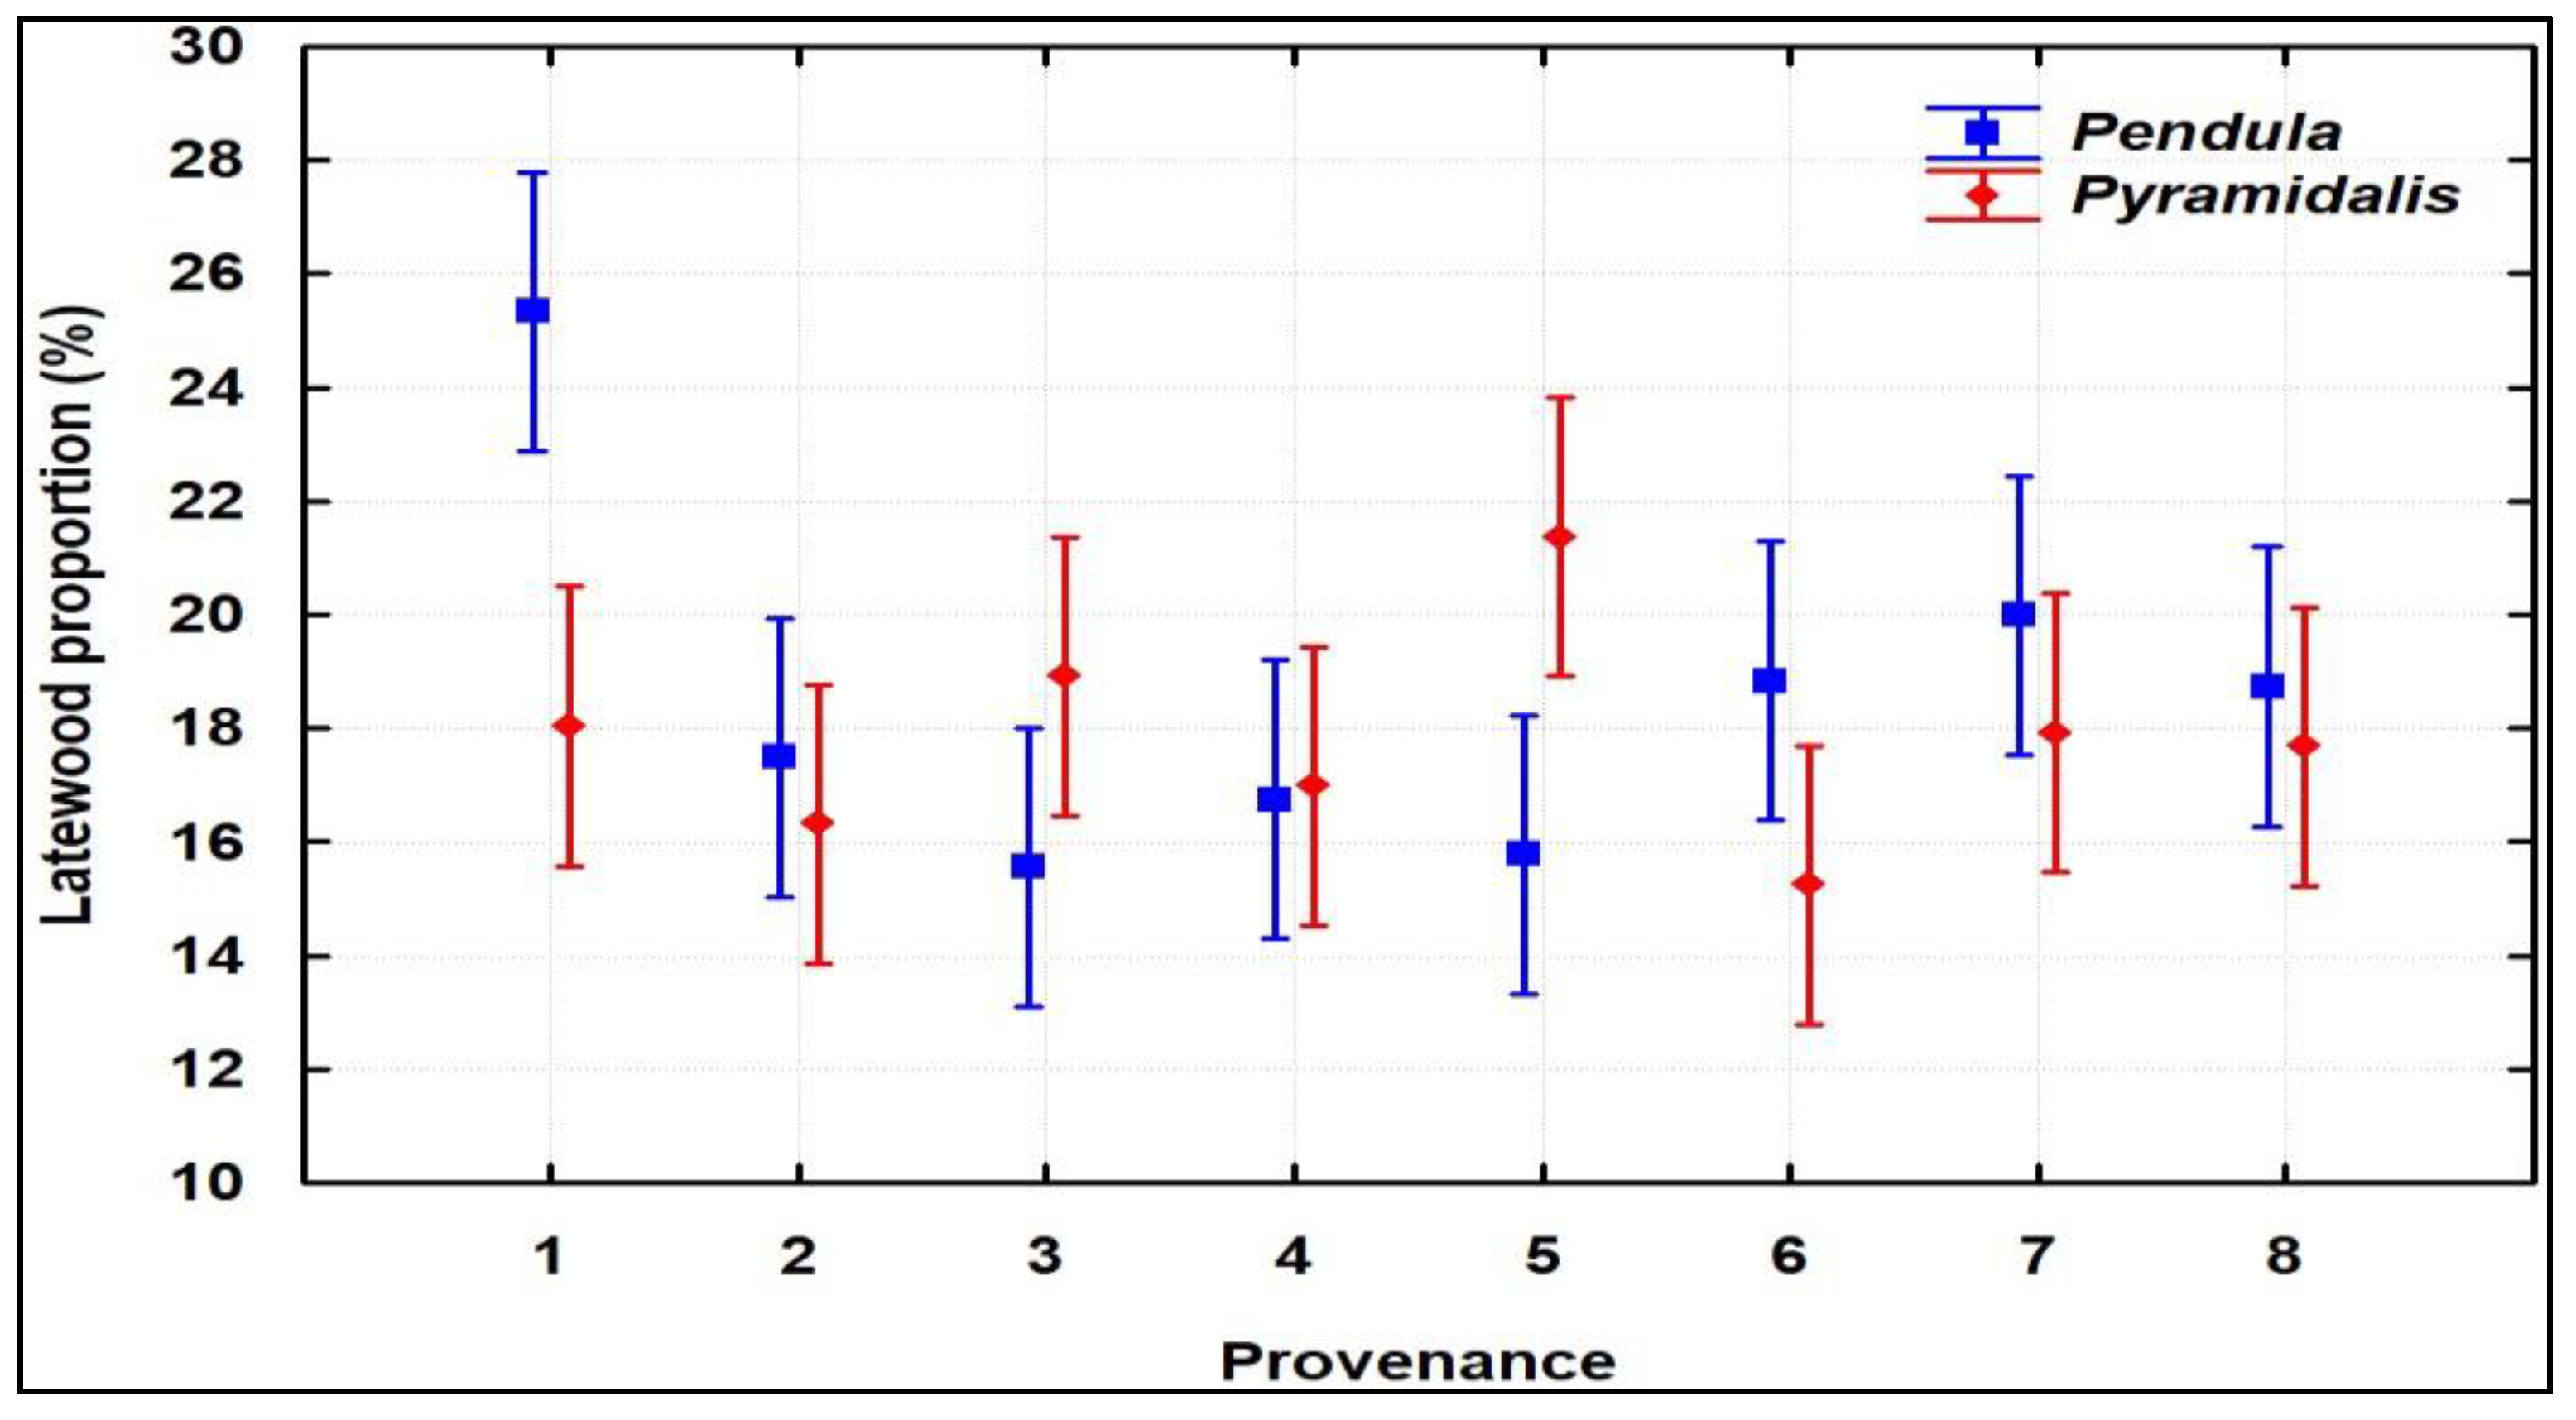
3.1. Phenotypic Variability, Heritability and Genetic Gain

For all analyzed wood traits—ring width (RW), earlywood (EW), latewood (LW), and latewood proportion (LWP)—no significant influences of replications (blocks) were found, whereas the family factor had a highly significant influence (p < 0.001). The provenance factor played a highly significant role for RW and EW (p < 0.001); for LW, the provenance × crown form interaction had the same influence (p < 0.001). For LWP, the provenance and provenance × crown form interaction had a distinctly (p < 0.01) and highly (p < 0.001) significant influence, respectively.
The average RW of the pendula families was 4.58 mm/year, higher by 2% (statistically insignificant) than the average value recorded for the pyramidalis families (Table 2). Six of the best ten families had the pendula crown form and, with one exception, originated in the Apuseni Mountains. The four pyramidalis families with higher RW values belong to the Apuseni provenances (Figure S1). At the provenance level, 3-Izbuc I registered the highest RW (5.05 mm/year), followed by the other two provenances from the Apuseni Mountains. Only for pendula trees did the 1-Stâna de Vale I provenance exceed the provenance previously highlighted.
For EW, the differences between the mean values of the two spruce forms were even smaller (1%), also in favor of pendula trees. Five of each crown form were among the most productive 10 families, with nine of them originating from the Apuseni Mountains (Figure S1). Also for EW, the 3-Izbuc I provenance registered the highest value (4.175 mm/year), followed by the same two provenances (2–Stâna de Vale II and 4–Izbuc II) from the Apuseni Mountains.
For LW and LWP (Figure S2), which are the most important traits because they indicate wood strength, 6% and 4.5% higher average values, respectively, were registered once again in favor of pendula-crown trees (statistically insignificant but with small p-values of 0.19 and 0.28, respectively), with outstanding performances being displayed by the 1–3 families of the Stâna de Vale I provenance, originating from the Apuseni Mountains (Figure 2).
The growth dynamics of the 5-year intervals showed a significant decrease in RW, whereas for LWP, an opposite trend was registered (Figure S3). Specifically, RW decreased from 7.863 mm/year in 2001–2005 to 2.036 mm/year in 2016–2020; LWP constantly increased from 16% to 28.4% in the same periods. Two of the three families of the Stâna de Vale I provenance (families 1 and 3) highlighted for LWP showed higher LWP in all 5-year periods, while family 2 dropped in the ranking, from 6th place in the first two intervals, to 36th place in the last period (2016–2020).
The radial increase variability was analyzed by calculating the coefficients of variation for RW, EW, LW, and LWP. The highest variability was recorded for LW and LWP, especially for pendula families (Table 3), favoring forward selection and suggesting a high potential for adaptation to future global warming.
The correlations of RW, EW, LW, and LWP, with some biometrical traits (diameter at breast height (dbh), tree height (Th), tree volume, tree slenderness (Ts), and crown diameter) were generally insignificant, but an important correlation was found between LWP and tree slenderness (negative and significant, r = −0.35*, in 2011–2015), indicating the reduction in trees’ slenderness with increasing LWP, favoring Norway spruce stand stability to wind storms and snow breaks. The correlation was even stronger when we analyzed only the pendula trees, reaching a maximum value in the 2016–2020 period (r = −0.45*) (*, significant for p < 0.05).
For wood traits, the highest inheritance rate was registered for LW and LWP, and especially for pendula families (Table 4). The forward selection for stand stability can target pendula families according to LW; for RW, the pyramidalis families would be more appropriate. At this moment, a genetic gain of 13.3% can be obtained by selection of the five best pendula families for LW (Table 4).

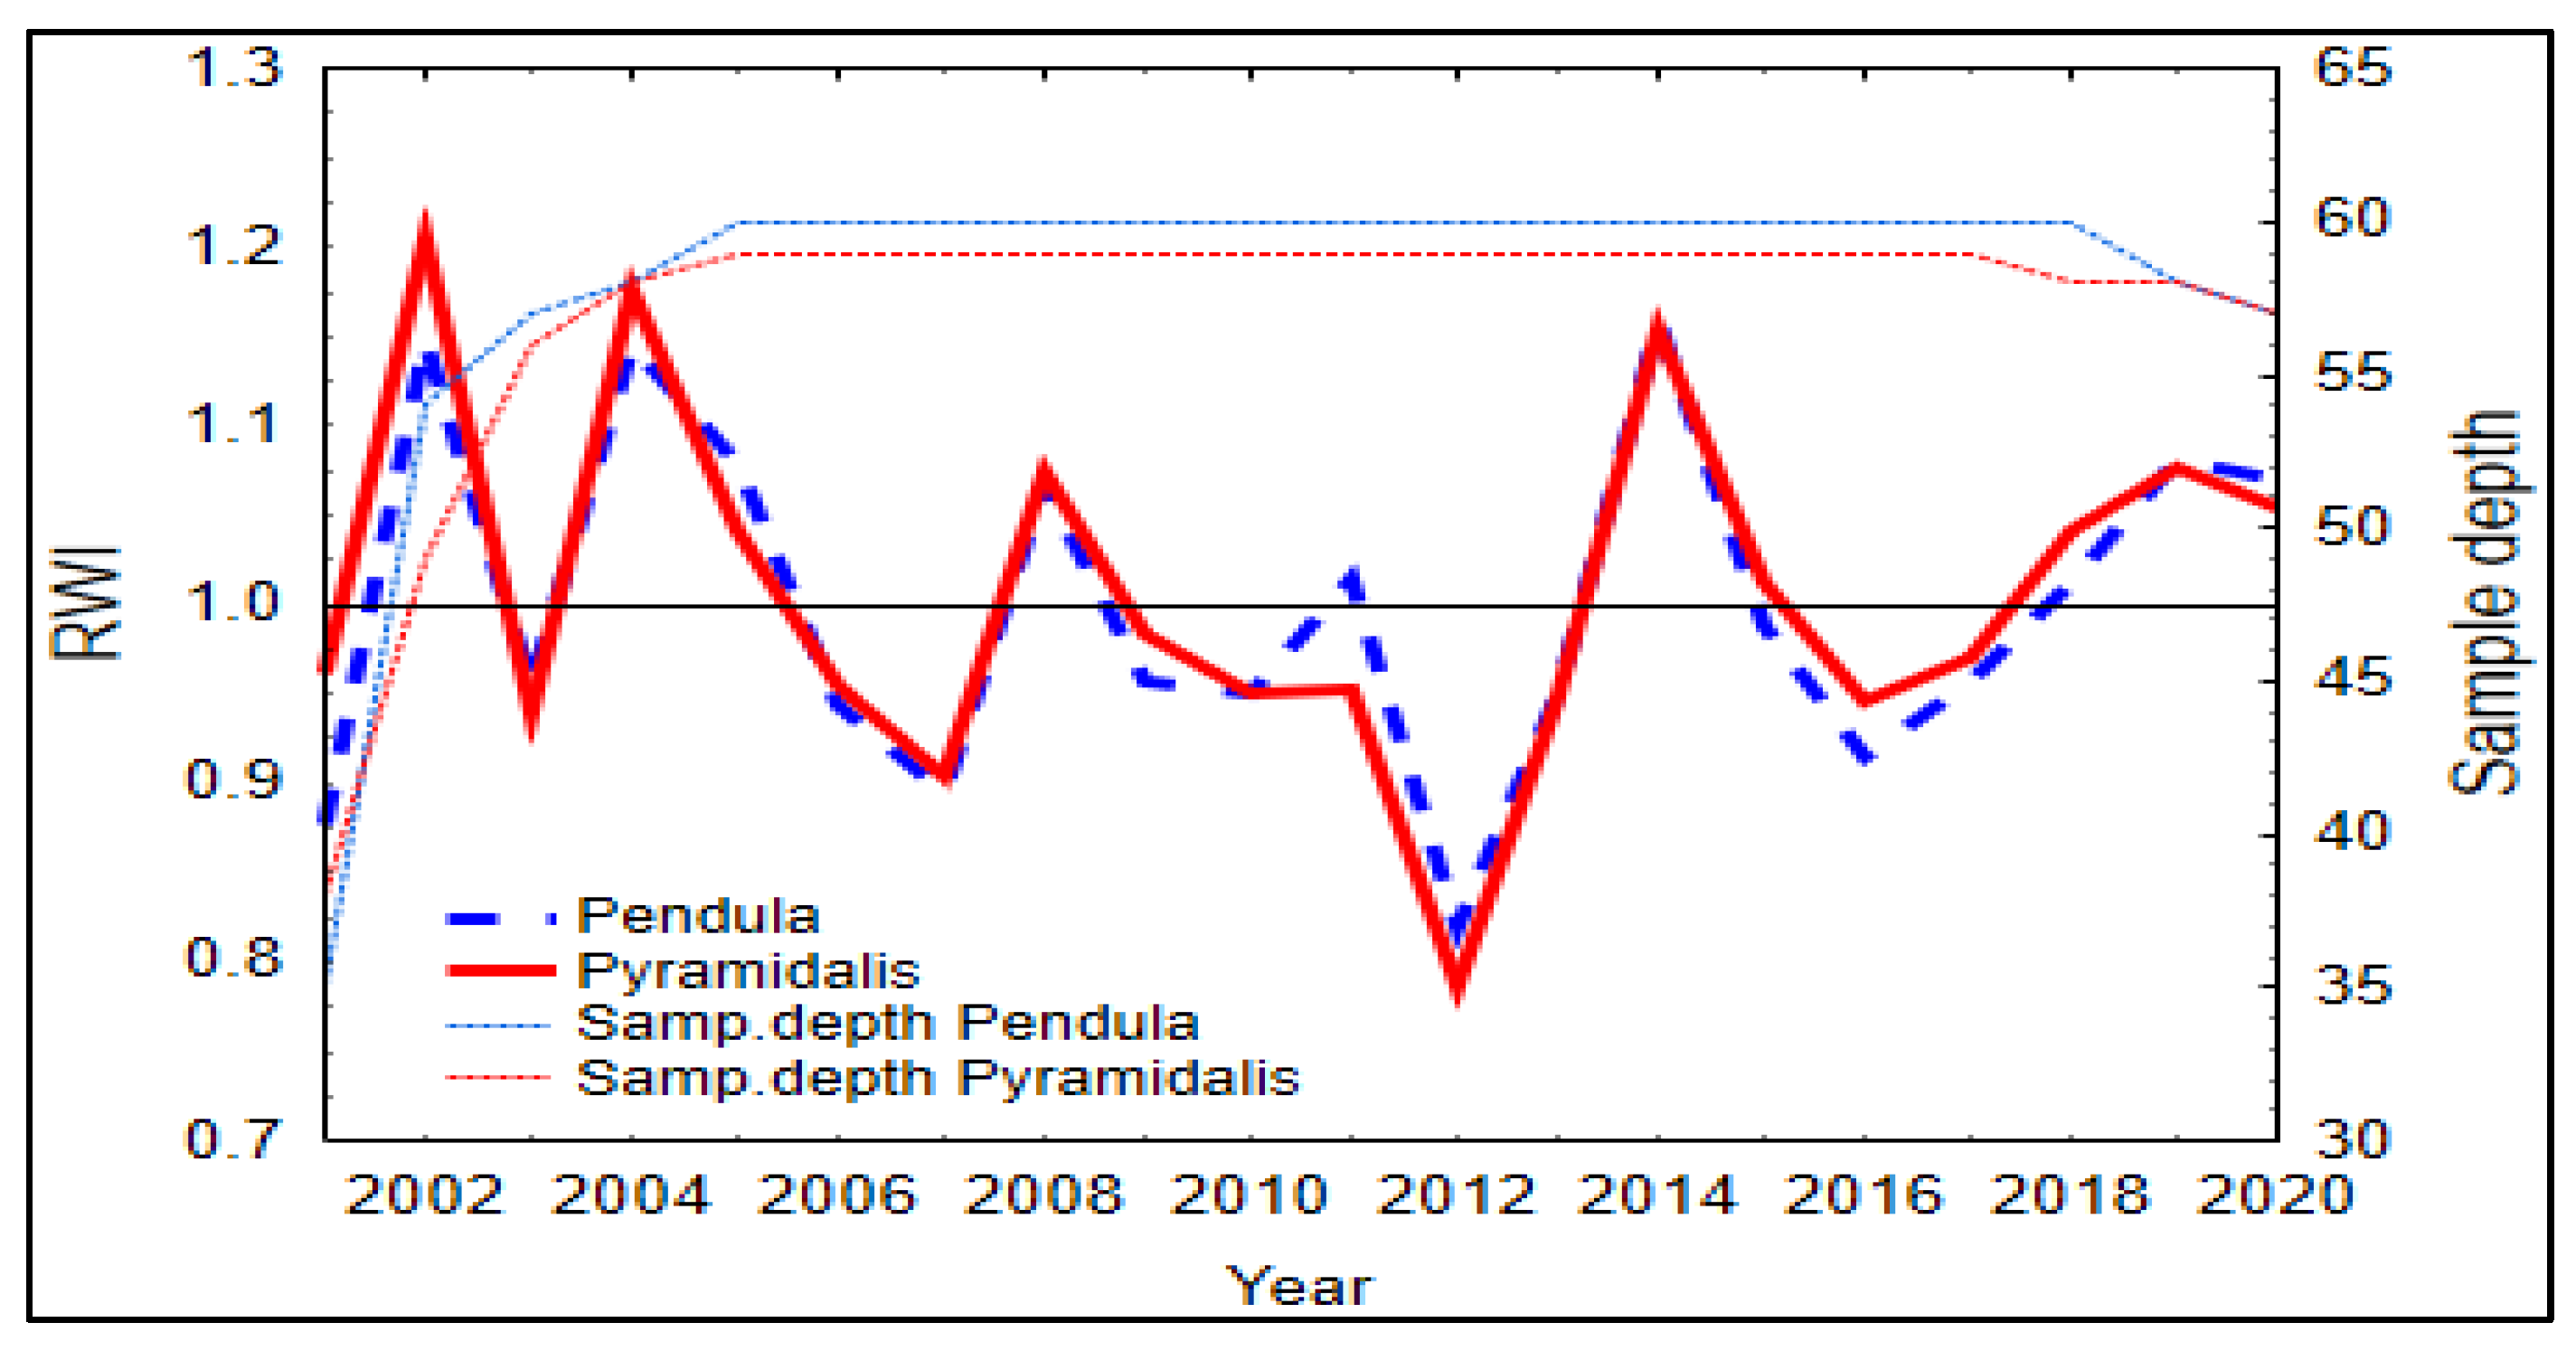
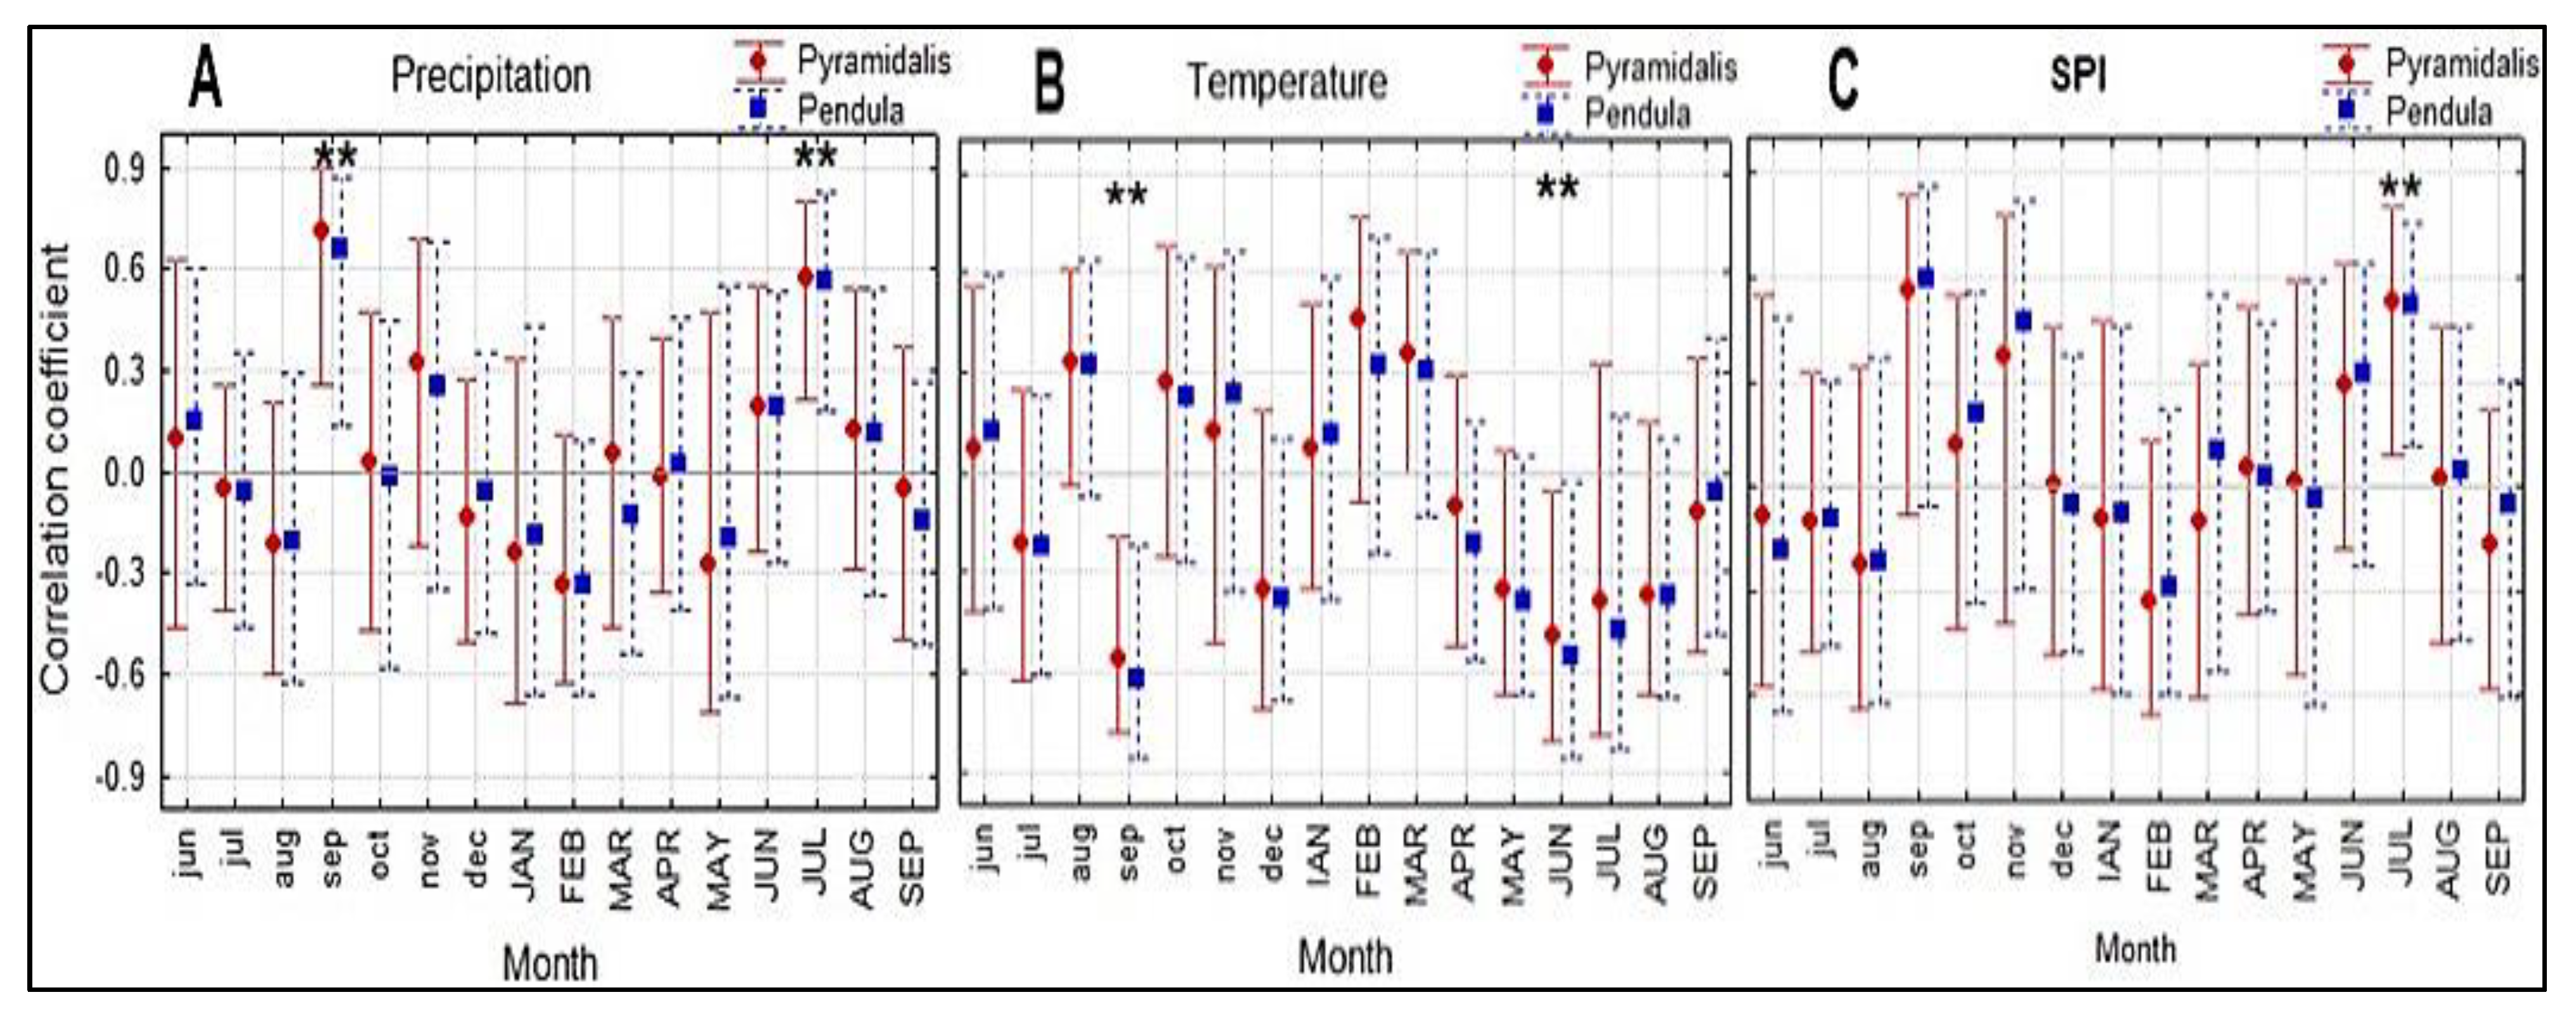
3.2. Climate and Growth Patterns of the Two Spruce Forms

For the 2001–2020 period in the Măneciu trial, the De Martonne aridity index (AI) registered an average value of 47, which represents a favorable climate for Norway spruce. However, in some years (2003, 2011, and 2019), the AI was below the favorable limit (40), becoming a limiting factor for the optimal development of spruce.
The Ellenberg index indicated limiting climatic conditions for beech–fir–spruce (values higher than 20) in 16 of the 20 years of the analyzed period, but especially in the same three years indicated by the De Martonne aridity index, with the highest value (30) being registered in 2011.
The synchronicity of tree rings series of the two spruce forms was similar, being slightly higher for the pendula form (0.95 vs. 0.94 EPS values; Table 2). The two spruce forms showed similar patterns in the standardized growth indices, with the greatest growth depression in 2012 (Figure 3), the year following the driest year of the analyzed time period (2011). In 2012, SPI registered negative values during the vegetation season and did not benefit from the water supply in the soil (Figure S4).
Both studied forms of Norway spruce showed a similar response to all three climatic variables (Figure 4). The climatic conditions in September in the previous year had a significant influence (positive for precipitation and negative for temperature) on the radial growth of both Norway spruce forms. The current July SPI and precipitation significantly and positively correlated with the radial growth of the spruce trees, whereas the current June temperature negatively influenced tree growth (Figure 4).
For both forms of spruce, LW and LWP were significantly favorably influenced only by increased temperatures in August and September (r = 0.67 *** and 0.53 **, respectively) and reduced precipitation in September (r = −0.48 *) of the current year.
The trees belonging to both Norway spruce forms did not differ significantly according to resistance, resilience, or recovery indices (Figure 5). The pyramidalis form showed a slightly better recovery and resilience but a lower resistance. However, the spruce trees growing in the Măneciu trial seem to have a lower resistance and resilience to drought, as indicated by values lower than one. Moreover, the values slightly greater than one for recovery indices can be interpreted as the spruce trees being able to recover after this drought event. An analysis at the provenance level (Figure S5) showed generally higher resistance and resilience of the first provenances of the Apuseni Mountains, whereas the highest recovery capacity was found for the local provenance (No. 7).

4. Discussion

We did not identify statistically significant differences between the two crown forms of Norway spruce in terms of wood traits (RW, EW, LW, and LWP); however, the provenances from the Apuseni Mountains, the most well-known area of the Romanian Carpathians in terms of the existence of the narrow-crown spruce ideotype (Picea abies f. pendula) [18,31], were highlighted both for radial increase and wood resistance, expressed by LWP. A low LWP represents a risk factor for spruce stands, because the mechanical resistance of wood is reduced and the vulnerability to cavities is increased [56,57]. All three pendula families of 1-Stâna de Vale I provenance exhibited the highest LWP and could be included in a forward selection strategy. One pendula family (No. 19) of the local provenance, 7-Horoaba, originating from the highest altitudinal level (1675 m), also stood out for LWP. The fifth family, to reach a selection intensity of 10%, is pendula No. 24, from the 8-Cucureasa provenance. The pendula families of the 6-Bozovici provenance with good LWP results (Figure 2) should be excluded from future selection, because they originate from a low altitudinal level, below the altitudinal risk threshold for Norway spruce [58]. The coefficients of variation (CVRW, CVEW, CVLW, and CWLWP) also indicated the opportunity for selection based on LW and LWP. The same decreasing trend in radial increments over 5-year intervals and similar values for LWP were previously reported in Romania [59,60], Finland [30], and Sweden [61]. A doubled LWP value was reported in Latvia [62]. The coefficients of variation are slightly higher than those registered in Finland [30], but in accordance with a Finnish study regarding the higher values for pendula than pyramidalis for the latewood coefficient of variation. Also, in consonance with the study of northern Europe [30], the CVRW and CVEW were lower for pendula than for pyramidalis trees.
The correlations between biometrical and wood traits show the possibility of phenotypic selection for tree slenderness (Ts = Dbh/Th), an indicator of stand resistance to the combined action of wind and snow, which was favorable and significantly correlated with LWP. This time, the selection must be directed in favor of pendula trees.
The highest heritability (0.56) was registered by pendula families for LW. The genetic gain, at 10% selection intensity, also indicates that a forward selection strategy may be directed in favor of the five best pendula families according to LW: three families from the Apuseni Mountains, one from the Curvature Carpathians (the same division as the Măneciu trial), and one from the eastern Carpathians may be included in a future breeding strategy. In the same trial, the family heritability of biometrical traits was generally smaller (0.13–0.21) for both crown forms of spruce, except for pendula Th heritability [6]. Higher inheritance rate for wood traits compared with biometrical traits were previously reported in Sweden in a half-sib experiment with the same-age trees [63], and in Romania [64].
The genetic and environmental components involved in inter- and intraspecific competition play an essential role in the adaptability of species to drought. Conifers seem to have more favorable recovery after drought compared with broadleaf species and a similar resistance too. However, higher competition can reduce resistance and improve recovery [65]. Provenance trials have been used to analyze the climate growth response variation of Norway spruce [66,67,68], but the intraspecific genetic response is poorly understood. Previous research identified significant genetic variations in the drought response both within and between Norway spruce provenances [69]. In the Măneciu provenances trial (820 m a.s.l.), the two investigated crown forms trees showed a similar response to the climate variables (Figure 4) as well as after a strong drought event (Figure 5), generally without significant differences between provenances (Figure S5). Although the driest year of the investigated period was 2011, our spruce trees reacted particularly the next year, for which the lowest growth was observed. This can be explained by the low SPI indices (−2.44 and −3.46, Figure S4) from September and November 2011, and negative values of this drought index during the summer of 2012. Like Budeanu et al. [70], who studied the growth response of European beech in the eastern part of Romania to climate, we found that the water availability during September of the previous year had a significant role in the growth formation. In addition to the precipitation amount in the previous September, the temperature of this month negatively impacted the current radial growth of the studied trees, in agreement with the findings of Sidor et al. [15] for spruce populations growing at sites situated 800–1200 m a.s.l. in eastern Romania. These authors also found a negative correlation between the June temperature of the formation year of the tree ring and radial growth for spruce populations growing in stands at an altitude lower than 900 m a.s.l. [15], which is consistent with the identified growth response to temperature of the current year in our study.
The mean values of resistance and resilience indices calculated for 2012, the year with the largest radial growth, were similar for both spruce forms and lower than one, which indicates a lower resistance of the investigated trees to drought and a lasting growth reduction. Similarly, in a comparative study with more species, Bosela et al. [19] found in most cases, and especially in the plot located at an altitude lower than 800 m, resilience and resistance mean values lower than one for spruce for different drought years. Furthermore, spruce was the least-resistant and least-resilient species among those studied: spruce, beech, fir, and pine. The higher limitation of spruce to drought is considered as a possible consequence of its shallow root system [71]. The relatively young trees of the Măneciu trial showed better recovery, remarkable for the local provenance. The highly negative impact of the two consecutive dry years on spruce radial growth is in accordance with previous studies [72,73,74]. Selection of genotypes with resistance to drought will be an important criterion for future breeding strategy [73]. It is also necessary to replace spruce monocultures with spruce–beech–fir mixed forests [75,76], with Norway spruce presenting much better resistance to drought in mixtures with beech than in monocultures [77].

5. Conclusions

The ring width differences between the two crown forms of Norway spruce (pendula and pyramidalis) were insignificant. However, all three pendula families of Stâna de Vale I provenance exhibited the highest LWP and could be included in a future selection strategy for stand stability to wind and snow. The LW and LWP presented the highest inheritance rate, being the most suitable for forward selection.
The precipitation in September of the previous year had a positive and significant influence on the radial growth of both Norway spruce forms. The current July SPI and precipitation significantly and positively correlated with the radial growth of the spruce trees, whereas the current June temperature negatively influenced the tree growth.
The pendula trees showed a slightly better resistance but a lower recovery after a drought experience compared with pyramidalis trees. However, the recovery index slightly greater than 1 indicated the good recovery capacity of both crown forms of Norway spruce.

Supplementary Materials

The following are available online at https://www.mdpi.com/article/10.3390/f12070947/s1, Figure S1: Duncan’s test for ring width (RW) and earlywood (EW) at the family level. Figure S2: Duncan’s test for latewood (LW) and latewood proportion (LWP) at the family level. Figure S3: Five-year dynamics of ring width (RW) and latewood proportion (LWP). Figure S4: Monthly SPI index of the 2011–2012 drought period. Figure S5: Resistance, recovery, and resilience of the two crown forms in each provenance.

Author Contributions

Conceptualization, M.B., E.N.A., E.B., V.E.C. and A.M.P.; methodology, M.B. and A.M.P.; software, M.B., A.M.P., E.B. and V.E.C.; validation, E.N.A.; formal analysis, M.B., E.B. and A.M.P.; investigation, M.B. and A.M.P.; resources, M.B.; data curation, M.B. and E.B.; writing—original draft preparation, M.B. and A.M.P.; writing—review and editing, E.N.A.; visualization, E.N.A.; supervision, M.B.; project administration, M.B.; funding acquisition, M.B. All authors have read and agreed to the published version of the manuscript.

Funding

This paper was financed by the Romanian Ministry of Research, Innovation and Digitalization, in the frame of the Nucleu Programme, contracted with the National Institute for Research and Development in Forestry “Marin Drăcea” (project PN19070302).

Institutional Review Board Statement

Not applicable.

Informed Consent Statement

Not applicable.

Acknowledgments

We wish to thank our devoted colleagues Dan Pepelea and Gabriela Grosu for their help with the field measurements. We would also like to thank MDPI English Editing for polishing the English text.

Conflicts of Interest

The authors declare no conflict of interest. The funders had no role in the design of the study; in the collection, analyses, or interpretation of data; in the writing of the manuscript, or in the decision to publish the results.

References

  1. Pretzsch, H.; Biber, P.; Schütze, G.; Uhl, E.; Rötzer, T. Forest stand growth dynamics in Central Europe have accelerated since 1870. Nat. Commun. 2014, 5, 4967. [Google Scholar] [CrossRef] [PubMed] [Green Version]
  2. Kauppi, P.E.; Posch, M.; Pirinen, P. Large Impacts of Climatic Warming on Growth of Boreal Forests since 1960. PLoS ONE 2014, 9, e111340. [Google Scholar] [CrossRef] [PubMed] [Green Version]
  3. Henttonen, H.M.; Nöjd, P.; Mäkinen, H. Environment-induced growth changes in the Finnish forests during 1971–2010—An analysis based on National Forest Inventory. For. Ecol. Manag. 2017, 386, 22–36. [Google Scholar] [CrossRef] [Green Version]
  4. Mensah, A.A.; Holmström, E.; Petersson, H.; Nyström, K.; Mason, E.G.; Nilsson, U. The millennium shift: Investigating the relationship between environment and growth trends of Norway spruce and Scots pine in northern Europe. For. Ecol. Manag. 2021, 481, 118727. [Google Scholar] [CrossRef]
  5. King, G.M.; Gugerli, F.; Fonti, P.; Frank, D. Tree growth response along an elevational gradient: Climate or genetics? Oecologia 2013, 173, 1587–1600. [Google Scholar] [CrossRef] [PubMed] [Green Version]
  6. Marcu, N.; Budeanu, M.; Apostol, E.N.; Radu, R.G. Valuation of the Economic Benefits from Using Genetically Improved Forest Reproductive Materials in Afforestation. Forests 2020, 11, 382. [Google Scholar] [CrossRef] [Green Version]
  7. Laubhann, D.; Sterba, H.; Reinds, G.J.; De Vries, W. The impact of atmospheric deposition and climate on forest growth in European monitoring plots: An individual tree growth model. For. Ecol. Manag. 2009, 258, 1751–1761. [Google Scholar] [CrossRef]
  8. Rohner, B.; Waldner, P.; Lischke, H.; Ferretti, M.; Thürig, E. Predicting individual-tree growth of central European tree species as a function of site, stand, management, nutrient, and climate effects. Eur. J. For. Res. 2018, 137, 29–44. [Google Scholar] [CrossRef]
  9. Kharuk, V.; Im, S.T.; Dvinskaya, M.L.; Golukov, A.S.; Ranson, K.J. Climate-induced mortality of spruce stands in Belarus. Environ. Res. Lett. 2015, 10, 125006. [Google Scholar] [CrossRef] [Green Version]
  10. Cienciala, E.; Tumajer, J.; Zatloukal, V.; Beranová, J.; Holá, Š.; Hůnová, I.; Russ, R. Recent spruce decline with biotic pathogen infestation as a result of interacting climate, deposition and soil variables. Eur. J. For. Res. 2017, 136, 307–317. [Google Scholar] [CrossRef]
  11. Holuša, J.; Lubojacký, J.; Čurn, V.; Tonka, T.; Lukášová, K.; Horák, J. Combined effects of drought stress and Armillaria infection on tree mortality in Norway spruce plantations. For. Ecol. Manag. 2018, 427, 434–445. [Google Scholar] [CrossRef]
  12. Sedmáková, D.; Sedmák, R.; Bosela, M.; Ježík, M.; Blazenec, M.; Hlásny, T.; Marušák, R. Growth-climate responses indicate shifts in the competitive ability of European beech and Norway spruce under recent climate warming in East-Central Europe. Dendrochronologia 2019, 54, 37–48. [Google Scholar] [CrossRef]
  13. Büntgen, U.; Frank, D.; Kaczka, R.J.; Verstege, A.; Zwijacz-Kozica, T.; Esper, J. Growth responses to climate in a multi-species tree-ring network in the Western Carpathian Tatra Mountains, Poland and Slovakia. Tree Physiol. 2007, 27, 689–702. [Google Scholar] [CrossRef] [PubMed] [Green Version]
  14. Treml, V.; Ponocná, T.; Büntgen, U. Growth trends and temperature responses of treeline Norway spruce in the Czech-Polish Sudetes Mountains. Clim. Res. 2012, 55, 91–103. [Google Scholar] [CrossRef] [Green Version]
  15. Sidor, C.G.; Popa, I.; Vlad, R.; Cherubini, P. Different tree-ring responses of Norway spruce to air temperature across an altitudinal gradient in the Eastern Carpathians (Romania). Trees 2015, 29, 985–997. [Google Scholar] [CrossRef]
  16. Seidl, R.; Schelhaas, M.-J.; Rammer, W.; Verkerk, P.J. Increasing forest disturbances in Europe and their impact on carbon storage. Nat. Clim. Chang. 2014, 4, 806–810. [Google Scholar] [CrossRef] [Green Version]
  17. Hlásny, T.; Turčáni, M. Persisting bark beetle outbreak indicates the unsustainability of secondary Norway spruce forests: Case study from Central Europe. Ann. For. Sci. 2013, 70, 481–491. [Google Scholar] [CrossRef] [Green Version]
  18. Budeanu, M.; Apostol, E.N.; Popescu, F.; Postolache, D.; Ioniţă, L. Testing of the narrow crowned Norway spruce ideotype (Picea abies f. pendula) and the hybrids with normal crown form (pyramidalis) in multisite comparative trials. Sci. Total. Environ. 2019, 689, 980–990. [Google Scholar] [CrossRef] [PubMed]
  19. Bosela, M.; Kulla, L.; Roessiger, J.; Šebeň, V.; Dobor, L.; Büntgen, U.; Lukac, M. Long-term effects of environmental change and species diversity on tree radial growth in a mixed European forest. For. Ecol. Manag. 2019, 446, 293–303. [Google Scholar] [CrossRef]
  20. Franceschini, T.; Bontemps, J.-D.; Gelhaye, P.; Rittié, D.; Hervé, J.-C.; Gégout, J.-C.; Leban, J.-M. Decreasing trend and fluctuations in the mean ring density of Norway spruce through the twentieth century. Ann. For. Sci. 2010, 67, 816. [Google Scholar] [CrossRef] [Green Version]
  21. Franceschini, T.; Bontemps, J.-D.; Leban, J.-M. Transient historical decrease in earlywood and latewood density and unstable sensitivity to summer temperature for Norway spruce in northeastern France. Can. J. For. Res. 2012, 42, 219–226. [Google Scholar] [CrossRef]
  22. Semeniuc, A.I.; Popa, I. Comparative analysis of tree ring parameters Variation in four coniferous species: (Picea abies, Abies alba, Pinus sylvestris and Larix decidua). Int. J. Conserv. Sci. 2018, 9, 591–598. [Google Scholar]
  23. Vlad, R.; Zhiyanski, M.; Dincă, L.; Sidor, C.G.; Constandache, C.; Pei, G.; Ispravnic, A.; Blaga, T. Assessment of the density of wood with stem decay of Norway spruce trees using drill resistance. Proc. Bulg. Acad. Sci. 2018, 71, 1502–1510. [Google Scholar] [CrossRef]
  24. Anderegg, W.R.L.; Klein, T.; Bartlett, M.; Sack, L.; Pellegrini, A.; Choat, B.; Jansen, S. Meta-analysis reveals that hydraulic traits explain cross-species patterns of drought-induced tree mortality across the globe. Proc. Natl. Acad. Sci. USA 2016, 113, 5024–5029. [Google Scholar] [CrossRef] [PubMed] [Green Version]
  25. Jupa, R.; Plavcová, L.; Gloser, V.; Jansen, S. Linking xylem water storage with anatomical parameters in five temperate tree species. Tree Physiol. 2016, 36, 756–769. [Google Scholar] [CrossRef] [PubMed] [Green Version]
  26. Steffenrem, A.; Solheim, H.; Skrøppa, T. Genetic parameters for wood quality traits and resistance to the pathogens Heterobasidion parviporum and Endoconidiophora polonica in a Norway spruce breeding population. Eur. J. For. Res. 2016, 135, 815–825. [Google Scholar] [CrossRef] [Green Version]
  27. Zeltiņš, P.; Katrevičs, J.; Gailis, A.; Maaten, T.; Bāders, E.; Jansons, Ā. Effect of Stem Diameter, Genetics, and Wood Properties on Stem Cracking in Norway Spruce. Forests 2018, 9, 546. [Google Scholar] [CrossRef] [Green Version]
  28. Karki, L. Genetically narrow-crowned trees combine high timber quality and high stem wood production at low cost. In Crop. Physiology of Forest Trees; Landsberg, J.J., Ed.; Tigerstedt Publishing House: Helsinki, Finland, 1985; pp. 245–256. [Google Scholar]
  29. Gerendiain, A.Z.; Peltola, H.; Pulkkinen, P.; Ikonen, V.-P.; Jaatinen, R. Differences in growth and wood properties between narrow and normal crowned types of Norway spruce grown at narrow spacing in Southern Finland. Silva. Fenn. 2008, 42, 423–437. [Google Scholar] [CrossRef] [Green Version]
  30. Gerendiain, A.Z.; Peltola, H.; Pulkkinen, P. Growth and wood property traits in narrow crowned Norway spruce (Picea abies f. pendula) clones grown in southern Finland. Silva. Fenn. 2009, 43, 369–382. [Google Scholar] [CrossRef] [Green Version]
  31. Pârnuţă, G. Variabilitatea Genetică și Ameliorarea Arborilor de Molid cu Coroană Îngustă în România (Genetic Variability and Breeding of Narrow-Crown Spruce Trees in Romania); Silvică Publishing House: Bucharest, Romania, 2008; 181p, (In Romanian with English Abstract). [Google Scholar]
  32. Apostol, E.N.; Budeanu, M. Adaptability of Narrow-Crowned Norway Spruce Ideotype (Picea abies (L.) Karst. pendula Form) in 25 Years Half-Sib Comparative Trials in the Eastern Carpathians. Forests 2019, 10, 395. [Google Scholar] [CrossRef] [Green Version]
  33. Anonymous. Management planning of production unit IV Suzana, forest district Măneciu. 2018. [Google Scholar]
  34. CRU Dataset. Climatic Research Unit, University of East, England. 2021. Available online: www.cru.uea.ac.uk (accessed on 30 April 2021).
  35. Caudullo, G.; Welk, E.; San-Miguel-Ayanz, J. Chorological maps for the main European woody species. Data Brief. 2017, 12, 662–666. [Google Scholar] [CrossRef]
  36. Cybis Elektronik & Data AB. Cybis Dendrochronology and History. Cybis Electronic and Data, Saltsjöbaden, Sweden. 2020. Available online: www.cybis.se (accessed on 30 April 2021).
  37. Popa, I. Fundamente Metodologice și Aplicații de Dendrocronologie (Methodological Fundamentals and Applications of Dendrochronology); Ed. Silvică: Câmpulung Moldovenesc, Romania, 2004; p. 200. Available online: http://www.editurasilvica.ro/carti/popa1/integral.pdf (accessed on 2 May 2021).
  38. Yamaguchi, D.K.; Cook, E.R.; Kairiukstis, L.A. Methods of Dendrochronology, Applications in the Environmental Sciences. Arct. Alp. Res. 1991, 23, 120. [Google Scholar] [CrossRef]
  39. Leca, Ş. Creșterea Arborilor și Arboretelor în Sistemul de Monitorizare Forestieră Intensivă (Trees and Stands Growth in Intensive Forest Monitoring System). Ph.D. Thesis, Transylvania University, Brasov, Romania, 2014. [Google Scholar]
  40. Nechita, C.; Popa, I.; Eggertsson, Ó. Climate response of oak (Quercus spp.), an evidence of a bioclimatic boundary induced by the Carpathians. Sci. Total Environ. 2017, 599–600, 1598–1607. [Google Scholar] [CrossRef] [PubMed]
  41. Bunn, A.; Korpela, M.; Biondi, F.; Campelo, F.; Mérian, P.; Qeadan, F.; Zang, C.; Pucha-Cofrep, D.; Wernicke, J. dplR: Dendrochronology Program Library in R; R Package Version 1.6.9; R Foundation for Statistical Computing: Vienna, Austria, 2018; Available online: https://www.r-project.org/ (accessed on 5 May 2021).
  42. R Core Team. R: A Language and Environment for Statistical Computing; R Foundation for Statistical Computing: Vienna, Austria, 2020; Available online: https://www.eea.europa.eu/data-and-maps/indicators/oxygen-consuming-substances-in-rivers/r-development-core-team-2006 (accessed on 5 May 2021).
  43. Satmari, A. Lucrări Practice de Biogeografie (Practical Applications of Biogeography). Available online: http://www.academia.edu/9909429/05_INDICI_ECOMETRICI (accessed on 2 May 2021).
  44. Ellenberg, H.; Leuschner, C. Vegetation Mitteleuropas mit den Alpen. In Ökologischer, Dynamischer und Historischer Sicht (Vegetation of Central Europe with the Alps: From an Ecological, Dynamic and Historical Point of View), 6th ed.; Ulmer Verlag: Stuttgart, Germany, 2010; p. 1334. [Google Scholar]
  45. Edwards, D.C. Characteristics of 20th Century Drought in the United States at Multiple Time Scales. Master’s Thesis, Colorado State University, Fort Collins, CO, USA, 1997; p. 155. [Google Scholar]
  46. Salehnia, N.; Alizadeh, A.; Sanaeinejad, H.; Bannayan, M.; Zarrin, A.; Hoogenboom, G. Estimation of meteorological drought indices based on AgMERRA precipitation data and station-observed precipitation data. J. Arid. Land 2017, 9, 797–809. [Google Scholar] [CrossRef] [Green Version]
  47. Trujillo-Moya, C.; George, J.-P.; Fluch, S.; Geburek, T.; Grabner, M.; Karanitsch-Ackerl, S.; Konrad, H.; Mayer, K.; Sehr, E.; Wischnitzki, E.; et al. Drought Sensitivity of Norway Spruce at the Species’ Warmest Fringe: Quantitative and Molecular Analysis Reveals High Genetic Variation Among and Within Provenances. G3 Genes|Genomes|Genetics 2018, 8, 1225–1245. [Google Scholar] [CrossRef] [PubMed] [Green Version]
  48. Zang, C.; Biondi, F. treeclim: An R package for the numerical calibration of proxy-climate relationships. Ecography 2015, 38, 431–436. [Google Scholar] [CrossRef]
  49. Lloret, F.; Keeling, E.G.; Sala, A. Components of tree resilience: Effects of successive low-growth episodes in old ponderosa pine forests. Oikos 2011, 120, 1909–1920. [Google Scholar] [CrossRef]
  50. Pretzsch, H.; Schütze, G.; Uhl, E. Resistance of European tree species to drought stress in mixedversuspure forests: Evidence of stress release by inter-specific facilitation. Plant. Biol. 2013, 15, 483–495. [Google Scholar] [CrossRef]
  51. Van Der Maaten-Theunissen, M.; Van Der Maaten, E.; Bouriaud, O. pointRes: An R package to analyze pointer years and components of resilience. Dendrochronologia 2015, 35, 34–38. [Google Scholar] [CrossRef]
  52. Nanson, A. Génétique et Amélioration Des. Arbres Forestières (Genetic and Forest Trees Breeding); Les presses agronomique de Gembloux: Gembloux, Belgium, 2004; p. 712. (In French) [Google Scholar]
  53. Falconer, D.S. Introduction to Quantitative Genetics, 2nd ed.; Longmans Green: London, UK; New York, NY, USA, 1981. [Google Scholar]
  54. Abengmeneng, C.S.; Ofori, D.A.; Kumapley, P.; Akromah, R.; Jamnadass, R. Estimation of heritability and genetic gain in height growth in Ceiba pentandra. Afr. J. Biotechnol. 2015, 14, 1880–1885. [Google Scholar] [CrossRef]
  55. Breed, R. An Open Statistical Package to Analyse Genetic Data (WP6). 2016. Available online: http://famuvie.github.io/breedR/ (accessed on 5 May 2021).
  56. Hacke, U.G.; Stiller, V.; Sperry, J.S.; Pittermann, J.; McCulloh, K.A. Cavitation Fatigue. Embolism and Refilling Cycles Can Weaken the Cavitation Resistance of Xylem. Plant. Physiol. 2001, 125, 779–786. [Google Scholar] [CrossRef] [PubMed] [Green Version]
  57. Wolkerstorfer, S.; Rosner, S.; Hietz, P. Assessment of vulnerability to cavitation in small wood samples of Picea abies (L. Karst.). For. Ideas 2010, 16, 83–89. [Google Scholar]
  58. Şofletea, N.; Curtu, A.L. Dendrologie (Dendrology); Transylvania University Publishing House: Brasov, Romania, 2007; p. 540. [Google Scholar]
  59. Stănescu, V.; Șofletea, N. Cercetări de genetică ecologică în molidișuri montane (II) (Ecological genetics research in mountain spruces (II)). Revista Pădurilor 1992, 107, 2–5. [Google Scholar]
  60. Şofletea, N.; Curtu, A.L.; Daia, M.L.; Budeanu, M. The dynamics and variability of radial growth in provenance trials of Norway spruce (Picea abies (L.) Karst.) within and beyond the hot margins of its natural range. Not. Bot. Horti Agrobo. 2015, 43, 265–271. [Google Scholar] [CrossRef] [Green Version]
  61. Lundqvist, S.-O.; Seifert, S.; Grahn, T.; Olsson, L.; García-Gil, M.R.; Karlsson, B.; Seifert, T. Age and weather effects on between and within ring variations of number, width and coarseness of tracheids and radial growth of young Norway spruce. Eur. J. For. Res. 2018, 137, 719–743. [Google Scholar] [CrossRef] [Green Version]
  62. Irbe, I.; Sable, I.; Noldt, G.; Grinfelds, U.; Jansons, A.; Treimanis, A.; Koch, G. Wood and Tracheid Properties of Norway Spruce (Picea abies [L] Karst.) Clones Grown on Former Agricultural Land in Latvia. Balt. For. 2015, 21, 114–123. [Google Scholar]
  63. Chen, Z.-Q.; Hai, H.N.T.; Helmersson, A.; Liziniewicz, M.; Hallingbäck, H.R.; Fries, A.; Berlin, M.; Wu, H.X. Advantage of clonal deployment in Norway spruce (Picea abies (L.) H. Karst). Ann. For. Sci. 2020, 77, 14. [Google Scholar] [CrossRef] [Green Version]
  64. Șofletea, N. Genetică și Ameliorarea Arborilor (Genetics and Trees Breeding); Pentru viață Publishing House: Brașov, Romania, 2005; p. 455. (In Romanian) [Google Scholar]
  65. Castagneri, D.; Vacchiano, G.; Hacket-Pain, A.; DeRose, R.J.; Klein, T.; Bottero, A. Meta-analysis Reveals Different Competition Effects on Tree Growth Resistance and Resilience to Drought. Ecosystems 2021, 24, 1–14. [Google Scholar] [CrossRef]
  66. Gömöry, D.; Longauer, R.; Hlásny, T.; Pacalaj, M.; Strmeň, S.; Krajmerová, D. Adaptation to common optimum in different populations of Norway spruce (Picea abies Karst.). Eur. J. For. Res. 2011, 131, 401–411. [Google Scholar] [CrossRef]
  67. Kapeller, S.; Lexer, M.J.; Geburek, T.; Hiebl, J.; Schueler, S. Intraspecific variation in climate response of Norway spruce in the eastern Alpine range: Selecting appropriate provenances for future climate. For. Ecol. Manag. 2012, 271, 46–57. [Google Scholar] [CrossRef]
  68. Klisz, M.; Ukalska, J.; Koprowski, M.; Tereba, A.; Puchałka, R.; Przybylski, P.; Jastrzębowski, S.; Nabais, C. Effect of provenance and climate on intra-annual density fluctuations of Norway spruce Picea abies (L.) Karst. in Poland. Agric. For. Meteorol. 2019, 269, 145–156. [Google Scholar] [CrossRef]
  69. Burczyk, J.; Giertych, M. Response of Norway spruce (Picea abies [L] Karst) annual increments to drought for various provenances and locations. Silvae Genet. 1991, 40, 146–152. [Google Scholar]
  70. Budeanu, M.; Petritan, A.M.; Popescu, F.; Vasile, D.; Tudose, N.C. The resistance of European beech (Fagus sylvatica) from the eastern natural limit of species to climate change. Not. Bot. Horti Agrobo. 2016, 44, 625–633. [Google Scholar] [CrossRef] [Green Version]
  71. Kolář, T.; Čermák, P.; Trnka, M.; Žid, T.; Rybníček, M. Temporal changes in the climate sensitivity of Norway spruce and European beech along an elevation gradient in Central Europe. Agric. For. Meteorol. 2017, 239, 24–33; [Google Scholar] [CrossRef]
  72. Gyllenstrand, N.; Clapham, D.; Källman, T.; Lagercrantz, U.; Richardt, S.; Lang, D.; Reski, R.; Frank, W.; Rensing, S.A. A Norway spruce FLOWERING LOCUS T homolog is implicated in control of growth rhythm in conifers. Plant. Physiol. 2007, 144, 248–257. [Google Scholar] [CrossRef] [PubMed] [Green Version]
  73. Hayatgheibi, H.; Haapanen, M.; Lundströmer, J.; Berlin, M.; Kärkkäinen, K.; Helmersson, A. Impact of Drought Stress on Height Growth of Young Norway Spruce Full-Sib and Half-Sib Clonal Trials in Sweden and Finland. Forests 2021, 12, 498. [Google Scholar] [CrossRef]
  74. Obladen, N.; Dechering, P.; Skiadaresis, G.; Tegel, W.; Keßler, J.; Höllerl, S.; Kaps, S.; Hertel, M.; Dulamsuren, C.; Seifert, T.; et al. Tree mortality of European beech and Norway spruce induced by 2018–2019 hot droughts in central Germany. Agric. For. Meteorol. 2021, 307, 108482. [Google Scholar] [CrossRef]
  75. Dincă, L.; Murariu, G.; Iticescu, C.; Budeanu, M.; Murariu, A. Norway spruce (Picea abies (L.) Karst.) smart forests from the southern Carpathians. Int. J. Conserv. Sci. 2019, 10, 781–790. [Google Scholar]
  76. Teodosiu, M.; Mihai, G.; Fussi, B.; Ciocîrlan, E. Genetic diversity and structure of Silver fir (Abies alba Mill.) at the south-eastern limit of its distribution range. Ann. For. Res. 2019, 62, 139–156. [Google Scholar] [CrossRef]
  77. Zwetsloot, M.J.; Bauerle, T.L. Repetitive seasonal drought causes substantial species-specific shifts in fine-root longevity and spatio-temporal production patterns in mature temperate forest trees. New Phytol. 2021. [Google Scholar] [CrossRef] [PubMed]
Figure 1. Location of the Măneciu field trial and provenances origins on the Norway spruce distribution map [35]. Natural species distribution is denoted using green and artificial using brown (A). Regional climate trends in the mean annual temperature (red) and total precipitation (blue) for the Măneciu trial during the 20th century computed using CRU gridded data (B).
Forests 12 00947 g001
Figure 2. Latewood proportion of the provenances and crown forms (mean ± 0.95 CI).
Forests 12 00947 g002
Figure 3. Master chronology of standardized ring-width indices (RWI) of the two Norway spruce forms. Samp. = Sample.
Forests 12 00947 g003
Figure 4. Comparison of correlation coefficients between monthly precipitation (A), temperature (B), and SPI (C) and the detrended ring-width series of the two Norway spruce forms (pyramidalis and pendula) for the 2001–2020 period. Months in lowercase letters refer to the previous year and in uppercase letters to the current year. Vertical lines represent the 95% confidence interval. *, significant correlations at p < 0.05.
Forests 12 00947 g004
Figure 5. Boxplot showing the mean values and errors bars for resistance, recovery, and resilience indices of individual ring width series of the two Norway spruce forms.
Forests 12 00947 g005
Table 1. The location of the provenances and climatic conditions.
ProvenanceCoordinates
(N latitude/E Longitude/Altitude (m))
T (°C)/P (mm)/AI
1. Stâna de Vale I46°41′/22°38′/12004.0/1200/86
2. Stâna de Vale II46°46′/22°36′/12254.0/1200/86
3. Izbuc I46°36′/22°46′/12004.0/1200/86
4. Izbuc II46°38′/22°50′/12754.0/1200/86
5. Cetăţile Ponorului46°34′/22°42′/10504.5/1100/76
6. Bozovici44°57′/21°57′/6009.5/770/39
7. Horoaba45°23′/25°25′/16752.8/1200/94
8. Cucureasa47°23′/25°04′/9354.5/960/66
T = mean annual temperature, P = sum of annual precipitations, AI = De Martonne aridity index.
Table 2. Radial increments (± SD) and cores signal of the two Norway spruce crown forms.
Crown FormRW
mm
EW
mm
LW
mm
LWP
%
Cores Signal
Ar 1ICEPSRbar
Pendula4.580 ± 0.673.733 ± 0.600.848 ± 0.2718.6 ± 5.20.7390.4550.9530.251
Pyramidalis4.495 ± 0.863.696 ± 0.750.799 ± 0.2517.8 ± 4.40.7320.4450.9460.244
Trial4.538 ± 0.773.714 ± 0.680.823 ± 0.2618.2 ± 4.80.7370.4900.9750.271
RW = ring width, EW = earlywood, LW = latewood, LWP = latewood proportion. Ar 1 = first-order autocorrelation, IC = interseries correlations, EPS = expressed population signal, Rbar = mean correlation between trees.
Table 3. The coefficient of variation for ring width (CVRW), earlywood (CVEW), latewood (CVLW), and latewood proportion (CVLWP) for the two crown forms of Norway spruce.
Crown FormCVRWCVEWCVLWCVLWPCVRW 2001–2010CVRW 2011–2020CVLWP 2001–2010CVLWP 2011–2020
Pendula14.516.232.127.815.135.836.832.6
Pyramidalis19.120.431.524.719.441.331.532.1
Trial16.918.331.926.417.338.635.132.6
Table 4. Family heritability and genetic gain for 10% selection intensity.
Măneciu TrialRWEWLWLWP
All families
Heritability0.390.270.520.34
Genetic gain3.41.713.04.9
Pendula families
Heritability0.150.030.560.36
Genetic gain0.30.113.34.4
Pyramidalis families
Heritability0.540.430.490.33
Genetic gain5.53.97.82.5
Publisher’s Note: MDPI stays neutral with regard to jurisdictional claims in published maps and institutional affiliations.

