Article

Competition Effects on Growth and Crown Dimensions of Shortleaf and Loblolly Pine in Mature, Natural-Origin, Pine–Hardwood Mixtures of the Upper West Gulf Coastal Plain of Arkansas, USA: A Neighborhood Analysis

College of Forestry, Agriculture, and Natural Resources, University of Arkansas at Monticello, 110 University Court, Monticello, AR 71656, USA
*
Author to whom correspondence should be addressed.
Forests 2021, 12(7), 935; https://doi.org/10.3390/f12070935
Submission received: 9 June 2021 / Revised: 9 July 2021 / Accepted: 13 July 2021 / Published: 16 July 2021
(This article belongs to the Section Forest Health)

Abstract

:
The need for a comprehensive and mechanistic understanding of competition has never been more important as plants adapt to a changing environment and as forest management evolves to focus on maintaining and enhancing complexity. With the recent decline in shortleaf pine (Pinus echinata Mill.) land area, it is critical to determine the effects of competition on shortleaf pine and its performance against loblolly pine (Pinus taeda L.), the preferred planted replacement. We evaluate differences in shortleaf and loblolly pine 10 year mean basal area increment (BAI) and crown dimensions across a gradient of neighborhoods. Linear mixed-effects regression models were developed using BAI and several crown metrics as responses and crowding, competitor species abundance and identity, and initial size and species identity of focal tree as predictors. Crowding of focal trees negatively impacted BAI and crown size (p < 0.001, respectively). Although loblolly pine had three times higher BAI as compared to shortleaf pine within similar neighborhoods, BAI was variable, and the crowding effect did not differ between shortleaf and loblolly pine (p ranged from 0.51–0.99). Competitive impacts on focal trees did not differ by competitor identity (p ranged from 0.07–0.70). Distance-independent competition indices better explained the variation in BAI and horizontal crown metrics, while distance-dependent size ratios were more effective at evaluating vertical crown metrics. These findings highlight shortleaf pine competitive potential in mature, natural-origin stands and provide support for the restoration of pine–hardwood and hardwood–pine stratified mixtures as well as management of shortleaf pine at long rotations.

1. Introduction

Competition is a fundamental ecological process affecting plant community organization and population dynamics. Differential response to competition within (intraspecific) and among (interspecific) species has a significant effect on success and productivity of individual trees. The need for a comprehensive and mechanistic understanding of competition has never been more important as plants adapt to a changing environment and forest management evolves to focus on the maintenance and enhancement of complex residual structures. Competition is recognized as a neighborhood process in which individuals are influenced by neighbors at local rather than global spatial scales [1,2]. Therefore, individual-tree models are used in the examination of competition effects on growth, survival, and crown characteristics of target individuals and species [3]. Individual-based models reflect the mechanistic link between neighborhood characteristics and attribute of target individuals and allow for the testing of a priori hypotheses about the nature of competition effects [4].
Numerous studies have examined the effect of competition on loblolly pine (Pinus taeda L.), largely owing to the commercial importance of the species and its wide use in pine plantations. Most studies, however, have focused on the impact of competition on growth and yield and were conducted in uniform even-aged stands [5]. Moreover, the focus has been on population-level effects rather than individual-tree responses [6,7,8]. Results from spacing studies on intraspecific competition of loblolly pine demonstrate the magnitude of the negative effect of crowding on individual-tree growth and form. High initial planting density, for example, resulted in reduced individual-tree total and merchantable volume, and earlier onset of density-dependent mortality [9]. Heavy thinning, on the other hand, resulted in longer and wider crowns of 38 year-old loblolly pine regardless of initial spacing [10].
Shortleaf pine (Pinus echinata Mill.), the most widely distributed of the major southern pine species [11], has been in decline across its range due to a variety of factors [12]. This decline is in part due to altered fire regimes, introgression, shifts in land use including conversion to loblolly pine, disease and insect outbreaks, and slow growth rate and regeneration difficulty [13,14,15]. However, shortleaf pine has good crown and stem form, better cold tolerance than most southern pines, and lower susceptibility to snow and ice damage. Shortleaf pine also occurs naturally in mixed-species stands in the Upper West Gulf Coastal Plain and elsewhere within its native range, especially where the range is sympatric with loblolly pine. Thus, it is a good candidate for inclusion in mixed-species, multicohort, or stratified stands that are promoted in maintaining and enhancing complexity as well as for the restoration of pine–hardwood stands that were once more common in the southern United States. Managing such structurally complex stands with shortleaf pine as a component over long rotation periods requires a better understanding of the effects of neighborhood competitive interactions on shortleaf pine and shortleaf pine’s potential competitiveness against loblolly pine. The majority of competition studies including shortleaf pine have been limited to juvenile trees [7,16,17], ignoring mature tree competition.
Previous neighborhood analyses have shown that competitor species differ in their effects on focal tree growth and crown characteristics and that this differential effect may be at least partially responsible for diversity patterns and plant community organization [18,19,20]. However, these results are contrary to the ‘neutral model’ proposed by Hubbell [21], which assumes that all species are of equal competitive fitness and that niche differentiation among them is not important. Hubbell’s model has been shown to only hold true in highly diverse tropical forest ecosystems where over half of studied tree species showed no difference in the competitive effect of conspecific neighbors as compared to interspecific neighbors [22]. In relatively less diverse temperate forests, it has been shown that over 95% of species studied exhibited significantly different responses to competition from conspecific vs. interspecific neighbors [18,23,24]. In a northern temperate forest, three boreal tree species—subalpine fir (Abies lasiocarpa (Hook.) Nutt.), lodgepole pine (Pinus contorta Dougl. ex. Loud.), and interior spruce (Picea glauca × engelmanii (Moench) Voss)—were studied for the effect of neighborhood competition on several crown characteristics [25]. Evidence for species-specific competitive effects on crown dimensions was compelling, except for the crown radius of lodgepole pine, which was likely due to the shade intolerance of the species where shading and not species identity was the primary source of competition. The premise of differential competitor response and niche differentiation holds strong implications for the management of structurally complex, mixed-species stands such as the pine–hardwood stands of southern USA. For example, white pine and red oak mixtures were shown to grow in a variety of even- and two-aged structures without sacrificing productivity [26].
Fundamental understanding of competition effects on shortleaf and loblolly pine at the neighborhood level is needed to provide a more complete picture of the potential benefits of structurally complex, mixed-species stands in forest management practices. In this paper, we address the following basic questions: (1) Are individual mature canopy trees (i.e., focal trees) of shortleaf and loblolly pine equally competitive within neighborhoods of varying competitor abundance? and (2) Does the species identity of competitor trees have an equal influence on shortleaf and loblolly pine? The objective of this study was to compare the performance of shortleaf and loblolly pine along a gradient of neighborhood structures to test for the effect of crowding and competitor identity and abundance on 10 year mean basal area increment (BAI) and crown dimensions. In quantifying crowding effects, we used several competition indices that reflected different concepts of the nature of competition effects, including symmetry and asymmetry in effect, and allowed or did not allow for the incorporation of neighborhood spatial structure. We hypothesized that the crowding of focal shortleaf and loblolly pine by competitor trees would result in smaller BAI and crowns with greater impacts on shortleaf than loblolly pine. We also hypothesized that competitive impacts on focal tree species would differ by competitor species identity with greater influence for hardwood species than conifers. Distance-dependent competition indices were hypothesized to outperform distance-independent indices in quantifying competition effects across all responses.

2. Materials and Methods

2.1. Study Area

The study was conducted within the Upper West Gulf Coastal Plain (UWGCP), which is bounded on the east by the Mississippi Alluvial Plain in Arkansas and Louisiana, and extends westerly to the Cross Timbers ecoregion of East Texas and southeast Oklahoma. The UWGCP is characterized by forests dominated by shortleaf and loblolly pine mixed with a host of dry-mesic hardwood species including oaks (Quercus spp.), hickories (Carya spp.), and sweetgum (Liquidambar styraciflua L.).
Three mature, natural-origin, unmanaged, second growth, mixed pine–hardwood stands were selected in southeastern Arkansas. All three stands were 80–120 years old with a composition characteristic of upland UWGCP forests [27], including loblolly pine, shortleaf pine, and a mix of hardwoods, primarily oak and sweetgum. Two study sites were located in Cleveland County, AR (North stand, 33.965 N, 92.167 W; West stand, 33.865 N, 92.124 W), and the third site was located in Bradley County, AR (33.543 N, 92.072 W). Average annual high and low temperatures for Cleveland County sites are 23.3 and 10 °C, respectively, with annual precipitation of 134.6 cm distributed evenly throughout the year (USDA-NRCS Soil Survey Division, 2016). Average annual high and low temperatures for Bradley County are 22.8 and 10 °C, respectively. Annual precipitation for Bradley County is 134.6 cm and is evenly distributed throughout the year (USDA-NRCS Soil Survey Division, 2016). Elevation for the Cleveland County stands is approximately 84 m, and the elevation for the Bradley County stand is approximately 64 m. Soil series for Cleveland County stands included Savannah (siliceous, semiactive, thermic Typic Fragiudults), which are described as very deep, moderately well drained, and slowly permeable on uplands and terraces; Wehadkee (mixed, active, nonacid, thermic Fluvaquentic Endoaquepts), which are very deep, poorly to very poorly drained along streams and on floodplains in bottomlands; and Boswell (mixed, active, thermic Vertic Paleudalfs), which are very deep, moderately well drained, and very slowly permeable fine sandy loams on uplands. Bradley County stand soil series mainly included Wilcox (smecitic, thermic Chrmoic Dystruderts), which are deep, poorly drained, very slowly permeable soils formed in clay sediments; and Sawyer series (siliceous, semiactive, themic Aquic Paleudults), which are fine silt loams that are very deep and moderately well drained (USDA-NRCS Soil Survey Division, 2016). All three sites were relatively similar in soils, climate, topography, structure, and composition, especially pine-neighborhood composition.

2.2. Study Design and Sampling

To ensure a representative sample of focal trees across the range of shortleaf and loblolly pine canopy trees, data from an initial stand inventory were used to construct diameter at breast height (dbh; 1.37 m) distributions for each stand. Within each stand, dbh quartiles, as determined by fitting a two-parameter Weibull distribution, were used to select shortleaf and loblolly pine focal trees. For each focal species, four dominant or codominant trees per quartile were selected. Focal trees were selected randomly within each stand through an iterative search procedure, in which a 50 × 50 m grid was placed onto the Cleveland County stand maps and a 20 × 20 m grid was placed over the Bradley County stand map. Two hundred random points were generated in each stand. At each point, a focal tree was selected based on dbh class, as near to the randomly generated point as possible. Focal tree neighborhood characteristic was determined using a 10-BAF prism (with the focal tree as a center point), and the proportion of basal area of pine and hardwood were recorded. The iterative search aimed to attain a balanced sample size among the combinations of dbh quartiles, focal species, and neighborhood type (pine versus hardwood). In total, 80 focal trees were sampled with 32 trees in each of the two Cleveland County stands and 16 trees for the Bradley County stand, which had greater pine dominance and less area. Special care was taken in the focal tree selection process to avoid selection of hybridized pines where any tree which could not be definitively identified as either species was not included. Shortleaf pine with its characteristic short needles, small cones, and platy bark with distinct resin pockets allowed for its positive field identification [28].
Each focal tree was considered the center of a fixed-area plot where the radius of each plot varied depending on the longest crown radius of each focal tree. The plot radius was set as twice the length of the longest crown radius except for two occasions, where exceedingly long branches created a cumbersome plot size, and as a result, a plot radius of 1.5 × longest crown radius was used. Perimeter trees with crowns touching or impeding focal trees were added as competitors. Within each neighborhood plot, all trees ≥ 12.7 cm dbh including the focal tree were tagged, stem mapped, identified, and measured for dbh, total height, height to base of the live crown, and crown radii in the four cardinal directions. Trees < 12.7 cm dbh were not included as they were mainly in the understory. Stems were mapped using the Haglöf Postex positioning system (Lämås, 2010). Subsequently, location measurements were converted to Universal Transvers Mercator (UTM) coordinates. In addition, each tree was placed into one of four descending canopy strata (A, B, C, or D) and then one of four canopy classes: dominant, codominant, intermediate, or suppressed [29]. For each focal tree, two increment cores were extracted at right angles at breast height level. Effort was made to capture the pith for each increment core extracted. Trees were measured between May and August of 2015.
Increment cores were air-dried, mounted, and sanded using progressively finer grits following standard preparation procedures [30]. Annual tree ring widths were measured to the nearest 0.001 mm using the image analysis software WinDENDRO™ (Regent Instruments Inc., Quebec City, Quebec, Canada, 2014). Ring width series were crossdated against local master chronologies developed for each site. Crossdating was performed graphically and checked using COFECHA [31,32]. Ring width series were converted to basal area increment (BAI) inside bark using the function bai.out of the dplR package [33] in R version 3.1.2 based on the standard formula:
BAI = π   ( R n 2 R n 1 2 ) ,
where R is the radius of the tree (mm) and n is the last year of tree ring formation. Double bark thickness was deducted from dbh outside bark. Shortleaf and loblolly pine bark thickness were estimated using a generic and loblolly specific equations [34]. Annual basal area increment was averaged between the two increment cores of each focal tree. Outside bark dbh in 2004, i.e., initial focal tree size before start of evaluation period, was calculated from annual basal area increment by subtracting the sum over the evaluation period from observed focal tree basal area.

2.3. Analytical Approach

Linear mixed-effects regression models were used to determine neighborhood effects on individual-tree BAI and crown dimensions. Mean annual basal area increment for the most recent 10 years and crown dimensions were separately used as response variables. Consideration of the most recent 10 years assumed that the neighborhood competitive environment did not change drastically in the sampled stands. Crown dimensions evaluated included length, live crown ratio, quadratic mean radius, projection area, and surface area (Table 1). Surface area was calculated in two forms: (1) by simply multiplying quadratic mean crown width and crown length (simple surface area); and (2) by assuming pine tree crowns resembled a truncated paraboloid. Crown projection area was also calculated assuming a truncated paraboloid. All models were fit using the nlme package [35] in R version 3.1.2 [36].
The effect of crowding on individual-tree BAI and crown dimensions was evaluated using eight competition indices. Three of these indices were distance-independent and included the common density measures of number of trees per unit area (i.e., trees per hectare; TPH) and total basal area (i.e., basal area per hectare; BAPH). Basal area in larger trees (BAL) was also included as a distance-independent competition index. BAPH and TPH are considered symmetric indices of competition, in which trees are equally affected by all competitors, whereas BAL is considered an asymmetric index, in which larger trees are not affected by their smaller neighbors [37]. Two types of spatially dependent competition indices were used and included: (1) distance-weighted size ratios based on Hegyi’s [38] index:
C I = j = 1 n X j X i ÷ d i j ,
where Xj is the tree dimension of each competitor tree, Xi is the tree dimension of the focal tree, and dij is the distance between the focal tree and the competitor; and (2) growing space indices based on the area potentially available (APA) index of Brown [39]. For distance-weighted size ratios, three different size metrics were used to generate three indices based on dbh, total height, and crown length. For area potentially available, two indices were calculated using tree-size weighted (asymmetric) and unweighted (symmetric) polygon areas. Area potentially available indices represent the competitive effect of neighbors as polygons the shape and size of which are a function of local competitor density. Tree size used for weighting APA was dbh squared, which essentially represents basal area as the weighting function.
The effect of competitor identity was evaluated using the scores from the first two axes of a nonmetric multidimensional scaling (NMS). NMS was used to rank focal tree neighborhoods based on composition and abundance. Competitor relative density and relative basal area within a neighborhood were combined to generate importance values for each competitor species. Competitor importance values were arranged in a Q matrix, where neighborhoods served as rows and species served as columns. NMS used a Bray–Curtis coefficient as the distance measure, and the competitor species data matrix was square root transformed to reduce the range of variation. This approach had the appeal of allowing the use of all species in evaluating competitor identity impacts as well as circumventing the inclusion of highly correlated pooled or individual species abundance factors in the regression models.
For each response, a series of competing models were constructed and compared to a null model through a forward stepwise selection process that included the fixed effects of focal tree initial dbh (2004 outside bark dbh or outside bark dbh at time of measurement based on response), species identity, and their interaction on the response variable. Whenever scatter plots indicated the presence of influential observations, models were constructed with and without potential outliers to examine outlier effects on model parameters and fit. Tree diameter was chosen over age as a predictor as it better reflected growth potential and had a stronger relationship with responses. All fitted model intercepts were associated with random effects relating to the grouping of focal trees by stand. Competing models were evaluated based on Akaike information criteria (AIC) and likelihood ratio tests. Models with the lowest AIC and significant likelihood ratio tests were selected as optimal. Competing models differed from the null model by the inclusion of competitor identity (i.e., NMS axes scores) or crowding metrics (i.e., various competition indices). All models and parameters were evaluated at an alpha level of 0.05. Residuals were examined to assess model fit and any departures from model assumptions. Nonconstant variance was corrected by weighting with variance power of fitted values or dbh when any trend in residuals was shown.

3. Results

3.1. Focal Tree Characteristics

A total of 80 focal trees were measured across three stands (Table 2). Focal trees were similar in size, age, crown dimensions, and distance from nearest neighbor among the three sampled stands. Within each stand, loblolly trees were slightly younger and larger than shortleaf pine in dbh, height, and crown dimensions. Mean height across species was 36.3, 33.9, and 33.5 m for North Cleveland, West Cleveland, and Bradley stands, respectively. Canopy position for all focal trees was in the B-stratum as only dominants and co-dominant trees were selected. Similarities in focal tree attributes across stands ensured that individual-tree differences in response were attributed to the effect of crowding and competitor composition (i.e., the neighborhood) and not due to variability in tree age and size among stands.

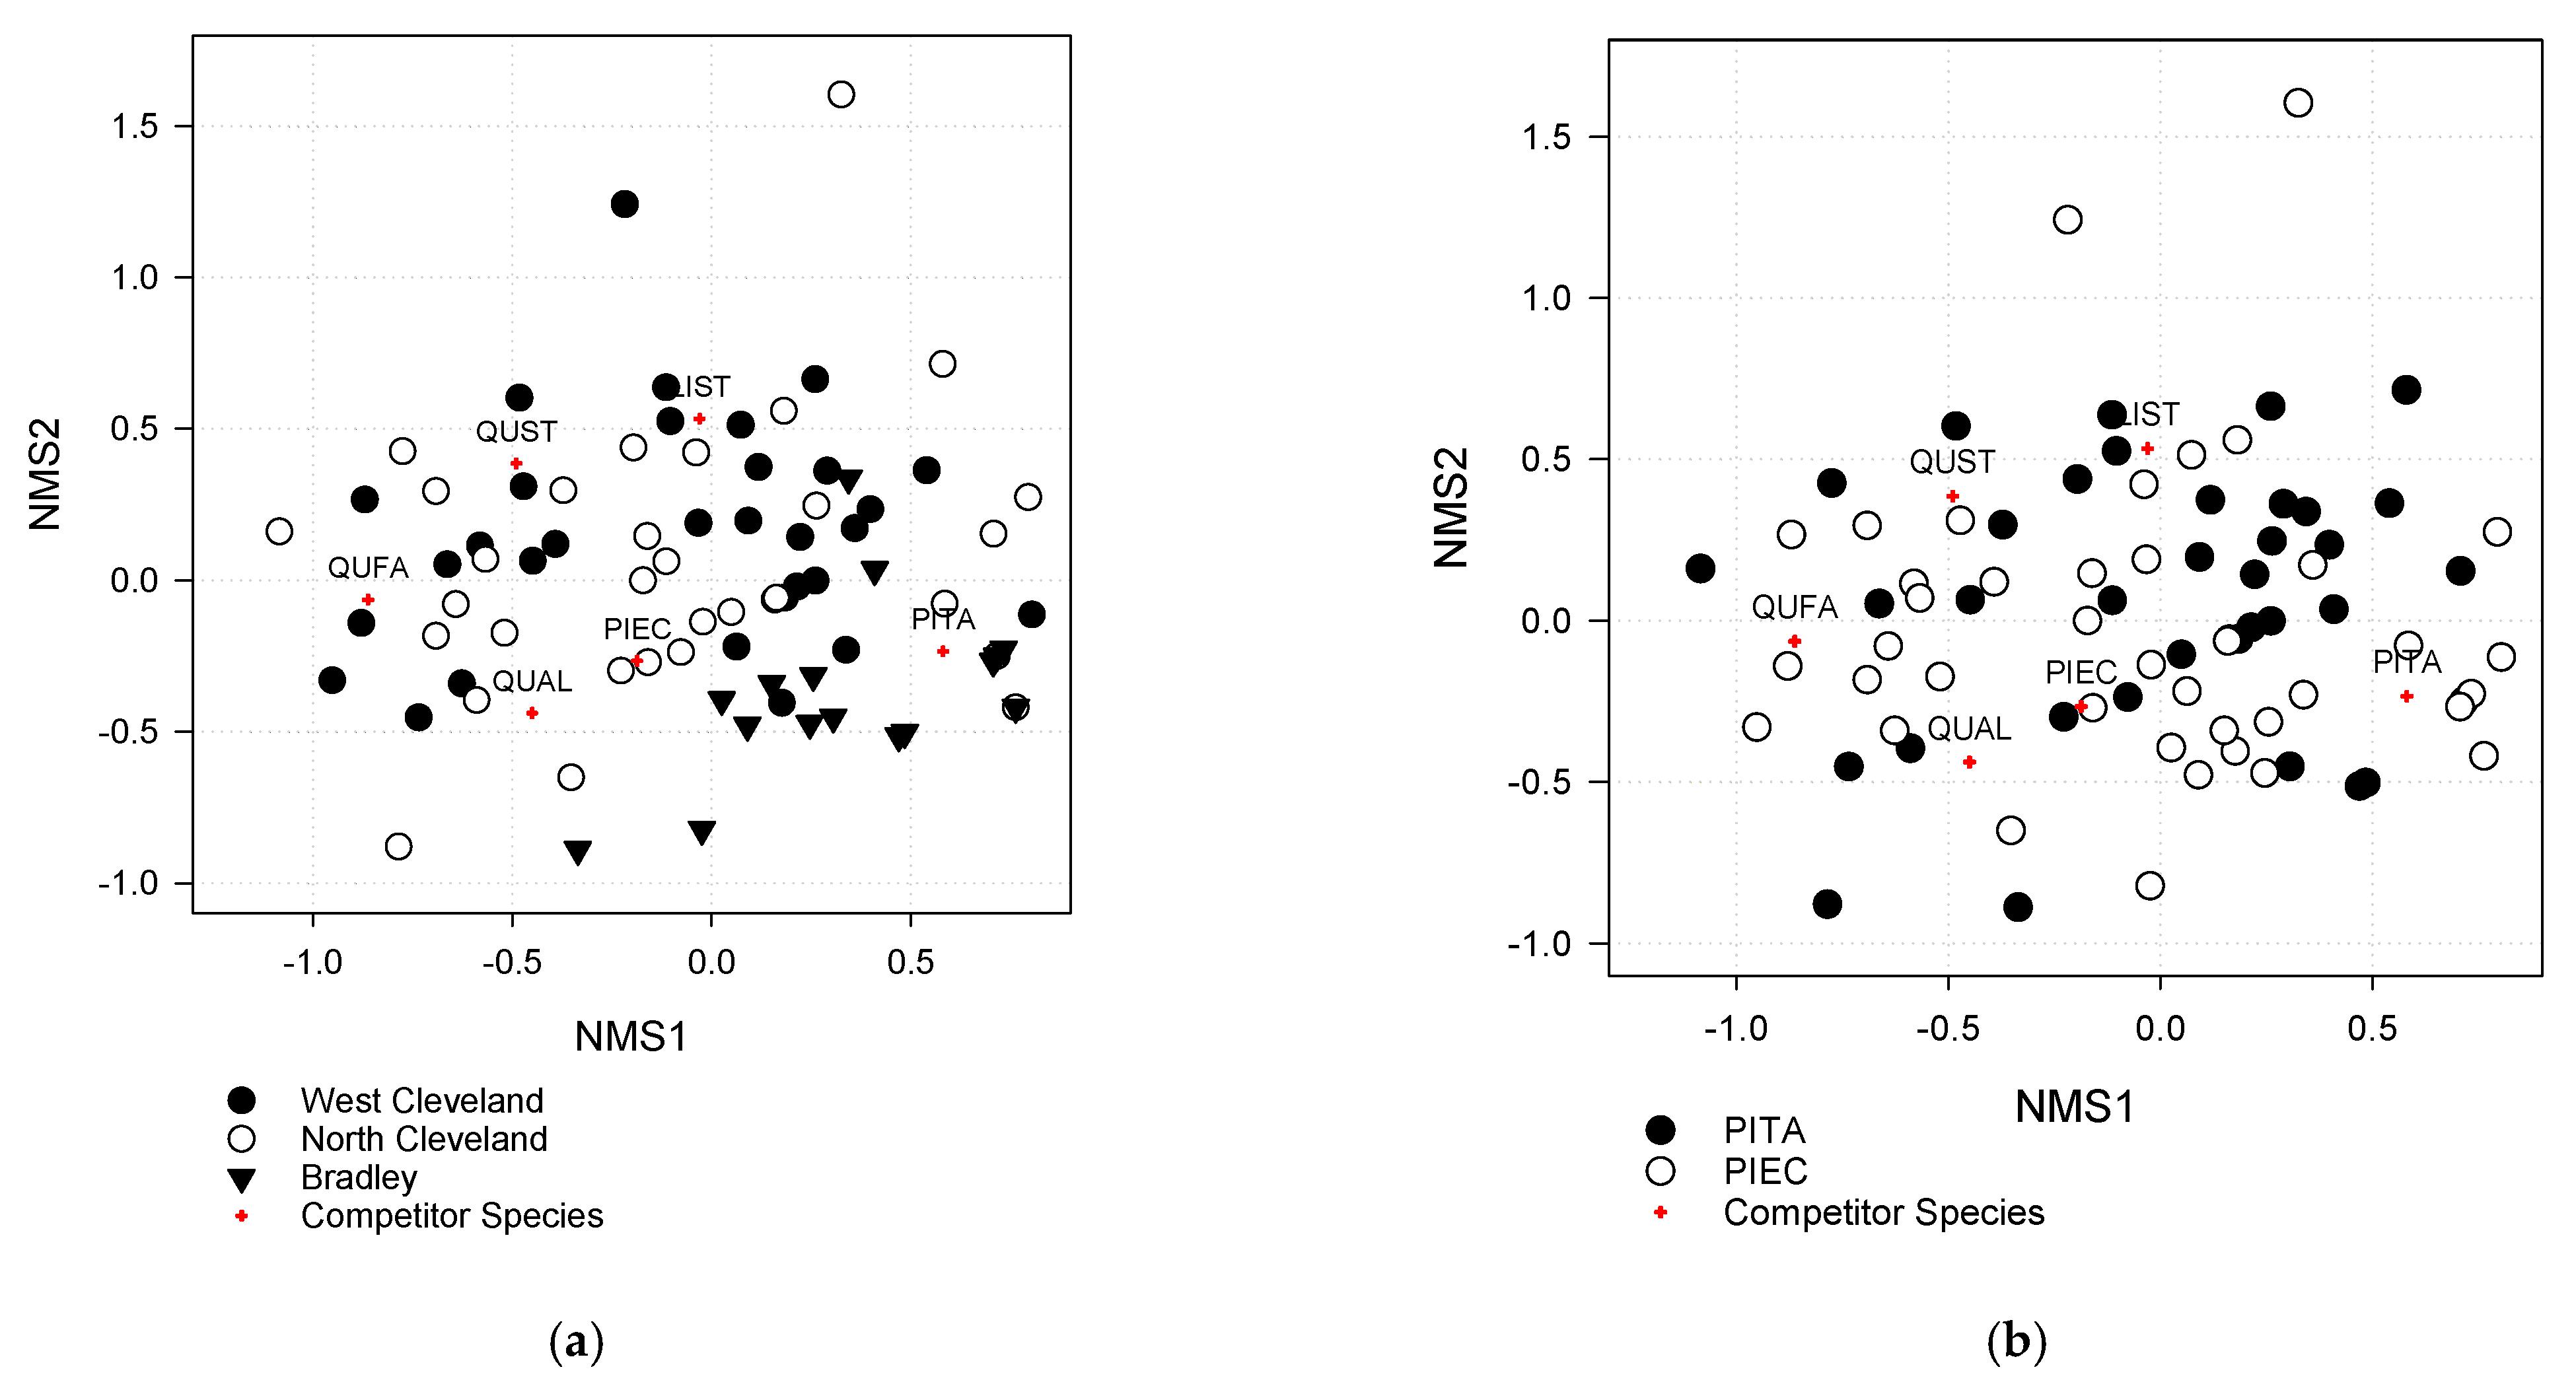
3.2. Neighborhood Composition and Structure

Total basal area of competitor trees ranged from 7.3–105.2, 17.6–354.5, and 5.5–97.7 m2.ha−1 in West Cleveland, North Cleveland, and Bradley stands, respectively. Density of competitor trees ranged from 132–690, 36–1514, and 184–585 trees.ha−1 for the West Cleveland, North Cleveland and Bradley stands, respectively. Competitor tree quadratic mean diameter (QMD) was 36.5, 38.6, and 32.1 cm for the West Cleveland, North Cleveland, and Bradley stands, respectively. Competitor trees around loblolly pine focal trees had higher QMD than those around shortleaf pine (Table 3). Competitor trees were also slightly taller around loblolly focal trees than shortleaf pine but had similar crown ratios. Most competitor trees were in the B-stratum with 62%, 59%, and 47% of the total number of competitors in West Cleveland, North Cleveland, and Bradley stands, respectively. Across all three stands there were no emergent trees in the A stratum, and the remainder of trees across all stands were in the C or D strata.
The most abundant competitors were oaks, sweetgum, shortleaf pine, and loblolly pine across all three stands (Figure 1). Loblolly and shortleaf pine were abundant competitors across all stands, and they were more abundant than oaks and sweetgum in the Bradley County stand, especially for shortleaf pine focal trees (Figure 1). NMS resulted in a two-dimensional solution with stress value of 0.20 indicating an acceptable solution [40]. NMS axis 1 represented a gradient of increasing competitor pine-dominance and decreasing white and southern red oak abundance, while NMS axis 2 reflected an increase in post oak and sweetgum (Figure 2a). Hardwoods, in general, represented a greater component of competitors for loblolly pine focal trees than for shortleaf pine (Figure 2b).

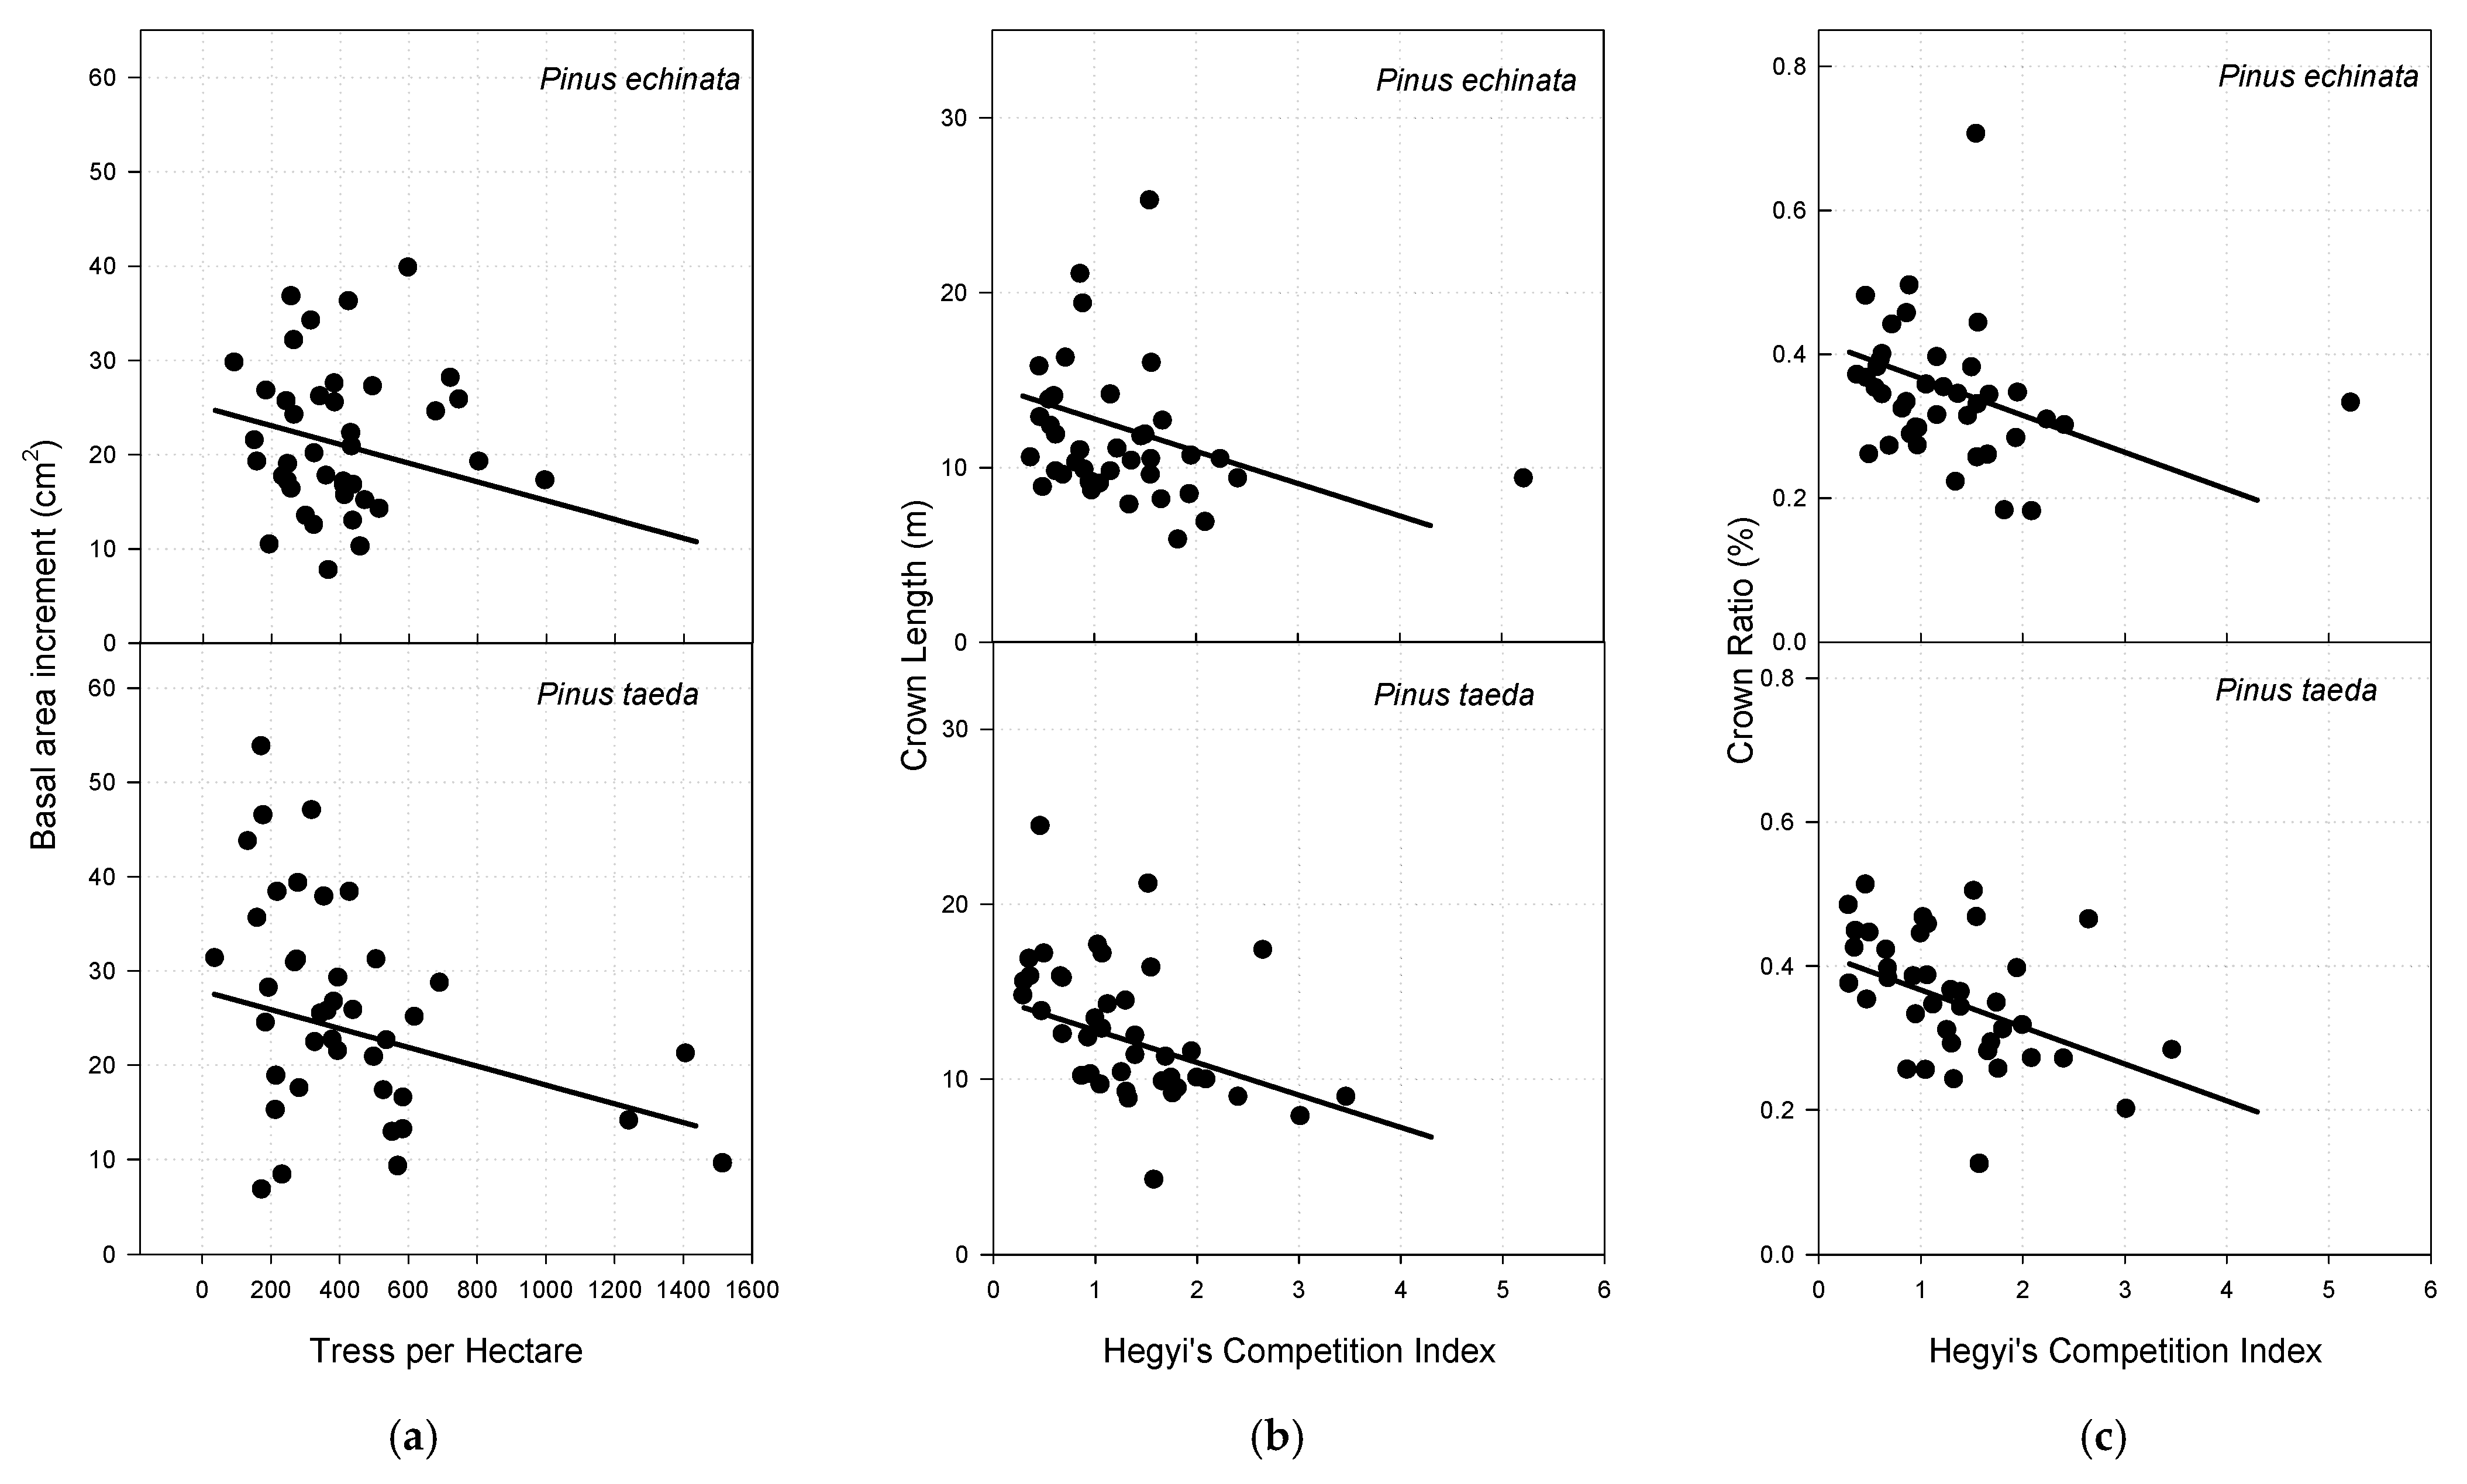
3.3. Basal Area Increment

Mean basal area increment (BAI, cm2) over the most recent 10 years (2005–2014) was negatively related to TPH with a 0.01 cm2 decrease in mean BAI for an increase in TPH by 1 trees.ha−1 (Table 4). While holding TPH constant, mean BAI did not differ among focal tree species despite an almost three times greater coefficient for loblolly pine as compared to shortleaf pine (Figure 3). Because models with and without potential outliers were similar in coefficient values and sign (i.e., relationship direction), models without observation elimination were used (Figure 3). Initial dbh did not explain the variability in BAI over the evaluation period (p = 0.266). Competitor species identity also did not explain the variability in mean BAI (p = 0.066 and 0.099 for NMS1 and NMS2, respectively). Crowding effect as measured by distance-weighted size ratios (HegyiDBH, HegyiHT, and HegyiCL) also was not a significant predictor nor was the interaction between these indices and initial dbh (p > 0.05). Area potentially available indices (weighted and unweighted) did not explain the variability in BAI and were not included in final model selection (p > 0.05).

3.4. Crown Length

Crown length of focal trees was best explained by focal tree dbh and distance-weighted ratio (Hegyi’s index) based on crown length (HegyiCL) as the size metric (Table 4). Because models with and without potential outliers were similar in coefficient values and sign (i.e., relationship direction), models without observation elimination were used (Figure 3). As expected, dbh was positively related to crown length with a 0.16 m increase in crown length for each 1 cm increase in focal tree dbh, holding crowding index constant. Holding focal tree dbh constant at mean value, an increase in crowding effect by one unit resulted in a decrease in crown length by 1.85 m (Figure 3). Surprisingly, focal tree species identity was not a significant predictor of crown length (p = 0.51). Distance-independent competition indices (i.e., BAPH, TPH, and BAL) and area potentially available indices (weighted and unweighted) did not explain the variability in crown length and were not included in final model selection (p > 0.05). Competitor identity, as NMS axes scores, entered independently and in combination were not significant predictors (p ranged from 0.28 to 0.52) of crown length variability.

3.5. Crown Ratio

Live crown ratio was also best explained by focal tree dbh and Hegyi’s index with crown length (HegyiCL) as the size metric (Table 4). Because models with and without potential outliers were similar in coefficient values and sign (i.e., relationship direction), models without observation elimination were used (Figure 3). Dbh was weakly but positively related to live crown ratio with a 0.003 percent increase in live crown ratio for each 1 cm increase in focal tree dbh. Holding focal tree dbh constant at mean value, an increase in crowding by one unit resulted in a decrease in live crown ratio by 0.05 percent (Figure 1). Both focal tree dbh and Hegyi’s index were weak predictors of crown ratio as indicated by low regression coefficient values (Table 4). As with crown length focal tree species identity was not a significant predictor of crown ratio (p = 0.87). Distance-independent competition indices (i.e., BAPH, TPH, and BAL) and area potentially available indices (weighted and unweighted) did not explain the variability in crown ratio and were not included in final model selection (p > 0.05). Neighborhood composition also was not a significant predictor of crown ratio (p = 0.54 for pine abundance, p = 0.38 for hardwood abundance).

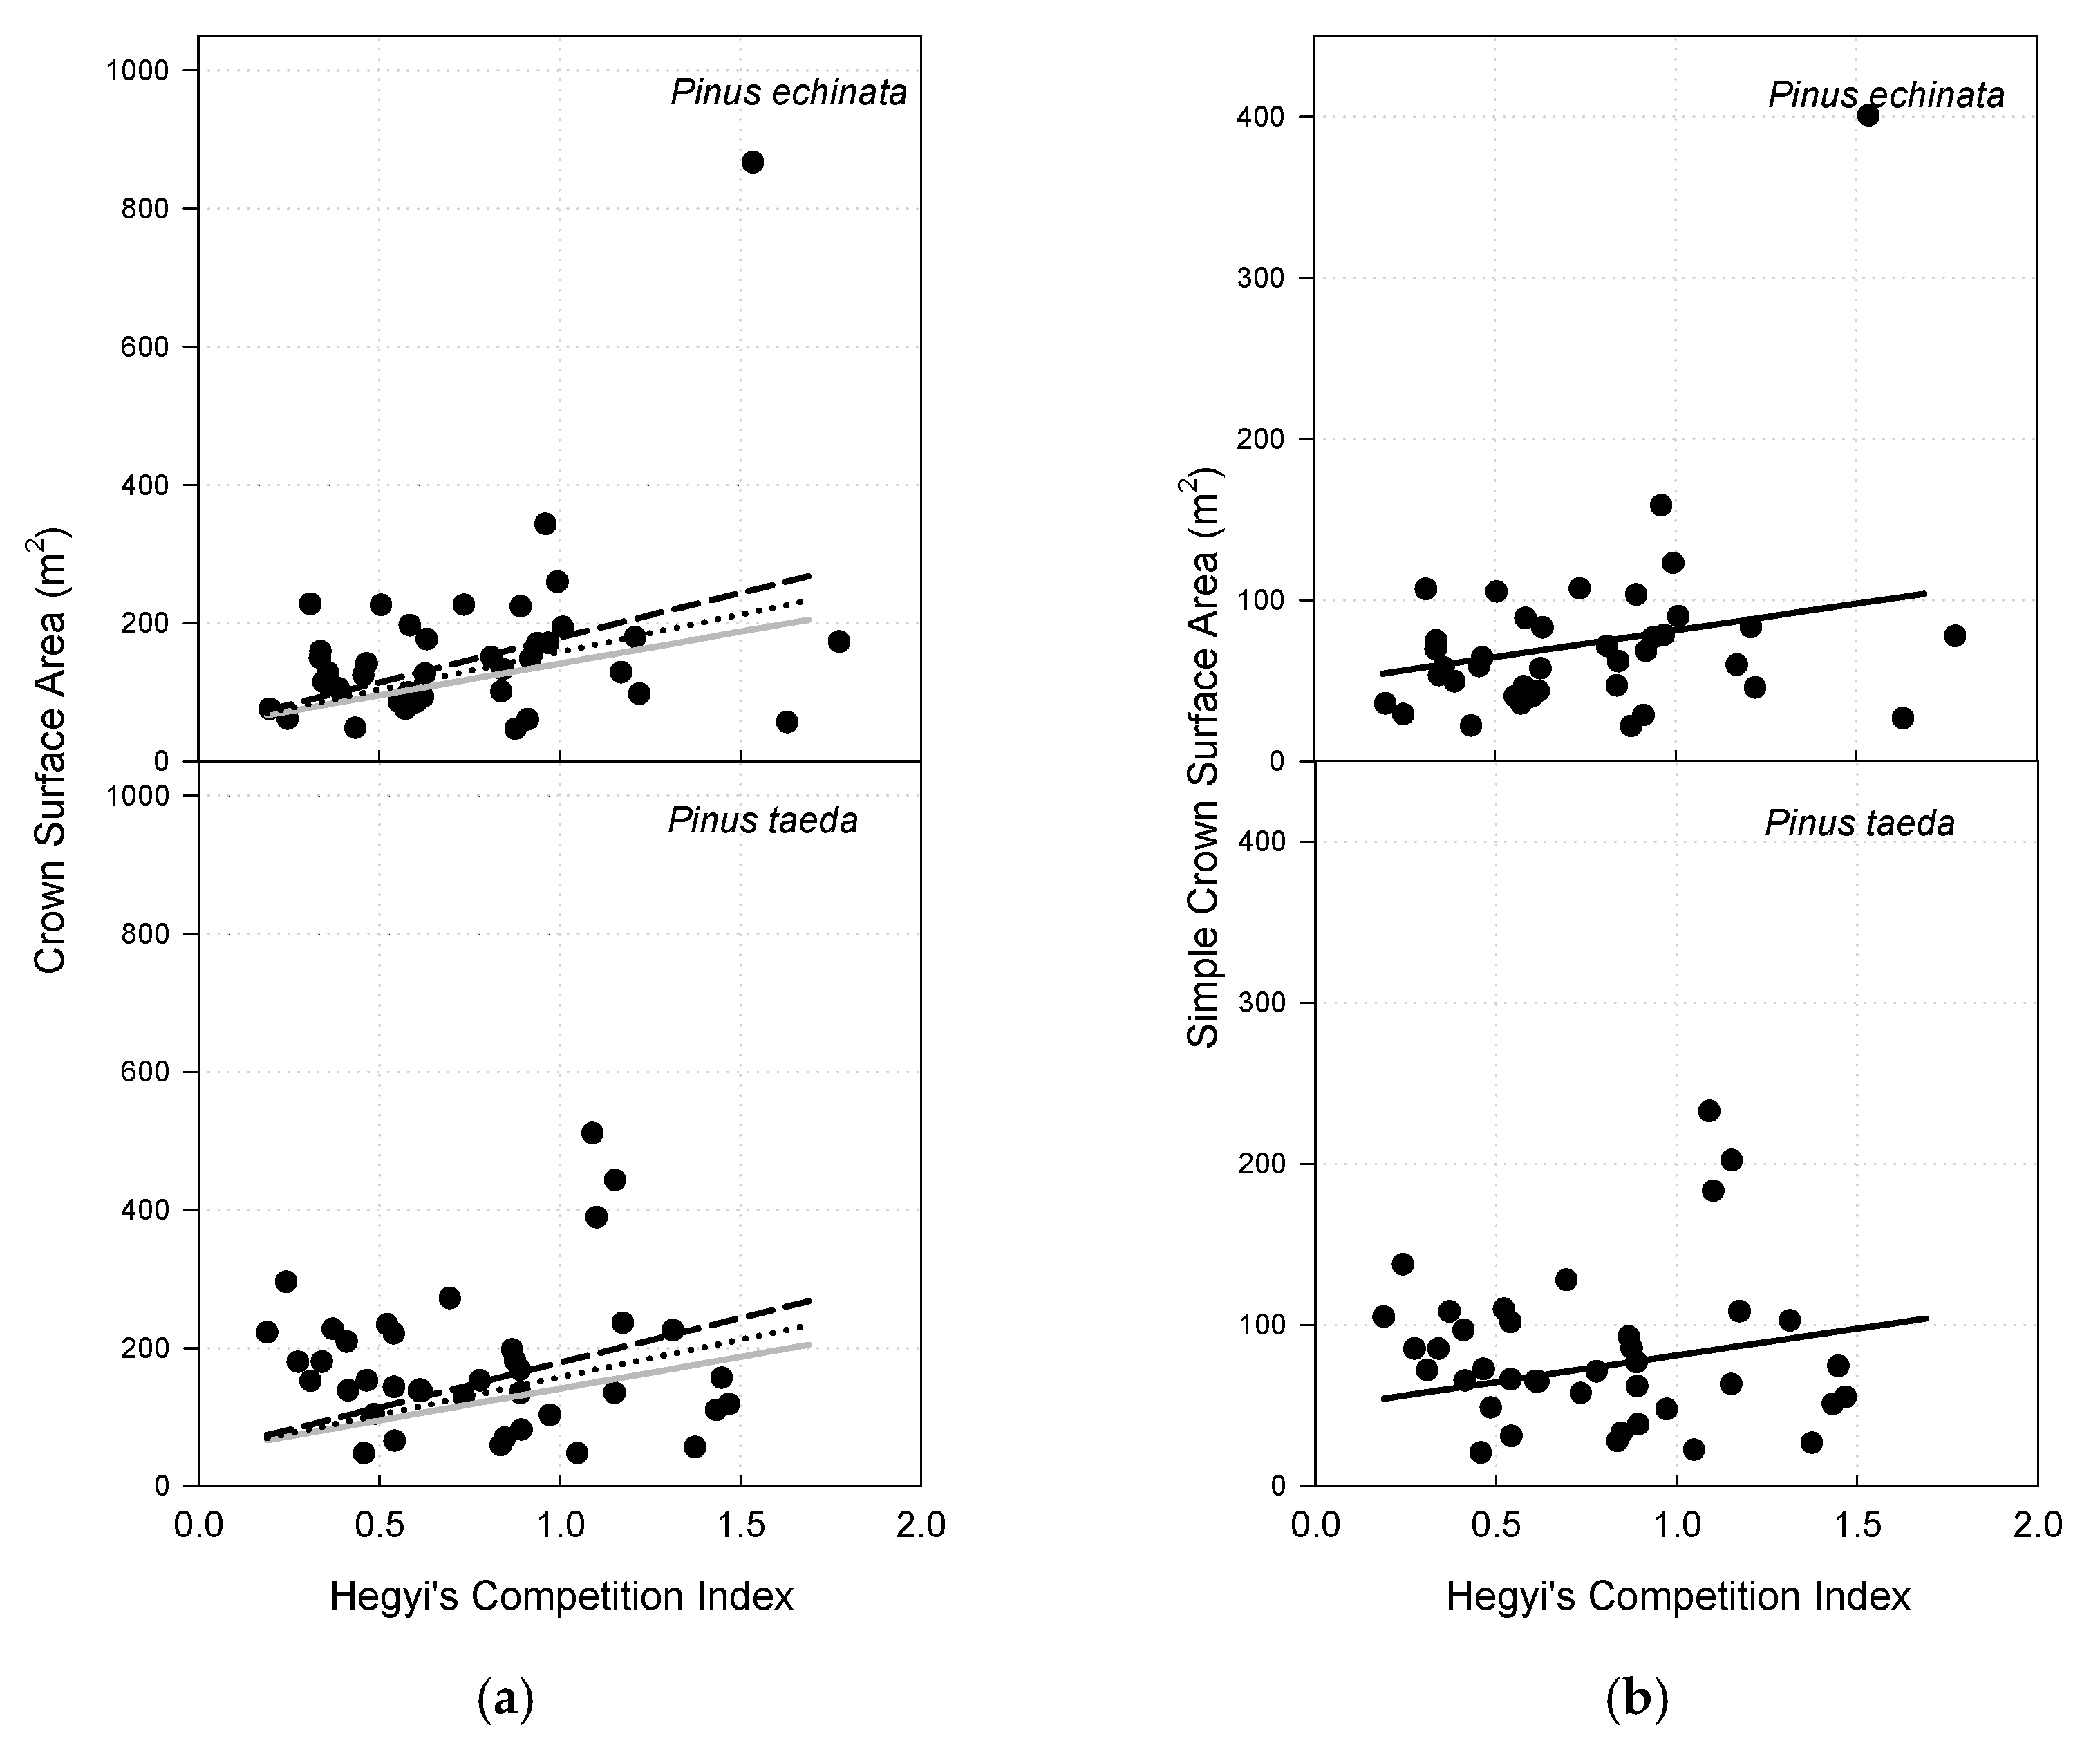
3.6. Crown Surface Area

Crown surface area, calculated as a truncated paraboloid, was best explained by TPH and the interaction between focal tree dbh and HegyiDBH index (Table 4). Trees per hectare was negatively related to crown surface area with a 0.15 m2 decrease in crown surface area for each unit increase in TPH. Focal tree species identity was not a significant predictor (p = 0.99). Holding TPH constant at mean values, smaller dbh focal trees (44 cm) had lower crown surface area than larger dbh focal trees (62 cm) across the range of observable crowding levels as indicated by HegyiDBH (Figure 4). Crown surface area, however, increased slightly with higher levels of HegyiDBH index while holding TPH constant. Other distance-independent competition indices (i.e., BAPH and BAL) and distance-dependent indices (APA, weighted and unweighted) did not explain the variability in crown surface area and were not included in final model selection (p > 0.05). Competitor species identity was not a significant predictor of crown surface area (p = 0.15 for pine abundance, p = 0.48 for hardwood abundance).

3.7. Simple Crown Surface Area

Simple crown surface area, calculated as quadratic crown width multiplied by crown length, was best explained by TPH, focal tree dbh, and HegyiDBH index (Table 4). TPH was negatively related to simple crown surface area with a decrease of 0.04 m2 for every unit increase in TPH. As focal tree dbh increased by 1 cm, simple crown surface area increased by 2.00 m2. Holding other variables constant, crowding as indicated by HegyiDBH had a positive effect on simple surface area with a 33.2 m2 increase in surface area for each unit increase in HegyiDBH (Table 4; Figure 4). The increase in simple crown surface area, regardless of focal tree diameter, as competition increased may be due to the less accurate representation of crown surface area using this measure as it does not account for the tapered shape of pine crowns. Focal tree species identity was not a significant predictor (p = 0.99) of simple surface area. Other distance-independent competition indices (i.e., BAPH and BAL) and area potentially available indices (weighted and unweighted) did not explain the variability in crown surface area and were not included in final model selection (p > 0.05). Competitor identity entered as NMS axes scores independently and in combination were not significant predictors of crown simple surface area (p = 0.013 for pine abundance and p = 0.70 for hardwood abundance).

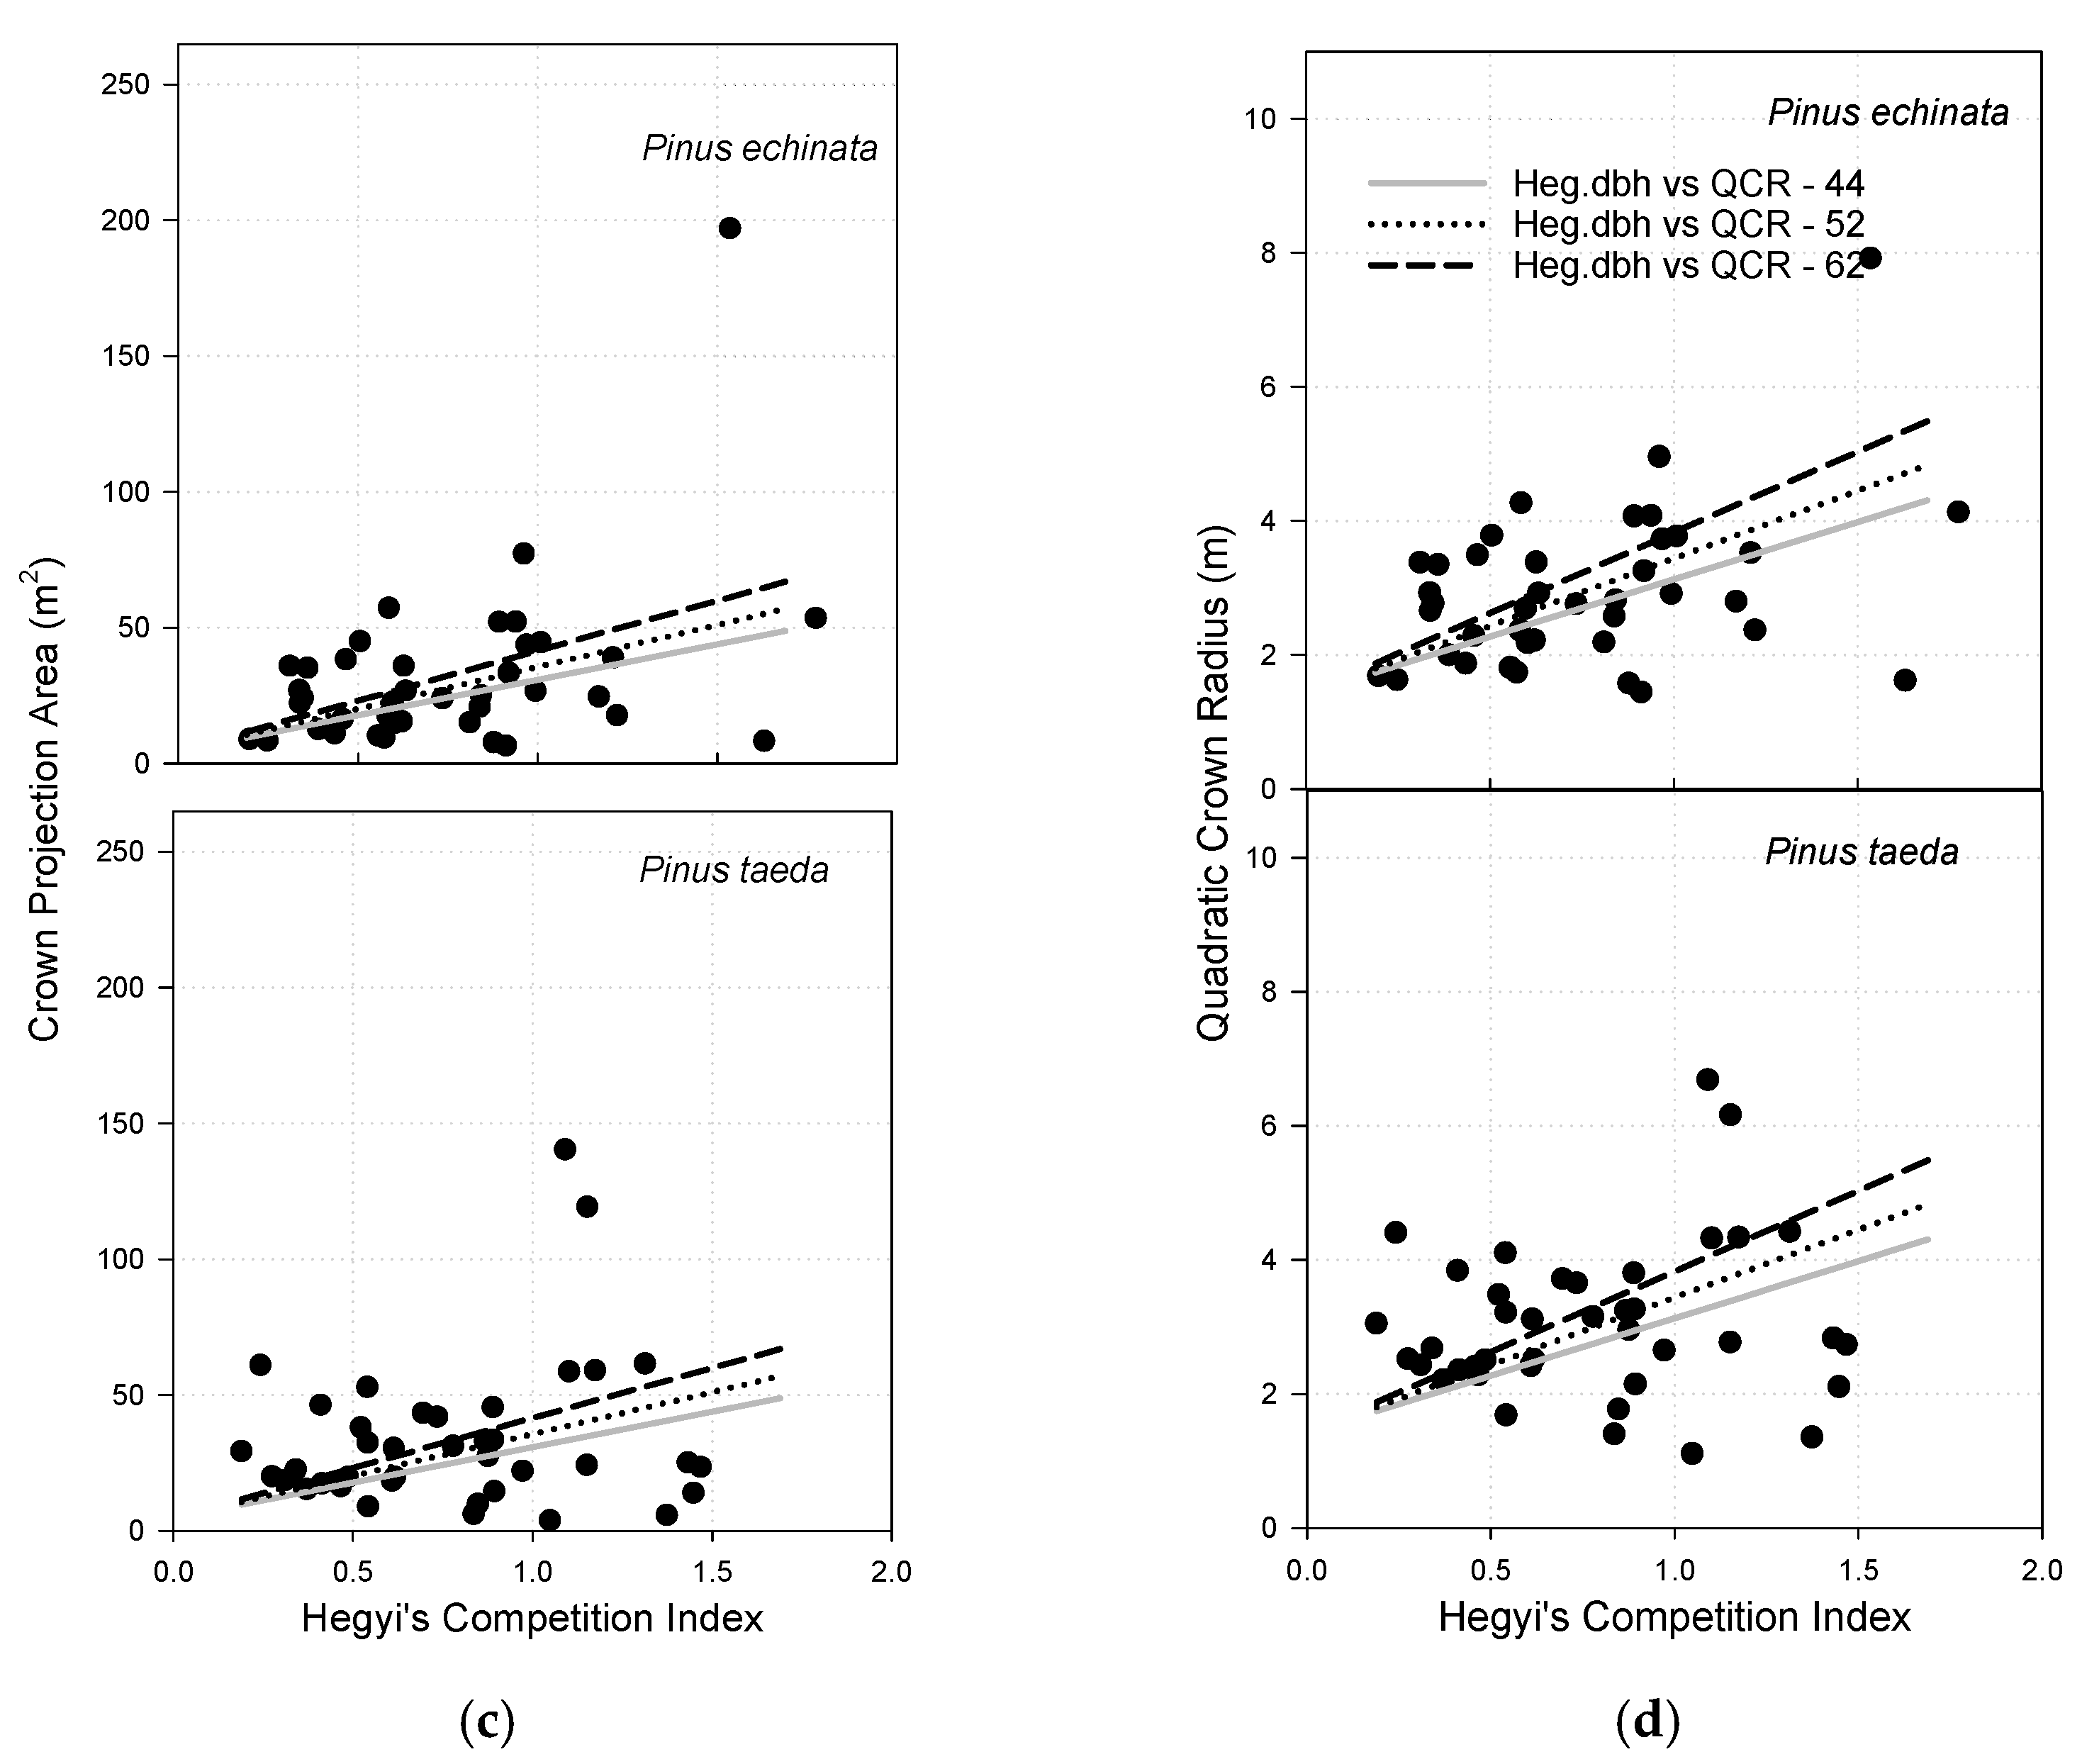
3.8. Crown Projection Area

Crown projection area (CPA), the area encompassed by the longest extent of the four crown radii, was best explained by TPH and the interaction between focal tree dbh and HegyiDBH (Table 4). As TPH increased by 1 tree.ha-1, CPA decreased by 0.02 m2. Focal tree species identity was not a significant predictor (p = 0.61). Holding TPH constant, the positive effect of crowding (HegyiDBH) on CPA increased with increased focal tree dbh (Figure 4). Other distance-independent indices (i.e., BAPH and BAL) and area potentially available indices (weighted and unweighted) did not explain the variability in crown projection area and were not included in final model selection (p > 0.05). Competitor identities entered as NMS axis 1 and axis 2 scores individually and in combination into the model also were not significant predictors of crown projection area (p = 0.23 for pine abundance and p = 0.3 for hardwood abundance).

3.9. Quadratic Crown Radius

Quadratic crown radius (QCR) was best explained by TPH and the interaction between focal tree dbh and HegyiDBH index (Table 4). As TPH increased by 1 tree.ha−1, QCR decreased by 0.002 m. Focal tree species identity was not a significant predictor (p = 0.52) of QCR. Holding TPH constant, crowding (HegyiDBH) positive effect on QCR increased as focal tree dbh increased (Figure 4). Other distance-independent indices (i.e., BAPH and BAL) and area potentially available indices (weighted and unweighted) did not explain the variability in QCR and were not included in final model selection (p > 0.05). Competitor identity entered as NMS axes scores individually and combined was not a significant predictor of QCR (p = 0.08 for pine abundance and p = 0.4 for hardwood abundance).

4. Discussion

Land area of natural-origin pine forest-type in the southeastern United States have declined dramatically between 1950 and 2010 [41]. This decline is associated with an increase in pine plantation dominance over the landscape [42], as landowner’s preference shifts toward short rotation, high-yielding systems. Similar but less drastic declines in area were also reported for oak-pine forest-type [41], highlighting the increased homogenization of the Southern landscape. In light of these trends, it is becoming more important to quantify and document the current conditions of mature, unmanaged, natural-origin pine, pine–hardwood, and upland hardwood stands. These stands represent a legacy of natural disturbance and stand dynamics and may serve as reference conditions [43,44] and analogs in establishing, converting to, restoring, or maintaining structurally complex stands. Although pine–hardwood stands of the UWGCP were described as transient in successional development in the absence of disturbance [41,43], these stands provide potential for the establishment and maintenance of mixed-species, multicohort/stratified stands that provide for maintaining and enhancing complexity. Although current stand-level conditions were not quantified in this paper, we describe focal tree characteristics and neighborhood structure and composition at relevant scales to serve as potential standards for these applications.

4.1. Focal Trees and Their Neighborhoods

Focal trees examined in this study were of similar or smaller diameters compared to canopy shortleaf and loblolly pine trees within the Reynolds Research Natural Area [43] and the Hyatt’s Woods [44]. Both, Reynolds Research Natural Area and Hyatt’s Woods were described as mature, unmanaged, natural-origin, pine–hardwood stands. Competitor tree structure and composition in our study also appeared to be somewhat similar to those reported for these unmanaged, mature stands [43,44], with the exception that our competitor trees were of greater dominance as judged by basal area. It is worth noting, however, that our density and basal area estimates were derived at neighborhood (not stand) scale, as defined by focal tree crown diameter and included perimeter trees with crowns touching or impeding focal trees and thus are better reflections of competitive pressure at these fine scales. Moreover, comparing focal tree attributes (Table 2) to competitor tree structural attributes (Table 3) suggests that our stands have a somewhat stratified structure with pines in the main canopy and hardwoods and pines in midstory and lower-canopy positions, despite that stands originated after harvesting that removed most of the stand at the turn of the 20th century.

4.2. Shortleaf Versus Loblolly

We hypothesized that crowding would have a negative effect on BAI and crown dimensions and that this effect would favor loblolly pine over shortleaf pine. Crowding, as represented by various competition indices, had a negative effect on growth and crowns of both shortleaf and loblolly pine (Figure 3). However, loblolly pine had three times higher growth increment as reflected in the regression coefficient, compared to shortleaf pine within similar competitive neighborhoods (Table 4). Loblolly growth, however, was highly variable compared to shortleaf pine, and this variability resulted in a nonsignificant coefficient or parameter estimate. Crown attributes also did not significantly differ between the two species (Figure 3 and Figure 4).
Given that loblolly is preferred in establishing pine plantations in the southeastern United States, the finding that crowding effect did not differ between the two species is somewhat surprising. In 10 year-old southeastern Oklahoma plantations, loblolly diameter and height growths were 38% and 39%, respectively, greater than that of shortleaf pine [45]. Individual-tree growth and stand yields were also higher for loblolly pine compared to shortleaf pine at various square spacing, ranging from 1.8 to 4.6 m, at 30 years of age [46]. Site index values were also repeatedly reported as higher for loblolly pine than shortleaf pine at base ages of 25 years [47] and 50 years [48] for plantations and natural-origin stands, respectively. Despite the scarcity of empirical evidence on growth of mature trees of shortleaf pine, it is frequently noted that at ages 50 and above loblolly growth gains become insignificant when compared to shortleaf pine [48,49]. Our results suggest that shortleaf pine may remain competitive in mature, natural-origin stands and that growth gains achieved by loblolly at young ages (up to 50 years) may continue at long rotations. With renewed interest in shortleaf pine management, it is increasingly important to provide growth, yield, and value estimates for mature shortleaf pine stands to better inform the assessment of trade-offs between potential cost opportunity and conservation of shortleaf pine [47,49].

4.3. Competition Indices

For both species, negative effects of crowding on crown were reflected by different types of competition indices. Effects on length and ratio were better represented through distance-weighted size ratios (Figure 3), while radius, surface area, and projection area effects were better represented using distance-independent competition indices (Figure 4). Several studies have compared various distance-dependent and distance-independent indices [50,51,52,53,54,55]. Inclusion of spatial information in modeling competition effects was shown to improve model performance in structurally heterogeneous and complex stands of western Montana [56], while not improving model performance in mixed conifer forests of northern California [57]. In loblolly pine stands, distance-weighted size ratios were shown to perform well for height and diameter increment, especially when competitors were chosen using angle gauge rather than fixed radius [58]. Area potentially available was also shown as a good measure of competition for loblolly growth [5]. In general, no single type of competition indices applies universally, and it appears that index performance depends on forest type, conditions, and history [37,56].
In mature, natural-origin, pine–hardwood stands examined in this study, area potentially available did not improve model performance and simple distance-independent measures of tree density outperformed distance-weighted size ratios in explaining the variability in BAI (Table 4). Moreover, inclusion of distance-weighted size ratios in crown radius, surface area, and projection area showed a significant interaction with focal tree diameter, thus depicting a scenario in which larger diameter focal trees were able to exert higher competitive influence and occupy more horizontal space given high levels of competition. More importantly, this suggests that focal pines were able to expand horizontally despite larger and closer neighbors, which demonstrates that our focal pines were above most competitors and is indicative of a stratified structure of our studied stands. Focal tree diameter outperformed height and crown length as size metrics for distance-weighted size ratios used in explaining variability in crown radius, surface area, and projection area. This is likely due to diameter being a better predictor of a broader suite of crown dimensional characteristics as it is intimately linked to crown growth [59,60]. Reflecting on our hypothesis, it appears that distance-dependent competition indices were better suited for evaluating vertical crown metrics (i.e., length and ratio), while distance-independent competition indices better explained the variation in BAI and horizontal crown metrics (i.e., radius, surface area, and projection area).

4.4. Conspecific vs. Interspecific Neighborhoods

Contrary to our hypothesis, competitive effects on focal trees did not differ by competitor species identity. We have evaluated the effect of competitor identity using scores from the first two axes of nonmetric multidimensional scaling, which better represented the composition of neighborhoods within these stands by separating focal tree neighborhoods across competitor identity space (Figure 2). This approach is also better in its ability to reduce multicollinearity among competitor species used as predictors. The hypothesis that all competitor species have an equivalent effect on target species has been rejected for several forests including forests of northern New England [18], Maine [26], northeastern Puerto Rico [24], and British Columbia [23,25]. However, examination of the effect of neighbor identity on sapling growth in Panama showed that all neighbors had an equivalent effect for 34 of the 60 species examined [22]. Although mechanisms for the differential effect of competitor species on targets and variability in the strength of interspecific competition are not fully clear, it has been hypothesized that the effect of target species on site resources and below-ground root morphology may explain these differences [23]. In our study, focal trees were in a stratum above other pine and hardwood competitors, which may explain the lack of effect of conspecific and interspecific neighbors on growth and crown dimensions.

5. Conclusions

As forest management evolves, increased focus is being placed on the maintenance of complex residual structures and longer rotations. Thus, an increased understanding regarding the potential impacts of this strategy for particular species such as shortleaf and loblolly pine is essential. This study has shown that shortleaf pine may remain competitive in mature, natural-origin stands longer than initially hypothesized. As competitor species identity was not a significant predictor of crown dimensions or growth, it follows that mixed-species, pine–hardwood forest conditions did not have a significant effect on shortleaf and loblolly pine in this study. This may be attributed, at least in part, to the stratification of mature, natural-origin, pine–hardwood mixtures examined here. Our results imply that it may be possible and advantageous to manage such complex stands of shortleaf–loblolly pine–hardwood over long rotations. There may also be great flexibility in post-harvest residual patterns for maintenance of other services, such as wildlife habitat or recreation. These findings collectively highlight shortleaf pine’s competitive potential in mature, natural-origin stands and provide support for the restoration of pine–hardwood and hardwood–pine stratified mixtures as well as management of shortleaf pine at long-rotations.

Author Contributions

Conceptualization, M.B. and E.C.; methodology, M.B. and E.C.; formal analysis, M.B.; investigation, E.C.; resources, M.B.; data curation, M.B.; writing—original draft preparation, M.B. and E.C.; writing—review and editing, M.B. and E.C.; supervision, M.B.; project administration, M.B. Both authors have read and agreed to the published version of the manuscript.

Funding

This research was supported, in part, by the McIntire–Stennis Cooperative Forestry Research Program (project number 1005987-ARK02472).

Institutional Review Board Statement

Not applicable.

Informed Consent Statement

Not applicable.

Data Availability Statement

All raw data is curated locally and are available upon request from the corresponding author.

Acknowledgments

We thank the Garner family, Les Reid, and the Potlatch Corporation for access to the research sites.

Conflicts of Interest

The authors declare no conflict of interest. The funders had no role in the design of the study; in the collection, analyses, or interpretation of data; in the writing of the manuscript, or in the decision to publish the results.

References

  1. Pacala, S.W.; Canham, C.D.; Saponara, J.; Silander, J.J.A.; Kobe, R.K.; Ribbens, E. Forest models defined by field measurements: Estimation, error analysis and dynamics. Ecol. Monogr. 1996, 66, 1–43. [Google Scholar] [CrossRef]
  2. Stoll, P.; Weiner, J. A Neighborhood View of interactions among individual plants. In The Geometry of Ecological Interactions: Simplifying Spatial Complexity; Cambridge University Press: Cambridge, UK, 2000; pp. 11–27. [Google Scholar] [CrossRef]
  3. Canham, C.D.; Uriarte, M. Analysis of neighborhood dynamics of forest ecosystems using likelihood methods and modeling. Ecol. Appl. 2006, 16, 62–73. [Google Scholar] [CrossRef]
  4. Fraver, S.; D’Amato, A.W.; Bradford, J.B.; Jonsson, B.G.; Jonsson, M.T.; Esseen, P.-A. Tree growth and competition in an old-growth Picea abies forest of boreal Sweden: Influence of tree spatial patterning. J. Veg. Sci. 2014, 25, 374–385. [Google Scholar] [CrossRef]
  5. Daniels, R.F.; Burkhart, H.E.; Clason, T.R. A comparison of competition measures for predicting growth of loblolly pine trees. Can. J. For. Res. 1986, 16, 1230–1237. [Google Scholar] [CrossRef]
  6. Miller, J.H.; Zutter, B.R.; Zedaker, S.M.; Edwards, M.B.; Haywood, J.D.; Newbold, R.A. A Regional Study on the Influence of Woody and Herbaceous Competition on Early Loblolly Pine Growth. South. J. Appl. For. 1991, 15, 169–179. [Google Scholar] [CrossRef] [Green Version]
  7. Cain, M.D. The Influence of Woody and Herbaceous Competition on Early Growth of Naturally Regenerated Loblolly and Shortleaf Pines. South. J. Appl. For. 1991, 15, 179–185. [Google Scholar] [CrossRef]
  8. Miller, J.H.; Zutter, B.R.; Zedaker, S.M.; Edwards, M.B.; Newbold, R.A. Growth and Yield Relative to Competition for Loblolly Pine Plantations to Midrotation—A Southeastern United States Regional Study. South. J. Appl. For. 2003, 27, 237–252. [Google Scholar] [CrossRef]
  9. Amateis, R.L.; Burkhart, H.E. Rotation-Age Results from a Loblolly Pine Spacing Trial. South. J. Appl. For. 2012, 36, 11–18. [Google Scholar] [CrossRef]
  10. Baldwin, V.; Peterson, K.D.; Clark, A.; Ferguson, R.B.; Strub, M.R.; Bower, D.R. The effects of spacing and thinning on stand and tree characteristics of 38-year-old Loblolly Pine. For. Ecol. Manag. 2000, 137, 91–102. [Google Scholar] [CrossRef]
  11. Lawson, E.R.; Kitchens, R.N. Shortleaf. In Silvicultural Systems for the Major Forest Types of the United States Agricultural Handbook 445; Burns, R.M., Ed.; U.S. Department of Agriculture, Forest Service: Washington, DC, USA, 1983; pp. 157–162. [Google Scholar]
  12. Wear, D.N.; Gries, J. The Southern Forest Futures Project: Technical Report; U.S. Department of Agriculture, Forest Service, Southern Research Station: Ashville, NC, USA, 2012.
  13. Guldin, J.M. Restoration and management of shortleaf pine in pure and mixed stands- science, empirical observation, and the wishful application of generalities. In Shortleaf Pine Restoration and Ecology in the Ozarks: Proceedings of a Symposium; Kabrick, J.M., Dey, D.C., Gwaze, D., Eds.; U.S. Department of Agriculture, Forest Service, North-ern Research Station: Springfield, MO, USA, 2007; pp. 47–58. [Google Scholar]
  14. Guldin, J.M. Ecology of shortleaf pine. In Proceedings of the Symposium on the Shortleaf Pine Ecosystem, Little Rock, AR, USA, 31 March–2 April 1986; Murphy, P.A., Ed.; Arkansas Cooperative Extension Service: Little Rock, AR, USA, 1986; pp. 25–40. [Google Scholar]
  15. Stewart, J.F.; Tauer, C.G.; Nelson, C.D. Bidirectional introgression between loblolly pine (Pinus taeda L.) and shortleaf pine (P. echinata Mill.) has increased since the 1950s. Tree Genet. Genom. 2011, 8, 725–735. [Google Scholar] [CrossRef]
  16. Cain, M.D.; Shelton, M.G. Survival and growth of Pinus echinata and Quercus seedlings in response to simulated summer and winter prescribed burns. Can. J. For. Res. 2000, 30, 1830–1836. [Google Scholar] [CrossRef]
  17. Yeiser, J.L.; Barnett, J.P. Growth and physiological response to four shortleaf pine families to herbicidal control of herbaceous competition. South. J. Appl. For. 1991, 15, 199–204. [Google Scholar] [CrossRef] [Green Version]
  18. Canham, C.D.; Papaik, M.J.; Uriarte, M.; McWilliams, W.H.; Jenkins, J.C.; Twery, M.J. Neighborhood Analyses Of Canopy Tree Competition Along Environmental Gradients In New England Forests. Ecol. Appl. 2006, 16, 540–554. [Google Scholar] [CrossRef] [Green Version]
  19. Papaik, M.J.; Canham, C.D. Multi-model analysis of tre competition along environmental gradients in southern New England forests. Ecol. Appl. 2006, 16, 1880–1892. [Google Scholar] [CrossRef]
  20. Coates, K.D.; Canham, C.D.; Lepage, P.T. Above- versus below-ground competitive effects and responses of a guild of temperate tree species. J. Ecol. 2009, 97, 118–130. [Google Scholar] [CrossRef]
  21. Hubbell, S.P. The Unified Neutral Theory of Biodiversity and Biogeography (MPB-32). In Monographs in Population Biology; Princeton University Press: Princeton, NJ, USA, 2001; Volume 32. [Google Scholar]
  22. Uriarte, M.; Condit, R.; Canham, C.; Hubbell, S.P. A spatially explicit model of sapling growth in a tropical forest: Does the identity of neighbours matter? J. Ecol. 2004, 92, 348–360. [Google Scholar] [CrossRef]
  23. Canham, C.; Lepage, P.T.; Coates, K.D. A neighborhood analysis of canopy tree competition: Effects of shading versus crowding. Can. J. For. Res. 2004, 34, 778–787. [Google Scholar] [CrossRef]
  24. Uriarte, M.; Canham, C.D.; Thompson, J.; Zimmermann, J.K. A neighborhood analysis of tree growth and survival in a hur-ricane-driven tropical forest. Ecol. Monogr. 2004, 74, 591–614. [Google Scholar] [CrossRef]
  25. Thorpe, H.; Astrup, R.; Trowbridge, A.; Coates, K. Competition and tree crowns: A neighborhood analysis of three boreal tree species. For. Ecol. Manag. 2010, 259, 1586–1596. [Google Scholar] [CrossRef]
  26. Waskiewicz, J.; Kenefic, L.; Weiskittel, A.; Seymour, R. Species mixture effects in northern red oak–eastern white pine stands in Maine, USA. For. Ecol. Manag. 2013, 298, 71–81. [Google Scholar] [CrossRef]
  27. Bragg, D.C. Reference Conditions for Old-Growth Pine Forests in the Upper West Gulf Coastal Plain. J. Torrey Bot. Soc. 2002, 129, 261. [Google Scholar] [CrossRef]
  28. Chen, J.; Tauer, C.G.; Bai, G.; Huang, Y.; Payton, M.; Holley, A.G. Bidirectional introgression between Pinus taeda and Pinus echinata: Evidence from morphological and molecular data. Can. J. For. Res. 2004, 34, 2508–2516. [Google Scholar] [CrossRef] [Green Version]
  29. Oliver, C.D.; Larson, B.C. Forest Stand Dynamics; McGraw-Hill, Inc.: New York, NY, USA, 1996; ISBN 0471138339. [Google Scholar]
  30. Stokes, M.A.; Smiley, T.L. An Introduction to Tree-Ring Dating; University of Chicago Press: Chicago, IL, USA, 1968. [Google Scholar]
  31. Holmes, R.L. Computer-assisted quality control in tree-ring dating and measurement. Tree-Ring Bull. 1983, 43, 69–78. [Google Scholar]
  32. Grissino-Mayer, H.D. Evaluating crossdating accuracy: A manual and tutorial for the computer program COFECHA. Tree-Ring Res. 2001, 57, 205–221. [Google Scholar]
  33. Bunn, A. A dendrochronology program library in R (dplR). Dendrochronologia 2008, 26, 115–124. [Google Scholar] [CrossRef]
  34. Miles, P.D.; Smith, B.W. Specific Gravity and Other Properties of Wood And Bark for 156 Tree Species Found in North America; U.S. Department of Agriculture, Forest Service, Northern Research Station: Newton Square, PA, USA, 2009.
  35. Pinherio, J.; Bates, D. Mixed-Effects Models in S and S-Plus, 2000th ed.; Springer: New York, NY, USA, 2000; ISBN 0-387-98957-9. [Google Scholar]
  36. R Development Core Team. R: A Language and Environment for Statistical Computing; R Development Core Team: Vienna, Austria, 2013. [Google Scholar]
  37. Weiskittel, A.; Hann, D.W.; Kershaw, J.; Vanclay, J. Forest Growth and Yield Modeling; John Wiley & Sons, Ltd.: Hoboken, NJ, USA, 2011. [Google Scholar]
  38. Hegyi, F. A simulation model for managing jack pine stands. RoyalColl. For. Res. Notes 1974, 30, 74–90. [Google Scholar]
  39. Brown, G.S. Point Density in Stems Per Acre. N. Z. For. Res. 1965, 38, 11. [Google Scholar]
  40. McCune, B.; Grace, J.B.; Urban, D.L. Analysis of Ecological Communities; MjM Software Design: Glenden Beach, OR, USA, 2002; ISBN 9780972129008. [Google Scholar]
  41. Hartsell, A.J.; Conner, R.C. Forest Area and Conditions: A 2010 Update of Chapter 16 of the Southern Forest Resource Assessment; U.S. Department of Agriculture, Forest Service, Southern Research Station: Ashville, NC, USA, 2013; Volume 174.
  42. Zhang, D.; Polyakov, M. The geographical distribution of plantation forests and land resources potentially available for pine plantations in the U.S. South. Biomass Bioenergy 2010, 34, 1643–1654. [Google Scholar] [CrossRef]
  43. Bragg, D.C.; Shelton, M.G. Lessons from 72 years of monitoring a once-cut pine-hardwood stand on the Crossett Experimental Forest, Arkansas, U.S.A. For. Ecol. Manag. 2011, 261, 911–922. [Google Scholar] [CrossRef]
  44. Bragg, D.C. Composition, Biomass, and Overstory Spatial Patterns in a Mature Pine-Hardwood Stand in Southeastern Arkansas. Castanea 2013, 78, 37–55. [Google Scholar] [CrossRef]
  45. Dipesh, K.; Will, R.; Lynch, T.B.; Heinemann, R.; Holeman, R. Comparison of Loblolly, Shortleaf, and Pitch X Loblolly Pine Plantations Growing in Oklahoma. For. Sci. 2015, 61, 540–547. [Google Scholar] [CrossRef] [Green Version]
  46. Schubert, M.R.; Rennie, J.C.; Schlarbaum, S.E. Four pine species grown at four spacings on the eastern highland rim, Tennessee, after 30 years. In Proceedings of the 12th Biennial Southern Silvicultural Research Conference, Biloxi, MS, USA, 24–28 February 2003; Connor, K.F., Ed.; U.S. Department of Agriculture, Forest Service, Southern Research Station: Ashville, NC, USA, 2004; pp. 433–436. [Google Scholar]
  47. Lynch, T.B.; Saud, P.; Dipesh, K.; Will, R. Plantation Site Index Comparisons for Shortleaf Pine and Loblolly Pine in Oklahoma, USA. For. Sci. 2016, 62, 546–552. [Google Scholar] [CrossRef]
  48. Schultz, R.P. Loblolly Pine: The Ecology and Culture of Loblolly Pine (Pinus taeda L.); U.S. Department of Agriculture, Forest Service: Washington, DC, USA, 1997.
  49. Cl, V.; Blazier, M.; McConnell, E.; Adams, J.P. Determining unthinned shortleaf pine (Pinus echinata Mill.) plantation economic rotation ages in the Western Gulf. For. Res. Eng. Int. J. 2018, 2, 132–138. [Google Scholar] [CrossRef]
  50. Alemdag, I. Evaluation of Some Competition Indexes for the Prediction of Diameter Increment in Planted White Spruce; Canadian Forestry Service, Department of the Environment: Ottawa, ON, Canada, 1978. [Google Scholar]
  51. Bella, I. A new competition model for individual trees. For. Sci. 1971, 17, 364–372. [Google Scholar]
  52. Pukkala, T.; Kolstrom, T. Competition indicies and the prediction of radial growth in Scots Pine. Silva Fenn. 1987, 21, 55–67. [Google Scholar] [CrossRef] [Green Version]
  53. Tome, M.; Burkhart, H.E. Distance-dependent competition measures for predicting growth of individual trees. For. Sci. 1989, 35, 816–831. [Google Scholar]
  54. Martin, G.L.; Ek, A.R. A comparison of competition measures and growth models for predicting plantation red pine diameter and height growth. For. Sci. 1984, 30, 731–743. [Google Scholar]
  55. Biging, G.S.; Dobbertin, M. Evaluation of competition indices in individual tree growth models. For. Sci. 1995, 41, 360–377. [Google Scholar]
  56. Contreras, M.A.; Affleck, D.; Chung, W. Evaluating tree competition indices as predictors of basal area increment in western Montana forests. For. Ecol. Manag. 2011, 262, 1939–1949. [Google Scholar] [CrossRef]
  57. Biging, G.S.; Dobbertin, M. A comparison of distance-dependent competition measures for height and basal area growth of individual conifer trees. For. Sci. 1992, 38, 695–720. [Google Scholar]
  58. Daniels, R.F. Simple competition indices and their correlation with annual loblolly pine tree growth. For. Sci. 1976, 22, 454–456. [Google Scholar]
  59. Larson, P.R. Stem Form Development of Forest Trees. For. Sci. 1963, 9, a0001-42. [Google Scholar] [CrossRef]
  60. Farrar, J.L. Longitudinal Variation in The Thickness Of The Annual Ring. For. Chron. 1961, 37, 323–349. [Google Scholar] [CrossRef] [Green Version]
Figure 1. Mean importance value (%) of the five most abundant competitor species in the neighborhoods of shortleaf (Pinus echinata) and loblolly pine (Pinus taeda) across three mature, natural-origin, pine–hardwood stands in southeastern Arkansas (separated by dashed line).
Forests 12 00935 g001
Figure 2. Ordination of focal tree neighborhoods (symbols) in competitor identity (crosshairs; PITA = Pinus taeda; PIEC = Pinus echinata; QUFA = Quercus falcata; QUAL = Quercus alba; LIST = Liquidambar styraciflua; and QUST = Quercus stellata) space created with the first two axes of nonmetric multidimensional scaling, with: (a) stand and (b) focal tree species membership overlay.
Forests 12 00935 g002
Figure 3. Focal tree: (a) mean basal area increment (cm2); (b) crown length (m); (c) and crown ratio (%) as functions of competition indices for shortleaf (Pinus echinata) and loblolly pine (Pinus taeda) in mature, natural-origin, pine–hardwood mixtures of southeastern Arkansas.
Forests 12 00935 g003
Figure 4. Focal tree: (a) mean crown surface area (m2; truncated paraboloid surface area); (b) simple crown surface area (m2; quadratic width × length); (c) crown projection area (m2); and (d) crown radius (m) as functions of competition indices for shortleaf (Pinus echinata) and loblolly pine (Pinus taeda) in mature, natural-origin, pine-hardwood mixtures of southeastern Arkansas. Multiple lines for surface area, projection area, and radius represent responses at various diameters at breast height (44 cm, 52 cm, and 62 cm) due to a significant (p < 0.05) interaction term.
Forests 12 00935 g004aForests 12 00935 g004b
Table 1. Calculated crown dimensions used in this paper.
Crown DimensionMeasurements and Calculation
Crown length (CL) C L = H T H L C , where HT is total height and HLC 1 is the height to the base of the live crown
Live crown ratio (LCR) L C R = C L H T
Quadratic mean crown radius (QCR) Q C R = r 1 2 + r 2 2 + r 3 2 + r 4 2 4 , where r1r4 are the crown radii in the four cardinal directions
Crown projection area (CPA) C P A = π Q C R   2
Crown surface area (CSA) C S A = ( π 6 ) ( Q C R C L 2 ) [ ( Q C R 2 + 4 . C L 2 ) 3 2 Q C R 3 ]
Simple crown surface area (CSAS) C S A S = Q C W . C L , where QCW is quadratic crown width 2
1 Base of live crown was defined as the bottom of the continuous live crown. 2 QCW calculated as twice the QCR.
Table 2. Mean and standard error of focal tree attributes for shortleaf and loblolly pine, across three mature, natural-origin, pine–hardwood stands in southeastern Arkansas.
StandSpeciesnDBH 1 (cm)Height (m)Age
(Years)
Crown Ratio (%)Crown Radius 2 (m)NeaNeig 3 (m)
North ClevelandShortleaf1649.5 (10.3)34.5 (3.1)107 (5)32 (8)2.6 (0.9)3.3 (1.3)
Loblolly1656.2 (12.8)38.0 (2.1)101 (4)33 (1)2.6 (0.9)3.8 (1.2)
West ClevelandShortleaf1651.2 (7.9)33.3 (4.4)95 (7)36 (12)3.5 (1.4)2.8 (1.3)
Loblolly1656.2 (13.5)33.4 (4)86 (4)37 (7)3.8 (1.2)3.1 (1.4)
BradleyShortleaf852.7 (9.8)31.4 (3.6)131 (9)36 (5)2.6 (1.1)2.9 (0.8)
Loblolly856.4 (12.7)36.1 (5.7)118 (4)39 (9)2.5 (0.7)3.7 (1.8)
1 Diameter at breast height (1.37 m). 2 Quadratic crown radius. 3 Nearest neighbor distance.
Table 3. Mean and standard error of competitor tree structural attributes in the neighborhoods of shortleaf and loblolly pine across three mature, natural-origin, pine–hardwood stands in southeastern Arkansas.
StandSpeciesnCC Dens 1 (trees.ha−1)CC BA 2 (m2.ha−1)QMD 3 (cm)Height (m)Crown Ratio (%)
North ClevelandShortleaf16436 (62)65.5 (15.4)41.3 (1.9)25.5 (2.4)46 (3)
Loblolly16522 (114)83.8 (21.8)47.0 (3.1)28.4 (2.3)48 (4)
West ClevelandShortleaf16349 (39)35.7 (6.6)33.6 (2.2)24.9 (2.1)50 (4)
Loblolly16384 (40)41.5 (6.4)37.1 (1.8)24.3 (2.1)49 (4)
BradleyShortleaf8396 (33)29.7 (5.2)30.3 (2.8)21.3 (2.7)49 (0.1)
Loblolly8332 (57)51.1 (11.0)42.9 (5.0)27.1 (5.1)51 (0.1)
1 Competitor cumulative density. 2 Competitor cumulative basal area. 3 Quadratic mean diameter.
Table 4. Linear mixed-effects model parameter coefficients, standard error (SE), and p-values by response variable.
PredictorCoefficientSEp
Basal area increment 1 (cm2)
Intercept25.0813.390<0.001
Loblolly pine (Pinus taeda) 22.8061.6670.0967
Trees per hectare−0.0100.003<0.001
Crown length (m)
Intercept5.9231.8380.002
DBH (cm)0.1630.032<0.001
HegyiCL−1.8480.472<0.001
Crown ratio (%)
Intercept0.2380.045<0.001
DBH (cm)0.0030.0007<0.001
HegyiCL−0.0510.013<0.001
Crown surface area (m2)
Intercept109.0613.543<0.001
Trees per hectare−0.1450.022<0.001
DBH (cm) * HegyiDBH2.0920.380<0.001
Simple crown surface area (m2)
Intercept−41.8715.4240.008
Trees per hectare−0.0420.005<0.001
DBH (cm)2.000.299<0.001
HegyiDBH33.177.364<0.001
Crown projection area (m2)
Intercept15.5212.280<0.001
Trees per hectare−0.0260.002<0.001
DBH (cm) * HegyiDBH0.5940.090<0.001
Quadratic crown radius (m)
Intercept2.3420.150<0.001
Trees per hectare−0.002<0.001<0.001
DBH (cm) * HegyiDBH0.0390.004<0.001
1 BAI is mean over the period 2005–2014. 2 Species is a categorical factor with two levels; loblolly pine is compared to the reference shortleaf pine.
Publisher’s Note: MDPI stays neutral with regard to jurisdictional claims in published maps and institutional affiliations.

