Article

Population Demographic History of a Rare and Endangered Tree Magnolia sprengeri Pamp. in East Asia Revealed by Molecular Data and Ecological Niche Analysis

1
Key Laboratory of Resource Biology and Biotechnology in Western China, Ministry of Education, College of Life Sciences, Northwest University, Xi’an 710069, China
2
Fairylake Botanical Garden, Shenzhen and Chinese Academy of Sciences, Shenzhen 518004, China
3
Xi’an Botanical Garden, Xi’an 710061, China
4
National Engineering Laboratory for Resource Developing of Endangered Chinese Crude Drugs in Northwest of China, Key Laboratory of the Ministry of Education for Medicinal Resources and Natural Pharmaceutical Chemistry, College of Life Sciences, Shaanxi Normal University, Xi’an 710119, China
*
Authors to whom correspondence should be addressed.
Correspondence: two authors contributed equally to this study.
Forests 2021, 12(7), 931; https://doi.org/10.3390/f12070931
Submission received: 14 June 2021 / Revised: 8 July 2021 / Accepted: 13 July 2021 / Published: 16 July 2021
(This article belongs to the Section Genetics and Molecular Biology)

Abstract

:
Quaternary climate and environment oscillations have profoundly shaped the population dynamic history and geographic distributions of current plants. However, how the endangered and rare tree species respond to the climatic and environmental fluctuations in the subtropical regions of China in East Asia still needs elucidation. In this study, we collected 36 natural populations of an endangered and rare tree species Magnolia sprengeri Pamp. in subtropical China to determine the demographic history, and modeled the changes of geographic distributions of this species in East Asia based on the MaxEnt ecological niche analyses. In addition, we sequenced three maternally inherited chloroplast DNA fragments (matK, trnH-psbA, and rbcL) for all the natural populations which covered the whole geographic distributions of M. sprengeri. Population genetic analysis showed that the endangered tree species have a low level of chloroplast DNA diversity. However, the genetic variation contribution within populations was greater than that among populations (FST = 0.276), which demonstrated a high level of genetic differentiation. Interestingly, some unique chloroplast DNA haplotypes and higher genetic variations were identified in the Qinling-Daba Mountains, Central China, and Tianmu Mountains of Zhejiang province, East of China in East Asia. Combining with the species distribution modeling, we speculated that these areas might be the potential glacial refugia for the endangered plant M. sprengeri. Phylogeographic analysis demonstrated that the geographic factors (e.g., mountains, rivers, and other isolation barriers) had little effect on the genetic divergence among populations. Ecological niche modeling further revealed that the natural populations of M. sprengeri did not experience significant geographic distribution changes from the last glacial maximum to the present time. These findings are in line with the analysis results of the multimodal mismatch patterns of the chloroplast DNA variations. To protect the endangered species M. sprengeri, in situ and ex situ conservation strategies should be formulated for the natural populations with higher genetic variations.

1. Introduction

During the Quaternary periods, the global climate experienced repeated cycles of glacial and interglacial stages [1], which lead to the changes of geographic distributions and genetic structures of most organisms [2]. Some studies revealed that most plant species survived in the glacial refugia under the unfavorable Pleistocene glacial conditions and became the sources of post-glacial recolonization processes, which has been generally accepted in biogeography [3,4]. In addition, it is generally assumed that the isolations between biological refugees lead to the formation of new species or subspecies, especially those with a weak migratory capacity [5]. A recent study suggested that cold-tolerant trees in Europe had to keep a relatively stable population size in the distribution areas during the last glacial period [6]. In addition, some potential glacial refugia for forest trees in East Asia were identified based on maternally inherited chloroplast DNA (cpDNA) markers [7,8]. Additionally, the studies of the Quaternary glacial age’s influence on the genetic structure and geographical distribution of current biological populations are closely related to the origin, diffusion, and conservation of species diversity [9,10,11,12]. In conjunction with coalescent models of population genetic structure, these studies may improve our understanding of the factors that promote population divergence and ultimately form the regional patterns of biodiversity [13].
As one of the main distribution areas of endemic species in East Asia, ranging between the Qinling Mountains–Huai River line (at ca. 34° N) and the tropical south (≤22° N), subtropical China is characterized by a complex topography (warm-temperate evergreen forests interspersed with warm-temperate deciduous forests), and this area is particularly rich in ancient species lineages such as Abies, Cathaya, Davidia, Podocarpus, Quercus, Tsuga, etc. [14,15]. Compared to regions of similar latitude in Europe and North America, subtropical China in East Asia has a relatively mild monsoon climate and was relatively less affected by the Quaternary glacial-interglacial cycles because it has never been covered by ice sheets [16]. Therefore, these areas have great potential to become effective sanctuaries for plants during the ice age, and the relatively stable habitats in this area enable the persistence of endemic species [17].
However, compared with the numerous studies on European and North American plants, investigations on population dynamic history responding to climatic oscillations across subtropical China in East Asia are surprisingly limited. Despite the importance of this region, the global center of diversity, evolution, and speciation, most studies to date have been conducted on endangered species with a narrow range of distribution [18]. A previous phylogeographic study of Sapindaceae species using cpDNA markers detected significant phylogeographic structure and evidence of multiple glacial refugia across most of the current distribution areas in subtropical China [19]. A geographical study of Sargentodoxa cuneata (Oliv.) Rehd. et Wils found that this species has a strong range expansion signal in subtropical China over the Pleistocene period. Some other studies speculated that most of the temperate plants in China may conform to the expansion–contraction model to some extent [20]. Although the number of phylogeographic studies on plants in subtropical China has increased rapidly in recent years (e.g., Cerasus serrulata [21], Quercus variabilis [22], Fagus engleriana [23]). However, there are still some longevous tree species for which the population dynamic history needs to be supplemented in the study of complex systematic geographical structure.
In the current study, we focused on Magnolia sprengeri Pamp., a long-lived medium-sized deciduous tree belonging to the family Magnoliaceae [24]. This species is endemic to China, currently distributed in subtropical China in East Asia, growing in evergreen broad-leaved forests or shrubs, and karst or sand-shale mountains at altitudes between 1300 and 2400 m [25,26]. In addition, there are disconnected populations of this species distributed from the East Yungui Plateau to the Qinling-Daba Mountains and the Dabie Mountains to the east of the North China Plain. With the advantages of rapid growth, strong adaptability and long life, as well as the gorgeous appearance, colorful, fragrant, and delicate texture [27], M. sprengeri has become an important tree species for urban greening [28]. Meanwhile, the buds and bark of M. sprengeri are often used as traditional Chinese medicine [29]. In addition, it has been listed as a vulnerable endangered species in the Red List due to humans’ overexploitation [30]. As a rare and endangered species sensitive to geological and climate changes, M. sprengeri provides a good model for the study in plants’ respondence to climate and environmental changes in subtropical China in East Asia.
Recently, some chloroplast genes were widely used to detect the population history of Magnoliaceae species [31,32]. For instance, Massoni et al. reconstructed the phylogenetic relationships of Magnoliaceae with 12 molecular markers including matK and rbcL from plastid genome [33]. Some other studies used the chloroplast intergenic regions (e.g., psbA-trnH) to determine the evolutionary relationships of the family Magnoliaceae [34,35]. They found that these chloroplast DNA fragments (i.e., matK, trnH-psbA and rbcL) can be easily obtained by PCR amplification and sequencing for Magnoliaceae species [34,35]. In this study, we investigated the demographic history and the species distribution fluctuations of M. sprengeri using cpDNA sequence data (matK, trnH-psbA and rbcL) and ecological niche modeling. The main objectives of this study are: (I) to examine the population dynamic history of M. sprengeri; (II) to determine the species distribution changes of M. sprengeri during the different historical periods based on the MaxEnt ecological analyses; and (III) to provide a scientific basis for the protection and management of the long-lived endangered species.

2. Materials and Methods

2.1. Field Investigation and Samples Collection

During the field investigations, we sampled 36 natural populations of M. sprengeri, which covered the whole geographic distributions in subtropical regions of China in East Asia. However, due to the climatic fluctuations and recent human activities, the samples for each population were less than merely 87 M. sprengeri individuals were collected from the eight provinces (Chongqing, Gansu, Guizhou, Hubei, Hunan, Shaanxi, Sichuan, Zhejiang) in China. Healthy and tender leaves were collected in the field and immediately put into a sealed bag containing silica gel for drying. At least 100 m interval between individuals was taken during sampling, and the altitude, longitude, and latitude information of each sampling site was recorded in detail. The vouchers of all materials and documents were deposited in the College of Life Sciences, Northwest University, Xi’an, China (Table S1).

2.2. DNA Extraction and Sequencing

Total DNA was extracted using a modified CTAB method [36]. The polymerase chain reaction (PCR) was used to amplify three maternally inherited cpDNA sequences (matK, trnH-psbA and rbcL). The amplification reaction was performed in a 20 μL system comprising 11 μL of 2 × Taq PCR MasterMix (Takara Beijing, Beijing, China), 1 μL of each primer (Sangon Biotech, Shanghai, China), 10–50 ng template DNA, and 7 μL ddH2O. All amplifications were conducted in a PTC-200 thermal cycler (MJ Research, Waltham, MA, USA) using the PCR settings as follows: (1) initial denaturation step at 95 °C for 5 min, (2) 30 cycles of denaturation at 95 °C for 1 min, (3) annealing at 50–58 °C (matK, 50 °C; trnH-psbA, 58 °C; rbcL, 55 °C) for 45 sec, and (4) final elongation at 72 °C for 10 min. The PCR products were checked using the agarose gel electrophoresis method and the subsequent sequencing reactions were conducted on the ABI 3730xl genetic analyzer (PerkinElmer, Waltham, MA, USA). Primers used for DNA barcoding studies [37,38,39,40] were shown in the supplementary file (Table S2).

2.3. Genetic Diversity and Population Structure Analyses

All DNA sequences were aligned using CLUSTAL X [41] and edited manually in BioEdit v7.2.5 [42]. We concatenated the three cpDNA alignments for further genetic analyses according to their maternally inherited characteristics. DnaSP v6.12.03 [43] was used to calculate basically population genetic parameters, including the number of segregating sites (S), haplotype diversity (Hd), the number of haplotypes (N), and nucleotide diversity (π). Neutrality test statistics of Tajima’s D were performed on all samples using DnaSP to assess whether the combined sequences evolved neutrally. We also used mismatch distribution analysis to determine the demographic dynamic changes. Generally, the structures of populations that have experienced demographic expansion are unimodal, while those kept at a stable size exhibit multimodal mismatch distribution structures. In addition, a median-joining network was constructed in NETWORK 10.2.0.0 [44] to infer the relationships of haplotypes. The geographical distributions of cpDNA haplotypes for M. sprengeri were visualized using ArcGIS v10.2 (ESRI, Redlands, CA, USA) in accordance with the methods of Li et al. [45].
A molecular variance analysis (AMOVA) with 1000 permutations was conducted using Arlequin v 3.11 [46]. The Mantel test with 999 permutations was conducted using GenALEx 6.502 [47] to identify whether there is a significant association between genetic distance [48] and geographic distance. Using the program PermutCpSSR_1.2.1 [49], the population differentiation was measured by GST (gene differentiation coefficient) and NST (genetic variation coefficient influenced by both the haplotype frequencies and genetic distances between haplotypes), with respect to the haplotypes, and compared by a test with 1000 permutations.
Phylogenetic analyses of the identified haplotypes were performed to detect the evolutionary relationships of chloroplast haplotypes. Maximum-likelihood (ML) tree generation and bootstrap analyses were performed using the program RAxML [50]. We selected the best-scoring ML tree using a generalized time reversible plus gamma model of sequence evolution with 1000 bootstrap replicates. Sequences of the same cpDNA region of Magnolia liliiflora Desr. were used as the outgroup according to previous phylogenetic results [51]. To obtain the Bayesian inference cladogram, we constructed the phylogenetic tree of haplotypes in MRBayes 3.2.2 [52] based on GTR+I model and retained every 300 generations from 3,000,000 random tree rotations. The results were visualized using Figtree v.1.3.1 [53].

2.4. Species Distribution Modeling

Data on bioclimatic environmental variables were downloaded from the WorldClim Website (http://www.worldclim.org/ accessed on 5 January 2021). The climatic data for each period included 19 bioclimatic variables (bio1–19) with a resolution of 2.5 arc-minute. The future climate data used in this study (the year 2050 and 2070) are based on the CCSM4 model with strong simulation capability in China [54], which includes four emission scenarios of RCP (Representative Concentration Pathways) 2.6, RCP4.5, RCP6.0 and RCP8.5 in the fifth IPCC (Intergovernmental Panel on Climate Change) emission report [55].
By searching China National Specimen Resource Platform (NSII, http://www.nsii.org.cn// accessed on 5 January 2021) and relevant literature to determine the geographic data of M. sprengeri, combing with the field investigation records, a total of 98 record points of M. sprengeri populations were obtained after screening the samples for authenticity and excluding over-dense loci.
The whole 19 bioclimatic variables were used to simulate the climate factors with a large contribution. These operations relied on MaxEnt_version 3.4.1 software [56]. Modeling of the present distribution of M. sprengeri was undertaken using the maximum entropy algorithm, with default parameter settings (maximum number of background points 10,000) [57]. Measurable environmental factors which affect M. sprengeri’s distribution were calculated by creating response curve and doing jackknife, following the methodology of Cao et al. [58]. Statistical Package for Social Sciences, version 24 (IBM Corp, Armonk, NY, USA) was used for correlation analysis of environmental variable information. Subsequently, environment variables whose correlation is greater than 0.8 and less than −0.8 were removed in order to avoid the over-fitting phenomenon caused by the high correlation of environment variables. Combined with the variables whose correlation values are much larger than the mean value, the following eight variables (bio2, 3, 4, 9, 10, 11, 12, 15) are finally obtained.
In a previous study, all of the ecological niche models simulated by MaxEnt had high predictive capacities. In addition, these models were generally good predictors of species’ occurrences according to the area under the receiver-operating characteristic (ROC) curve. The area under the ROC curve (AUC) for a random classifier is 0.5, while that for a perfect classifier is 1 [59]. Through Conversion Tools-ASCII to Raster in ArcGIS, the simulation results obtained after MaxEnt running optimized parameters were converted into Raster data and the suitable area was divided. MaxEnt was used to predict the distribution of M. sprengeri in the contemporary, Last Glacial Maximum (LGM) and Last Interglacial Age (LIG).

3. Results

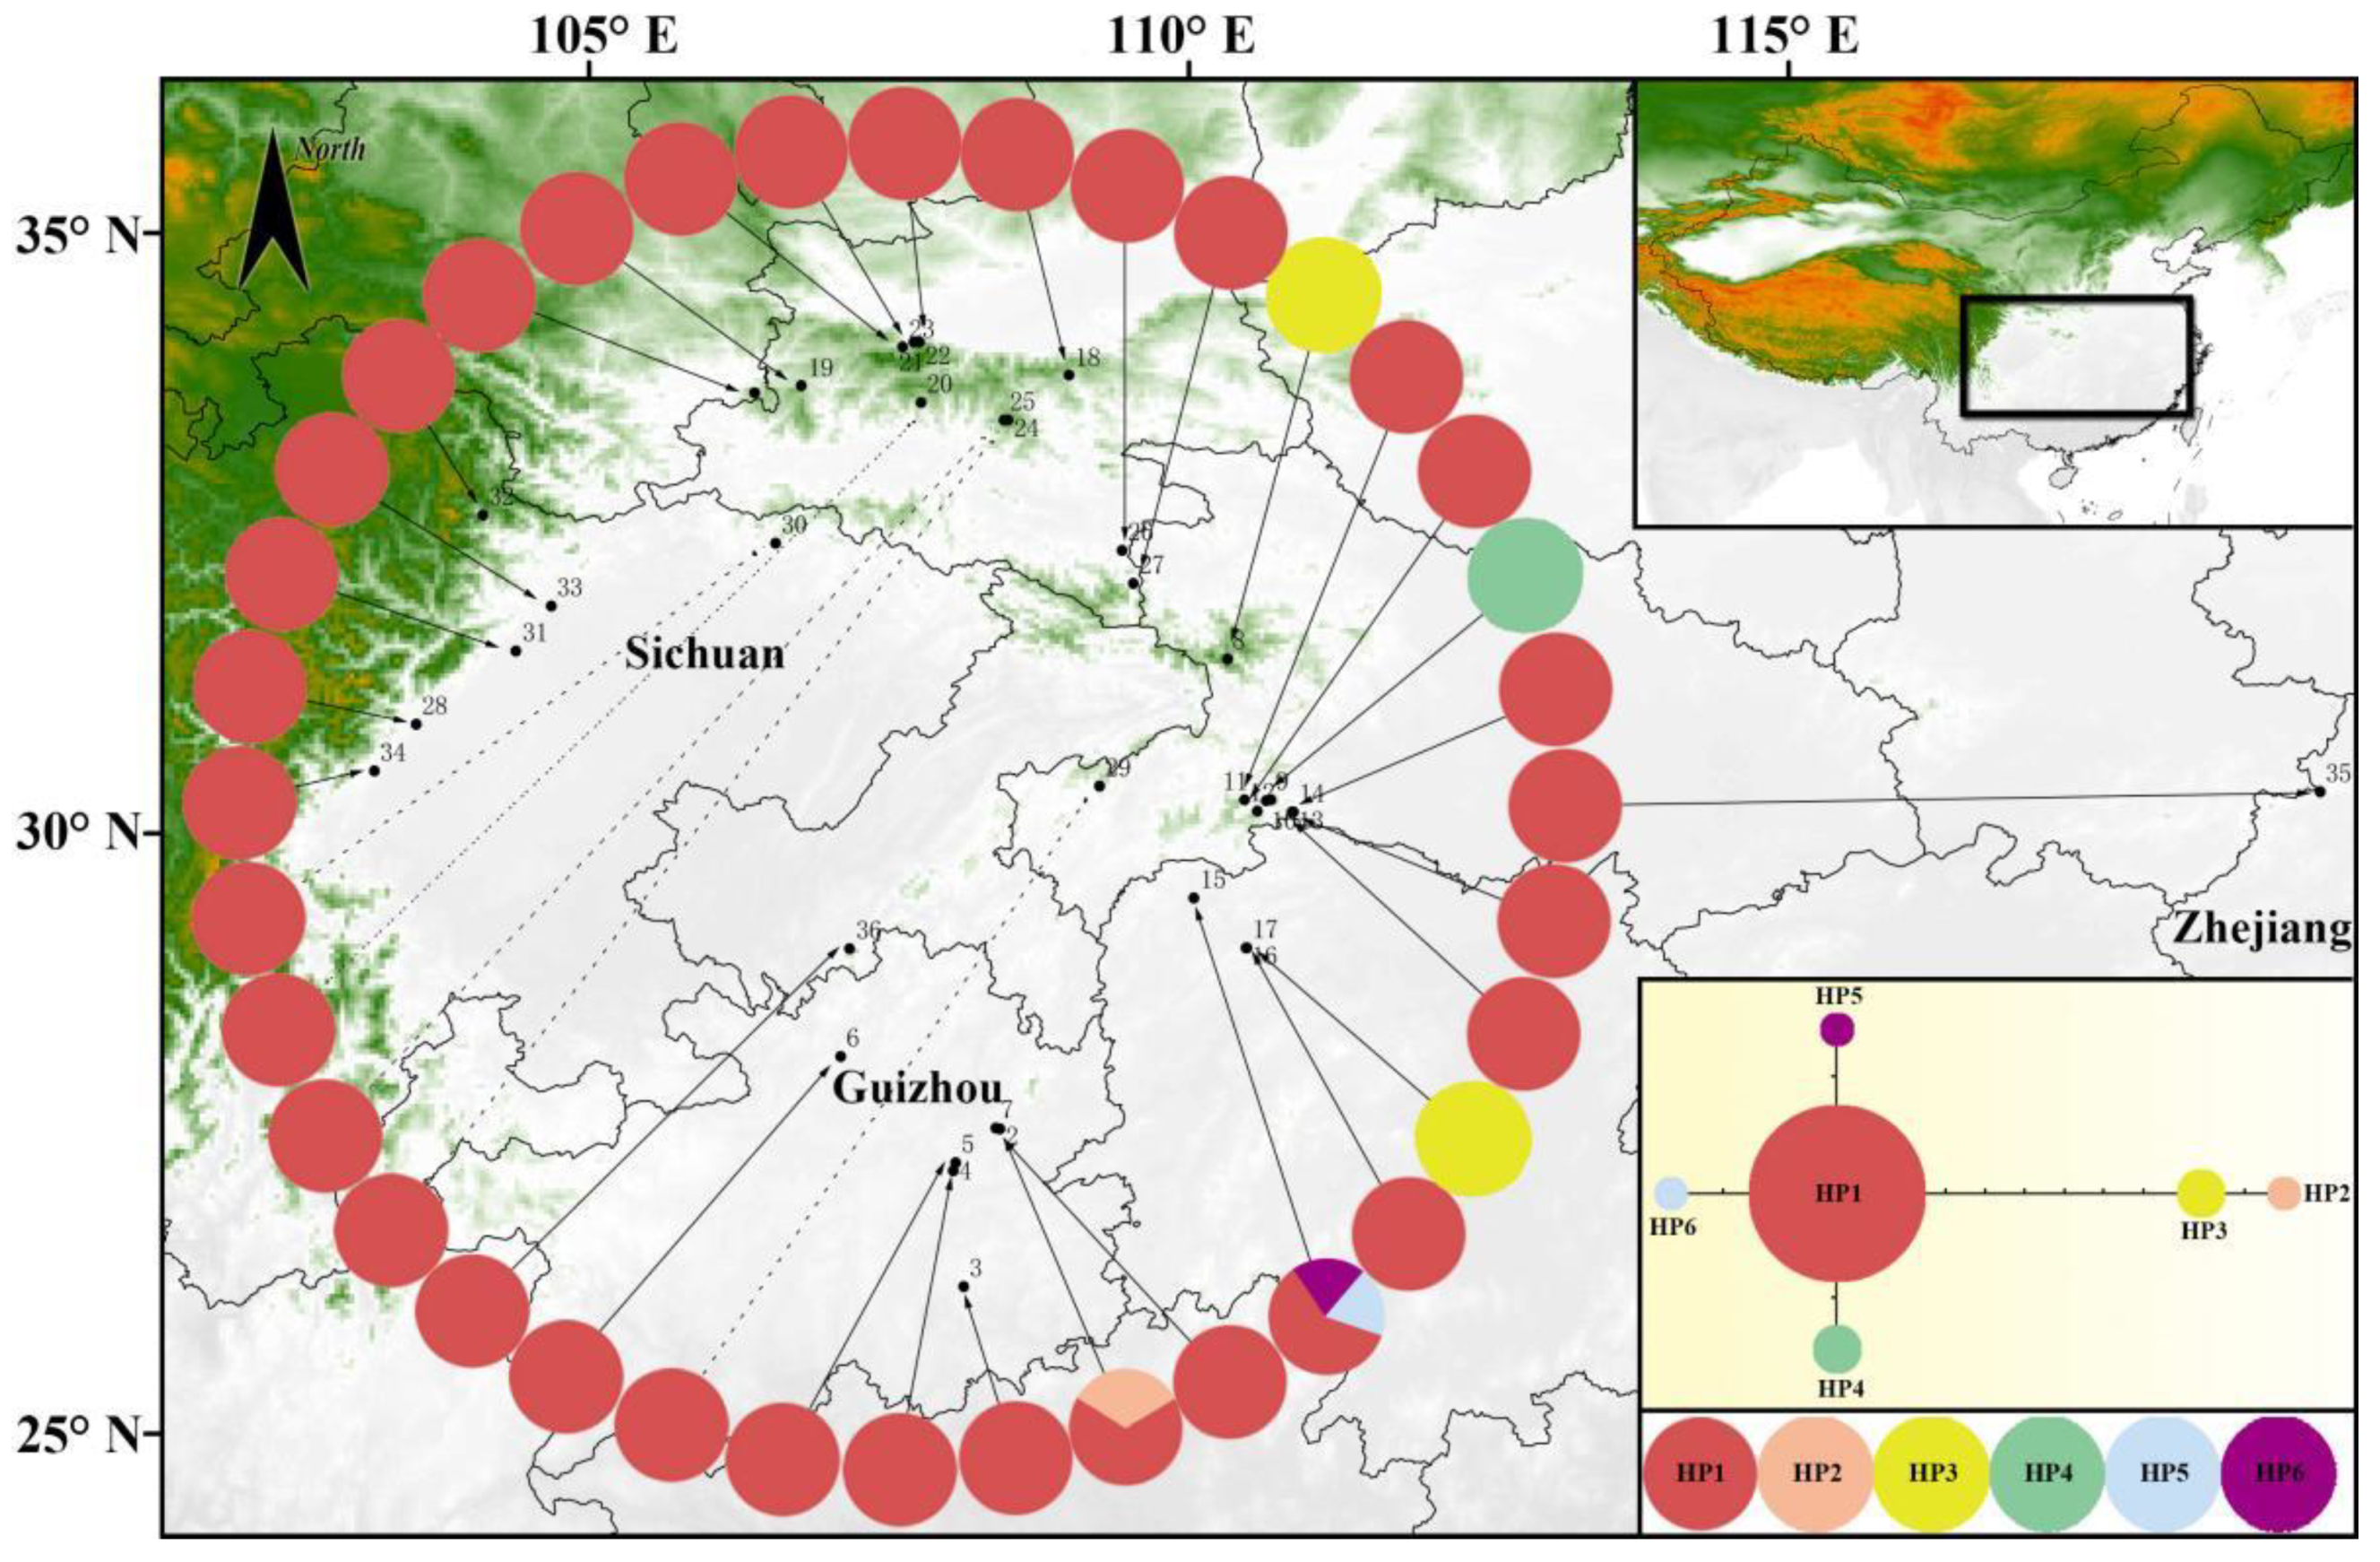
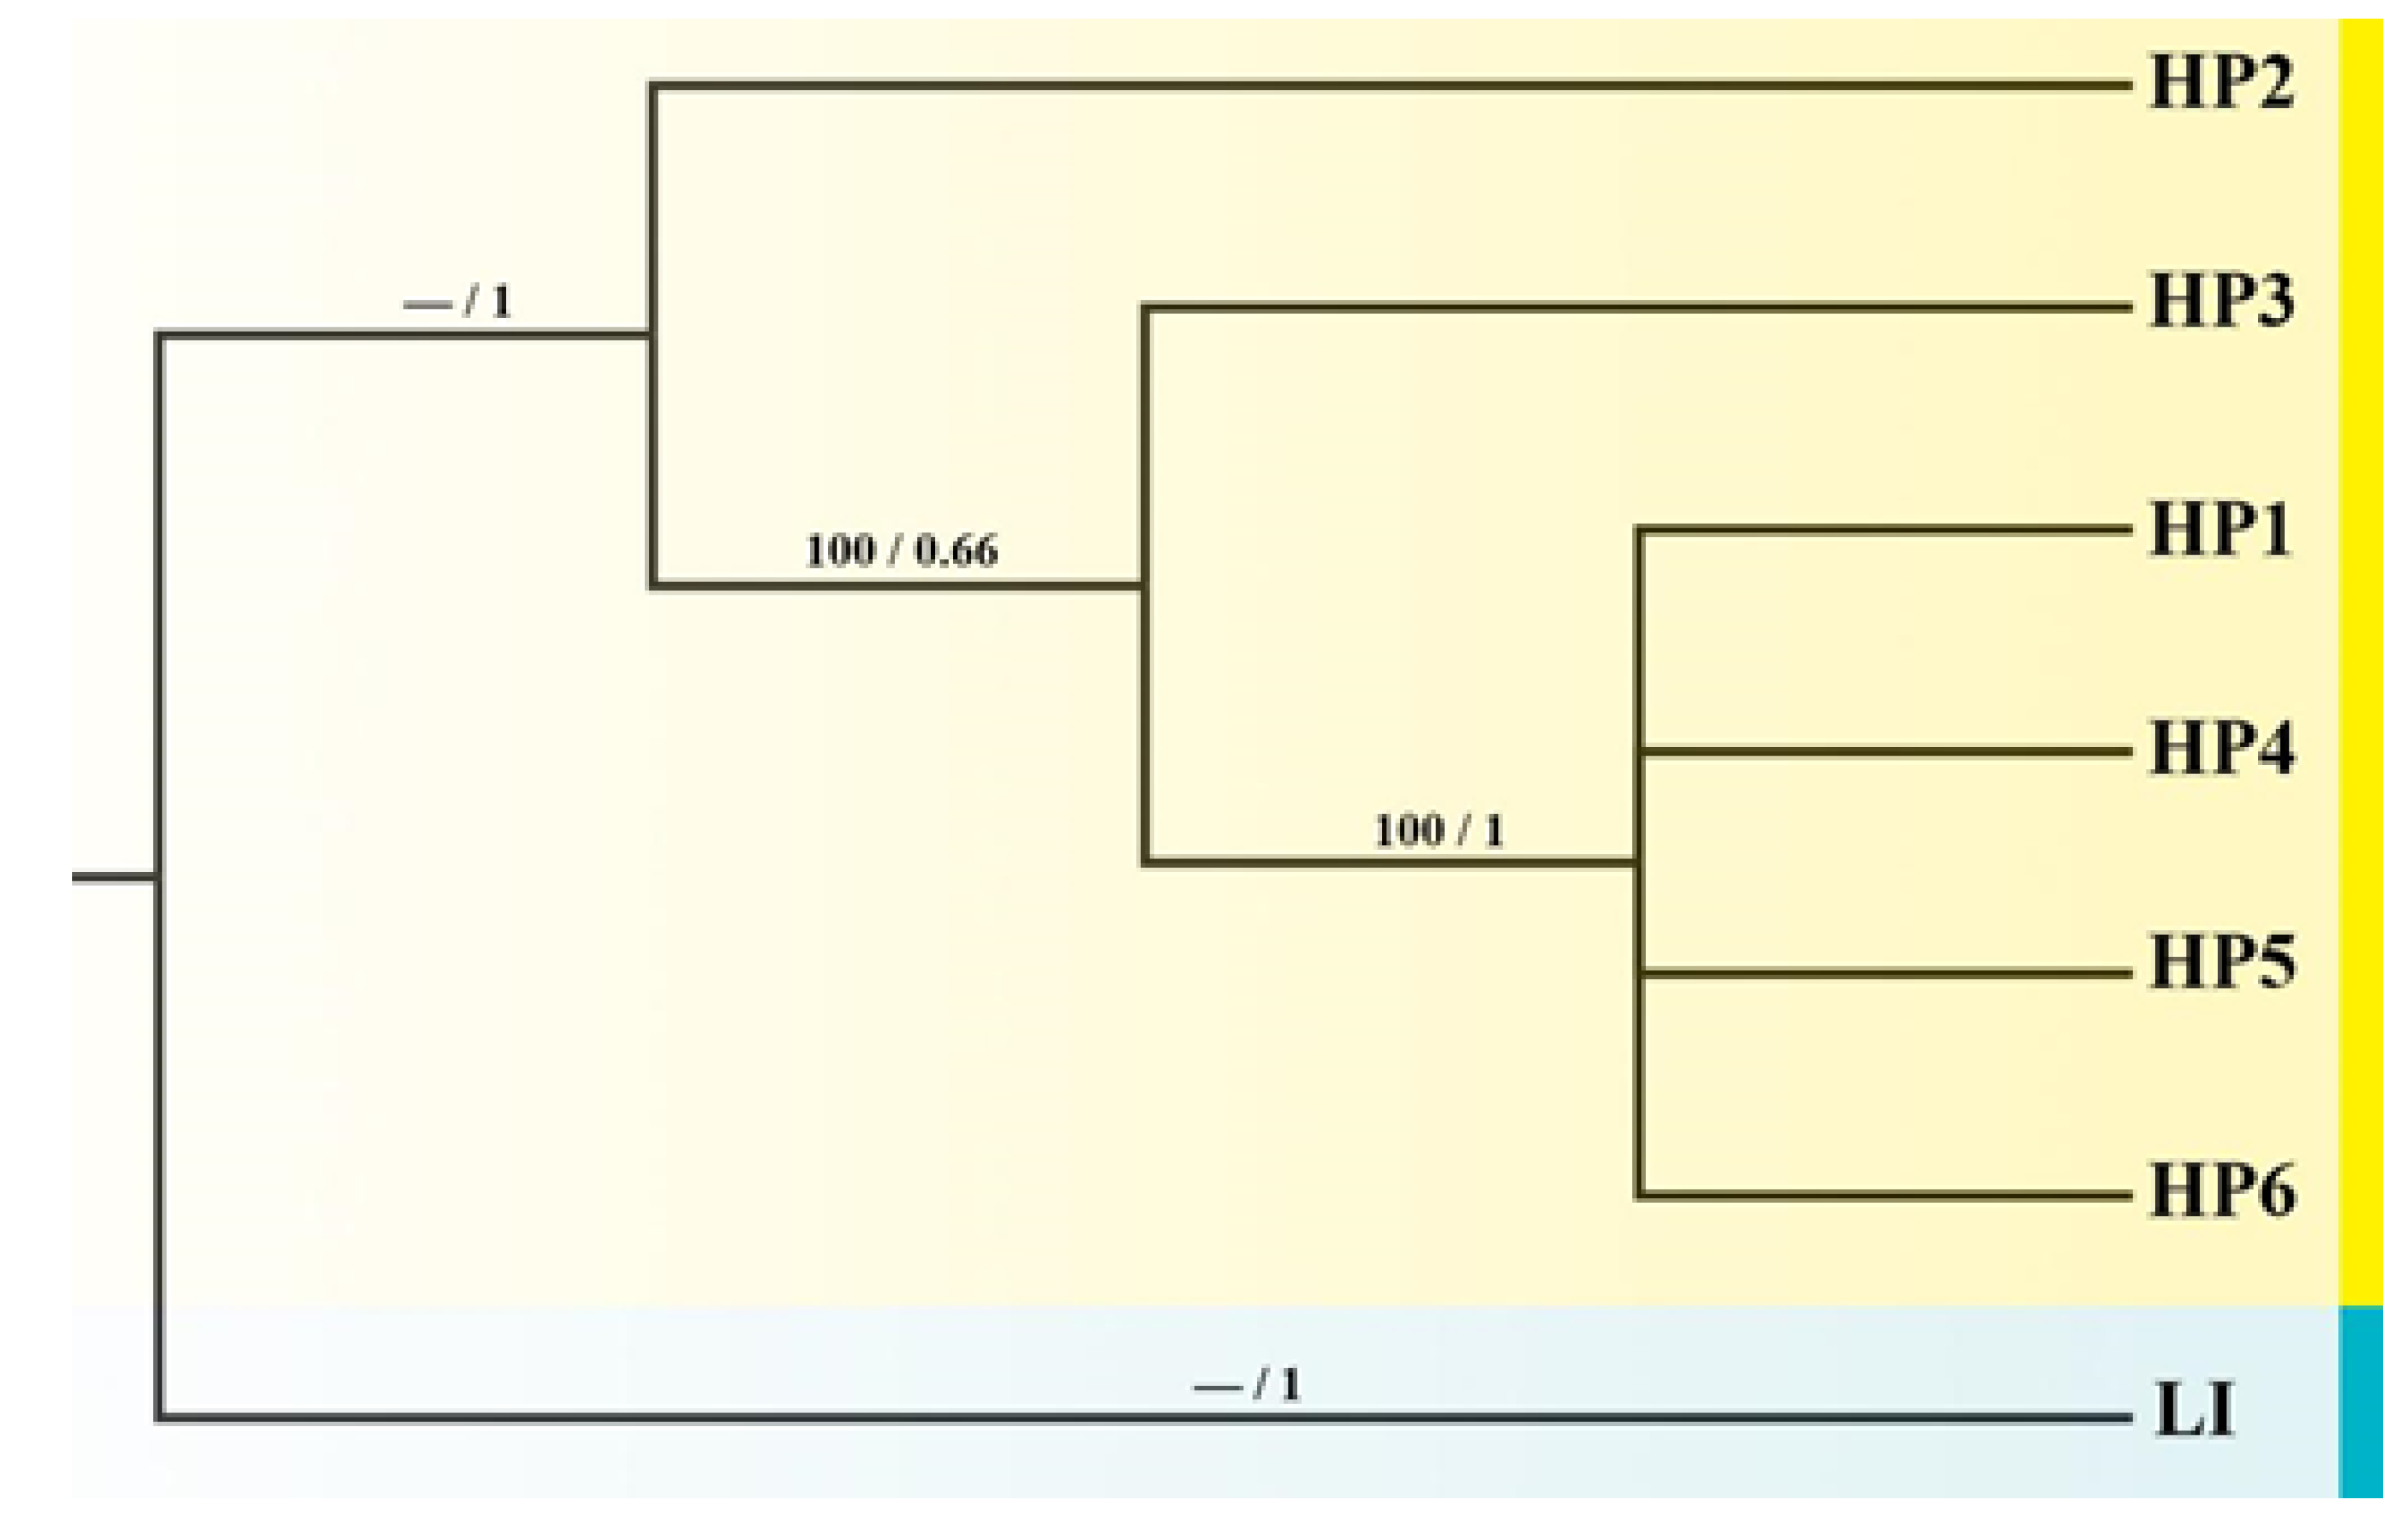
3.1. The Distribution and Relationships of Chloroplast DNA (cpDNA) Haplotypes

In this study, three cpDNAs fragments (matK, trnH-psbA and rbcL) from 87 M. sprengeri individuals (belonging to 36 populations) were aligned (Figure 1). The results of three DNA fragments’ primers electrophoretic maps showed that the primers could amplify the target bands in M. sprengeri (Figures S1–S3). The total alignment length was 1650 bp, and 10 nucleotide substitutions revealed six haplotypes (HP1–HP6) (Table S3, Figure S4). For the whole population, a low level of haplotype diversity (Hd = 0.196) was detected. Almost all populations contain only one haplotype while the populations 7 and 15 had multiple haplotypes. Haplotype HP1 was the most common, found in 34 populations, while endemic haplotypes HP3 and HP4 were unique haplotypes and only distributed in Hubei province, central China. Haplotype HP1 may be an ancestral chloroplast haplotype, giving rise to other haplotypes due to its location in the central position of network analyses. Haplotypes HP2 and HP3 are congregated on a stem in the NETWORK result. Interestingly, three populations 8, 9, and 17 possess the unique cpDNA haplotypes, which are distributed in the boundary between southern Hubei and Hunan in central China.
The phylogenetic tree was constructed based on ML (maximum likelihood) and Bayesian analysis for the three concatenated cpDNA fragments of M. sprengeri, setting Magnolia liliiflora Desr. (LI) as the outgroup, and the bootstrap values were over 50 at all nodes (Figure 2). The tree produced a haplotype phylogenetic relationship similar to the ones produced by the network analysis. Haplotypes HP1, HP4, HP5, and HP6 were clustered into a large genetic lineage with high support value. They had a rather distant relationship with haplotypes HP2 and HP3.

3.2. Genetic Differentiation and Population Structure

According to genetic variation analysis, we found low levels of haplotype diversity (Hd = 0.196) with the average within-population diversity (HS = 0.068) and the total genetic diversity (HT = 0.169). Additionally, a significantly higher GST than NST (NST = 0.268, GST = 0.595, p < 0.05) was observed, revealing that M. sprengeri did not have a pedigree geographic structure (Table 1).
Based on cpDNA variation, mismatch analyses showed the multimodel mismatch distribution, which revealed that M. sprengeri maintained relatively stable population sizes throughout the last glacial period (Figure 3).
Arlequin software was used to analyze the molecular variation (AMOVA) of cpDNA sequences (Table 2). The results showed that genetic variation mainly existed within populations, accounting for 72.39%. F-statistics showed that there was obvious genetic differentiation among populations. Correlation between genetic and geographic distances was detected by the Mantel test (r = 0.247, p = 0.03, 999 permutations), indicating that geographical factors had little effect on the genetic differentiation of M. sprengeri.

3.3. Species Distribution Simulation Results

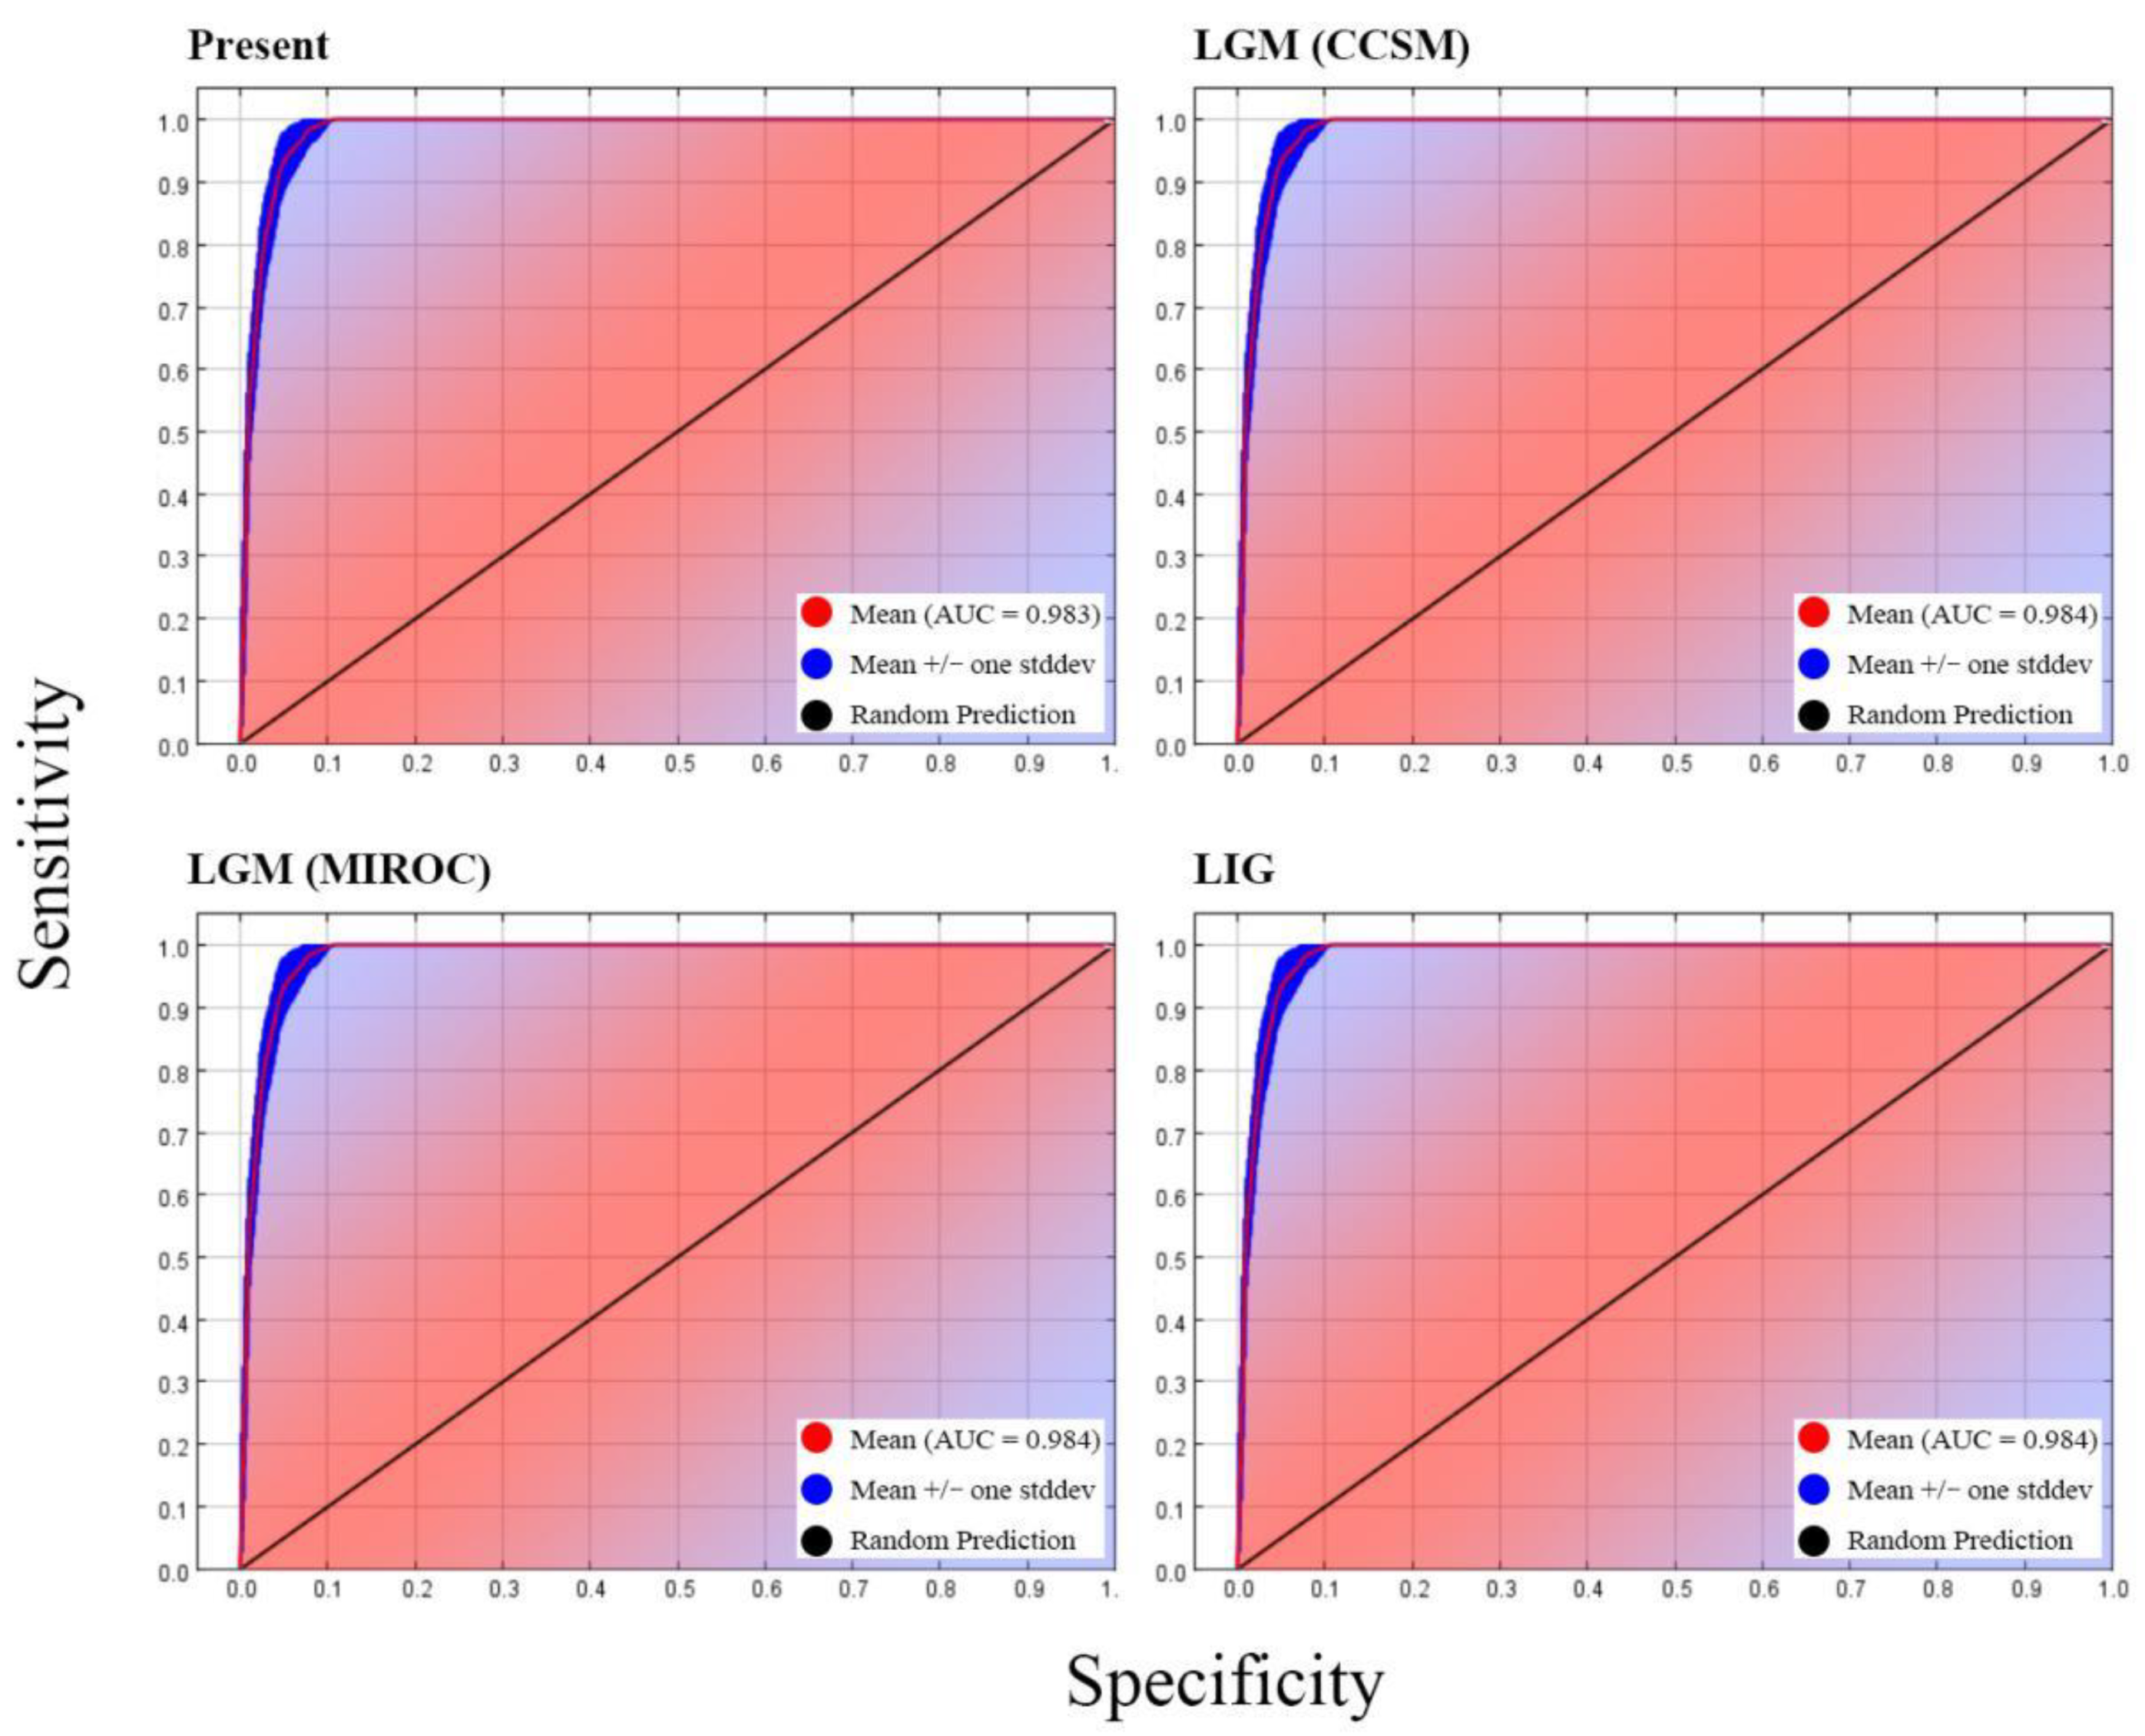
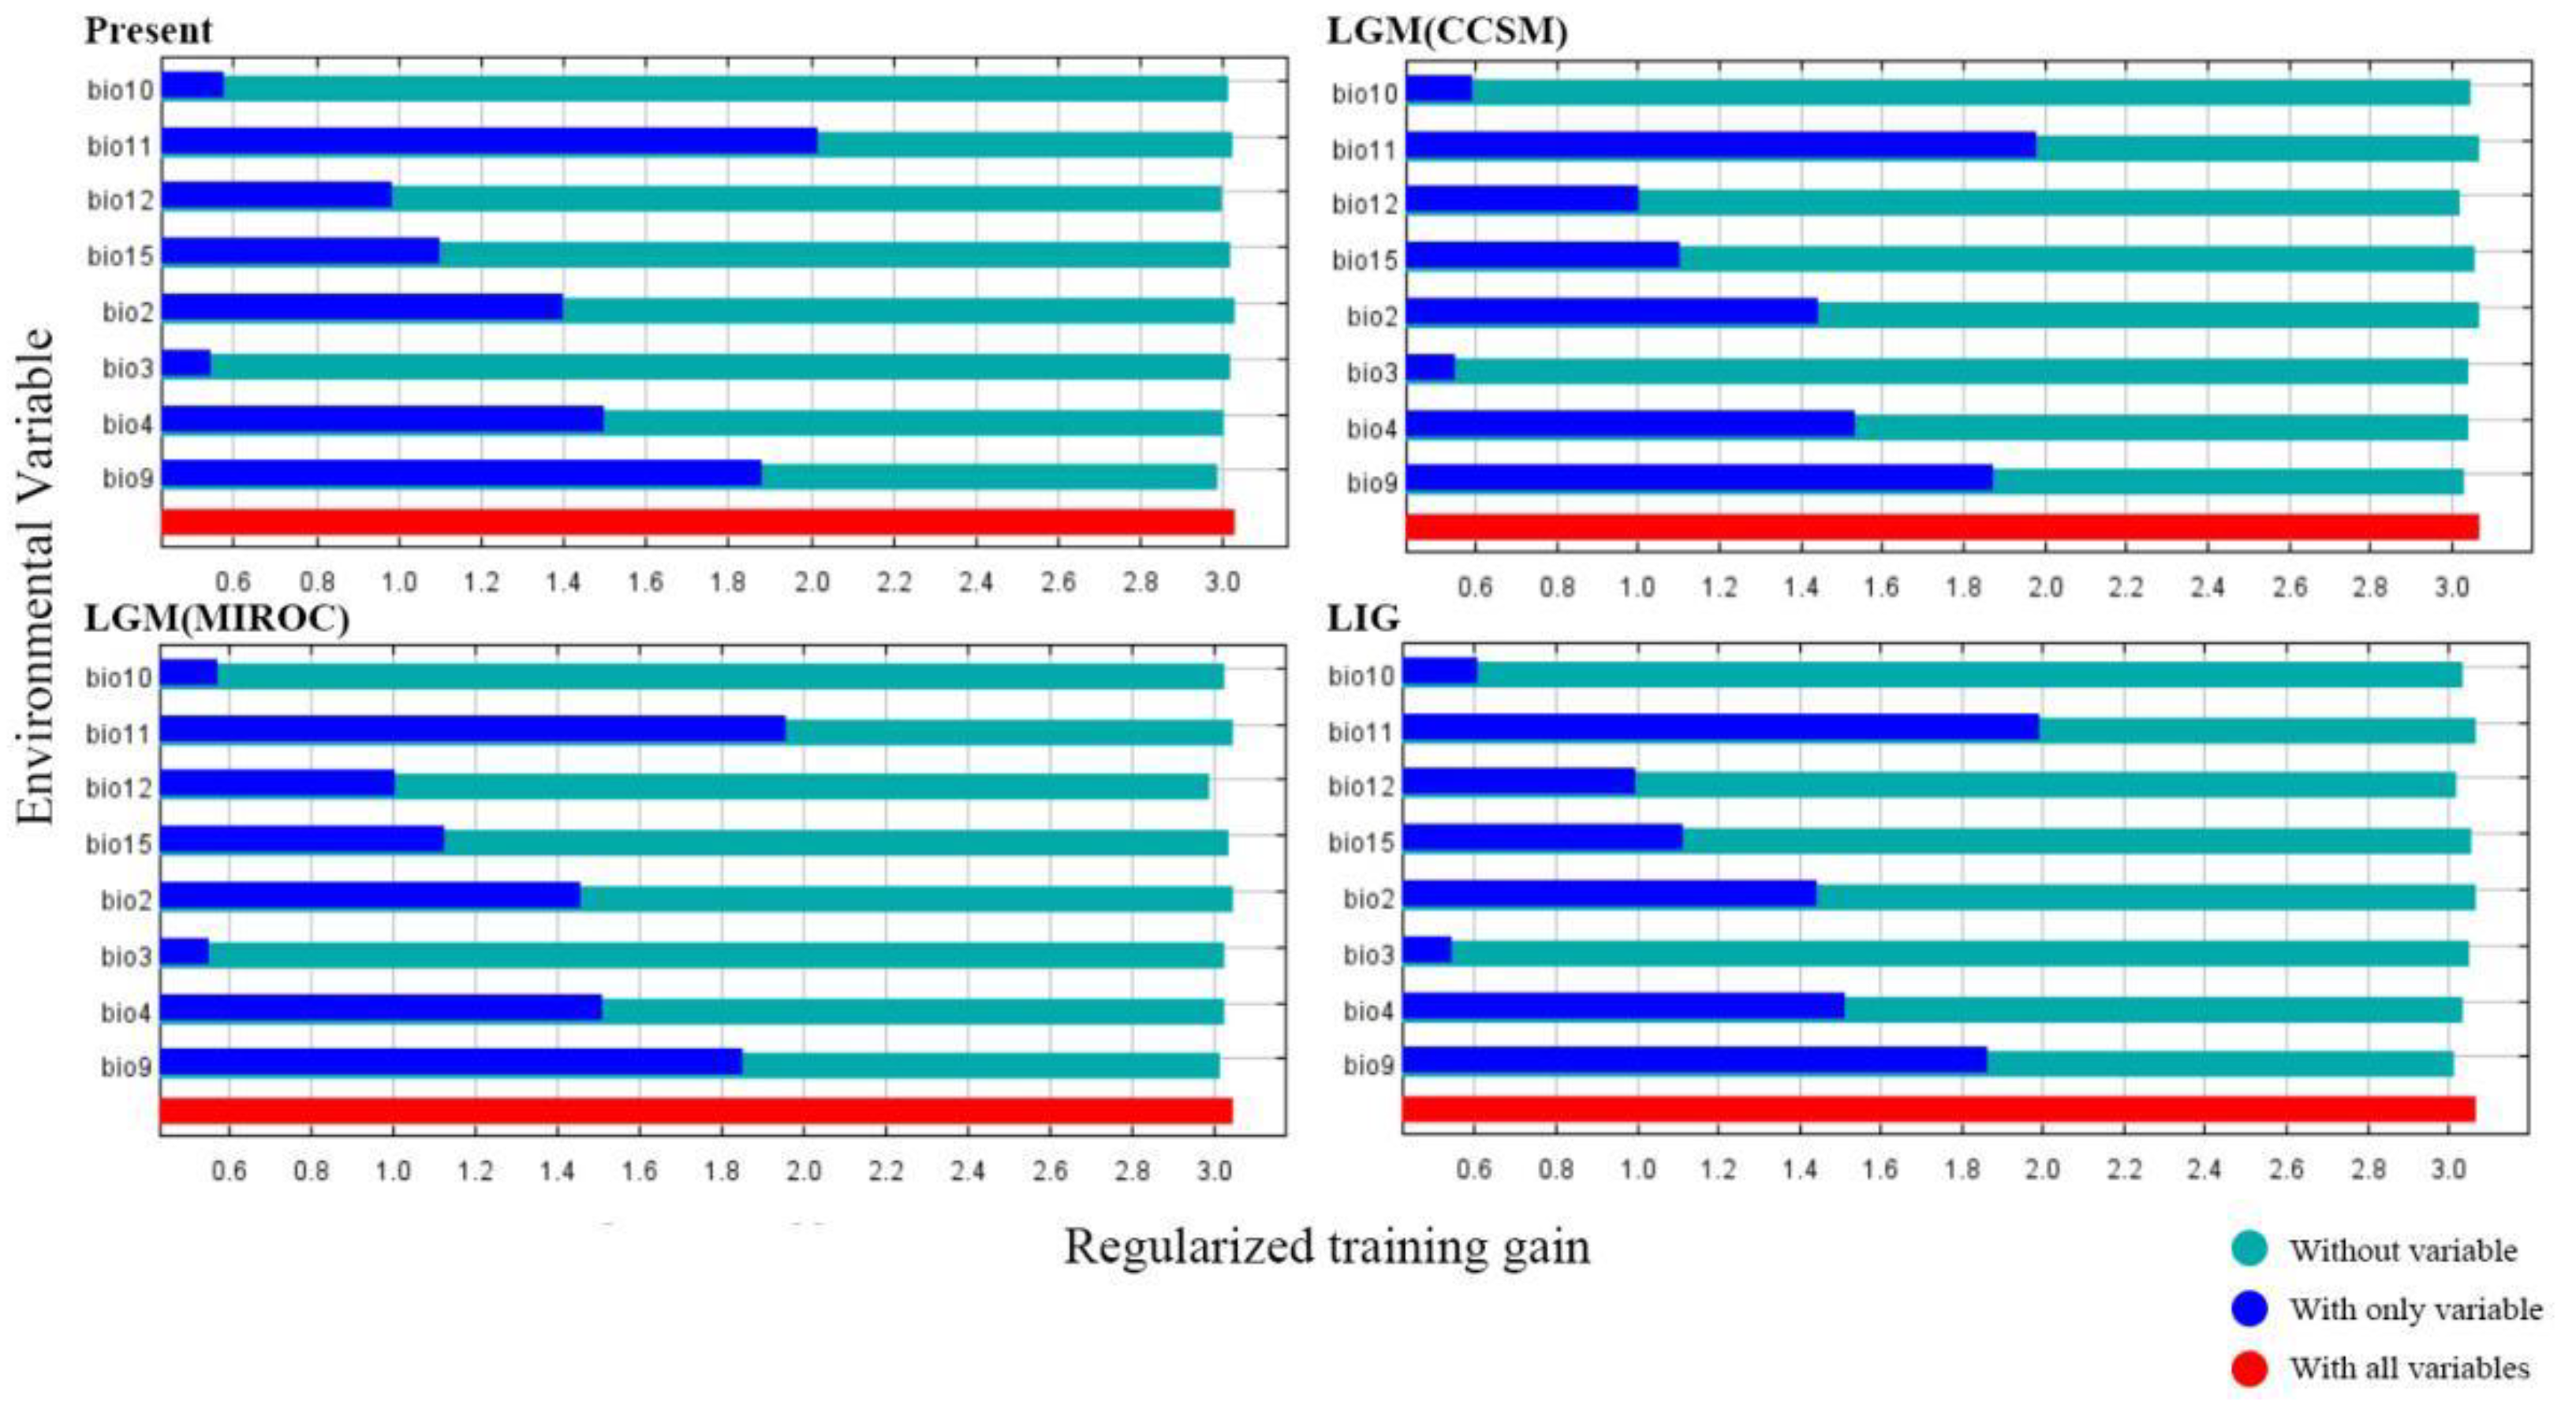
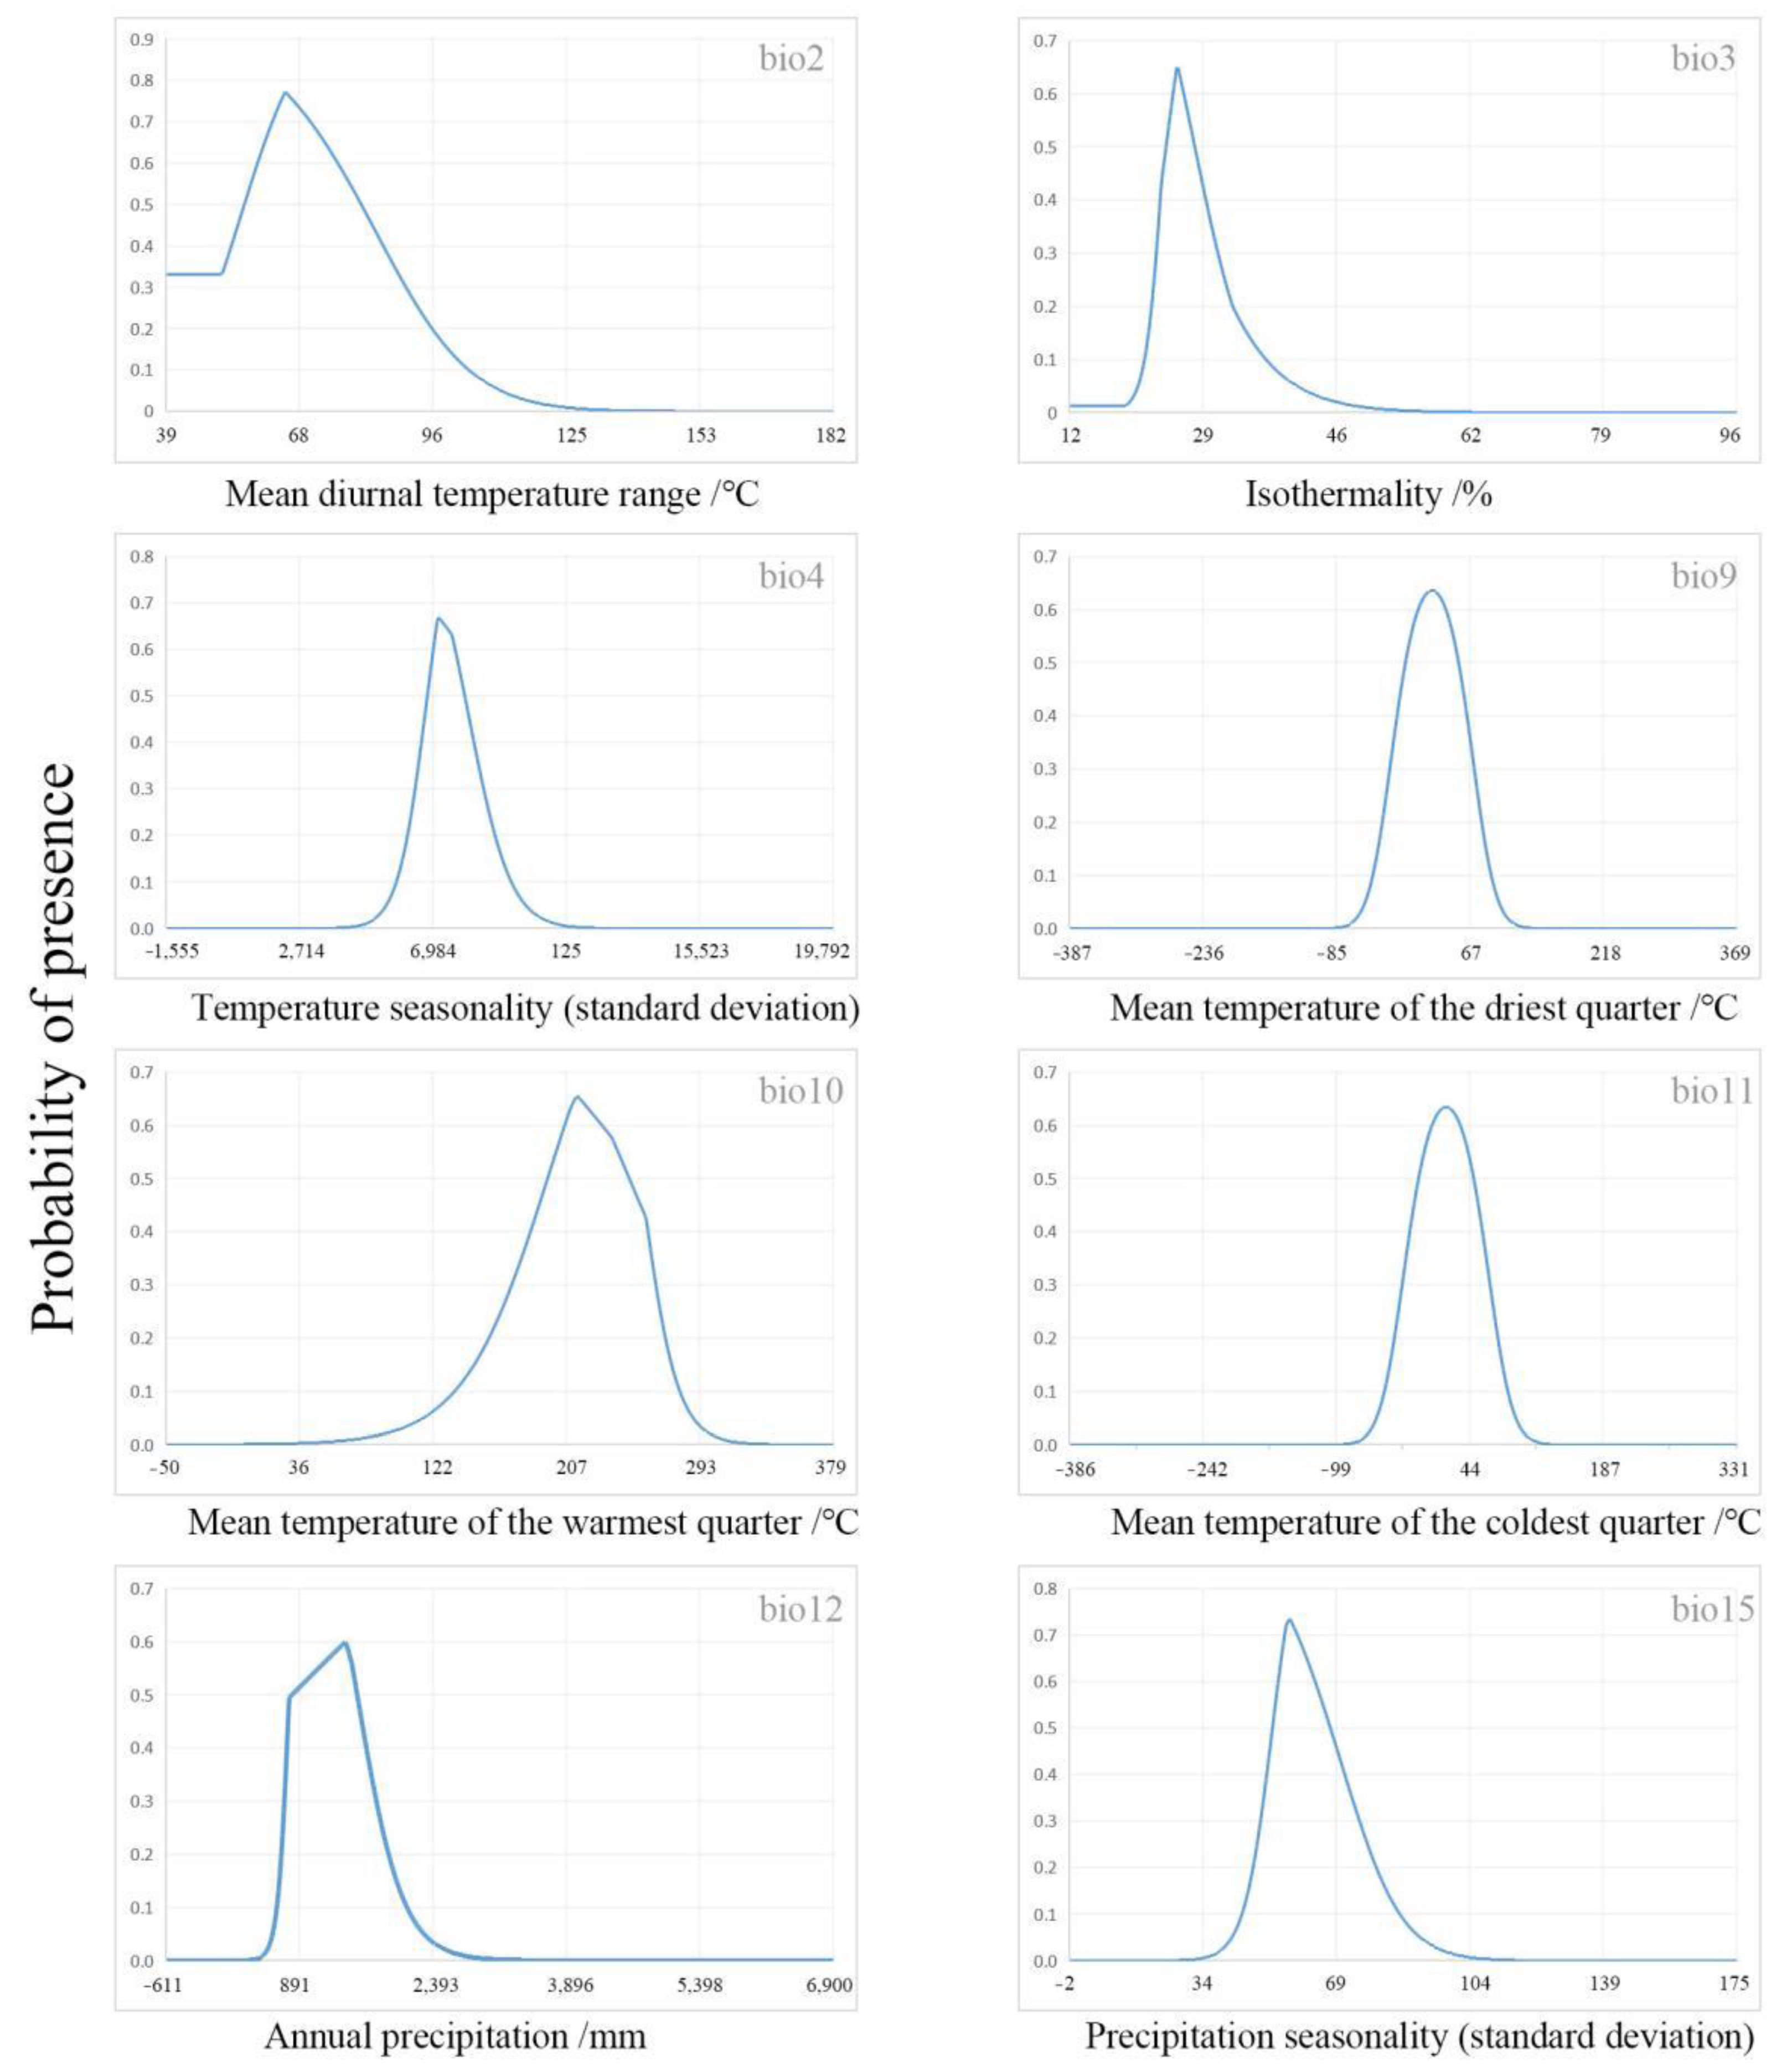
3.3.1. Model Performance and Contributions of Variables

All of the four ecological niche models simulated by MaxEnt had high predictive capacities (AUC > 0.95) (Figure 4), and the projected present distribution is consistent with collection records. Some of the changing trends of suitable distributions of M. sprengeri obtained by MIROC (Model for Interdisciplinary Research on Climate) are similar to those obtained by CCSM (Community Climate System Model).
These eight variables, bio2 (mean diurnal temperature range), 3 (isothermality), 4 (temperature seasonality), 9 (mean temperature of the driest quarter), 10 (mean temperature of the warmest quarter), 11 (mean temperature of the coldest quarter), 12 (annual precipitation), and 15 (precipitation seasonality) showed a higher gain compared to others (Table 3). The contribution rate and importance of environmental variables to the distribution of M. sprengeri in different periods are shown in Table 4. For every simulated period, the top two environmental factors are bio2 (mean diurnal temperature range) and bio9 (mean temperature of the driest quarter).
The results of the jackknife test of variables’ contribution are shown in Figure 5. Bio9 (mean temperature of the driest quarter) and bio11 (mean temperature of the coldest quarter) provided very high gains (>1.8) when used independently, indicating that Bio9 and bio11 contained more useful information by themselves than the other variables did. However, bio2, bio4, bio12, and bio15 had moderate gain when used independently. Other variables, including bio3 and bio10, had low gains when used in isolation; they did not contain much information by themselves.
The relationship between the existence probability of M. sprengeri and environmental factors was investigated according to the response curve of environmental factor variables (Figure 6). When the existence probability of M. sprengeri is greater than 0.5, the corresponding environmental factor value is beneficial to the growth of M. sprengeri.

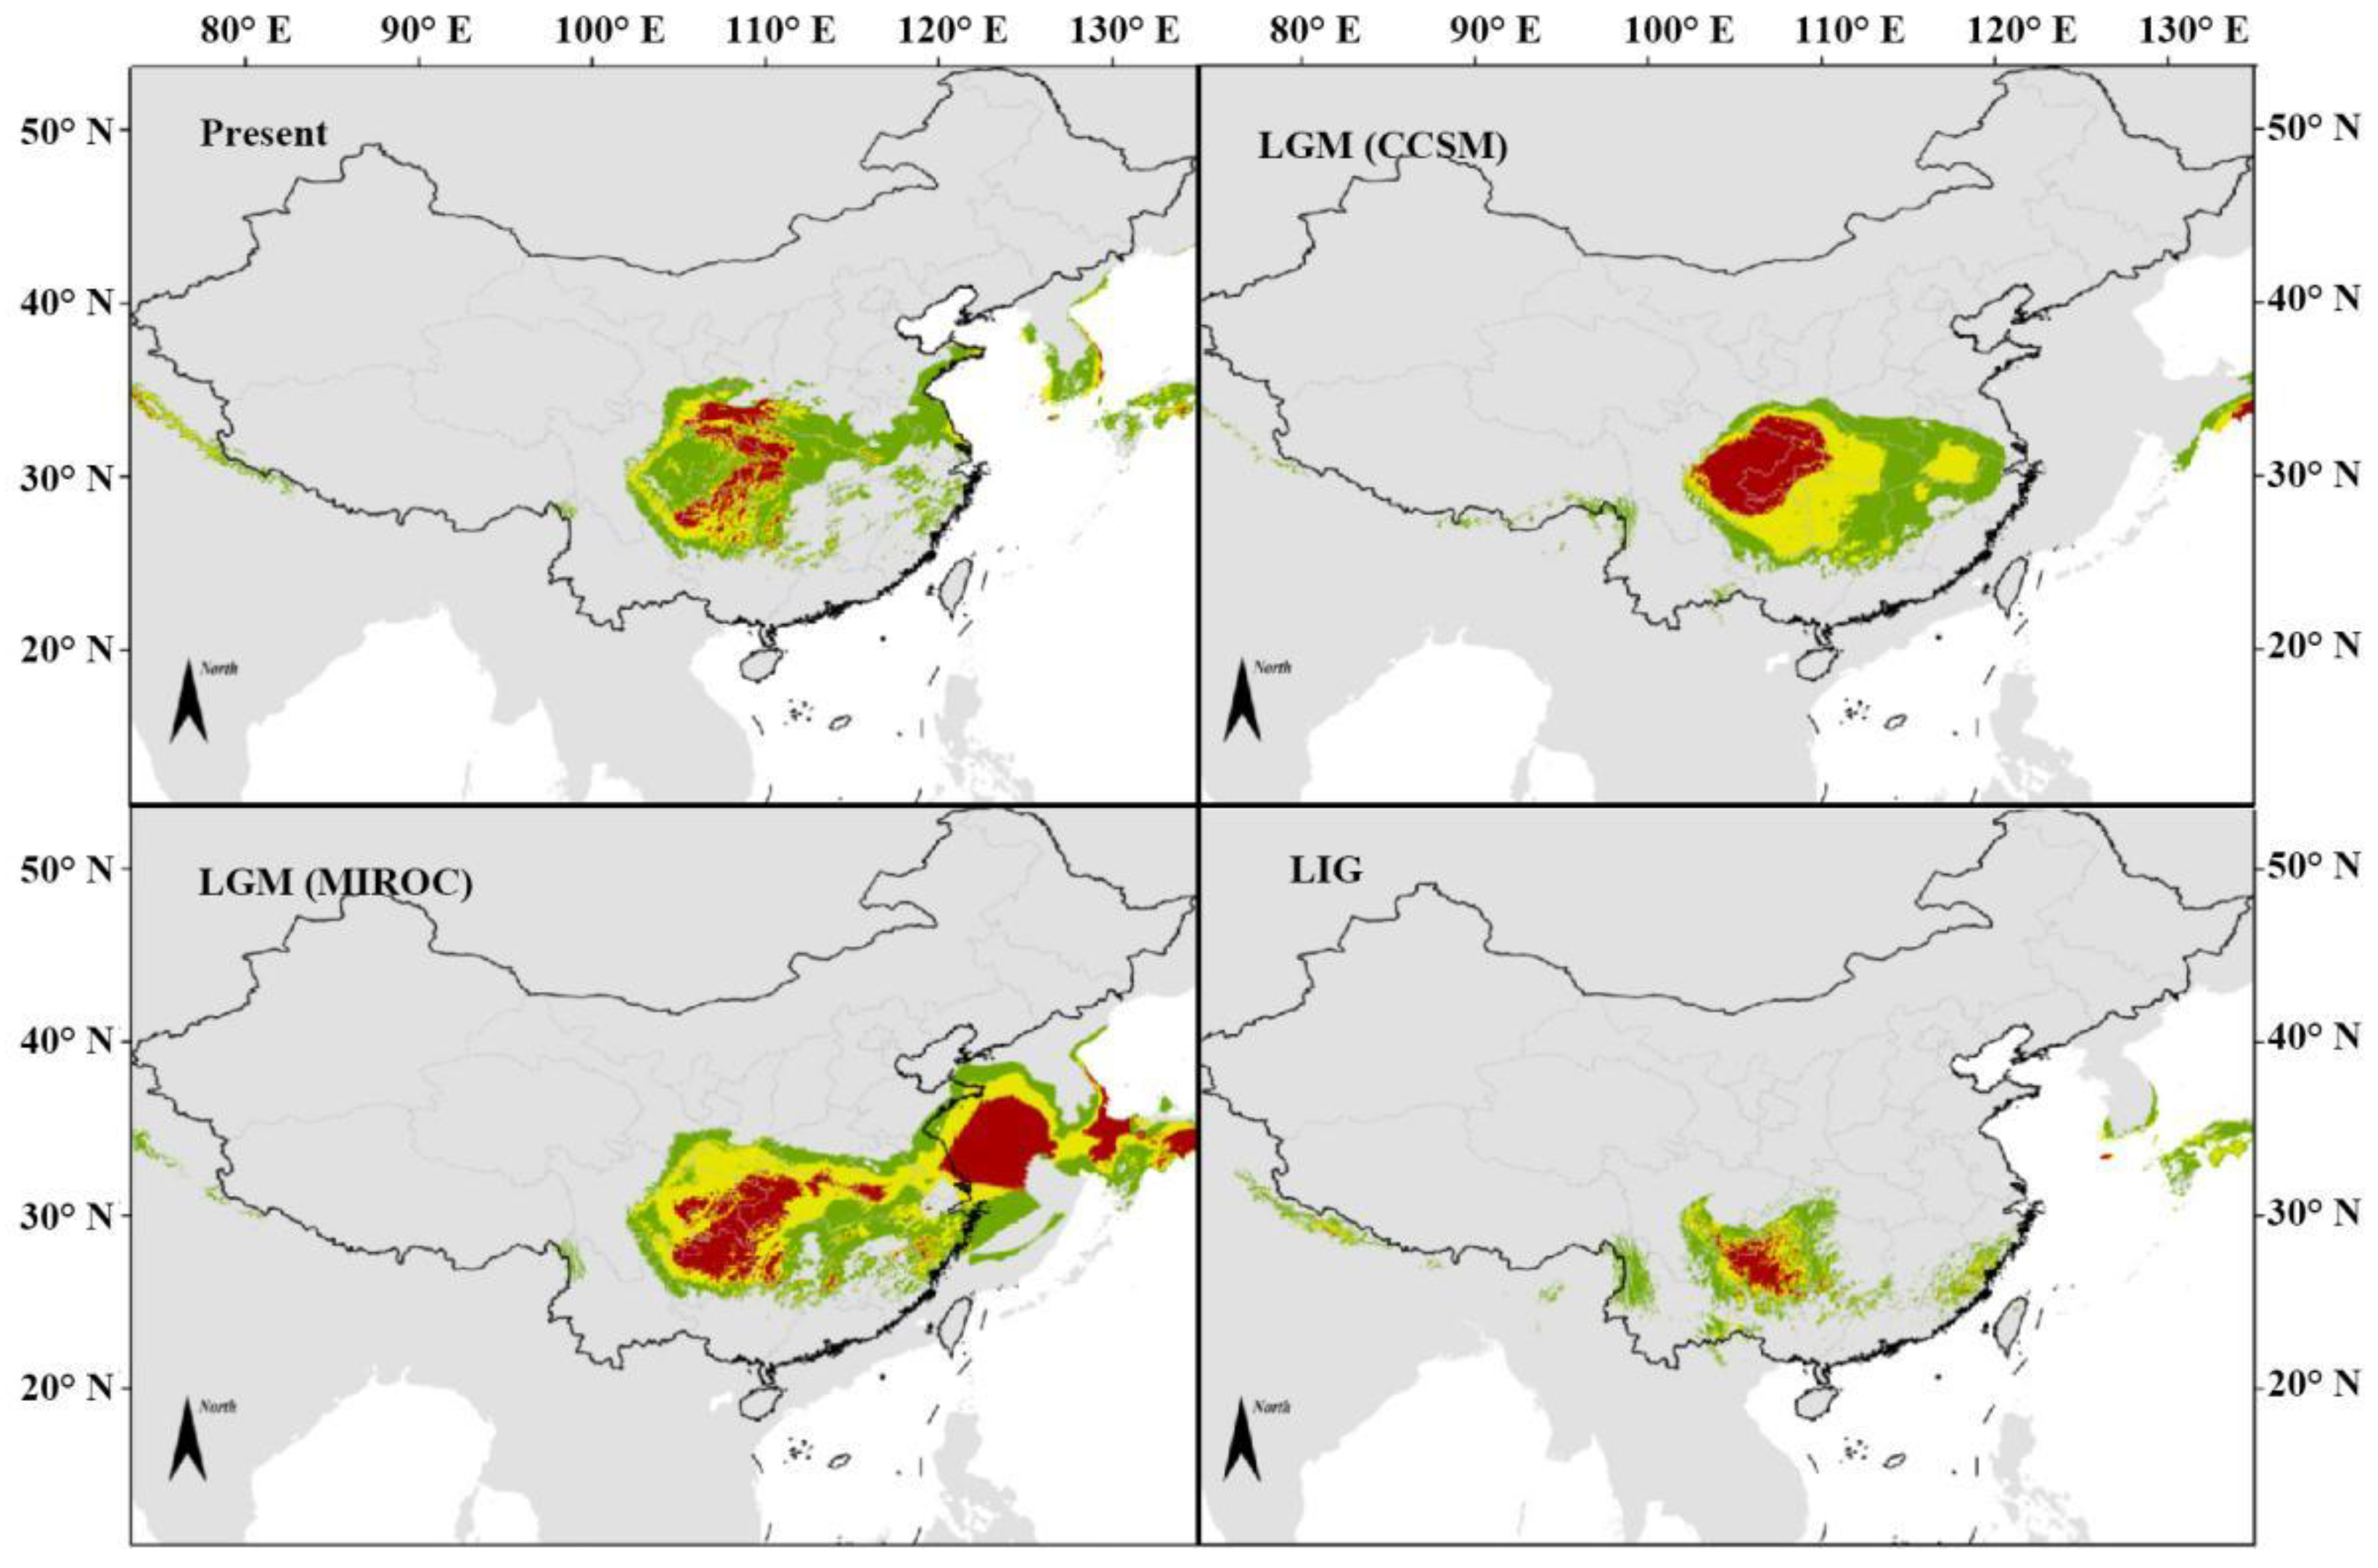
3.3.2. M. sprengeri Potential Distribution

Using the natural breaks method, the potential distribution of M. sprengeri was divided into four grades (not suitable, marginally suitable, moderately suitable, and highly suitable areas) (Table 5, Figure 7). Our simulation showed that the potential species distribution range was continuous from 20° N to 35° N during the LIG (last interglacial). During the LGM (Last Glacial Maximum), when temperature decreased, our results showed that M. sprengeri had the widest distribution and all of the suitable areas are within the subtropical areas of China, with highly suitable areas in the Qinling-Daba Mountains and Sichuan Basin. The projection of the model over the present bioclimatic conditions showed that the habitat was consistently suitable in subtropical China (ca. 22–34° N) for M. sprengeri, although some occurrences were outside the predicted distribution with marginally and moderately suitable probability. At present, the area of highly suitable and moderately suitable areas is reduced, and the highly suitable area at the Sichuan Basin has almost disappeared, while the proportion of the marginally suitable area increases. From LIG to the present, the distribution area of M. sprengeri has moved northward and expanded during the glacial climate.

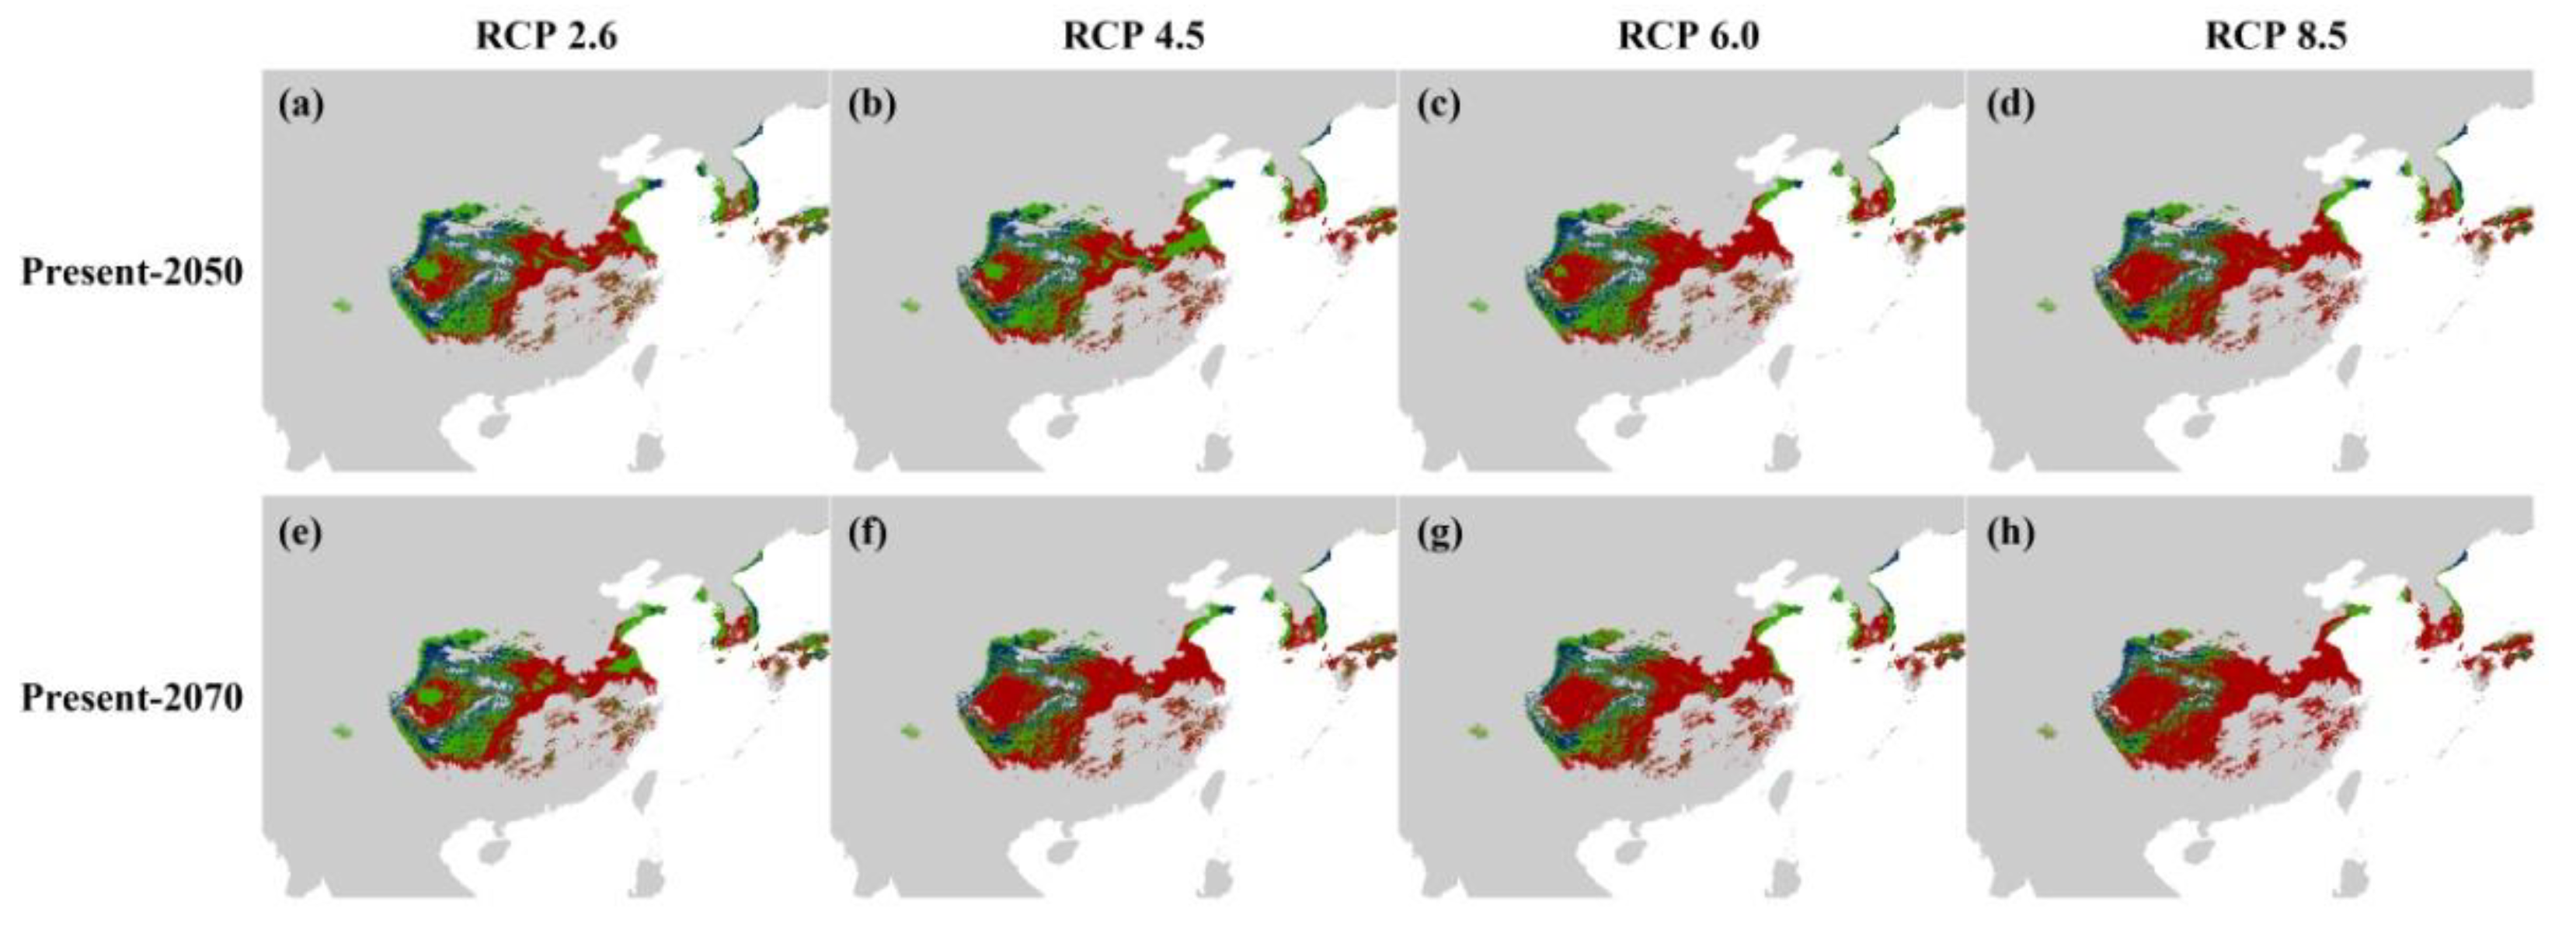
3.3.3. Suitable Distribution under Future Climate Scenarios

The MaxEnt model is used to predict the potential geographical distribution changes of M. sprengeri under four emission scenarios of RCP2.6, RCP4.5, RCP6.0, and RCP8.5 in the future (2050 and 2070) (Table 6). The potential distribution of M. sprengeri shows a shrinking trend in the future climatic environment (Figure 8). Compared with the current potential distribution area, the distribution area of this species in eastern China will be greatly reduced by 2050, gradually approaching the Qinling-Daba Mountains and Dabie Mountains. With the prediction of future climate change scenarios changing from optimistic to pessimistic, the potential future distribution area of M. sprengeri shrinks to a greater extent. At the same time, from 2050 to 2070, the potential future distribution area of M. sprengeri decreases greatly.

4. Discussion

4.1. Diversity and Genetic Structure

Genetic diversity is an important component of biodiversity, which has important ecological influence on natural populations [60]. The higher the genetic diversity or the richer the genetic variation of a species, the stronger ability it has to adapt to environmental changes, and the easier it is to expand its distribution ranges and develop new environments [61]. In this study, we found a generally low level of genetic diversity of the endangered tree M. sprengeri based on cpDNA datasets, which is similar to the study results of other endangered plants Dunnia sinensis in East Asia [62]. Commonly, the genetic diversity of a species is influenced by many factors, including evolutionary history, geographical distribution, and biological characteristics of the species itself [63]. Among the nine geographic regions of M. sprengeri in this study, the genetic diversity of M. sprengeri in Hubei and Hunan populations was the highest, followed by Guizhou province. Therefore, it was inferred that M. sprengeri gradually spread from the border area of Hubei Province to the south. Since the establishment of a new population, the gene frequency of the new population has depended on the genotype of the first few or dozens of individuals. When encountering the influence of adverse external conditions along the way, the gene frequency of the offspring will change with the change of gene frequency of the surviving individual. The current results showed that the boundary region of Hubei and Hunan Provinces and the earlier invaded region of Guizhou Province had higher genetic diversity, while the newly invaded region had lower genetic variations. Additionally, by selecting samples for distribution simulation, M. sprengeri is found to be mainly distributed in the subtropical monsoon climate area [64]. The ecological analysis showed that temperature difference was the main geographical and climatic factor affecting the genetic variation of M. sprengeri.
Genetic structure represents the distribution patterns of genetic variation within and among populations, which is mainly affected by internal and external factors. The internal factors mainly include gene flow, genetic drift, bottleneck effect, breeding methods, etc., while the external factors mainly include geological history changes, human activity and excessive mining, etc. [65,66]. The results of AMOVA analysis showed that the genetic variation of M. sprengeri mainly presented within the populations, accounting for 72.39% of total variations, and there was a significant genetic differentiation between populations (FST = 0.276), indicating less gene communication among different geographical populations but more frequent within the populations [67]. The Mantel tests show that geographical factors have little influence on the genetic differentiation of M. sprengeri. Some previous studies found that the seed dispersal mechanism has a significant impact on genetic differentiation among natural populations [68]. The seeds of M. sprengeri are thicker; therefore, the water permeability is poor, often leading to the low seed germination rate, which was also observed in the study of Magnolia dealbata [69]. Plus, seeds of Magnoliaceae plants are red; thus, the seeds that fall to the ground are conspicuous and frequently eaten by pests or animals [70]. Its upgrading ability was also seriously insufficient due to the lack of updated seedlings of the internal basic population. These mechanisms might have caused significant genetic differentiation [71]. Meanwhile, He et al. speculated that the birds and animals living on the fruits of wild cherries may be an important factor affecting the genetic structure of cherries [72]. Additionally, M. sprengeri, as a substitute for precious Chinese herbal medicine [73], has been cut down in large numbers by the long-term man-made destruction, which results in many populations in single plant distribution or fragmented and has further caused the high genetic differentiation and low genetic variations [74].

4.2. Population History and Species Distribution Fluctuations

The geographical distribution of species populations is closely related to the environmental impact of the Quaternary Glacial Age [75]. During the ice age, species may have located in refuges in areas that did not experience ice ages, and thus had longer evolutionary history and greater genetic diversity. In the present study, MaxEnt was used to predict the distribution of M. sprengeri in the contemporary, LIG, and LGM in this study. Since many parameters in MIROC are more suitable than CCSM for the simulation of East Asia [76], we referred more to the former model. The results showed that M. sprengeri was the most widely distributed in LGM, which indicated that the population expansion event occurred in the cold climate period of the Last Glacial Maximum. The optimal distribution area existed in the Qinling-Daba Mountains (QDM), the southeast of the margin of Sichuan Basin, and part of the west of the margin of Sichuan Basin. In addition, this species is also distributed in the Sichuan Basin, east of the North China Plain and the middle and lower reaches of the Yangtze River basin. Many northerly distribution tree species are known to be habitat generalists which are able to survive in various habitat types in temperate regions [77]. Combining the forecast area of each period, it was found that the suitable growth altitude of M. sprengeri is 1300–2400 m [25], which is greatly affected by temperature and climate factors. We speculated that M. sprengeri with considerable tolerance has survived the ice age with a slightly total distribution decrease.
Additionally, the occurrence of areas or centers of endemism is commonly attributed to the existence of suitable refugia [65]. The QDM is located in central China separated by the southern subtropical and northern temperate regions, with complex topography, climate, and ecological diversity [66]. In this study, populations (number 7 and 15) with multiple haplotypes and populations (number 8, 9 and 17) with endemic haplotypes (HP3, 4) were distributed in the southeastern edge of the Sichuan Basin (the junction area of Hunan-Hubei provinces and Guizhou Province). It is speculated that the QDM and the whole southeastern edge of the Sichuan Basin were the glacial refugees of M. sprengeri during LGM. However, the predicted highly suitable areas of this species are now decreasing in fragmentation (138 to 116 km2, from LGM to the present), possibly due to the environmental changes and recently human activities [78,79]. The predicted highly suitable areas in the Sichuan Basin have been disappeared currently, and the total suitable areas were significantly lower than that of in LGM. Recent studies showed that the distribution area of Euscaphis japonica in East Asia has gradually shrunk as a result of the regional influence of climate change, together with deforestation [80,81]. In this study, a similar result was found that the decrease of the current distribution area of M. sprengeri might be caused by the frequent human activities, the instability of climate and ecology, and the habitat destruction by human beings for economic benefits. Researchers are now realizing that climate change may be a major threat to biodiversity in the next 100 years [82]. Therefore, M. sprengeri’s survival situation will gradually improve with the strengthening of human environmental protection consciousness and the earth’s ecological restoration.

4.3. Conservation Strategies and Implications

The floras with high levels of endemism are relatively vulnerable, more likely to face the risk of habitat losses and extinction [83], indicating that conservation measures for endangered plants are a matter of urgency [84]. Liu et al. conducted a systematic investigation of Magnoliaceae plants in 14 provinces and regions of China and found that the distribution area of most Magnoliaceae plants shrunk with the destruction of habitat, and M. sprengeri is no exception [85]. It also has been listed as a vulnerable endangered species in the Red List [30]. For a long time, M. sprengeri has been used as high-quality wood and medicine [86], and its natural population has been greatly destroyed [87]. The geography of the pedigree of M. sprengeri in research results in differentiation within populations being much higher than that between populations. Therefore, we recommend local protection of the wild natural population of this species [88], especially in the natural population of potential glacial refugia (populations in QDM and the southeastern edge of Sichuan Basin), in order to preserve their high genetic diversity. In addition, it is advised to focus on the protection of groups with endemic haplotypes (populations number 7, 8, 9, 15, 17) to prevent loss of M. sprengeri within the population diversity and the risk of extinction. Moreover, populations in different regions can also be protected reasonably and exoterically to increase the gene exchange between populations, improve their genetic diversity, and enhance the survivability of M. sprengeri against adverse environments [89]. Chen et al. suggested that effective gene flow can be spread through seeds [90]. Therefore, the mature seeds of each population can be collected and artificially sown to other populations by employing the cross-sowing method [91], so as to improve the fragmentation of habitat, strengthen gene communication among populations, and improve the level of genetic diversity of wild populations.
As one of the most primitive taxa of primitive angiosperms, the ancestors of M. sprengeri had an abundant genetic basis and genetic variation [92]. However, the rare and endangered species often have less genetic diversity than that of other widespread species of the family Magnoliaceae [93,94], indicating that the process of evolution may not be the main cause of M. sprengeri’s genetic diversity. The relatively low genetic diversity may be related to the distribution decrease and habitat fragmentation. In addition, Germplasm resources and artificial seedling technology of M. sprengeri should be established [95] to improve the natural regeneration capacity of M. sprengeri and expand the range of its cultivation. Ex-situ conservation should be carried out for some populations with low genetic diversity [96], and the genetic materials of different populations should be collected as far as possible to promote the extensive exchange of genetic information among different populations.

5. Conclusions

In this study, population genetic analysis showed that the endangered and rare tree Magnolia sprengeri have a low level of chloroplast DNA diversity and high genetic differentiation among populations. Ecological niche modeling demonstrated that the natural populations of M. sprengeri did not experience significant geographic distribution changes from the Last Glacial Maximum to the present time. The Qinling-Daba Mountains, Central China, and Tianmu Mountains of Zhejiang province, East of China in East Asia might be the potential glacial refugia for the endangered species M. sprengeri. In situ and ex-situ conservation strategies should be formulated for the natural populations of M. sprengeri in the near future.

Supplementary Materials

The following are available online at https://www.mdpi.com/article/10.3390/f12070931/s1, Figure S1: Electrophoretic map of matK’s primers. Figure S2: Electrophoretic map of trnH-psbA’s primers. Figure S3: Electrophoretic map of rbcL’s primers. Figure S4: All alignments sequences of M. sprengeri used in this study. Table S1: The location and voucher information of M. sprengeri samples used in this study. Table S2: Primers used for DNA barcoding studies. Table S3: Variable sites of the aligned sequences of the three chloroplast DNA (cpDNA) fragments (matK, trnH-psbA and rbcL) from which six cpDNA haplotypes of Magnolia sprengeri were identified.

Author Contributions

Conceptualization, Z.-H.L.; methodology, T.Z. and Z.-H.L.; software, T.Z. and X.-J.H.; validation, T.Z. and X.-J.H.; formal analysis, Y.-L.W.; investigation, S.-Z.Z., Y.W., Y.-J.W., W.-Z.L., and J.-B.Z.; resources, Y.-L.W.; data curation, T.Z., X.-J.H., and Y.-L.W.; writing—original draft preparation, T.Z.; writing—review and editing, T.Z. and Z.-H.L. All authors have read and agreed to the published version of the manuscript.

Funding

This work was financially supported by the National Natural Science Foundation of China (31970359), the Shaanxi Science and Technology Innovation Team (2019TD-012), and the Fourth National Survey of Traditional Chinese Medicine Resources (2018-43 and 2019-68).

Institutional Review Board Statement

Not applicable.

Informed Consent Statement

Not applicable.

Data Availability Statement

Not applicable.

Acknowledgments

We thank Qiu-Yi Zhong for her kindly help for the English editing.

Conflicts of Interest

The authors declare no conflict of interest.

References

  1. Davis, M.B. Range shifts and adaptive responses to Quaternary climate change. Science 2001, 292, 673–679. [Google Scholar] [CrossRef] [Green Version]
  2. Hewitt, G.M. Genetic consequences of climatic oscillations in the Quaternary. Philos. Trans. R. Soc. Lond. B Biol. Sci. 2004, 359, 183–195. [Google Scholar] [CrossRef] [PubMed] [Green Version]
  3. Hewitt, G.M. Post-glacial re-colonization of European biota. Biol. J. Linn. Soc. Lond. 1999, 68, 87–112. [Google Scholar] [CrossRef]
  4. Suarez-Gonzalez, A.; Sutton, J.T.; Trant, A.J.; Zamlynny, E.; Good, S.V. Rethinking refugia: Tree topology, divergence dates, and demographic history trace the distribution of the endangered Plymouth gentian (Sabatia kennedyana) from the Pleistocene glaciation to present day. Am. J. Bot. 2015, 102, 609–620. [Google Scholar] [CrossRef] [PubMed] [Green Version]
  5. Petit, R.J.; Kremer, A.; Wagner, D.B. Geographic structure of chloroplast DNA polymorphisms in European oaks. Theor. Appl. Genet. 1993, 87, 122–128. [Google Scholar] [CrossRef] [PubMed]
  6. Tzedakis, P.C.; Lawson, I.T.; Frogley, M.R.; Hewitt, G.M.; Preece, R.C. Buffered tree population changes in a Quaternary refugium: Evolutionary implications. Science 2002, 297, 2044–2047. [Google Scholar] [CrossRef] [PubMed] [Green Version]
  7. Xu, J.; Deng, M.; Jiang, X.L.; Westwood, M.; Song, Y.G.; Turkington, R. Phylogeography of Quercus glauca (Fagaceae), a dominant tree of East Asian subtropical evergreen forests, based on three chloroplast DNA interspace sequences. Tree Genet. Genomes 2015, 11, 1–17. [Google Scholar] [CrossRef]
  8. Michalczyk, I.M.; Opgenoorth, L.; Luecke, Y.; Huck, S.; Ziegenhagen, B. Genetic support for perglacial survival of Juniperus communis L. in Central Europe. Holocene 2010, 20, 887–894. [Google Scholar] [CrossRef]
  9. Sommer, R.S.; Zachos, F.E. Fossil evidence and phylogeography of temperate species: ‘glacial refugia’ and post-glacial recolonization. J. Biogeogr. 2010, 36, 2013–2020. [Google Scholar] [CrossRef]
  10. Petit, R.J.; Brewer, S.; Bordacs, S.; Burg, K.; Cheddadi, R.; Coart, E.; Cottrell, J.; Csaikl, U.M.; Van Dam, B.; Deans, J.D.; et al. Identification of refugia and post-glacial colonisation routes of European white oaks based on chloroplast DNA and fossil pollen evidence. For. Ecol. Manag. 2002, 156, 49–74. [Google Scholar] [CrossRef]
  11. Kitamura, A. Quaternary climatic changes and species diversity: Responses of marine organisms to glacial-interglacial cycles. Fossils 2004, 75, 54–59. [Google Scholar]
  12. Becquet, V.; Simon-Bouhet, B.; Pante, E.; Hummel, H.; Garcia, P. Glacial refugium versus range limit: Conservation genetics of Macoma balthica, a key species in the Bay of Biscay (France). J. Exp. Mar. Biol. Ecol. 2012, 432, 73–82. [Google Scholar] [CrossRef] [Green Version]
  13. Carstens, B.C.; Richards, C.L. Integrating coalescent and ecological niche modeling in comparative phylogeography. Evolution 2007, 61, 1439–1454. [Google Scholar] [CrossRef]
  14. Su, Z.M. The subtropical mid-montane coniferous and broad-leaf mixed forest in Guangxi. Guihaia 1983, 3, 33–42. [Google Scholar]
  15. Liu, H.Y.; Jin, X.L.; Xue, H.W.; Luo, X.M.; Zhang, R.Q. Research Progress on Community Characteristics and Population Ecology of Davidia involucrate Baill. Chin. Agric. Sci. Bull. 2012, 28, 1–4. [Google Scholar]
  16. Wan, Q.; Zheng, Z.; Huang, K.; Guichoux, E.; Petit, R.J. Genetic divergence within the monotypic tree genus Platycarya (Juglandaceae) and its implications for species’ past dynamics in subtropical china. Tree Genet. Genomes 2017, 13, 73. [Google Scholar] [CrossRef]
  17. Shi, Y.; Cui, Z.; Su, Z. The Quaternary Glaciations and Environmental Variations in China, 1st ed.; Hebei Science and Technology Press: Shijiazhuang, China, 2006; pp. 65–101. [Google Scholar]
  18. Wang, J. Refugia within refugia: The case study of a canopy tree (Eurycorymbus cavaleriei) in subtropical China. J. Biogeogr. 2010, 36, 2156–2164. [Google Scholar] [CrossRef]
  19. Chen, C.; Lu, R.S.; Zhu, S.S.; Tamaki, I.; Qiu, Y.X. Population structure and historical demography of Dipteronia dyeriana (Sapindaceae), an extremely narrow palaeoendemic plant from China: Implications for conservation in a biodiversity hot spot. Heredity 2017, 119, 95–106. [Google Scholar] [CrossRef] [PubMed] [Green Version]
  20. Tian, S.; Lei, S.Q.; Hu, W.; Deng, L.L.; Li, B.; Meng, Q.L.; Soltis, D.E.; Soltis, P.S.; Fan, D.M.; Zhang, Z.Y. Repeated range expansions and inter-/postglacial recolonization routes of Sargentodoxa cuneata (Oliv.) Rehd. et Wils. (Lardizabalaceae) in subtropical China revealed by chloroplast phylogeography. Mol. Phylogenet. Evol. 2015, 85, 238–246. [Google Scholar] [CrossRef] [PubMed]
  21. Yi, X.G.; Chen, J.; Zhu, H.; Li, Y.F.; Li, X.X.; Li, M.; Duan, Y.F.; Chen, L.; Wang, X.R. Phylogeography and the population genetic structure of flowering cherry Cerasus serrulata (Rosaceae) in subtropical and temperate China. Ecol. Evol. 2020, 10, 11262–11276. [Google Scholar] [CrossRef]
  22. Chen, D.; Zhang, X.; Kang, H.; Sun, X.; Yin, S.; Du, H.; Yamanaka, N.; Gapare, W.; Wu, H.X.; Liu, C. Phylogeography of Quercus variabilis based on chloroplast DNA sequence in East Asia: Multiple glacial refugia and Mainland-migrated island populations. PLoS ONE 2012, 7, e47268. [Google Scholar] [CrossRef] [PubMed] [Green Version]
  23. Ming, L.; Wang, Q.; Wu, Z.J.; López-Pujol, J.; Li, D.Z.; Zhang, Z.Y. Molecular phylogeography of Fagus engleriana (Fagaceae) in subtropical China: Limited admixture among multiple refugia. Tree Genet. Genomes 2012, 8, 1203–1212. [Google Scholar]
  24. Fu, D.L.; Xiong, B.H.; Chen, X.; Tian, W.X.; Du, L. Analyses of chloroplast genomic and morphological evolutionomy of Yulania sprengeri and two new confusable species (Magnoliaceae). J. Agric. For. 2019, 7, 212. [Google Scholar] [CrossRef]
  25. China Flora Editorial Board. Flora of China, 3rd ed.; Beijing Science Press: Beijing, China, 2008; Volume 7, p. 73. [Google Scholar]
  26. Song, C.; Liu, H. Habitat differentiation and conservation gap of Magnolia biondii, M. denudata, and M. sprengeri in China. PeerJ 2019, 6, e6126. [Google Scholar] [CrossRef] [PubMed] [Green Version]
  27. Kang, Y.X.; Ejder, E. Magnolia sprengeri Pamp.: Morphological variation and geographical distribution. Plant Biosyst. 2011, 145, 906–923. [Google Scholar] [CrossRef]
  28. Peng, X.; Chen, K. Research on Popularization and Application of Si Chuan Native Tree Magnolia sprengeri Pamp. in Landscape Architecture. Archit. Cult. 2018, 5, 114–116. [Google Scholar]
  29. Yang, D.L. Use of Magnolia (Magnolia grandiflora) Seeds in Medicine, and Possible Mechanisms of Action. Nuts Seeds Health Dis. Prev. 2011, 86, 727–732. [Google Scholar]
  30. Rivers, M.C.; Beech, E.; Murphy, L.; Oldfield, S. The Red List of Magnoliaceae—Revised and Extended, 1st ed.; Botanic Gardens Conservation International: Surrey, UK, 2016; p. 48. [Google Scholar]
  31. Ho, V.T.; Tran, T.K.P.; Vu, T.T.T.; Widiarsih, S. Comparison of matK and rbcL DNA barcodes for genetic classification of jewel orchid accessions in Vietnam. J. Genet. Eng. Biotechnol. 2021, 19, 93. [Google Scholar] [CrossRef] [PubMed]
  32. Kress, W.J.; Wurdack, K.J.; Zimmer, E.A.; Weigt, L.A.; Janzen, D.H. Use of DNA barcodes to identify flowering plants. Proc. Natl. Acad. Sci. USA 2005, 102, 8369–8374. [Google Scholar] [CrossRef] [Green Version]
  33. Massoni, J.; Forest, F.; Sauquet, H. Increased sampling of both genes and taxa improves resolution of phylogenetic relationships within Magnoliidae, a large and early-diverging clade of angiosperms. Mol. Phylogenet. Evol. 2014, 70, 84–93. [Google Scholar] [CrossRef]
  34. Azuma, H.; García-Franco, J.G.; Rico-Gray, V.; Thien, L.B. Molecular phylogeny of the Magnoliaceae: The biogeography of tropical and temperate disjunctions. Am. J. Bot. 2001, 88, 2275–2285. [Google Scholar] [CrossRef]
  35. Sangtae, K.; Youngbae, S. Phylogeny of Magnoliaceae Based on Ten Chloroplast DNA Regions. J. Plant Bio. 2013, 56, 290–305. [Google Scholar]
  36. Allen, G.C.; Flores-Vergara, M.A.; Krasynanski, S.; Kumar, S.; Thompson, W.F. A modified protocol for rapid DNA isolation from plant tissues using cetyltrimethylammonium bromide. Nat. Protoc. 2006, 1, 2320–2325. [Google Scholar] [CrossRef]
  37. Jiang, C.; Cao, L.; Yuan, Y.; Chen, M.; Jin, Y.; Huang, L. Barcoding melting curve analysis for rapid, sensitive, and discriminating authentication of saffron (Crocus sativus L.) from its adulterants. Biomed Res. Int. 2014, 2014, 809037. [Google Scholar] [CrossRef] [Green Version]
  38. Swift, J.F.; Lance, R.F.; Guan, X.; Britzke, E.R.; Lindsay, D.L.; Edwards, C.E. Multifaceted DNA metabarcoding: Validation of a noninvasive, next-generation approach to studying bat populations. Evol. Appl. 2018, 11, 1120–1138. [Google Scholar] [CrossRef] [PubMed]
  39. Tate, J.A.; Simpson, B.B. Breeding system evolution in Tarasa (Malvaceae) and selection for reduced pollen grain size in the polyploid species. Am. J. Bot. 2004, 91, 207–213. [Google Scholar] [CrossRef] [PubMed]
  40. Kress, W.J.; Erickson, D.L. A two-locus global DNA barcode for land plants: The coding rbcL gene complements the non-coding trnH-psbA spacer region. PLoS ONE 2007, 2, e508. [Google Scholar] [CrossRef] [PubMed] [Green Version]
  41. Thompson, J.D.; Gibson, T.J.; Plewniak, F.; Jeanmougin, F.; Higgins, D.G. The CLUSTAL_X windows interface: Flexible strategies for multiple sequence alignment aided by quality analysis tools. Nucleic Acids Res. 1997, 25, 4876–4882. [Google Scholar] [CrossRef] [PubMed] [Green Version]
  42. Hall, T.A. BioEdit: A User-Friendly Biological Sequence Alignment Editor and Analysis Program for Windows 95/98/NT. Nucleic Acids Res. 1999, 41, 95–98. [Google Scholar]
  43. Rozas, J.; Ferrer-Mata, A.; Sánchez-DelBarrio, J.C.; Guirao-Rico, S.; Librado, P.; Ramos-Onsins, S.E.; Sánchez-Gracia, A. DnaSP 6: DNA Sequence Polymorphism Analysis of Large Data Sets. Mol. Biol. Evol. 2017, 34, 3299–3302. [Google Scholar] [CrossRef] [PubMed]
  44. Bandelt, H.J.; Forster, P.; Röhl, A. Median-joining networks for inferring intraspecific phylogenies. Mol. Biol. Evol. 1999, 16, 37–48. [Google Scholar] [CrossRef] [PubMed]
  45. Feng, L.; Zheng, Q.J.; Qian, Z.Q.; Yang, J.; Zhang, Y.P.; Li, Z.H.; Zhao, G.F. Genetic Structure and Evolutionary History of Three Alpine Sclerophyllous Oaks in East Himalaya-Hengduan Mountains and Adjacent Regions. Front. Plant Sci. 2016, 7, 1688. [Google Scholar] [CrossRef] [PubMed] [Green Version]
  46. Excoffier, L.; Laval, G.; Schneider, S. Arlequin (version 3.0): An integrated software package for population genetics data analysis. Evol. Bioinform. Online 2007, 1, 47–50. [Google Scholar] [CrossRef] [Green Version]
  47. Peakall, R.; Smouse, P.E. GenAlEx 6.5: Genetic analysis in Excel. Population genetic software for teaching and research--an update. Bioinformatics 2012, 28, 2537–2539. [Google Scholar] [CrossRef] [Green Version]
  48. Cockerham, C.C. Drift and mutation with a finite number of allelic states. Proc. Natl. Acad. Sci. USA 1984, 81, 530–534. [Google Scholar] [CrossRef] [Green Version]
  49. Pons, O.; Petit, R.J. Measuring and testing genetic differentiation with ordered versus unordered alleles. Genetics 1996, 144, 1237–1245. [Google Scholar] [CrossRef]
  50. Stamatakis, A. RAxML-VI-HPC: Maximum likelihood-based phylogenetic analyses with thousands of taxa and mixed models. Bioinformatics 2006, 22, 2688–2690. [Google Scholar] [CrossRef]
  51. Sun, L.; Jiang, Z.; Wan, X.; Zou, X.; Yao, X.; Wang, Y.; Yin, Z. The complete chloroplast genome of Magnolia polytepala: Comparative analyses offer implication for genetics and phylogeny of Yulania. Gene 2020, 736, 144410. [Google Scholar] [CrossRef]
  52. Ronquist, F.; Huelsenbeck, J.P. MrBayes 3: Bayesian phylogenetic inference under mixed models. Bioinformatics 2003, 19, 1572–1574. [Google Scholar] [CrossRef] [PubMed] [Green Version]
  53. FigTree v1.3.1. 2006–2009. Available online: http://tree.bio.ed.ac.uk/software/figtree/ (accessed on 29 November 2012).
  54. Otto-Bliesner, B.L.; Marshall, S.J.; Overpeck, J.T.; Miller, G.H.; Hu, A. Simulating Arctic climate warmth and icefield retreat in the last interglaciation. Science 2006, 311, 1751–1753. [Google Scholar] [CrossRef] [Green Version]
  55. Shen, Y.P.; Wang, G.Y. Key findings and assessment results of ipcc wgi fifth assessment report. J. Glaciol. Geocryol. 2013, 5, 10–18. [Google Scholar]
  56. Steven, J.P.; Robert, P.A.; Robert, E.S. Maximum entropy modeling of species geographic distributions. Ecol. Modell. 2006, 190, 231–259. [Google Scholar]
  57. Worth, J.; Williamson, G.J.; Sakaguchi, S.; Nevill, P.G.; Jordan, G.J. Environmental niche modeling fails to predict Last Glacial Maximum refugia: Niche shifts, microrefugia or incorrect palaeoclimate estimates? Glob. Ecol. Biogeogr. 2015, 23, 1186–1197. [Google Scholar] [CrossRef]
  58. Cao, B.; Bai, C.; Zhang, L.; Li, G.; Mao, M. Modeling habitat distribution of Cornus officinalis with MaxEnt modeling and fuzzy logics in China. J. Plant Ecol. 2016, 9, 742–751. [Google Scholar] [CrossRef] [Green Version]
  59. Warren, D.L.; Glor, R.E.; Turelli, M. Environmental niche equivalency versus conservatism: Quantitative approaches to niche evolution. Evolution 2008, 62, 2868–2883. [Google Scholar] [CrossRef] [PubMed]
  60. Hughes, A.R.; Inouye, B.D.; Johnson, M.T.; Underwood, N.; Vellend, M. Ecological consequences of genetic diversity. Ecol. Lett. 2008, 11, 609–623. [Google Scholar] [CrossRef] [PubMed]
  61. Lu, Y.; Shah, T.; Hao, Z.; Taba, S.; Zhang, S.; Gao, S.; Liu, J.; Cao, M.; Wang, J.; Prakash, A.B.; et al. Comparative SNP and haplotype analysis reveals a higher genetic diversity and rapider LD decay in tropical than temperate germplasm in maize. PLoS ONE 2011, 6, e24861. [Google Scholar] [CrossRef] [PubMed] [Green Version]
  62. Ge, X.J.; Chiang, Y.C.; Chou, C.H.; Chiang, T.Y. Nested clade analysis of Dunnia sinensis (Rubiaceae), a monotypic genus from China based on organelle DNA sequences. Conservat. Genet. 2002, 3, 351–362. [Google Scholar] [CrossRef]
  63. Hamrick, J.L.; Godt, M. Effects of Life History Traits on Genetic Diversity in Plant Species. Philos. Trans. Biol. Sci. 1996, 351, 1291–1298. [Google Scholar]
  64. Shu, X.; Yang, Z.; Duan, H.; Yang, X.; Yu, H. Seed germinating characteristics of endangered plant Magnolia officinalis. China J. Chin. Mater. Med. 2010, 35, 419–422. [Google Scholar]
  65. Lopez-Pujol, J.L.; Zhang, F.M.; Sun, H.Q.; Ying, T.S.; Ge, S. Mountains of Southern China as “Plant Museums” and “Plant Cradles”: Evolutionary and Conservation Insights. Mt. Res. Dev. 2011, 31, 261–269. [Google Scholar] [CrossRef] [Green Version]
  66. Rost, K.T. Pleistocene paleoenvironmental changes in the high mountain ranges of central China and adjacent regions. Quat. Int. 2000, 65, 147–160. [Google Scholar] [CrossRef]
  67. Petrosian, V.G.; Tokarskaia, O.N.; Kashentseva, T.A.; Korochkin, L.I.; Ryskov, A.P. Assessment of population differentiation using DNA fingerprinting and modified Wright’s FST-statistics. Genetika 2003, 39, 229–235. [Google Scholar]
  68. Sork, V.L.; Nason, J.; Campbell, D.R.; Fernandez, J.F. Landscape approaches to historical and contemporary gene flow in plants. Trends Ecol. Evol. 1999, 14, 219–224. [Google Scholar] [CrossRef]
  69. Corral-Aguirre, J.; Sánchez-Velásquez, L.R. Seed ecology and germination treatments in Magnolia dealbata: An endangered species. Flora 2006, 201, 227–232. [Google Scholar] [CrossRef]
  70. Tian, K.; Zhang, G.X.; Cheng, X.F.; He, S.J.; Yang, Y.X. The habitat fragility of Manglietiastrum sinicum. Acta Bot. Yunnanica 2003, 25, 551–556. [Google Scholar]
  71. Vovides, A.P.; Iglesias, C.G. Seed Germination of Magnolia dealbata Zucc. (Magnoliaceae), an endangered species from Mexico. HortScience 1996, 31, 877. [Google Scholar] [CrossRef] [Green Version]
  72. He, H.L.; Cai, Y.L.; Gao, T.X.; Li, B.; Wan, T.; Wang, Y. SSR evaluation of genetic diversity of seven wild Prunus tomentosa populations in Shaanxi. J. Northwest A F Univ. 2015, 43, 193–198. [Google Scholar]
  73. Sur, D.K.; Plesa, M.L. Treatment of Allergic Rhinitis. Asian Pac. J. Allergy Immunol. 2015, 92, 985–992. [Google Scholar]
  74. Lacy, R.C. Loss of genetic diversity from managed population: Interacting effects of drift, mutation, immigration, Selection and population subdivision. Conserv. Biol. 1987, 1, 143–158. [Google Scholar] [CrossRef]
  75. Qiu, Y.X.; Fu, C.X.; Comes, H.P. Plant molecular phylogeography in China and adjacent regions: Tracing the genetic imprints of Quaternary climate and environmental change in the world’s most diverse temperate flora. Mol. Phylogenet. Evol. 2011, 59, 225–244. [Google Scholar] [CrossRef]
  76. Wang, D.Q.; Zhang, Y.C. Diurnal variations of precipitation and circulation simulated by model for interdisciplinary research on climate. J. Nanjing Univ. 2009, 45, 724–733. [Google Scholar]
  77. Bhagwat, S.A.; Willis, K.J. Species persistence in northerly glacial refugia of Europe: A matter of chance or biogeographical traits? J. Biogeogr. 2008, 35, 464–482. [Google Scholar] [CrossRef]
  78. Mackay, A. Climate change 2007: Impacts, Adaptation and Vulnerability. Contribution of Working Group II to the Fourth Assessment Report of the Intergovernmental Panel on Climate Change. J. Environ. Qual. 2007, 36, 2407. [Google Scholar] [CrossRef]
  79. Olsen, S.L.; Töpper, J.P.; Skarpaas, O.; Vandvik, V.; Klanderud, K. From facilitation to competition: Temperature-driven shift in dominant plant interactions affects population dynamics in seminatural grasslands. Glob. Chang. Biol. 2016, 22, 1915–1926. [Google Scholar] [CrossRef] [PubMed]
  80. Zhang, K.; Sun, L.; Tao, J. Impact of climate change on the distribution of Euscaphis japonica (Staphyleaceae) trees. Forests 2020, 11, 525. [Google Scholar] [CrossRef]
  81. Dulias, R. Drift Sand Fields as a Result of Past and Curent Deforestation in the Silesian-Cracow Upland, Poland. Land Degrad. Dev. 2018, 29, 1530–1539. [Google Scholar] [CrossRef]
  82. Román-Palacios, C.; Wiens, J.J. Recent responses to climate change reveal the drivers of species extinction and survival. Proc. Natl. Acad. Sci. USA 2020, 117, 4211–4217. [Google Scholar] [CrossRef]
  83. Thomas, C.D.; Cameron, A.; Green, R.E.; Bakkenes, M.; Beaumont, L.J.; Collingham, Y.C.; Erasmus, B.F.; De Siqueira, M.F.; Grainger, A.; Hannah, L.; et al. Extinction risk from climate change. Nature 2004, 427, 145–148. [Google Scholar] [CrossRef]
  84. Fay, M.F. Conservation of rare and endangered plants using in vitro methods. In Vitro Cell. Dev. Biol. Plant 1992, 28, 1–4. [Google Scholar] [CrossRef]
  85. Liu, Y.H.; Zhou, R.Z.; Zeng, Q.W. Ex situ conservation of Magnoliaceae including its rare and endangered species. J. Trop. Subtrop. Bot. 1997, 5, 1–12. [Google Scholar]
  86. Fang, H.; Guo, Q.; Su, W.; Deng, F.; Wang, K.Q. RP—HPLC Determination of Magnolin in Chinese Medicine Xinyi. Chin. J. Pharm. Anal. 2002, 22, 342–345. [Google Scholar]
  87. Shi, S.G.; Li, S.J.; Kang, Y.X.; Liu, J.J. Molecular characterization and expression analyses of an anthocyanin synthase gene from Magnolia sprengeri Pamp. Appl. Biochem. Biotechnol. 2015, 175, 477–488. [Google Scholar] [CrossRef] [PubMed]
  88. Yang, M.; Shi, S.G.; Liu, W.; Zhang, M.; Gou, L.; Kang, Y.X.; Liu, J.J. Phenotypic variation and diversity of Magnolia sprengeri Pamp. In native habitat. Genet. Mol. Res. 2015, 14, 6495–6508. [Google Scholar] [CrossRef] [PubMed]
  89. Prendergast, J.R.; Quinn, R.M.; Lawton, J.H.; Eversham, B.C.; Gibbons, D.W. Rare species, the coincidence of diversity hotspots and conservation strategies. Nature 1993, 365, 335–337. [Google Scholar] [CrossRef]
  90. Chen, T.; Chen, Q.; Luo, Y.; Huang, Z.L.; Zhang, J.; Tang, H.R.; Pan, D.M.; Wang, X.R. Phylogeography of Chinese cherry (Prunus pseudocerasus Lindl.) inferred from chloroplast and nuclear DNA: Insights into evolutionary patterns and demographic history. Plant biol. 2015, 17, 787–797. [Google Scholar] [CrossRef] [PubMed]
  91. Gerlee, P.; Lundh, T. Productivity and diversity in a cross-feeding population of artificial organisms. Evolution 2010, 64, 2716–2730. [Google Scholar] [CrossRef] [PubMed] [Green Version]
  92. Nagl, W.; Habermann, T.; Fusenig, H.P. Nuclear DNA contents in four primitive angiosperms. Plant Syst. Evol. 1977, 127, 103–105. [Google Scholar] [CrossRef]
  93. Zhang, X.M.; Wen, J.; Dao, Z.L.; Motley, T.J.; Long, C.L. Genetic variation and conservation assessment of Chinese populations of Magnolia cathcartii (Magnoliaceae), a rare evergreen tree from the South-Central China hotspot in the Eastern Himalayas. J. Plant Res. 2010, 123, 321–331. [Google Scholar] [CrossRef] [PubMed]
  94. Yu, H.H.; Yang, Z.L.; Sun, B.; Liu, R.N. Genetic diversity and relationship of endangered plant Magnolia officinalis (Magnoliaceae) assessed with ISSR polymorphisms. Biochem. Syst. Ecol. 2011, 39, 71–78. [Google Scholar] [CrossRef]
  95. Li, J.M.; Jin, Z.X. Genetic structure of endangered Emmenopterys henryi Oliv. Based on ISSR polymorphism and implications for its conservation. Genetica 2008, 133, 227–234. [Google Scholar] [CrossRef] [PubMed]
  96. Al-Turki, T.A.; Al-Namazi, A.A.; Al-Ammari, B.S.; Al-Mosallam, M.S.; Basahi, M.A. Ex-situ conservation of wheat genetic resources from Saudi Arabia. Saudi J. Biol. Sci. 2020, 27, 2318–2324. [Google Scholar] [CrossRef] [PubMed]
Figure 1. Geographic distributions and phylogenetic network diagram of six chloroplast DNA (cpDNA) haplotypes detected in M. sprengeri. The size of the circle in the network graph corresponds to the proportion of haplotype occurrence frequency in all populations. The largest circle represents the haplotype with the most individuals, and the color of the circle matches the haplotype color in the distribution.
Forests 12 00931 g001
Figure 2. Phylogenetic tree based on maximum likelihood (ML) and Bayesian analysis. Numbers on the branches in the ML/Bayesian tree indicate bootstrap values/posterior probabilities, with only above 50% showing; HP1-6, Haplotypes1-6; LI, Magnolia liliiflora Desr.
Forests 12 00931 g002
Figure 3. Pairwise mismatch distributions for 87 cpDNA of M. sprengeri.
Forests 12 00931 g003
Figure 4. The area under the receiver-operating characteristic curve measured by MaxEnt in four different periods, i.e., Present, Last Glacial Maximum (LGM) with Community Climate System Model (CCSM), LGM with Model for Interdisciplinary Research on Climate (MIROC) and Last Interglacial Age (LIG).
Forests 12 00931 g004
Figure 5. The results of the jackknife test of variables’ contribution in modeling M. sprengeri’s habitat distribution in four different periods. The regularized training gain describes how well the MaxEnt distribution fits the presence data compared to a uniform distribution. The dark blue bars indicate the gain from using each variable in isolation; the light blue bars indicate the gain lost by removing the single variable from the full model; and the red bar indicates the gain using all of the variables.
Forests 12 00931 g005
Figure 6. Response curves of existence probability of M. sprengeri to the main climatic factors.
Forests 12 00931 g006
Figure 7. Potential distribution for M. sprengeri during different periods predicted by the MaxEnt model based on optimized parameters. The potential distribution of M. sprengeri was divided into four grades by the natural breaks method. Gray, green, yellow, and red areas represent not suitable, marginally suitable, moderately suitable, and highly suitable areas, respectively.
Forests 12 00931 g007
Figure 8. Present and predicted distribution ranges of M. sprengeri under four climate change scenarios in the years 2050 and 2070: RCP2.6; (a,e), RCP4.5; (b,f), RCP6.0; (c,g) and RCP8.5; (d,h). The green area represents the overlap of the present and the predicted ranges; blue represents potential range expansion; and red represents potential range contraction.
Forests 12 00931 g008
Table 1. Genetic diversity estimated by chloroplast DNA (cpDNA) concatenated fragments in M. sprengeri.
N 1S 2H 3Hd 4π 5Tajima’s DHS 6HT 7GSTNST
871060.1960.0669−1.730.0680.1690.5950.268
1 Sample size; 2 Nucleotide substitutions; 3 Number of haplotypes; 4 Haplotype diversity; 5 Nucleotide diversity; 6 Average within-population diversity; 7 Total genetic diversity.
Table 2. Analyses of molecular variance (AMOVA) in M. sprengeri populations based on cpDNA sequences.
Source of Variationd.f.Variation ComponentsPercentage of Variationp
Among populations190.04727.61% 1≤0.005
Within populations510.12372.39%≤0.005
1 FST (F-statistics) = 0.276.
Table 3. Description of environmental variables used in this study.
TypeVariableCode
climateMean diurnal temperature range/°Cbio2
Isothermality/%bio3
Temperature seasonality (standard deviation)bio4
Mean temperature of the driest quarter/°Cbio9
Mean temperature of the warmest quarter/°Cbio10
Mean temperature of the coldest quarter/°Cbio11
Annual precipitation/mmbio12
Precipitation seasonality (standard deviation)bio15
Table 4. Contribution rate of each environmental variable.
PeriodBio2Bio3Bio4Bio9Bio10Bio11Bio12Bio15
Percent contributionLIG27.70.95.530.19.3718.21.3
LGM (CCSM)28.50.94.625.19.811.818.60.7
LGM (MIROC)30.714.129.210.25.118.51.2
Present26.30.54.735.210.13.318.51.3
Permutation importanceLIG13.734.355.320.52.40.7
LGM (CCSM)0.210.931.449.11.91.54.20.6
LGM (MIROC)1.213.230.639.62.266.60.7
Present2.76.230.348.71.95.14.50.7
Table 5. Characteristics of potential distribution in different periods for M. sprengeri.
PeriodArea of Each Suitable Region (×104 km2)
Marginally Suitable RegionModerately Suitable RegionHighly Suitable RegionTotal Sutable Region
LIG32.4895813.722227.8020854.01388
LGM (CCSM)56.4913243.9965326.97917127.46702
LGM (MIROC)51.8802157.4218829.22743138.52952
Present71.3055629.9704915.03125116.30730
Table 6. Four emission scenarios using in this study.
EmissionDescription
RCP 1 8.5The radiative forcing rose to 8.5 W/m2, and the CO2 equivalent concentration reached about 1370 mL/m3 in 2100.
RCP6.0The radiative forcing stabilized at 6.0 W/m2, and the CO2 equivalent concentration stabilized at about 850 mL/m3 after 2100.
RCP4.5The radiative forcing stabilized at 4.5 W/m2, and the CO2 equivalent concentration stabilized at about 600 mL/m3 after 2100.
RCP2.6The radiative forcing reached its peak before 2100 and decreased to 2.6 W/m2 by 2100. The peak CO2 equivalent concentration was about 490 mL/m3.
1 Representative Concentration Pathways.
Publisher’s Note: MDPI stays neutral with regard to jurisdictional claims in published maps and institutional affiliations.

