Article

Performance of Small-Scale Sawmilling Operations: A Case Study on Time Consumption, Productivity and Main Ergonomics for a Manually Driven Bandsaw

by
Stelian Alexandru Borz
1,
Maryam Oghnoum
1,
Marina Viorela Marcu
1,
Arpad Lorincz
1 and
Andrea Rosario Proto
2,*
1
Department of Forest Engineering, Forest Management Planning and Terrestrial Measurements, Faculty of Silviculture and Forest Engineering, Transilvania University of Brasov, Şirul Beethoven 1, 500123 Brasov, Romania
2
Department of AGRARIA, Mediterranean University of Reggio Calabria, Feo di Vito snc, 89122 Reggio Calabria, Italy
*
Author to whom correspondence should be addressed.
Forests 2021, 12(6), 810; https://doi.org/10.3390/f12060810
Submission received: 30 April 2021 / Revised: 10 June 2021 / Accepted: 16 June 2021 / Published: 19 June 2021

Abstract

:
Sawmilling operations represent one of the most important phases of the wood supply chain, because they connect the conversion flow of raw materials into finite products. In order to maintain a high volume of processed wood, sawmills usually adopt different processing strategies in terms of equipment and methods, which can increase the value or volume of the lumber produced from logs. In this study, the performance of small-scale sawmilling operations was monitored, whilst also evaluating the exposure of workers to harmful factors. An assessment of time consumption, productivity, and main ergonomics was conducted during the use of a manually driven bandsaw. In addition, the exposure to noise was investigated to complement the knowledge in this regard. The results indicated a rather high time utilization in productive tasks, which may come at the expense of exposure to noise and to poor working postures. The modelling approach resulted in statistically significant time consumption models for different phases (blade adjustment, effective sawing, returning, unloading lumber, and loading and fixing lumber). The exposure to noise was close to 92 dB (A) (8 h) and, therefore, the level of emitted noise is likely to depend on the condition of the used blades, species sawn and on the dimensional characteristics of the logs. In terms of ergonomic risks, the poorest postures were those related to tasks such as moving the logs, loading the logs, fixing the logs, rotating and removing the logs, as well as unloading the lumber.

1. Introduction

With the growing demand for wood-based products in recent years, wood processing industries are constantly looking for ways to increase the value and quantity of their products. In this context, sawmills are important and indispensable components of the wood supply chain because they connect the conversion flow of raw materials into finite products [1,2,3]. Sawmilling, which is typically seen by many as a simple manufacturing process, is rather a complex technical workflow characterized by a substantial number of dissimilar processing elements, each one featuring a different level of automation that must be constantly monitored to maintain long-term profitability [4]. It turns out that the important factors that affect the sawmilling operations are those related to the log supply, engineered production facilities, proper training of the operators, and analysis of raw material resources and product lines.
In some countries, many sawmills still rely on rather obsolete equipment and machines, if such equipment preserves an acceptable level of productivity. On the other hand, such operational configurations are likely to create many problems and jeopardize both the safety and health of the workers. In addition, they often determine the capacity of given facilities in terms of volumes processed annually, which is a criterion used to categorize the sawmills, and to differentiate “small” from “medium” and “large” mills [5].
In order to maintain a high volume of processed wood, medium and large sawmills usually adopt more efficient processing strategies in terms of equipment and methods that can increase the value or volume of the lumber produced from logs. Small sawmills, on the other hand, do not hold the ability to use advanced technologies due to various financial and technical reasons [6], and, therefore, traditional sawing practices are still being used in rural areas and underdeveloped territories. However, these practices result in lower performances, which makes it more difficult for small sawmills to survive in the current conditions of a highly competitive industry.
Even in such conditions, small sawmills are important components of the industry because they sustain several essential functions, such as substituting the large sawmills in those market conditions in which the latter could not operate feasibly. They may also serve as auxiliaries that utilize timber of sizes and kinds not suitable for the large mills [5], sustain the local supply, substitute imports, support rural employment, and contribute to local earnings by exports [7]. For these reasons, the study of the production chain in small sawmills is of fundamental importance for a better management of the whole wood supply chain, and a way to increase the lumber value is to optimize the performance of cutting operations. In the wood products industry, research generally addresses the process efficiency and cost-competitiveness, such as, for instance, in the fields of harvesting and logistics [1], and operational efficiency [8,9,10].
FAO [7] suggested to consider the average volume of sawn wood produced per shift as a predictor for a rapid comparison of mill performance in small and medium sawmills. De Lima [11] studied the production level for the different sizes of logs in the processing industry of the Amazon region, and Pinto [8] evaluated the impact of raw material and process characteristics on the production performance using the WoodCIM® optimization software (VTT Building Technology, Espoo, Finland). Wang [12] introduced a new measure that better reflects the sawmilling performance, proposing a new performance index, called the 4-F, which considers the following four factors: product mix, lumber recovery, log processing rate, and log diameter. These studies showed the importance of improving the sawing process, by introducing new adjustments to increase the productivity and lumber yield in small sawmills.
At the same time, the lack of modernization, which is specific to these sawmills, exposes the operators to a greater range of risks to their health, by the nature of the job, type of equipment used, and the handled materials. In particular, a low level of automation in these facilities often results in more manual work and a higher exposure to different types of machinery-induced hazards. Different types of machinery cause different hazards, and several studies classified them as mechanical, physical, structural, ergonomic, chemical, and biological [4,13,14]. Therefore, depending on the level of automation, the risk factors that are relevant for the operators’ health and safety will be different. If manual operations are dominant in a production facility, some types of risk will have a major incidence, and for this reason, small sawmills represent a workplace that is potentially dangerous. Teparkson [15] described several high-risk areas in 20 small and medium sawmills using the job safety analysis (JSA) to identify hazards of the working processes; exposure to high amounts of wood dust and noise when sawing lumber, as well as the risk of occupational accidents of the hands and feet were relevant features identified by the mentioned study. Zimbalatti et al. [4] defined three classes of risks by monitoring nine Italian small sawmills characterized by a highly deficient work organization, and a lot of gaps in terms of compliance with safety and hygiene standards. In fact, Tremblay [16] suggested that occupational health and safety are poorer in small- and medium-sized enterprises than in large corporations, as well as some injuries being as much as 50% more likely to occur. In Canada, Jones and Kumar [17] evaluated the musculoskeletal injuries on ninety-three workers, comparing different ergonomic risk assessment methods; they identified the RULA (rapid upper limb assessment) and SI (strain index (SI)) as the best ergonomic risk assessment methods, while Poisson [18] identified several risks linked to machinery in eight small–medium sawmills. Malkin et al. [19] characterized the small-scale pallet production facilities as holding significant occupational safety and health risks, which were difficult to prevent due to the few resources available for investment, and the lack of ability in identifying and managing occupational hazards.
Studies on the performance of small-scale sawmilling operations are rather scarce. They have focused on the productivity, lumber and value recovery, finding significant relations between the productivity and the variation in the sawmilling inputs and outputs. Some of them are included in the Discussion section of this study, generally showing the dependence of productive performance on the type and scale of the sawmilling facilities. No studies have been found to focus their attention on a more integrated analysis, which would include the exposure to harmful factors in addition to productivity. As a fact, these two topics were frequently studied separately, but they may be tightly correlated in the real operational world. For these reasons, the aim of this study was to evaluate the performance of small-scale sawmilling operations in terms of productivity and exposure to harmful factors, such as the noise and risks of developing musculoskeletal disorders. The evaluation of productive performance was centered around the inputs, resources used, and outputs, by assuming as a leading hypothesis a strong dependence relation between their variation. The potential impacts on the health and safety of the work were evaluated by methods specific to ergonomics, and by assuming the general hypothesis that exposure to noise would exceed the accepted limits, while the postural analysis would yield results indicating the need for improvement.

2. Materials and Methods

2.1. Sawmilling Facility, Organization of Work and Description of Equipment

The general data used in this study covered 7 operational days and they were collected in the hangar of the SC COM-EXPLOFOR SRL company, which is based in Căpâlniţa, Harghita County, Romania at approx. 46°35′50.76″ N, 25°51′17.69″ E. The sawmilling company was established in 1993 and currently it processes coniferous wood, mostly Norway spruce (Picea abies Lam. (Limk.)) and silver fir (Abies alba Mill.). While the company employs three workers, of which one is the company holder, and an author of this study, wood sawing is typically carried out by a single worker, using a horizontal manually driven band saw.
During the data collection, the typical work organization consisted of manual moving of the logs near the band saw, manual loading of the logs onto the bandsaw’s log-fixing frame, manually fixing the logs in the clamps, manual adjustment of the sawing height, manually driven blade feeding into the log, manual removal and rotating of the processed products, manual retraction of the sawing frame, as well as other work-related and non-work tasks consisting of workplace cleaning, preparation of work, technical and personal delays. In this configuration, the logs were fixed at the middle of the rolling rail by clamps placed at each 2 m. The length of the rolling rail was of 10 m, resulting in a maximum sawing length of ca. 8.5 m. The maximum sawing diameter enabled by the machine was of 74 cm, while the bandsaw was powered by a 7.5 kW electrical engine and it used water-cooled blades of 4585 mm in length and 38 mm in width, with a thickness of 1.1 mm and a pitch of 2.2 mm. A detailed explanatory description of the machine is given in Cheţa et al. [20].

2.2. Data Collection and Analysis

In regards to the efficiency of production, an observational modelling approach was used in this study, aiming to quantify and model in detail the time consumption, efficiency, productivity and recovery rate as figures and functions of the product input–output variation, using the general concepts and techniques described in [21,22]. Time consumption data were collected by video recording, which was done for each operational day. Each of the processed logs was measured and labelled by painting (Figure 1) and the division of work at elemental level was based on a detailed video analysis done in the office phase of the study.
Table 1 shows the main parameters used in the evaluation of production efficiency. As shown, the elemental time study was based on the typical functions enabled by the operation of machine and on the delay types and durations found during the analysis of video files. Time consumption was accounted in seconds, diameters and lengths of the logs were measured to the nearest centimeter and the volume of logs, production and residues were estimated in cubic meters based on the above data. Measurements made on the logs and production were noted into a field book, then they were transferred into a digital database. Estimation of time consumption was done using the general procedures of the snap-back chronometry [23], and it was assisted by a Microsoft Excel ® (Redmond, WA, USA) spreadsheet that covered the operations done to process 86 logs. Based on the data shown in Table 1, the needed performance indicators were estimated according to Equations (1)–(7).
In regards to the exposure to noise, the approach was intended to cover all the seven days taken into study. However, the data from one operational day were lost due to a battery malfunction; as such, the exposure to noise was restricted to and estimated based on the data coming from six days, accounting for the time observed from the beginning to the end of each day, which covered, in total, a number of 186,000 observations taken at sampling rate of 1 Hz. Data collection was done according to the procedures outlined by the European regulations and standards [24], by the use of a small, class 2 standard [25] Extech® 407760 (Extech Instruments, FLIR Commercial Systems Inc., Nashua, NH, USA) noise-level datalogger placed on the helmet of the operator (Figure 1), in accordance to the provisions of relevant standards. Evaluations were designed to estimate the exposure to noise normalized for an 8-h working day (LEX,8h, dB (A)), which followed the typical workflow of estimating the A-weighted equivalent continuous sound pressure level (LAeq, dB (A)), and the A-weighted sound pressure level for a daily sample (LAeq,Te). All the procedures and software used were similar to those described in [26,27].
DFCT = tP + tL + tA + tS + tR + tF + tU
CT = DFCT + TTD + TPD + TMD
GPR = P/CT
NPR = P/DFCT
GER = CT/P
NER = DFCT/P
RR = P/V
where DFCT is the delay-free cycle time accounted both at the work cycle level and as the total delay-free time (s), CT is the cycle time including all delays, except those caused by the study (tM—time spent to measure the logs and production), accounted both at the work cycle level and as the total time (s), GPR is the gross productivity rate (m3 h−1), NPR is the net productivity rate (m3 h−1), GER is the gross efficiency rate evaluated based on the time resources (h m−3), NER is the net efficiency rate evaluated based on the time resources (h×m−3) and RR is recovery rate estimated both at the log and at the production level (%).
To evaluate the risks of developing musculoskeletal disorders, a postural analysis was implemented based on the Ovako working posture analysis system (OWAS), which aimed at characterizing the postures of the back, arms and legs, as well as to classify the postural analysis outcomes on action categories (AC) and to compute a global postural index (PRI), as a metric [28,29], to evaluate the postural exposure hazards of the studied operations. The framework of the postural analysis was based on its original concept [30,31], and it took into consideration a global analysis based on a random work sampling approach. The random sampling was conducted in two stages, of which one consisted of a detailed check of the outputs given by the analysis of time consumption data, to select a number of representative operational days. Following this stage, three days were considered for the extraction of sample data. Procedurally, this was done by the methods described in [32,33], by generating sets of 100 pseudorandom numbers each, which were then used to extract their corresponding still frames from the sets of frames sampled at 1 Hz from each media file (20 min per media file) of each operational day (28, 25 and 29 media files, respectively). The approach resulted in the extraction, detailed analysis and coding of 8200 images, of which those failing to provide all the information needed for a detailed documentation of the postures of back, arms and legs (force exertion was assumed to be in the most favorable condition) were disregarded from the statistical analysis. Following this exclusion step, the remaining valid images accounted for 2999 observations. To characterize the validity of the sampling outcomes, margins of errors were estimated based on the relative frequency data found at action category level, and on the number of observations, by assuming a confidence interval set at 95% and by using the commonly known computation equations [34,35].
Statistical analysis consisted of several steps and procedures that were taken to accommodate the type of data taken into analysis. Data on time consumption and productive performance were checked for normality using a Shapiro–Wilk test that was applied to all the variables taken into study, then a correlation analysis was done for all the independent variables to check the opportunity of building multivariate regression models needed to predict the time consumption and other performance metrics related to productivity. A threshold set at 0.5 for the correlation coefficient was considered to exclude the independent, logically chosen variables, based on a pair-by-pair analysis (e.g., [36]). Following these statistical steps, descriptive statistics were estimated for each variable taken into analysis, and modelling techniques were used by the means of simple regression to check the dependence between the time consumption and independent variables such as the diameter of the logs, volume of the logs and the number of produced wood pieces. Significance of the developed models and of the independent variables were tested and evaluated for a threshold set at α = 0.05 using the p-values as a criterion (p ≤ 0.05). The predictive capacity of the developed models was evaluated by the magnitude of the coefficient of determination (R2) based on multiple tests that have been done for each pair of variables to check which type of equation provided the best capacity to explain the variability in data. To this end, linear, polynomial, exponential and power functions were tested (fitted) for all the elemental time consumption models as well as for the models developed in the case of relevant performance metrics (productivity and efficiency rates). The models were developed both as equations along with their main characterization metric—the coefficient of determination (R2)—as well as graphs to enable the observation of data behavior; the final selection of the equation type was based on the magnitude of the coefficient of determination (R2).
Analysis of the data collected on the exposure to noise has followed the typical workflow of data transformation and summarization to extract the values of exposure to noise in accordance to the relevant standards and scientific practices [4,6]. In addition to the metrics evaluated for the exposure to noise, data characterizing the observed time were reported for each day of observation to enable judgments on the produced metrics.
Data on postural analysis were organized in a matrix to enable a quick counting of absolute frequencies on body parts, codes and action categories, as well as to enable the calculation of relative frequencies. Based on this database, the usual formulae and statistical approaches were used to describe the data graphically [26,32,33] and to estimate the postural risk index [28]. Relative frequencies on action categories were then used to estimate the margins of errors as described in [34,35].
Data processing and analysis was supported by Microsoft Excel ® (Redmond, USA) fitted with the Real Statistics add-in. The same software was used to produce most of the artwork used in this study.

3. Results

3.1. Descriptive Statistics of Production

The main descriptive statistics related to production are shown in Table 2. A number of 86 logs (approximately 26 m3 over-bark) were processed during the observations made by this study (73 were Norway spruce and 13 were silver fir logs). Taken on specific days, the processed logs were rather evenly distributed, accounting for 11, 14, 11, 11, 13, 14 and 12 logs, respectively, while their dimensional characteristics varied largely in terms of diameter (average diameter of 12 to 56.5 cm), length (200 to 700 cm), and volume (0.057 to 1.516 m3).
The total study time was approximately 51 h, out of which the delay-free time accounted for 89.2%. On average, in the delay-free cycle time category, effective sawing accounted for the most, being followed by the preparation of workplace, loading and fixing lumber, returns of the saw, adjusting the sawing height, unloading lumber, and log loading. The production over the studied period accounted for 695 pieces of lumber having various sizes, resulting in a volume of production of approximately 18 m3, a volume of residues of approximately 8 m3, and a recovery rate that varied largely between 38.8 and 95%, averaging approximately 69%. As expected, the net production rate (NPR) was low, averaging approximately 0.5 m3 × h−1. The recorded delays significantly affected the production efficiency, since the gross production rate was estimated at a figure of approximately 0.4 m3 × h−1. In these conditions, the efficiency rate estimated, based on the time consumption and production, was of 2.045 and 2.539 h × m−3 for the net and gross figures, respectively.

3.2. Input–Output Models

The best-fitting models characterizing the statistical relations between the outputs and inputs were the second-order polynomials (Figure 2). No attempts were made to build multivariate models, since the correlation of the independent variables was very high.
Variation in the number of produced pieces (NP) was explained almost linearly by the average diameter of the log (Figure 2a). However, the same variable was explained by a more pronounced polynomial model when the chosen predictor was the log volume (Figure 2b). The same happened in the cases of production (P, m3) and residues (R, m3), as explained by the average diameter (D, cm) and volume of the logs (V, m3). While there were some variations, the ratio of production to residues was less explained by the log size and it stayed below four for most (95%) of the cases (data not shown herein). Statistically, the relations between the inputs and outputs of production were meaningful, since the coefficients of determination approached values of 0.9–1.0 for most of the developed models.

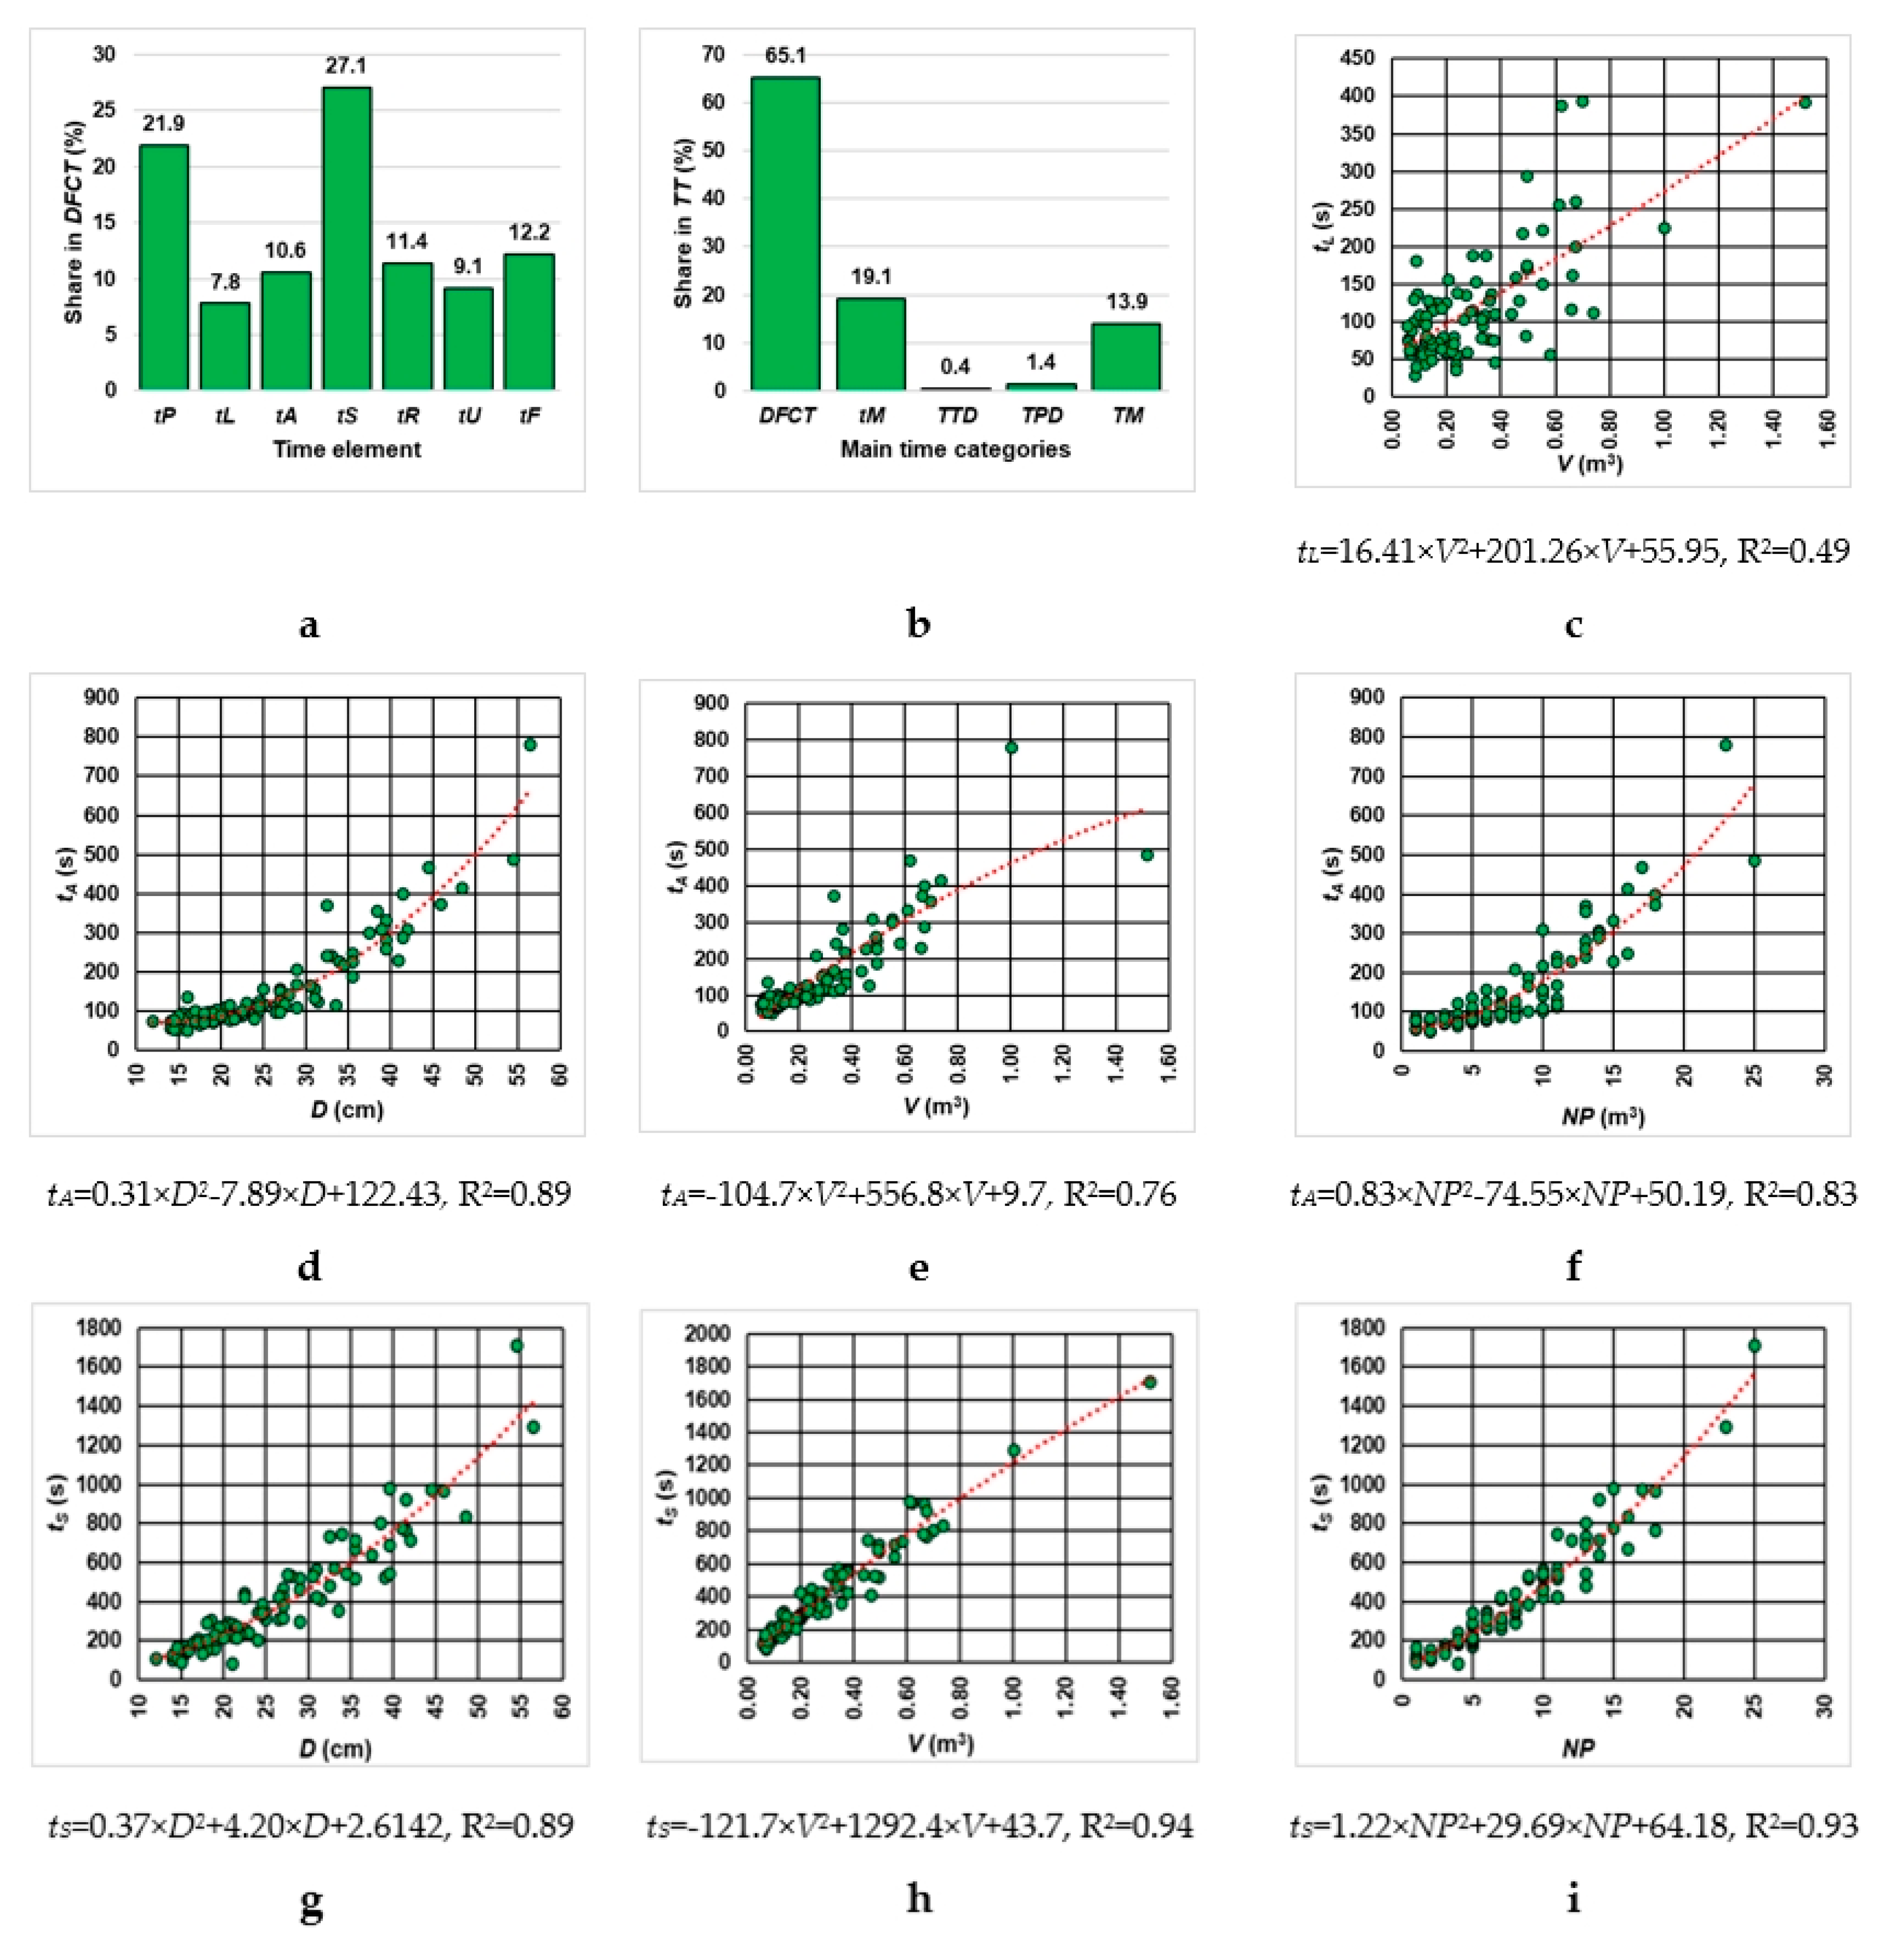
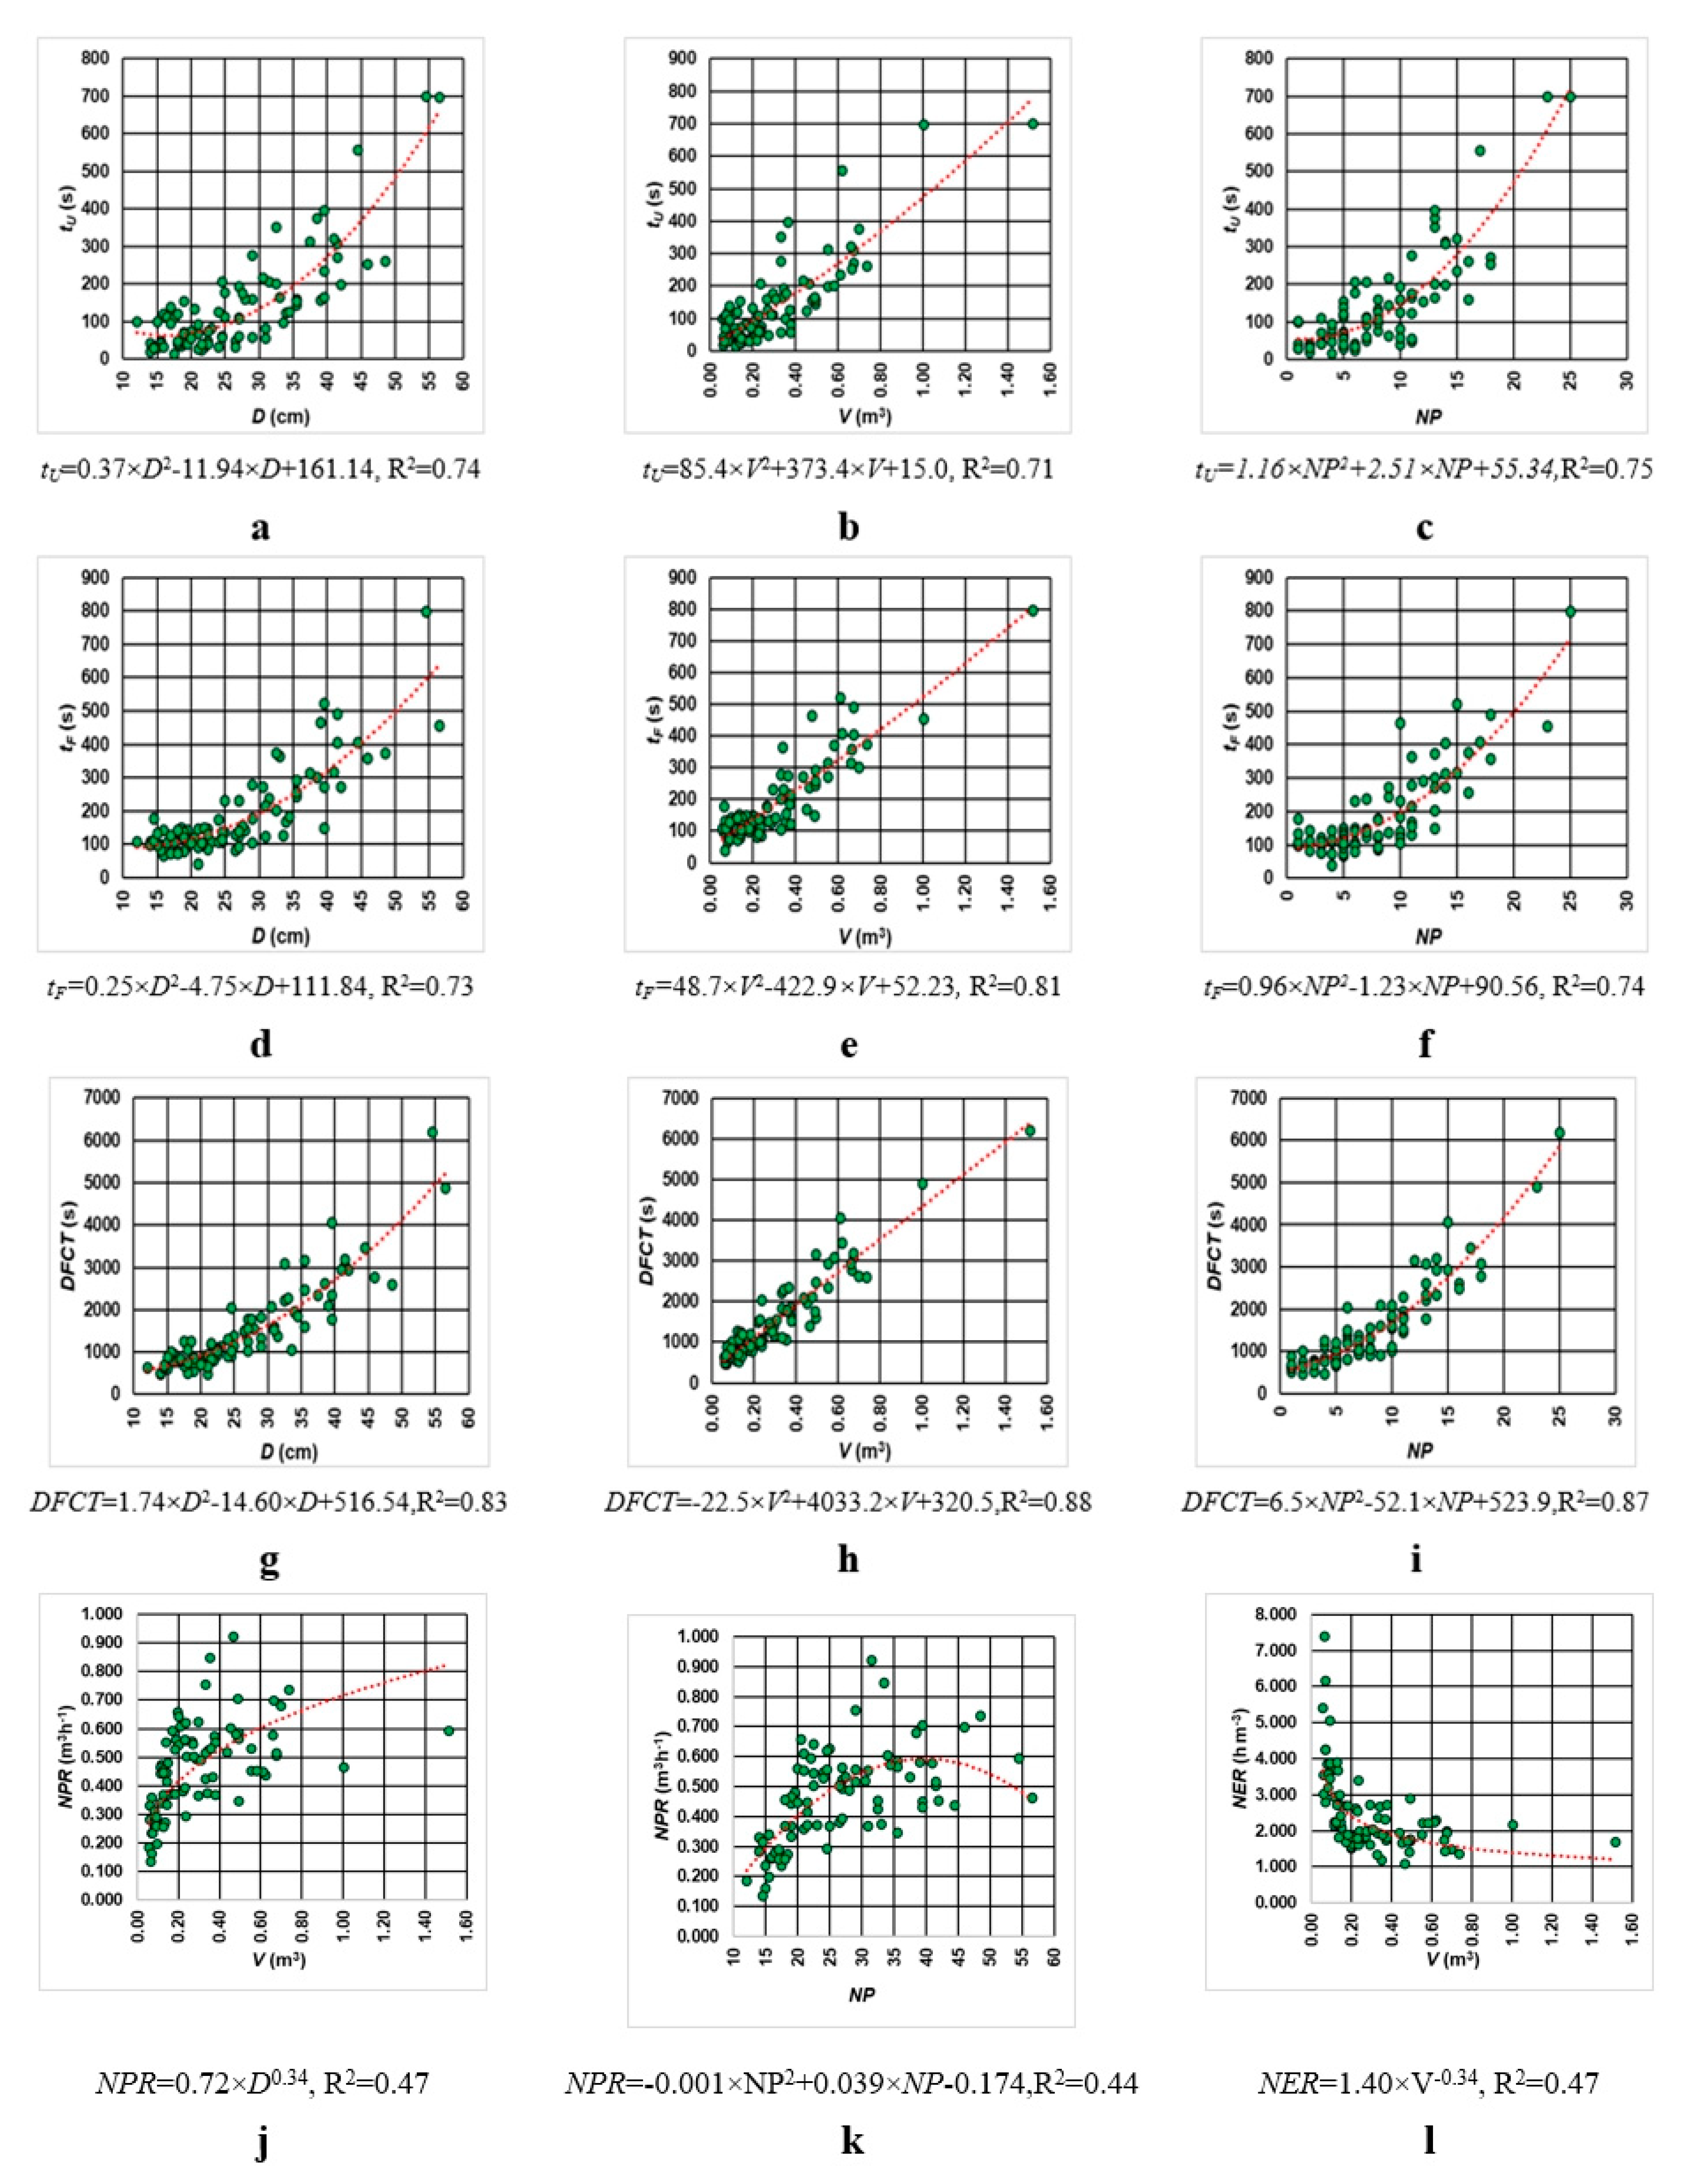
3.3. Time Consumption and Efficiency Models

A delay-free work cycle time consisted of approximately 27% of the time spent in effective sawing, 22% in preparing the operations, 12% in fixing lumber, 11% in saw returning and adjusting the cutting height, 9% in unloading and 8% in loading the logs on the machine (Figure 3a). However, the delay-free cycle time accounted for only 65% of the total observed time, which was affected by the measurements taken and by different kinds of delays (Figure 3b).
The log loading time (tL) model was found to be the least accurate one when trying to explain its time consumption variation as a function of the log volume (V). As shown in Figure 3c, the variation in log loading time consumption was explained by a second-order polynomial model only to an extent of 49%. However, the modelling approach resulted in significantly improved time consumption models for the rest of the work elements, such as the blade adjustment (tA, Figure 3d–f, R2 = 0.76–0.89), effective sawing (tS, Figure 3g–i, R2 = 0.89–0.94), unloading lumber (tU, Figure 4a–c, R2 = 0.71–0.75), and loading and fixing lumber (tF, Figure 4d–f, R2 = 0.73–0.81), respectively. By using second-order polynomial models (Figure 4g–i), the delay-free cycle time (DFCT) was explained by the average diameter of the log (D), volume of the logs (V), and number of produced pieces (NP), in proportions of 83, 88 and 87%, respectively. The net productivity rate (NPR, m3 × h−1), on the other hand (Figure 4j,k), was influenced by both the average diameter of the logs (D) and the log volume (V), which, taken independently as predictors, explained its variation in proportions of 47 and 44%, respectively. The best model in the case of using the average diameter of the log was found to be exponential (Figure 4j), while the best one in the case of the log volume was a second-order polynomial function, which may show, very well, a point of capability after which the productivity starts to decrease (Figure 4k). The variation in net efficiency rate (NER, h × m−3) was found to be explained by the volume of the processed logs (V) to an extent of 47% when using an exponential model.

3.4. Exposure to Noise

Figure 5 shows the distribution of the measured sound pressure level in the time domain, which was used to compute the main metrics related to the exposure to noise. It was virtually impossible to separate the effect of noise sources other than the machine taken into study (i.e., the circular saw, which was rarely operated during the study); therefore, the metrics apply to the description of the exposure to noise in the sawmilling facility, the results of which mostly characterize the exposure due to the operation of the band-saw. It is worth mentioning here that the engine of the band-saw was turned off after most of the active sawing tasks, as well as the fact that the data applies to the worker operating the machine, and they include different kinds of delays.
Based on the data shown in Figure 5, the main metrics related to the exposure to noise are reported in Table 3. As shown, except the third and sixth day, the observation time was somehow similar and it accounted for more than 8 h per day. However, in the third and sixth days, the observed time was less than 8 h. By considering this kind of distribution and by also taking into account the engine utilization rates, the results on the equivalent sound pressure levels at the daily level have shown close figures (Table 3). Based on this data, and by taking into consideration the number of observed days, the exposure over the observed time yielded a value of 83.52 dB (A). Also, the normalized level of exposure has returned a value of 91.62 dB (A).
Compared against the relevant standards [24], the results shown in Table 3 are proving the fact that the exposure to noise exceeded the 80 dB (A) minimum action level in each day of the observation. While the analysis of exposure to noise was not oriented towards a task-level approach, one still needs to be aware of the fact that from the total time, those close to 9 h were identified as delays (Table 2). As such, increments in the productive time will only lead to increments in the exposure to noise. Taken on a daily basis (Table 3), the exposure to noise did not exceeded the exposure limit value set at 87 dB (A); however, the normalized exposure to noise for a nominal day of 8 h did exceed this threshold.

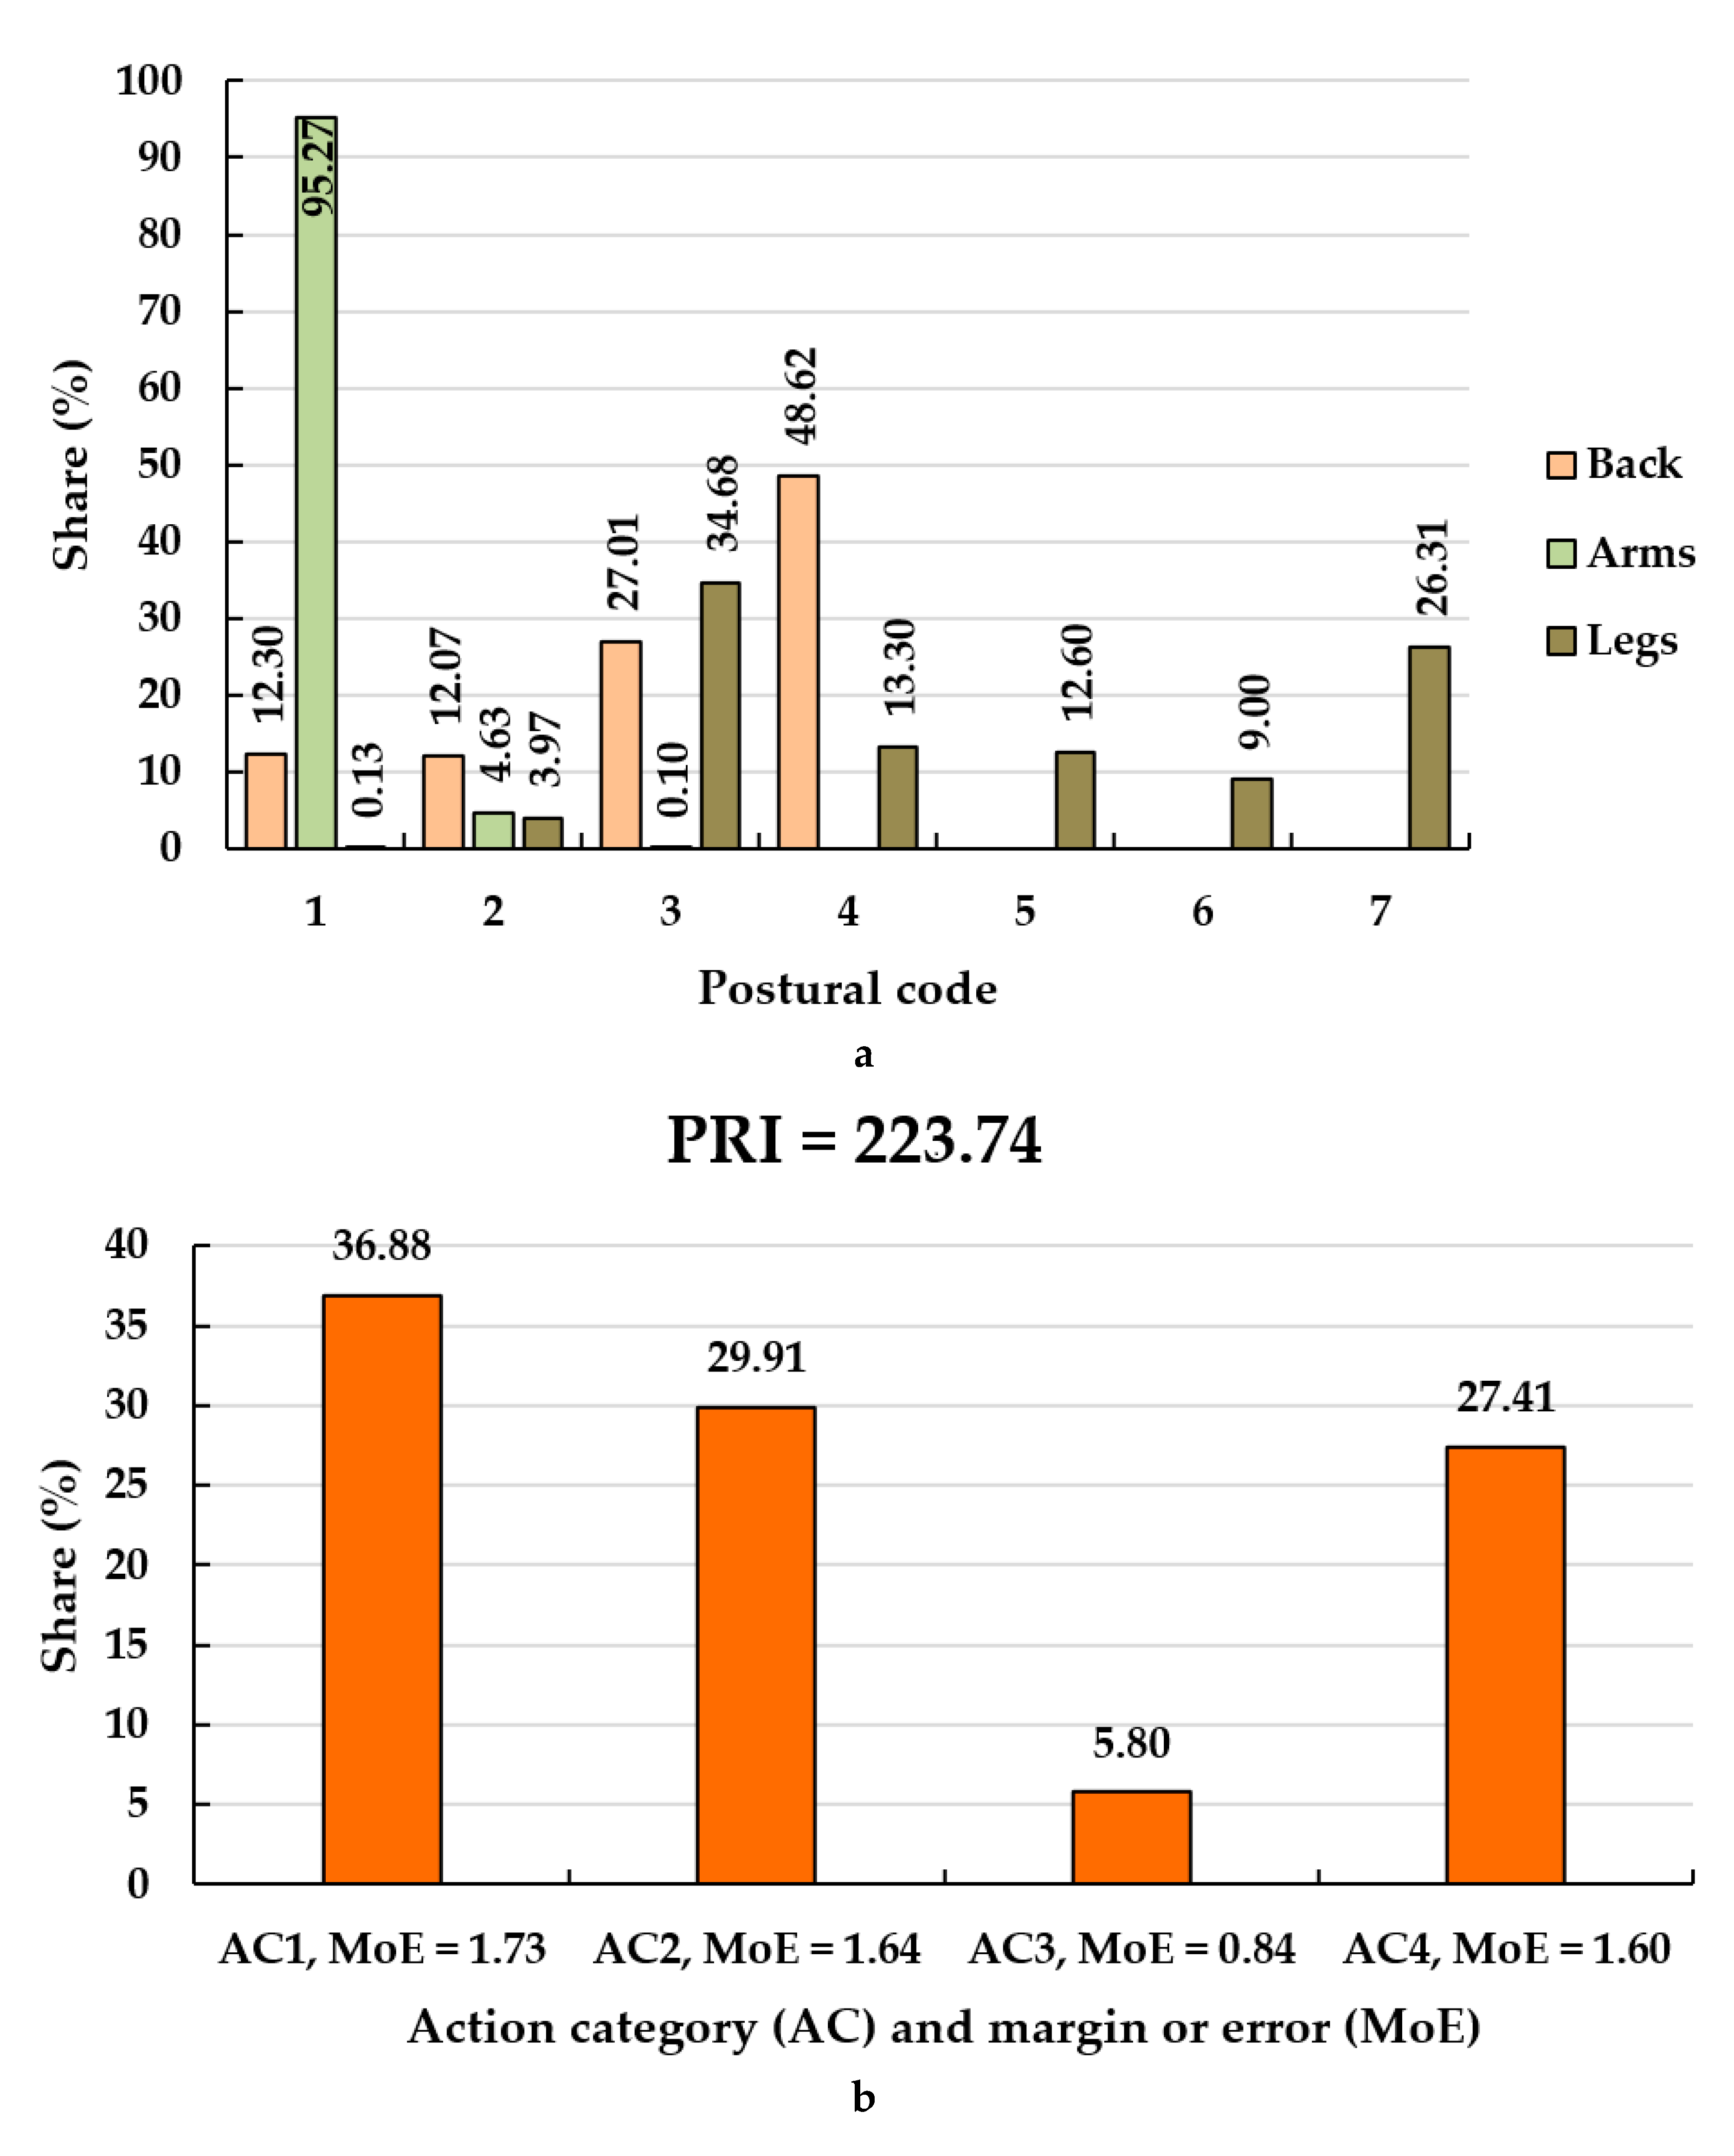
3.5. Postural Assessment

The results on the postural assessment are given in Figure 6, which shows a breakdown of the relative frequencies on postural codes (Figure 6a) and on action categories (Figure 6b). In regards to the postures of the back, the results indicate that close to 50% of the observations were identified with the back of the worker in the worst posture (code four—back was bent and twisted, or bent forward and sideways), followed closely by the posture coded by three (back twisted or bent sideways). However, the postures of the arms were codded to a great extent by one, which means that no problematic situations were found for this body segment (both arms below shoulder level). In regards to the legs, the relative frequencies on codes three, four, five and six accounted for a share of almost 70%, while these codes indicate uncomfortable postures, such as standing with the weight distributed on a single straight leg, standing or squatting with both knees bent, standing or squatting with one knee bent, and kneeling on one or both knees, respectively. Force exertion was difficult to evaluate and it was assumed to be always below 10 kg. However, one could mention that some cases could have required the exertion of higher forces to carry on some work tasks, such as those that were characteristic to log loading. Therefore, the results shown in Figure 6b are indicative, showing a minimal strain evaluated by the method in the observed conditions. To this end, the distribution in the action categories has shown a dominance of the postures categorized in the action category one, followed by those from action categories two and four. Based on this data, the postural risk index was evaluated at ca. 224, a figure that indicates the need of some corrective action in the near future. The results on the estimation of the margins of errors (Figure 6b) have indicated the behavior known by definition, according to which the margin of error will increase for those categories for which the relative share approaches the limit of 50%.
For this study, the highest margin of error was found for the first action category (AC1) and it amounted ±1.73%, a maximal result that may be used to interpret the validity of the postural analysis. From this point of view, it seems that the results on the relative frequencies in the action categories were accurate.

4. Discussion

In a sawmill, the factors affecting the performance are various and some of them are conditioned by the human operational decisions and errors, which in turn affect the production yields. Furthermore, the variable and irregular dimensions of the logs require adaptations of the sawing patterns and, in many cases, restrict the equipment utilization at full capacity, also contributing to producing more waste (sawdust). Several studies concerning wood processing from a system perspective have been carried out in the wood processing industry. Kempthorne [37] simulated a small sawmill with dimensionally variable inputs to increase its output. Hyytiäinen [38] assessed the level of technical efficiency in the Finnish independent sawmills production, identifying a moderate possibility to increase the production by rationalizing the use of current production technology. The author evaluated the efficiency at 61–66% using a stochastic analysis, with results that support the data obtained in this study. Kehinde et al. [39] monitored 52 small-scale sawmills in Nigeria and found a log conversion ratio of about 58%. De Lima et al. [11] attributed low yields to species characteristics factors, such as conicity and tortuosity, log diameter, cutting techniques, and the equipment used. In fact, these defects may limit the use of wood and generate excessive waste. Therefore, the volume yield is affected by different parameters, of which some are manageable, such as the log dimensions, while others, unfortunately, are nonavoidable, such as the defects and cracks. For example, the logs of the same diameter class may give yield values characterized by a low variation [3,11,40], especially in small sawmills where the machine operator manually chooses the dimensions of the sawn wood and the sawing pattern. To confirm the influence on the variation in performance in our study, Helvoigt and Adams [41] reported similar statistically significant relationships between sawlogs and sawn wood when analyzing the productivity by a 30-year study period in the Pacific Northwest sawmill industry.
As found by this study, the factors affecting the operational performance were those generally reported in similar studies, describing significant dependence relations between the parameters characterizing the dimensions of the inputs and the time consumption (e.g., [42,43,44,45]), which in turn affect the variation in productivity and efficiency. Such model parameters estimated by this study are confirmed by their counterparts found for similar machine types and sizes (e.g., [42,43,44]). In this regard, however, one of the merits of this study is that it maps the relations between the inputs, resources used, and outputs, by a system-centered perspective, providing detailed models characterizing such dependence relations. As such, the developed models not only indicate a status quo, but they can also be used for reengineering purposes or for optimization.
A number of studies have been conducted on workers’ risk evaluations, and have suggested that these conditions may be associated with behavior in respect to hazard sources and safety in occupational settings [8,22,23,46]. According to Owoyemi et al. [47], the noise from operating saws ranges from 80 to 120 dB. Moreover, even when idling, saws can produce noise levels of up to 95 dB. These findings are in line with the value of 91.6 dB (A) of the present study. The noise levels found by this study are comparable to those found in other sawmills, especially in the sawing process and planer mill [48]. This evaluation considered the average noise exposure in the workplace as acceptable; however, this does not imply that there is a safe condition below this reference value, but it does indicate an acceptable level of risk to the worker’s hearing health [49]. According to Proto [14] and Parsons [50], values over 87 dB (A) for an 8-h exposure period have harmful effects on the health of the workers, measured by various physiological responses, such as changes in heart rate, blood pressure, adrenaline production, as well as by the psychological impacts. Davies et al. [51] evaluated the noise exposure among British Columbia sawmills in Canada (over 14,000 noise measurements) and found that workers were exposed to average noise levels of 92.0 dB (A). The risk of hypertension is correlated with exposures to noise above 85 dB (A) [8]. In addition, Kersten and Backé [52] reported that exposure to noise of over 95.0 dB (A) is associated with myocardial infarction. Thepaksorn et al. [48] showed that the problems generated by exposure to noise tend to be correlated with the duration of exposure, while in small sawmills, Proto [14] confirmed the high probability of risks caused by the manual control of cutting and obsolete machinery. For this reason, workers require continued protection against exposure to noise, even when wearing the recommended hearing protection.
Postural analysis of this study retrieved results that indicated rather no concerns in terms of the risks of developing musculoskeletal disorders. However, the fact that force exertion was impossible to evaluate should be kept in mind when trying to analyze and compare the results with those reported by others. Indeed, by the postural risk index, the outcome was that ergonomic interventions are required in the near future to improve the postural situation. However, it was likely for some tasks, such as pushing the logs on the rail, fixing and rotating them, unloading and stacking the lumber, to require a force exertion of more than 10 kg, while such tasks accounted for more than 20% of the studied time. This may be a good reason to use the figure of the postural risk index only as an indicative, minimal one, as well as to think about improving such bandsaws at least to reach a minimal technical level, by equipping them with cheap, mechanical devices for log handling.
As one of the competitiveness’ drivers, productivity needs to be maximized in the sawmilling facilities. Our results indicate a rather high time utilization in productive tasks, which may come at the expense of exposure to noise and to poor working postures. Exposure to noise was reflected by the results on the normalized figure (LEX,8h), which was close to 92 dB (A). Therefore, increasing the time utilization in productive tasks is likely to lead to higher levels of exposure to noise. However, as the practice has repeatedly shown, it is unrealistic to think that all of the workplace time will be used for production purposes, particularly in those facilities in which the level of automation is low. As such, the figures reported by this study may stand for rather a maximum level of exposure for the studied equipment, operations, and inputs. On the other hand, the level of emitted noise is likely to depend on the condition of the used blades, species sawn, and on the dimensional characteristics of the logs. Although the effect of the log size on the exposure to noise was not evaluated in this study, evidence was found to support the interaction between wood species and exposure to hand–arm vibrations in [53]. Since both sound and vibration are waves whose propagation is often interrelated, one could expect a higher level of exposure to noise as an effect of changing the species of the sawn logs from softwoods to hardwoods. Further studies are needed clarify this kind of interaction.
The risk of developing musculoskeletal disorders by the need to adopt poor postures during the work became important for the evaluation in many industries and occupational settings. Even if not specifically reported in this study, the poorest postures were those related to tasks such as moving the logs, loading the logs, fixing the logs, rotating and removing the logs, as well as unloading the lumber, which accounted for close to 30% of the workplace time. These were the work tasks that were not supported by the studied machine, being done completely manually or by other tools. For instance, the time spent in log loading was less related to the size of the logs, while other tasks depended highly in terms of time consumption on the dimensional features of the production’s inputs and outputs. Therefore, keeping the same technology in use, at the same level of productive time, is likely to lead to similar outcomes in terms of working postures for the mentioned tasks. Improving the machine so as to be able to mechanically handle at least the logs (level of force exertion was assumed to be the most favorable, due to impossibility to accurately estimate it) will remove at least the component of high levels of force exertion, which was coupled with poor working postures in the manual handling of the logs; therefore, it will improve the outcomes in terms of the risks of developing work-related musculoskeletal disorders.

5. Conclusions

Performance evaluation represents an important phase in the process of improving any operation or condition, in particular where the injury or illness are very often considered as being work-related. This study showed that small sawmills are capable to recover the wood at an acceptable rate, limiting the wood waste during cutting operations. Safety practices require the modernization of machinery and tools, so as to avoid difficult manual operations or intensive and continuous exposure to work-related risks. This study explored a mixed and often overlapped area of performance in the attempt to help the wood industry to better understand the occupational risks, and to guarantee the sustainability of operations during the conversion of logs into sawn wood. In general, it seems evident that personnel training efforts are essential to improve the safety conditions within wood processing businesses. This should be done proactively because it requires a significant amount of time, not only due to technical reasons, but also, and maybe more importantly, due to the impossibility to adopt cost-effective measures in a very competitive industry. For example, the noise reduction, at the source or on the run, should be one of the main measures to be taken, and it must take into account both the facilities and planning, as well as the maintenance to control acoustic pollution during wood processing. Future research could address the effects brought by different sawmill layouts in relation to safety conditions. They can also focus on evaluating the capacity of small and medium sawmills to survive to the continuously changing wood market.

Author Contributions

Conceptualization, S.A.B., A.R.P.; data curation, S.A.B., M.O.; formal analysis, S.A.B., M.V.M., A.R.P.; funding acquisition, A.R.P.; investigation, A.L.; methodology, S.A.B., M.O., M.V.M., A.R.P.; project administration, S.A.B.; resources, S.A.B., A.R.P.; validation, S.A.B.; visualization, M.V.M., A.R.P.; writing—original draft, S.A.B. and A.R.P.; writing—review and editing, S.A.B. and A.R.P. All authors have read and agreed to the published version of the manuscript.

Funding

This research received no external funding.

Institutional Review Board Statement

Not applicable.

Informed Consent Statement

Not applicable.

Data Availability Statement

Not applicable.

Acknowledgments

The authors acknowledge the technical support of the Department of Forest Engineering, Forest Management Planning and Terrestrial Measurements, Faculty of Silviculture and Forest Engineering, Transilvania University of Brasov in designing and conducting this study. Some activities in this study were funded by the inter-institutional agreement between Transilvania University of Braşov (Romania) and Mediterranean University of Reggio Calabria (Italy). The authors would like to thank to the manager of the sawmilling facility, for support and for actively participating in this study.

Conflicts of Interest

The authors declare no conflict of interest.

References

  1. Makkonen, M. Stakeholder perspectives on the business potential of digitalization in the wood products industry. Bioprod. Bus. 2018, 3, 63–68. [Google Scholar] [CrossRef]
  2. Hansen, E.; Panwar, R.; Volsky, R. Understanding and Managing Change in the Global Forest Sector. In The Global Forest Sector. Changes, Practices, and Prospects, 2nd ed.; Hansen, E., Panwar, R., Vlosky, R., Eds.; CRC: Boca Raton, FL, USA, 2013. [Google Scholar]
  3. Grigolato, S.; Bietresato, M.; Asson, D.; Cavalli, R. Evaluation of the manufacturing of desk and stringer boards for wood pallets production by discrete event simulation. Biosyst. Eng. 2011, 109, 288–296. [Google Scholar] [CrossRef]
  4. Zimbalatti, G.; Giametta, F.; Proto, A.R. Analysis of the risks of the early phases of timber processing. In Proceedings of the International Conference—Cutting Edge Technologies and Innovations on Sustainable Resources for Food Sufficiency, Bangkok, Thailand, 3–6 December 2007. [Google Scholar]
  5. Telford, C.G. Small Sawmill Operator’s Manual. Agriculture Handbook No 27—January 1952; United States Department of Agriculture: Washington, DC, USA, 1952. [Google Scholar]
  6. Occeña, L.G.; Rayner, T.J.; Schmoldt, D.L.; Abbott, A.L. Cooperative use of advanced scanning technology for low-volume hardwood processors. In Proceedings of the First International Precision Forestry Cooperative Symposium, Seattle, WA, USA, 17–20 June 2001; pp. 83–91. [Google Scholar]
  7. FAO. Small and Medium Sawmills in Developing Countries; Forestry Paper N. 28; FAO: Rome, Italy, 1981. [Google Scholar]
  8. Pinto, I.; Knapic, S.; Pereira, H.; Usenius, A. Simulated and realised industrial yields in sawing of maritime pine (Pinus pinaster Ait.). Holz. Roh. Werkst. 2006, 64, 30–36. [Google Scholar] [CrossRef]
  9. Rappold, P.M.; Bond, B.H.; Wiedenbeck, J.K.; Ese-Etame, R. Impact of elliptical shaped red oak logs on lumber grade and volume recovery. Forest Prod. J. 2007, 59, 29–34. [Google Scholar]
  10. Borz, S.A.; Păun, M. Integrating offline object tracking, signal processing, and artificial intelligence to classify relevant events in sawmilling operations. Forests 2020, 11, 1333. [Google Scholar] [CrossRef]
  11. De Lima, R.B.; Ferreira, R.L.C.; Da Silva, J.A.A.; Guedes, M.C.; Da Silva, D.A.S.; De Oliveira, C.P.; Galvão Rabelo, F.; Da Cruz Silva, L.F. Effect of species and log diameter on the volumetric yield of lumber in northern Brazilian Amazonia: Preliminary results. J. Sustain. For. 2020, 39, 283–299. [Google Scholar] [CrossRef]
  12. Wang, S.J. A new dimension sawmill performance measure. For. Prod. J. 1988, 38, 64–68. [Google Scholar]
  13. Bluff, E. Safety in machinery design and construction: Performance for substantive safety outcomes. Saf. Sci. 2014, 66, 27–35. [Google Scholar] [CrossRef]
  14. Proto, A.R. Analysis of the Risks of the Early Phases of Timber Processing and Definition of Safety Guideline. Ph.D. Thesis, University of Reggio, Calabria, Italy, 2006; p. 236. [Google Scholar]
  15. Thepaksorn, P.; Thongjerm, S.; Incharoen, S.; Siriwong, W.; Harada, K.; Koizumi, A. Job safety analysis and hazard identification for work accident prevention in para rubber wood sawmills in southern Thailand. J. Occup. Health 2017, 59, 542–551. [Google Scholar] [CrossRef] [Green Version]
  16. Tremblay, A.; Badri, A. A novel tool for evaluating occupational health and safety performance in small and medium-sized enterprises: The case of the Quebec forestry/pulp and paper industry. Saf. Sci. 2018, 101, 282–294. [Google Scholar] [CrossRef]
  17. Jones, T.; Kumar, S. Comparison of ergonomic risk assessment output in four sawmill jobs. Occupational Safety and Ergonomics 2010, 16, 105–111. [Google Scholar] [CrossRef] [Green Version]
  18. Poisson, P.; Chinniah, Y. Managing risks linked to machinery in sawmills by controlling hazardous energies: Theory and practice in eight sawmills. Saf. Sci. 2016, 84, 117–130. [Google Scholar] [CrossRef]
  19. Malkin, R.; Hudock, S.D.; Hayden, C.; Lentz, T.J.; Topmiller, J.; Niemeier, R.W. An assessment of occupational safety and health hazards in selected small businesses manufacturing wood pallets—Part 1. Noise and Physical Hazards. J. Occup. Environ. Hygiene 2005, 2. [Google Scholar] [CrossRef] [PubMed]
  20. Cheţa, M.; Marcu, M.V.; Iordache, E.; Borz, S.A. Testing the capability of low-cost tools and artificial intelligence techniques to automatically detect operations done by a small-sized manually driven bandsaw. Forests 2020, 11, 739. [Google Scholar] [CrossRef]
  21. Borz, S.A. Evaluarea Eficienţei Echipamentelor şi Sistemelor Tehnice în Operaţii Forestiere; Lux Libris Publishing House: Braşov, Romania, 2014; 252p. [Google Scholar]
  22. Acuna, M.; Bigot, M.; Guerra, S.; Hartsough, B.; Kanzian, C.; Kärhä, K.; Lindroos, O.; Magagnotti, N.; Roux, S.; Spinelli, R.; et al. Good Practice Guidelines for Biomass Production Studies; CNR IVALSA: Sesto Fiorentino, Italy, 2012; pp. 1–51. [Google Scholar]
  23. Björheden, R.; Apel, K.; Shiba, M.; Thompson, M. IUFRO Forest Work Study Nomenclature; The Swedish University of Agricultural Science: Garpenberg, Sweden, 1995. [Google Scholar]
  24. European Parliament. Directive 2003/10/CE of the European Parliament and European Council. Available online: http://eur-lex.europa.eu/legal-content/RO/TXT/HTML/?uri=CELEX:02003L0010-20081211&from=EN (accessed on 1 April 2018).
  25. EXTECH 407760: USB Sound Level Datalogger. Available online: http://www.extech.com/display/?id=14225 (accessed on 30 April 2018).
  26. Cheţa, M.; Marcu, M.V.; Borz, S.A. Workload, exposure to noise, and risk of musculoskeletal disorders: A case study of motor-manual tree felling and processing in poplar clear cuts. Forests 2018, 9, 300. [Google Scholar] [CrossRef] [Green Version]
  27. Borz, S.A.; Talagai, N.; Cheţa, M.; Chiriloiu, D.; Montoya, A.V.G.; Vizuete, D.D.C.; Marcu, M.V. Physical strain, exposure to noise and postural assessment in motor-manual felling of willow short rotation coppice: Results of a preliminary study. Croat. J. For. Eng. 2019, 40, 377–388. [Google Scholar] [CrossRef]
  28. Zanuttini, R.; Cielo, P.; Poncino, D. The OWAS method. Preliminary results for the evaluation of the risk of work-related musculo-skeletal disorders (WMSD) in the forestry sector in Italy. For. Riv. Selvic. Ed Ecol. For. 2005, 2, 242–255. [Google Scholar] [CrossRef] [Green Version]
  29. Proto, A.R.; Zimbalatti, G. Risk Assessment of Repetitive Movements in Olive Growing: Analysis of annual exposure level assessment models with the OCRA Checklist. J. Agric. Saf. Health 2015, 21, 241–253. [Google Scholar] [CrossRef]
  30. Karhu, O.; Kansi, P.; Kuorinka, I. Correcting working postures in industry: A practical method for analysis. Appl. Erg. 1977, 8, 199–201. [Google Scholar] [CrossRef]
  31. Karhu, O.; Härkönen, R.; Sorvali, P.; Vepsäläinen, P. Observing working postures in industry: Example of OWAS application. Appl. Erg. 1981, 12, 13–17. [Google Scholar] [CrossRef]
  32. Marogel-Popa, T.; Cheţa, M.; Marcu, M.V.; Duţă, C.I.; Ioraș, F.; Borz, S.A. Manual cultivation operations in poplar stands: A characterization of job difficulty and risks of health impairment. Int. J. Env. Res. Pub. Health 2019, 16, 1911. [Google Scholar] [CrossRef] [Green Version]
  33. Marogel-Popa, T.; Marcu, M.V.; Borz, S.A. Postural risk in manual planting operations of poplar: Two options compared. Sustainability 2020, 12, 5531. [Google Scholar] [CrossRef]
  34. Borz, S.A.; Castro Perez, S.N. Effects of sampling strategy on the accuracy of postural classification: An example from motor manual tree felling and processing. Rev. Pădurilor 2020, 135, 19–41. [Google Scholar]
  35. Brandl, C.; Mertens, A.; Schlick, C.M. Effect of sampling interval on the reliability of ergonomic analysis using the Ovako working posture analysing system (OWAS). Int. J. Ind. Erg. 2017, 57, 68–73. [Google Scholar] [CrossRef]
  36. Borz, S.A.; Ignea, G.; Popa, B. Modelling and comparing timber winching performance in windthorw and uniform selective cuttings for two Romanian skidders. J. For. Res. 2014, 19, 473–482. [Google Scholar] [CrossRef]
  37. Kempthorne, K.H. Whole Mill Simulation of Small Log Sawmills with Head Sawyers; IEEE Computer Society Press: Los Alamitos, CA, USA, 1978; Volume 2. [Google Scholar]
  38. Hyytiäinen, A.; Viitanen, J. and Mutanen, A. Production efficiency of independent Finnish sawmills in the 2000’s. Balt. For. 2011, 17, 280–287. [Google Scholar]
  39. Kehinde, A.L.; Awoyemi, T.T.; Omonona, B.T.; Akande, J.A. Technical efficiency of sawnwood production in Ondo and Osun states, Nigeria. J. Forest. Econ. 2010, 16, 11–18. [Google Scholar] [CrossRef]
  40. De Melo, R.R.; Dacroce, J.M.F.; Junior, F.R.; dos Santos Lisboa, G.; Cavalcante de Jesus, F.L. Lumber yield of four native forest species of the Amazon region. Floresta Ambiente 2019, 26. [Google Scholar] [CrossRef] [Green Version]
  41. Helvoigt, T.L.; Adams, D.M. A stochastic frontier analysis of technical progress, efficiency change and productivity growth in the Pacific Northwest sawmill industry. Forest Policy Econ. 2009, 11, 280–287. [Google Scholar] [CrossRef]
  42. Gligoraş, D.; Borz, S.A. Factors affecting the effective time consumption, wood recovery rate and feeding speed when manufacturing lumber using a FBO-02 CUT mobile bandsaw. Wood Res. 2015, 60, 329–338. [Google Scholar]
  43. Cedamon, E.D.; Harrison, S.; Herbohn, J. Comparative analysis of on-site free-hand chainsaw milling and fixed site mini-bandsaw milling of smallholder timber. Small Scale For. 2013, 12, 389–401. [Google Scholar] [CrossRef]
  44. De Lasaux, M.J.; Spinelli, R.; Hartsough, B.R.; Magagnotti, N. Using a small-log mobile sawmill system to contain fuel reduction treatment cost on small parcels. Small Scale For. 2009, 8, 367–379. [Google Scholar] [CrossRef]
  45. Ištvanić, J.; Lučić, R.B.; Jug, M.; Karan, R. Analysis of factors affecting log band saw capacity. Croat. J. For. Eng. 2009, 30, 27–35. [Google Scholar]
  46. Silva-Lugo, E.D.; Salto, P.N.; Aragón-Vásquez, A.Y.; Nájera-Luna, J.A.; Hernández, F.; Cruz-Carrera, R.D.; Carrillo-Parra, A. Analysis of the physical work environment in sawmills in El Salto, Durango, Mexico. Rev. Chapingo Ser. Cienc. For. 2020, 26, 207–219. [Google Scholar] [CrossRef]
  47. Owoyemi, M.J.; Falemara, B.; Owoyemi, A.J. Noise pollution and control in wood mechanical processing wood industries. Biomed. Stat. Inform. 2017, 2, 54–60. [Google Scholar] [CrossRef]
  48. Thepaksorn, P.; Koizumi, A.; Harada, K.; Siriwong, W.; Neitzel, R.L. Occupational noise exposure and hearing defects among sawmill workers in the south of Thailand. Int. J. Occup. Saf. Ergon. 2019, 25, 458–466. [Google Scholar] [CrossRef] [PubMed]
  49. Anjorin, S.A.; Jemiluyi, A.O.; Akintayo, T.C. Evaluation of industrial noise: A case study of two Nigerian industries. Eur. J. Eng. Technol. 2015, 3, 59–68. [Google Scholar] [CrossRef]
  50. Parsons, K.C. Environmental ergonomics: A review of principles, methods and models. Appl. Ergon. 2000, 31, 581–594. [Google Scholar] [CrossRef]
  51. Davies, H.W.; Teschke, K.; Kennedy, S.M.; Hodgson, M.R.; Demers, P.A. Occupational noise exposure and hearing protector use in Canadian lumber mills. J. Occup. Environ. Hyg. 2009, 6, 32–41. [Google Scholar] [CrossRef]
  52. Kersten, N.; Backé, E. Occupational noise and myocardial infarction: Considerations on the interrelation of noise with job demands. Noise Health 2015, 17, 116–122. [Google Scholar] [CrossRef]
  53. Rottensteiner, C.; Tsioras, P.; Stampfer, K. Wood density impact on hand-arm vibration. Croat. J. For. Eng. 2012, 33, 303–312. [Google Scholar]
Figure 1. A snapshot extracted from the collected video files showing the general configuration of the machine taken into study and the labelled logs.
Forests 12 00810 g001
Figure 2. Dependence relations between the production variables and production inputs. Legend: (a) and (b)—number of produced pieces (NP) as a function of the average diameter (D) and log volume (V); (c) and (d)—volume of production (P) and residues (R) as a function of the average log diameter (D) and log volume (V).
Forests 12 00810 g002
Figure 3. Time consumption models. Legend: (a,b)—shares on time consumption categories; (c)—time consumption models for log loading (tL); (df)—time consumption models for blade adjustment (tA); (gi)—time consumption models for sawing (tS); D—average log diameter, V—log volume, NP—number of produced pieces.
Forests 12 00810 g003
Figure 4. Time consumption and productive performance models. Legend: (ac)—time consumption models of the lumber unloading (tU) as a function of the average log diameter (D), log volume (V) and number of produced pieces (NP); (df)—time consumption models of the lumber fixing (tF) as a function of the average log diameter (D), log volume (V) and number of produced pieces (NP); (gi)—delay-free cycle time models (DFCT) as a function of the average log diameter (D), log volume (V) and number of produced pieces (NP); (j,k)—net productivity rate models as a function of average diameter of the log (D) and number of produced pieces (NP); (l)—net efficiency rate model (NER) as a function of the log volume (V).
Forests 12 00810 g004
Figure 5. Variation in the time domain of the sound pressure level measured at 1 Hz for the six days of observation.
Forests 12 00810 g005
Figure 6. Results of postural analysis. Legend: (a)—relative frequencies of the back, arms and legs on postural codes; (b)—relative frequencies of body postures on action categories, the estimated postural index and margin of errors per action categories.
Forests 12 00810 g006
Table 1. Parameters used to evaluate the productive performance of sawmilling operations.
Category, Parameter and Measurement UnitDescription and Measurement Procedure
Time consumption
Work preparation
(tP, seconds)
Description: removing sawdust, cleaning the logs of residues, etc. Measurement: video files
Measurement
(tM, seconds)
Description: measuring the diameters of the logs and their length, including the time spent to measure production. Measurement: video files
Log loading
(tL, seconds)
Description: moving the logs from the feedstock, placing and fixing them on the machine by clamps. Measurement: video files
Adjusting the sawing height
(tA, seconds)
Description: manual adjustment of the blade height using the adjusting lever. Measurement: video files
Effective sawing
(tS, seconds)
Description: advancement of the sawing blade into the log using the manual advancement lever. Measurement: video files
Return of the saw
(tR, seconds)
Description: manual retraction of the sawing device to its initial location. Measurement: video files
Loading and fixing lumber
(tF, seconds)
Description: manual placement, fixing and rotating of partly processed wood. Measurement: video files
Unloading lumber
(tU, seconds)
Description: manual removal and stacking of the produced lumber. Measurement: video files
Technical delays
(TTD, seconds)
Description: any events causing delays of technical nature. Measurement: video files
Personal delays
(TPD, seconds)
Description: any events causing delays of personal nature. Measurement: video files
Miscellaneous
(TMD, seconds)
Description: any other events, excluding those from above. Measurement: video files
Inputs
Diameter at the thick end
(DT, cm)
Measurement: caliper and field book
Diameter at the thin end
(Dt, cm)
Measurement: caliper & field book
Log length
(LL, cm)
Measurement: measurement tape and field book
Average diameter of the log
(D, cm)
Measurement: calculated based on DT and Dt
Volume of the log
(V, m3)
Measurement: calculated based on D and LL
Outputs
Number of produced pieces
(NP)
Measurement: video files
Volume of production
(P, m3)
Measurement: individual measurement of each piece
Volume of residues
(R, m3)
Measurement: by the difference between input volume and production
Table 2. Descriptive statistics of production inputs, outputs and resources.
Category, Parameter and Measurement UnitDescriptive Statistics
NSumMin. Max. Mean Median
Time consumption
Work preparation (tP, seconds)8628,729-1533334.1225.0
Measurement (tM, seconds)8619,56249631227.5198.5
Log loading (tL, seconds)8610,21228393118.7103
Adjusting the sawing height (tA, seconds)8613,87249780161.3111
Effective sawing (tS, seconds)8635,557801707413.5326.5
Return of the saw (tR, seconds)8614,93047575173.6143.5
Unloading lumber (tU, seconds)8612,00815699139.6104
Loading and fixing lumber (tF, seconds)8616,01840797186.3136.5
Technical delays (TTD, seconds)30794----
Personal delays (TPD, seconds)652806----
Miscellaneous time (TM, seconds)4228,082----
Cycle time (CT, seconds)86163,00850267501895.41315.5
Delay-free cycle time (DFCT, seconds)86131,32647461891527.11171.0
Total time (TT, seconds)-182,579----
Inputs
Diameter at the thick end (DT, cm)86-146329.227
Diameter at the thin end (Dt, cm)86-105024.122
Log length (LL, cm)86-200700472.1500
Average diameter of the log (D, cm)86-12.056.526.624.5
Volume of the log (V, m3)8625.7990.0571.5160.3000.232
Outputs
Number of produced pieces (NP)866951258.17
Volume of production (P, m3)8617.8340.0261.0190.2070.160
Volume of residues (R, m3)867.9650.0070.4970.0930.068
Performance indicators
Recovery rate (RR, %)86-38.895.068.6-
Net productivity rate (NPR, m3 × h−1)86-0.1350.9220.489-
Gross productivity rate (GPR, m3 × h−1)86-0.1320.8460.394-
Net efficiency rate (NER, h × m−3)86-1.0847.3892.045-
Gross efficiency rate (GER, h × m−3)86-1.1837.5522.539-
Note: all the variables failed the normality test, therefore median values can be used effectively to infer the central tendencies.
Table 3. Statistics of the exposure to noise.
ParametersMetrics of the Exposure to Noise
Time(s)Laeq (dB(A))Laeq, T (dB(A)) LEX,8h (dB(A))
Day # 133,57983.24--
Day # 230,71485.72--
Day # 328,42583.39--
Day # 431,14383.35--
Day # 535,94582.38--
Day # 626,17681.18--
Overall185,982-83.5291.62
Publisher’s Note: MDPI stays neutral with regard to jurisdictional claims in published maps and institutional affiliations.

