Article

The Impact of Drought Stress on the Height Growth of Young Norway Spruce Full-Sib and Half-Sib Clonal Trials in Sweden and Finland

1
Skogforsk, Uppsala Science Park, 75183 Uppsala, Sweden
2
Natural Resources Institute Finland (Luke), Latokartanonkaari 9, 00790 Helsinki, Finland
3
Department of Forest Genetics and Plant Physiology, Swedish University of Agricultural Science, SE-90183 Umeå, Sweden
4
Natural Resources Institute Finland (Luke), Paavo Havaksentie 3, 90570 Oulu, Finland
5
Skogforsk, Ekebo 2250, 26890 Svalöv, Sweden
*
Author to whom correspondence should be addressed.
Forests 2021, 12(4), 498; https://doi.org/10.3390/f12040498
Submission received: 22 March 2021 / Revised: 12 April 2021 / Accepted: 14 April 2021 / Published: 16 April 2021
(This article belongs to the Section Genetics and Molecular Biology)

Abstract

:
The summer drought of 2018 was one of the most climatically severe events in Europe that led to record-breaking temperatures and wildfires in many parts of Europe. The main objective of this study was to assess the impact of the 2018 drought on the phenotypic and genetic response of Norway spruce height growth using the Standardized Precipitation-Evapotranspiration Index (SPEI). To achieve this, the total cumulative height growth of about 6000 clones from 2016 to 2019 in four full-sib trials in Sweden, aged 6–7 years, and from 2017 to 2019 in two half-sib trials in Finland, aged 8–9 years, were measured. The results indicate that the 2018 drought caused reductions in the increment of trees. Although heritability estimates were similar to other reports for Norway spruce, the additive genetic variance was highly inflated in one of the visibly drought-damaged trials in Southern Sweden. Similarly, the genotype by environment (G × E) interaction was highly significant in the drought-damaged Southern Swedish trials. Both additive genetic and phenotypic correlations obtained between height increments in 2019 and final heights were the weakest in all studied trials, implying that the drought legacies might have influenced the recovery of trees in 2019. We may conclude that the severe drought can be an underlying factor for a strong G × E interaction and changes in the ranking of genotypes. Therefore, a selection of drought-resistant genotypes with a good growth capacity tested in variables sites should be considered as an important criterion for future breeding of Norway spruce.

1. Introduction

The ongoing climate change is increasing the frequency of droughts in many areas and particularly in the Northern hemisphere as a result of increasing evaporative demand, higher variability in precipitation and earlier snow melt [1]. Forests are notably vulnerable to climate change because the long lifespan of trees prevents rapid adaptation to environmental changes [2]. A combination of drought and warmer temperatures is one of the main agents of climate-driven tree mortality [3]. Moderate drought can result in reduced growth and survival of trees [4] while severe drought leads to a mass decline [3].
Drought stress occurs whenever soil water drops below a threshold leading to limited growth and transpiration. High evaporating demand and low soil water content result in stomatal closure in most tree species, limiting water fluxes as a result of reduced CO2 assimilation [5]. The response of trees to drought stress may lead to a number of physiological and morphological changes: it can reduce the annual increment, it can affect the xylem element architecture, it may cause changes in the hydraulic properties or it may alter the chemical composition of the wood [6,7]. However, a few tree species and phenotypes are more vulnerable to drought-induced growth decline [8] as the differences in drought susceptibility have both genetic and environmental components [6].
The Norway spruce (Picea abies L. Karst.) is by far one of the most economically and ecologically important forestry species in Europe [9]. Nevertheless, its long-term role in future forests might be endangered due to its high sensitivity to drought events [10] particularly at low elevations and southern exposed sites [11,12].
One of the last spruce decline episodes started at the beginning of the 1990s in Poland and spread southward particularly after the drought spells in 2003 and 2007. A severe infestation by fungi (e.g., Armillaria spp.) and a subsequent attack by bark beetles (e.g., Ips typographus) were identified as the main factors causing the final mortality [10,13]. Similarly, instances of the drought-triggered mortality of spruce seedlings were reported in southern Sweden [14]. Declines in spruce stands were also evidenced in southern Norway and Finland after summer droughts particularly in the early 1990s [15,16]. Therefore, drought tolerance can be regarded as an important trait for the successful regeneration and high productivity of Norway spruce [17]. In this respect, incorporating drought-tolerant genotypes in breeding programs seems worthwhile. Nevertheless, quantitative genetic studies in Norway spruce so far have mainly focused on local adaptation [18] and genetic variation for growth and wood quality traits [19,20]. So far, only a few investigations have addressed the genetics of drought response in Norway spruce [7,17].
There are various climate drought indices to assess drought impacts on forest growth and crop yield, e.g., the Palmer Drought Severity Index (PDSI), the Z Index, the Precipitation Percentile Index (PDECI), the Compound Index (CI) and the Standardized Precipitation Index (SPI) [8,21]. Among the above-mentioned indices, the PDSI and the SPI have been widely used in monitoring drought and also in climate change studies. However, the PDSI with fixed time scales is not good at reflecting the short-term droughts and does not allow different drought types (e.g., hydrological, meteorological, agricultural) to be distinguished [22]; the SPI does not incorporate the effect of temperature [21,23]. Considering the drawbacks of the traditional drought indices, the Standardized Precipitation-Evapotranspiration Index (SPEI) [22] was developed as a novel drought index combining the advantages of the SPI and the PDSI. It is available for varying time scales like the SPI but, in contrast to the SPI, it considers the effect of temperature, which has a marked influence on the drought [23,24].
The summer of 2018 was characterized by record-breaking temperatures and wildfires that had a greater impact on the forest ecosystem in many parts of Europe than the earlier drought of 2003 [25]. In Sweden only, a unique outbreak was recorded as up to four million m3 Norway spruce were killed by the spruce bark beetle (Ips typographus) triggered by the hot summer of 2018. The infestation even continued in 2019 and 2020 [26].
Therefore, the main goal of our study was to evaluate the impact of the 2018 drought on the height growth of Norway spruce breeding materials in Sweden and Finland using the SPEI. The focus was on the height increments of 2017, 2018 and 2019. The specific genetic parameters of interest included: (i) narrow-sense and broad-sense heritabilities ( h i 2 ,   H i 2 ) for the annual height increments as well as the final heights of 2016, 2017, 2018 and 2019; (ii) the genetic and phenotypic correlations between the annual height increments and the final heights; (iii) the genetic type-B correlations indicative of the magnitude of genotype by environment interaction (hereafter G × E).

2. Materials and Methods

2.1. Field Data

Data from six Norway spruce clonal progeny trials including four full-sib trials in Sweden and two half-sib trials in Finland (Figure 1) were investigated in this study. Two of the trials, Sunnansjö and Nässja, were established in 2013 in central Sweden while Kohagen and Ängelholm were established in 2014 in southern Sweden. The two Finnish trials were established in 2011 (Pori) and 2012 (Nurmijärvi). Detailed characteristics of the trials were shown in Table 1.

2.1.1. Full-Sib Clonal Trials

An incomplete partial diallel mating design consisting of 57 parent plus-trees (34 females and 33 males) was implemented to produce 57 full-sib families. The seeds were sown into pots in the late summer of 2008. The first cuttings taken from donor plants were rooted in the late autumn of 2010. The cuttings were grown for two field seasons and planted in two trials in Nässja and Sunnansjö in the spring of 2013.
The trials in Ängelholm and Kohagen comprised of 84 and 85 full-sib families, respectively. These were from a factorial mating design consisting of 99 parent plus-trees (47 females, 52 males). The seeds were sown into pots in the spring of 2009. The first cuttings were taken from donor plants and rooted in the early spring of 2011 and the trials were established in 2014. A randomized incomplete block design using the single-tree plot was used in all of the Swedish trials. The schematic design of one the Swedish trials was shown in Figure S1.

2.1.2. Half-Sib Clonal Trials

The clonal material in the two Finnish trials consisted of second-generation candidates that were phenotypically pre-selected within open-pollinated families of 98 plus-trees. The excised branches from the candidates were rooted as cuttings in a heated greenhouse and grown to three-year-old clonal plants. Four clonal trials (data from only two of them, Pori and Nurmijärvi, were available for this study) were established in 2011 and 2012 using single-tree plots arranged in randomized complete blocks.

2.2. Measurements

In order to assess the annual height increment of the years 2017, 2018 and 2019 (hereafter Ht17, Ht18 and Ht19, respectively), the cumulative final heights of the years 2016, 2017, 2018 and 2019 (hereafter Tot-Ht16, Tot-Ht17, Tot-Ht18 and Tot-Ht19, respectively) were measured in the autumn of 2019. The cumulative height of 2016 was not measured in the two Finnish trials. All of the trees in all of the trials were assessed for vitality, damage (i.e., frost, drought) and defects (i.e., a double stem). According to the damage assessment in each trial, Kohagen had the highest number of trees with visible drought-related symptoms.

2.3. Climate Data and the SPEI

A simple climatic water balance can be represented by the SPEI that is based on the monthly differences between precipitation and potential evapotranspiration. It is calculated at the monthly scale with typical values of 1-, 3-, 6-, 12- and 24-month intervals, which allows the tracking of seasonality in tree water resources. For instance, June SPEI-3 represents the water balance of April, May and June of a given year. The positive and negative values of the SPEI indicate above-average and below-average moisture conditions, respectively [29]. The weather data from the closest weather station to the trials were obtained from climate databases in Sweden (https://www.smhi.se/ accessed on 10 April 2020) and Finland (https://en.ilmatieteenlaitos.fi/download-observations/ accessed on 10 April 2020). The monthly averages for minimum and maximum temperatures and the sum of precipitation were calculated for each trial for the periods 1996–2019 in Nässja-Sunnansjö, 2003–2019 in Ängelholm-Kohagen, 2000–2019 in Nurmijärvi and 2009–2019 in Pori. The SPEI was calculated using the R software [30], package SPEI [31], for the time scale (memory) of one month and the averages from May to July were obtained for each trial. As the weather data for trial Pori were only available from 2009, the SPEI results for all of the trials were shown from 2009 to 2019.

2.4. Statistical Data Analysis

2.4.1. Single-Site Analysis

The first step was a single-site analysis where growth observations were adjusted to the environmental variability by applying a spatial analysis based on a two-dimensional autoregressive model [32]. This was followed by a univariate single-site analysis to estimate the additive and non-additive genetic variance components at each trial. For the Swedish trials with full-sib families, the following general linear mixed model was used:
y = X b + Z 1 u + Z 2 f + Z 3 c + e
where y is the vector of the adjusted observations for heights or height increments; b is a vector of fixed effect (i.e., overall mean), u is a vector of the random additive genetic effects of an individual clone; f is a vector of the random effects of a full-sib family; c is a vector of the random effects of clones within full-sib families and e is a vector of the random residual terms. X , Z 1 , Z 2 and Z 3 are the incidence matrices relating to the observations in y to b , u , f and c , respectively.
For the Finnish trials with half-sib families, the following general linear mixed model was used as:
y = X b + Z 1 u + Z 3 c + e
where all variables are as described above except   b includes the fixed effects of means and block and   c , which here is a vector of the random effects of clones within half-sib families [33]. All random effects were assumed to be independently and normally distributed with the expected mean of zero where V a r   u = A σ A 2 , V a r   f = σ f 2 , V a r   c = σ c 2 and V a r   e = σ e 2 and A is the pedigree relationship matrix.
The individual tree narrow-sense heritability ( h i 2 ) and broad-sense heritability ( H i 2 ) estimates for measured traits at full-sib trials were calculated using Model 1 as follows:
h i 2 = σ A 2         σ A 2 + σ f 2 + σ c 2 + σ e 2       H i 2 = σ A 2 + σ f 2 + σ c 2           σ A 2 + σ f 2 + σ c 2 + σ e 2
where σ A 2 , σ f 2 , σ c 2 , σ e 2 are the additive, full-sib family, clonal and residual variance components, respectively.
Heritability estimates in half-sib trials were calculated using Model 2 as follows:
h i 2 = σ A 2           σ A 2 + σ c 2 + σ e 2       H i 2 = σ A 2 + σ c 2           σ A 2 + σ c 2 + σ e 2 .
All of the variables are as described above.
In both full-sib and half-sib trials, a bivariate single-site analysis was then carried out to estimate the additive genetic and phenotypic correlations between traits ( r A ) within a site as follows:
r A = σ x , σ y σ x 2 × σ y 2
where σ x 2 and σ y 2 are the variances and σ x , σ y are the covariances of trait x and y .

2.4.2. Multi-Site Analysis

In order to determine the extent of the G × E interaction for growth traits, paired-site (two sites within each zone) univariate analyses were conducted and type-B genetic correlations [34] were estimated using the following linear mixed models:
y = X b + Z 1 u s + Z 2 f s + Z 3 c s + e
Model 3 for the full-sib trials is similar to Model 1 except that here b includes the fixed effect of the site and u s , f s and c s are random interactions between site effects and the additive genetic, full-sib family and clonal effects.
y = X b + Z 1 u s + Z 3 c s + e
Model 4 is for the half-sib trials and similar to Model 2, except that b includes the fixed effect of the site. All of the multi-site analyses assumed a homogenous additive genetic variance with a uniform correlation and heterogenous error variances. The across-site (type-B) genetic correlations were calculated as follows:
r B = σ x 1 , x 2 σ x 1 2 × σ x 2 2
where σ x 1 , x 2 is the covariance between the additive effects of the same trait in two sites and σ x 1 2 and σ x 2 2 are the additive genetic variances of the trait in two sites. The standard errors of the estimates were approximated using a Taylor series expansion. The analyses were performed using the statistical software package ASReml [35].
Models 3 and 4 impose a constant correlation between environments with the correlation between any pair of environments j and j * being equivalent to:
r j , j * = σ j j * σ j 2 σ j * 2 = σ G 2 σ G 2 + σ ε 2
where σ G 2 is the random additive genetic variance and σ ε 2 corresponds with the residual (which includes the true G × E and error) [36].

3. Results

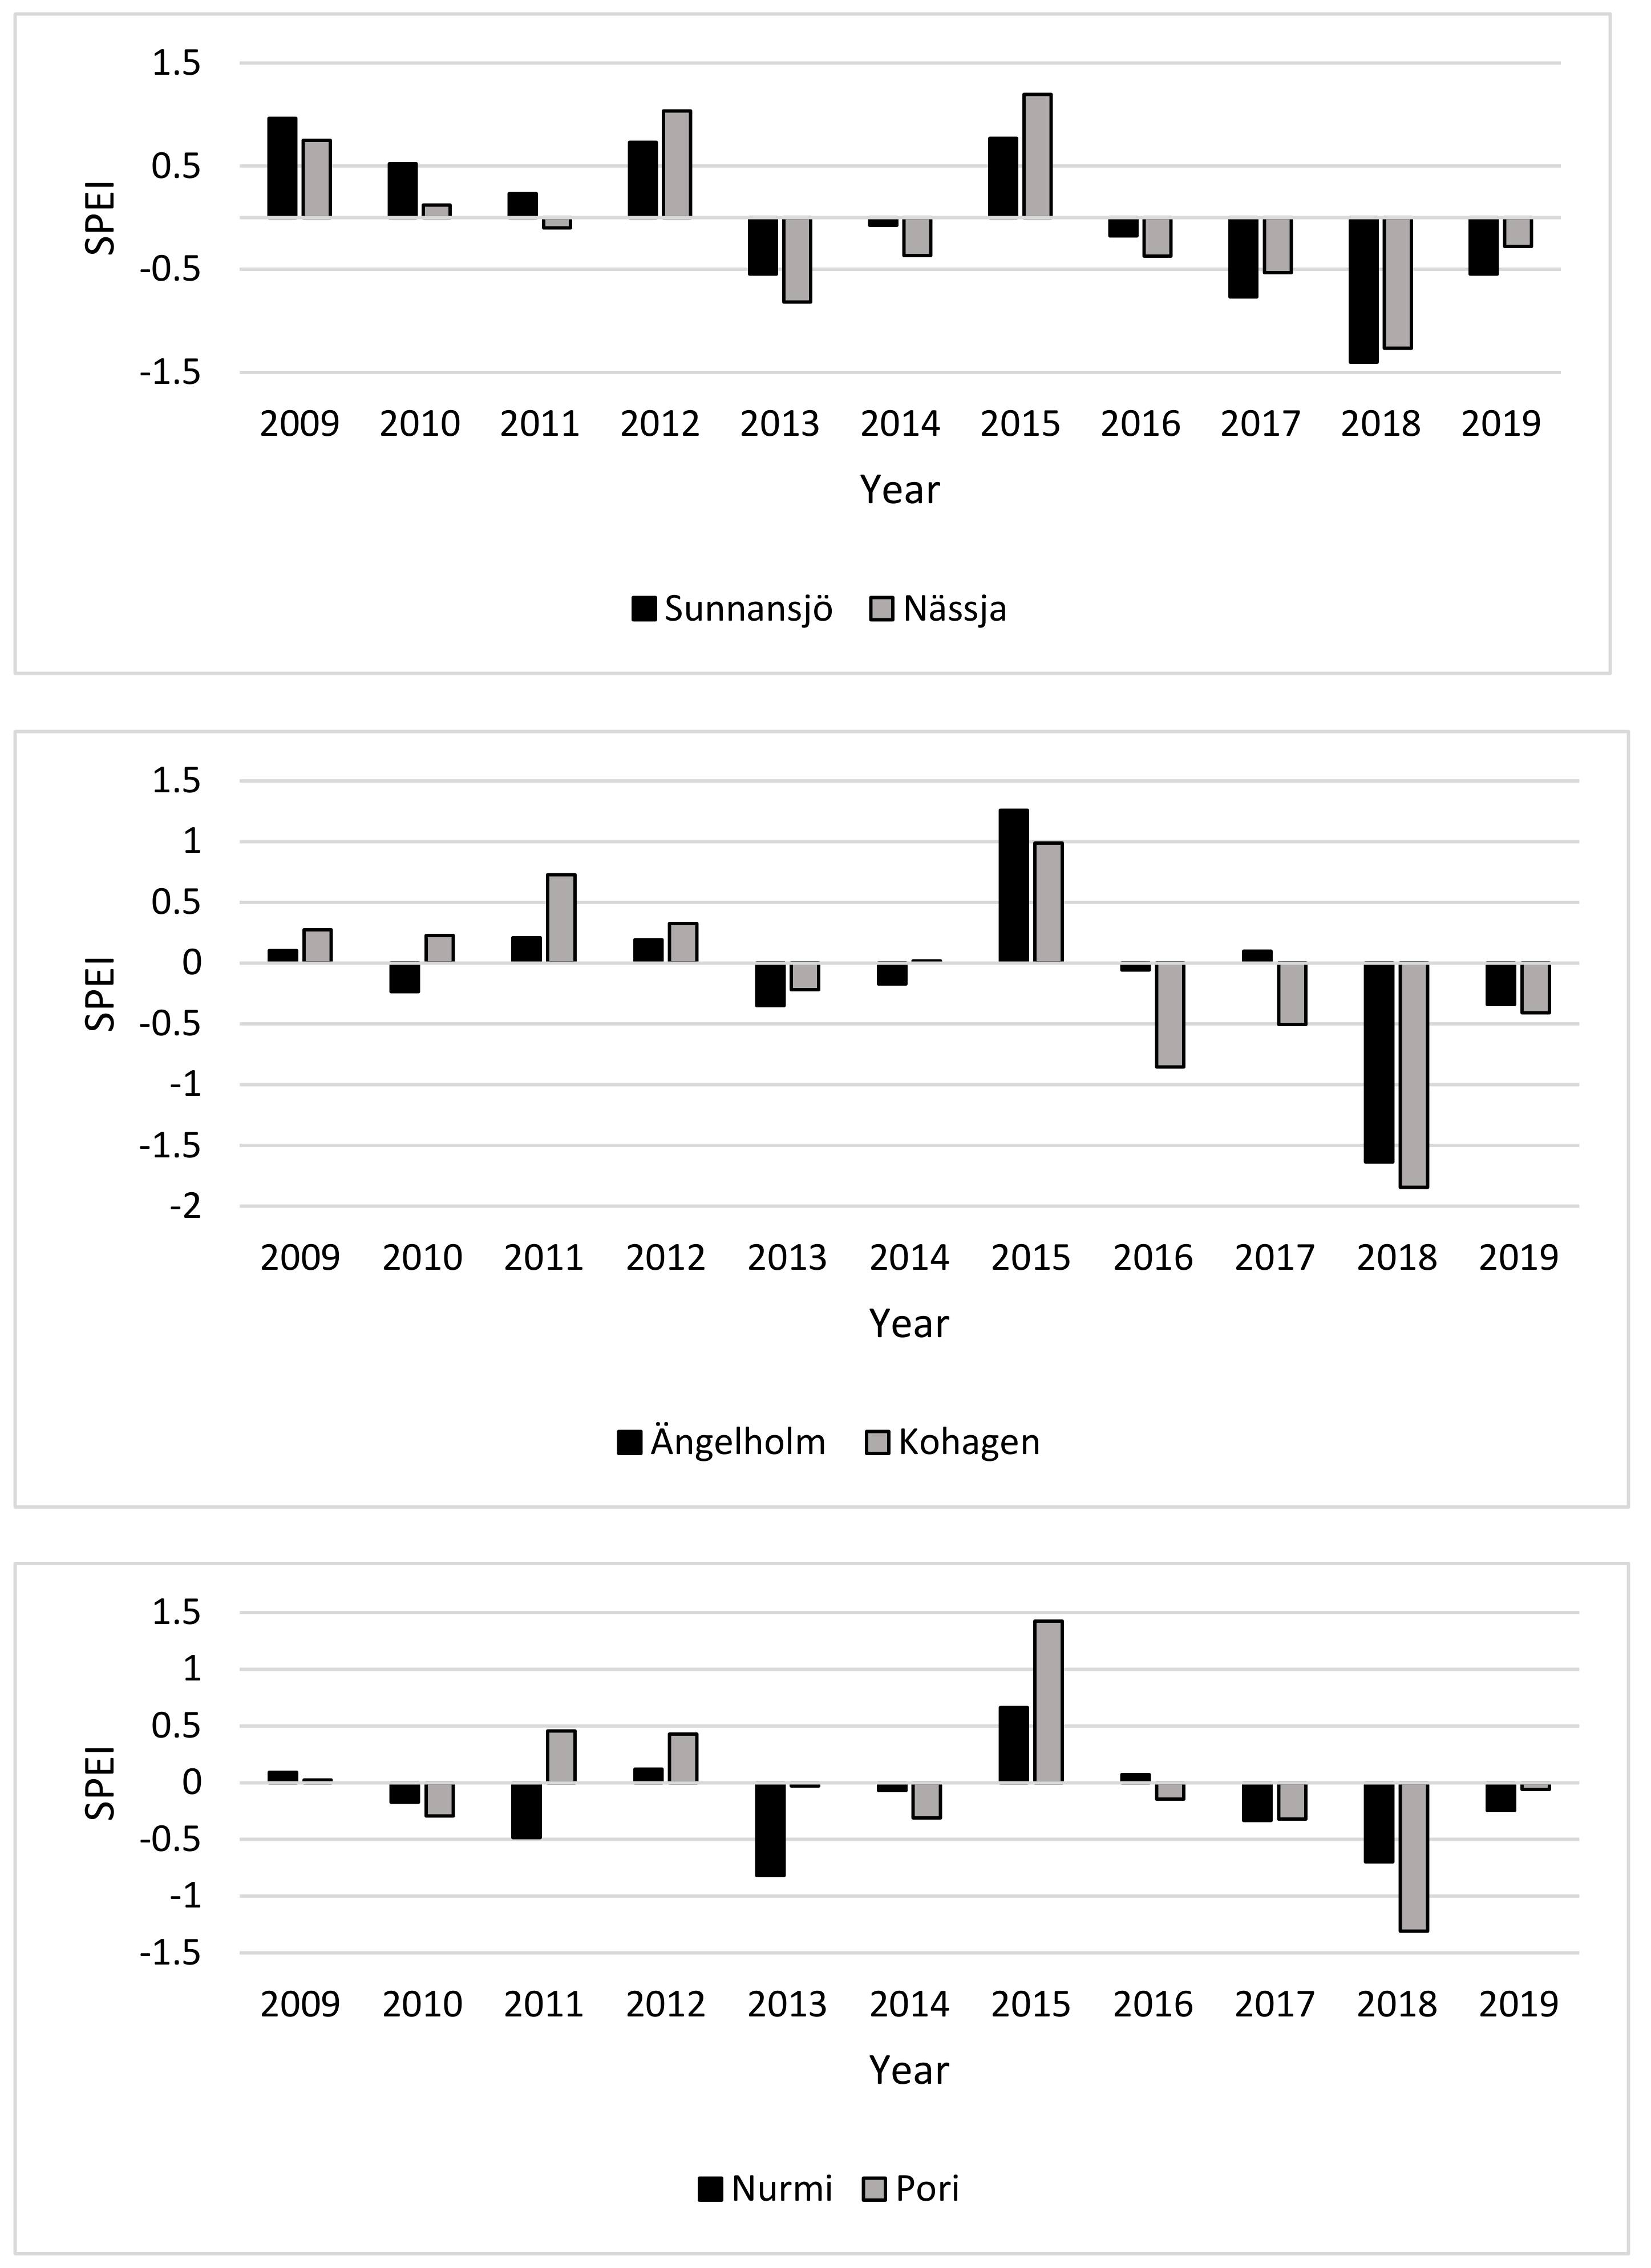
3.1. Drought Index (SPEI)

Based on the one month time scale SPEI results (with monthly averages from May to July), Ängelholm and Kohagen experienced a severe drought in 2018. However, in Sunnansjö, Nässja and Pori, the drought was moderate whereas in Nurmijärvi, the year 2018 was nearly normal (Figure 2). The pairs of trials Nässja-Sunnansjö and Pori-Nurmijärvi experienced similar weather in 2016 and 2017 while Kohagen had been drier than Ängelholm since 2015. The Ängelholm site was exposed to an abrupt drought in 2018 (as indicated by the drastic drop of the SPEI +0.1 in 2017 to about −1.6 in 2018).

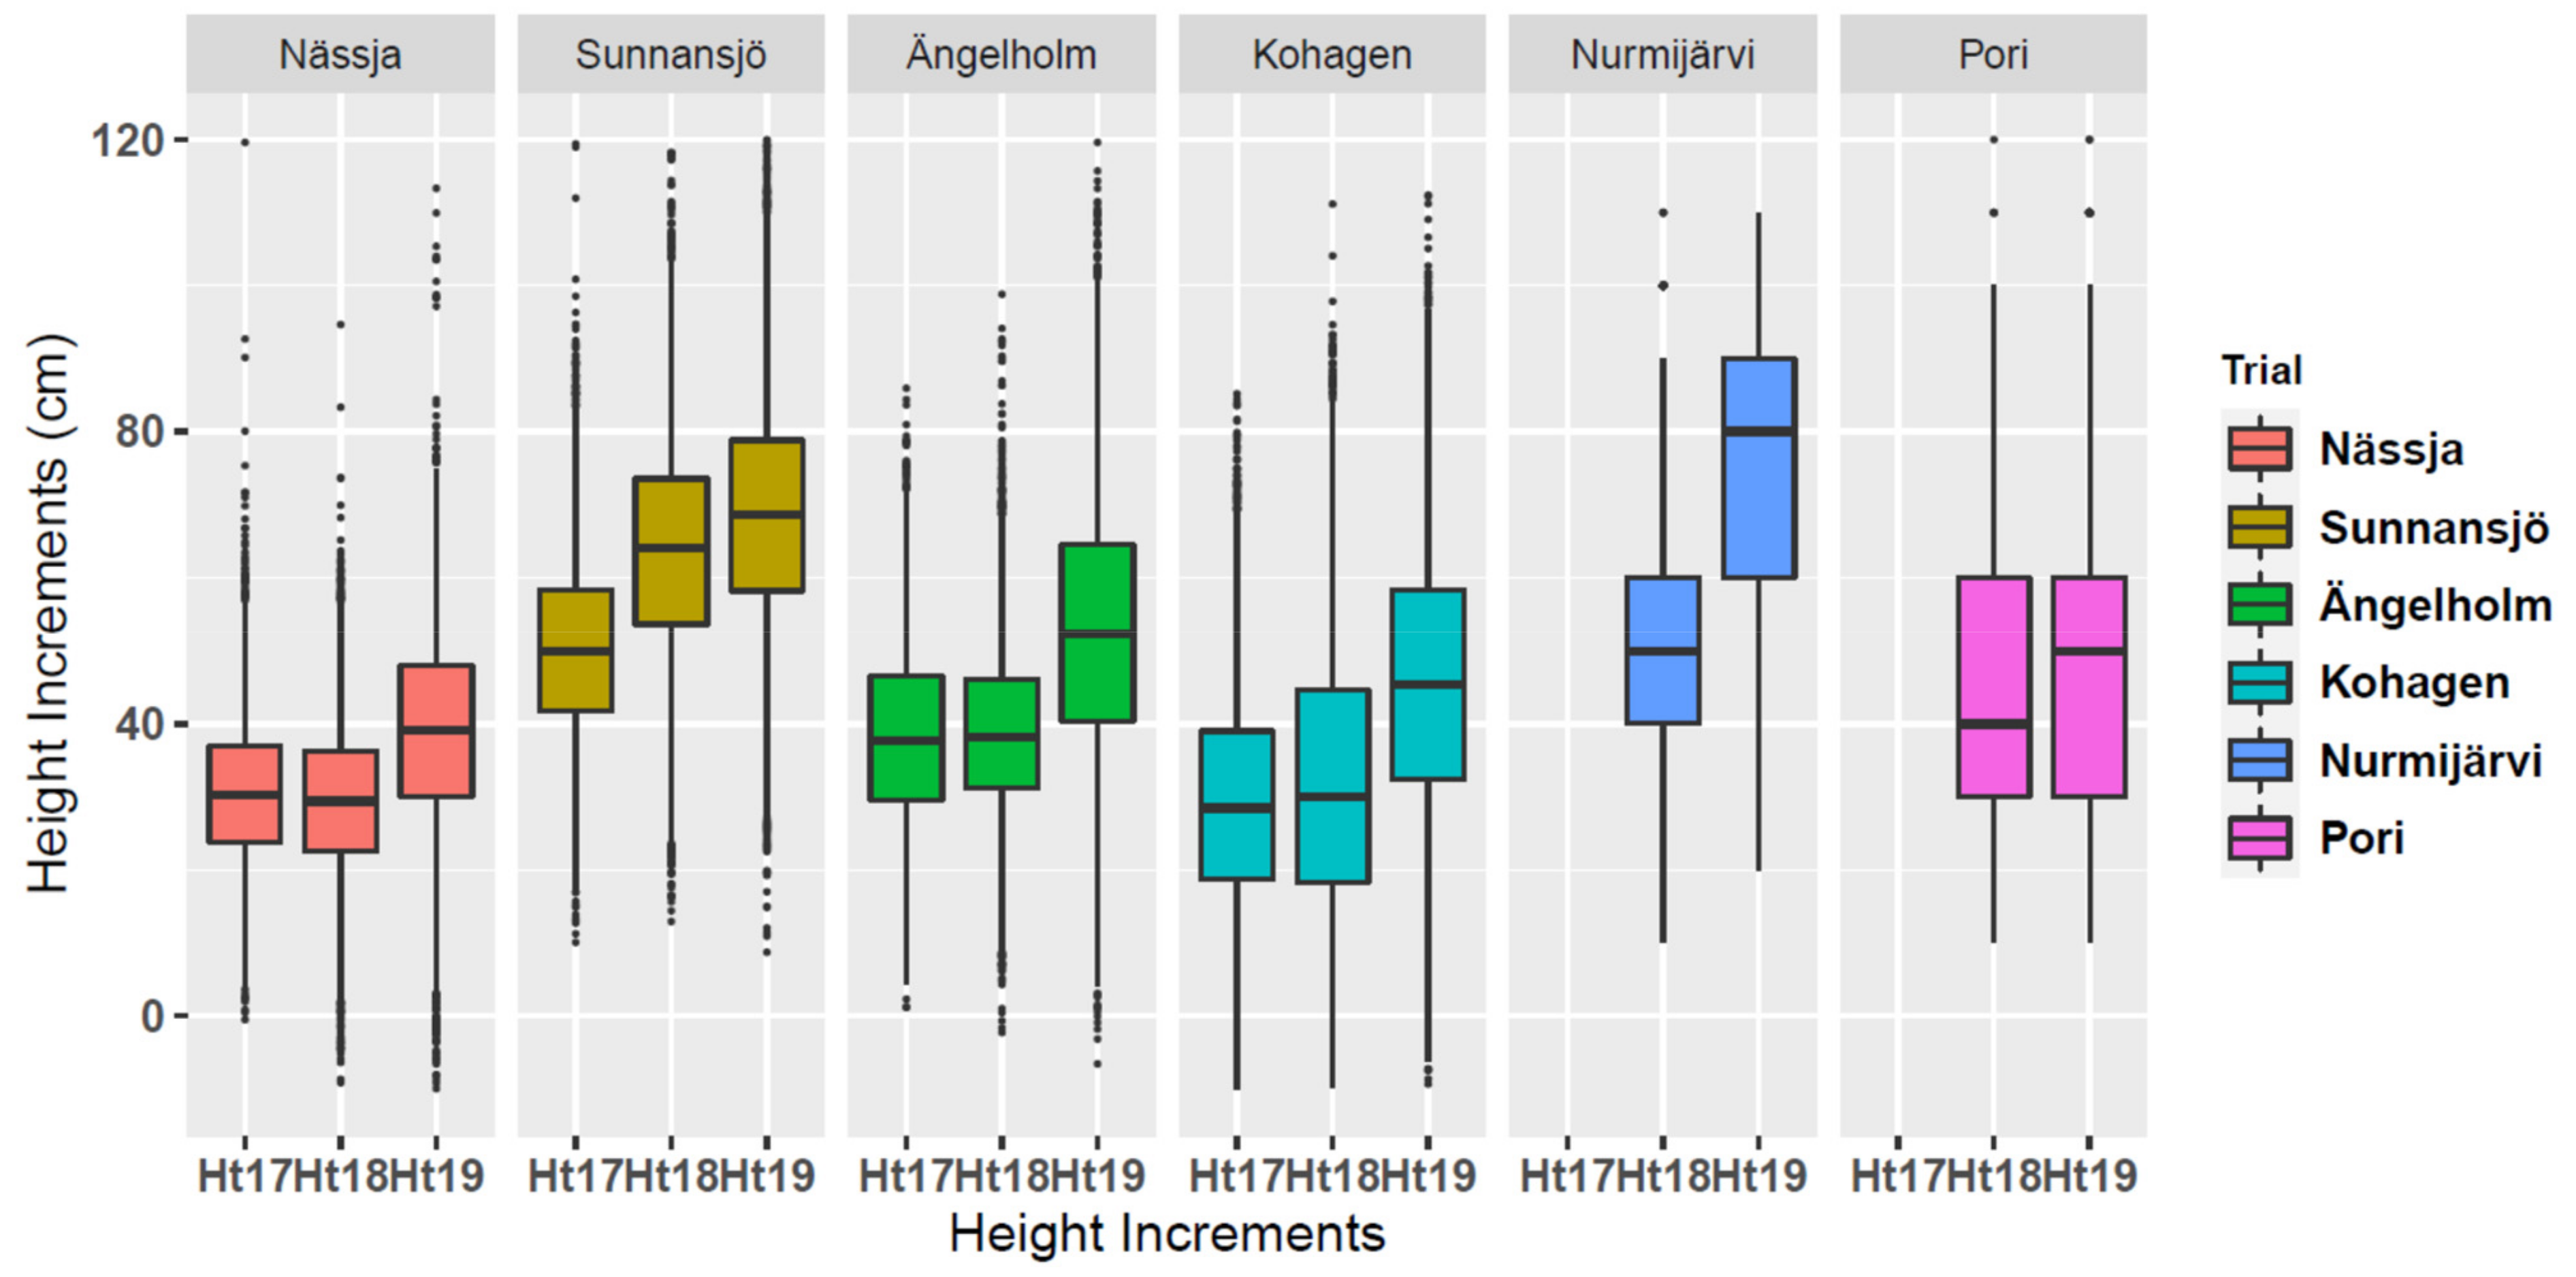
3.2. Annual Height Increments by Trials

Of the Swedish trials, the lowest and highest height increments of the years 2017, 2018 and 2019 were observed in Nässja and Sunnansjö, respectively. The trees in Ängelholm and Kohagen grew only slightly faster than those in Nässja (Figure 3). In the Swedish trials, except for Sunnansjö, the height increment of 2018 was similar to that of 2017 and much lower than in 2019. Of the Finnish trials, Nurmijärvi showed much faster growth in 2019 than in 2018. In Pori, there was not much difference (Figure 3).

3.3. Genetic Variance Components and Heritability Estimates

The heritability estimates as well as the additive ( σ A 2 ) and clonal ( σ c 2 ) variance components for the height traits are presented in Table 2 and Table 3. The estimates of other genetic components are shown in Table S1 and Table S2. In general, the narrow-sense ( h i 2 ) and the broad-sense heritability estimates ( H i 2 ) obtained for the total-height traits were slightly higher than those obtained for the annual increment heights. Among the Swedish trials, such estimates were lower overall in Nässja and Sunnansjö compared with Ängelholm and Kohagen.
The narrow-sense heritability estimates were generally slightly higher for Ht18 than other height increments. This was particularly true for Kohagen, which showed an exceptionally high additive genetic variance ( σ A 2 = 110.3) compared with other full-sib trials. Contrarily,   H i 2 was highest for Ht17 and decreased slightly in Ht19. However, such a trend was not observed in Kohagen where H i 2 for Ht18 was much higher than H i 2 for Ht17 and Ht19 (Table 2).
In contrast to what was observed in the Swedish trials, the Finnish trials showed lower   estimates of h i 2   for Ht18 than those for H19 (Table 3). In Nurmijärvi, H i 2 estimates for Ht18 were marginally higher than that of Ht19 while the opposite was true in Pori.
In general, the heritability estimates increased from Tot-Ht16 to Tot-Ht19 in the Swedish trials and from Tot-Ht17 to Tot-Ht19 in the Finnish trials.

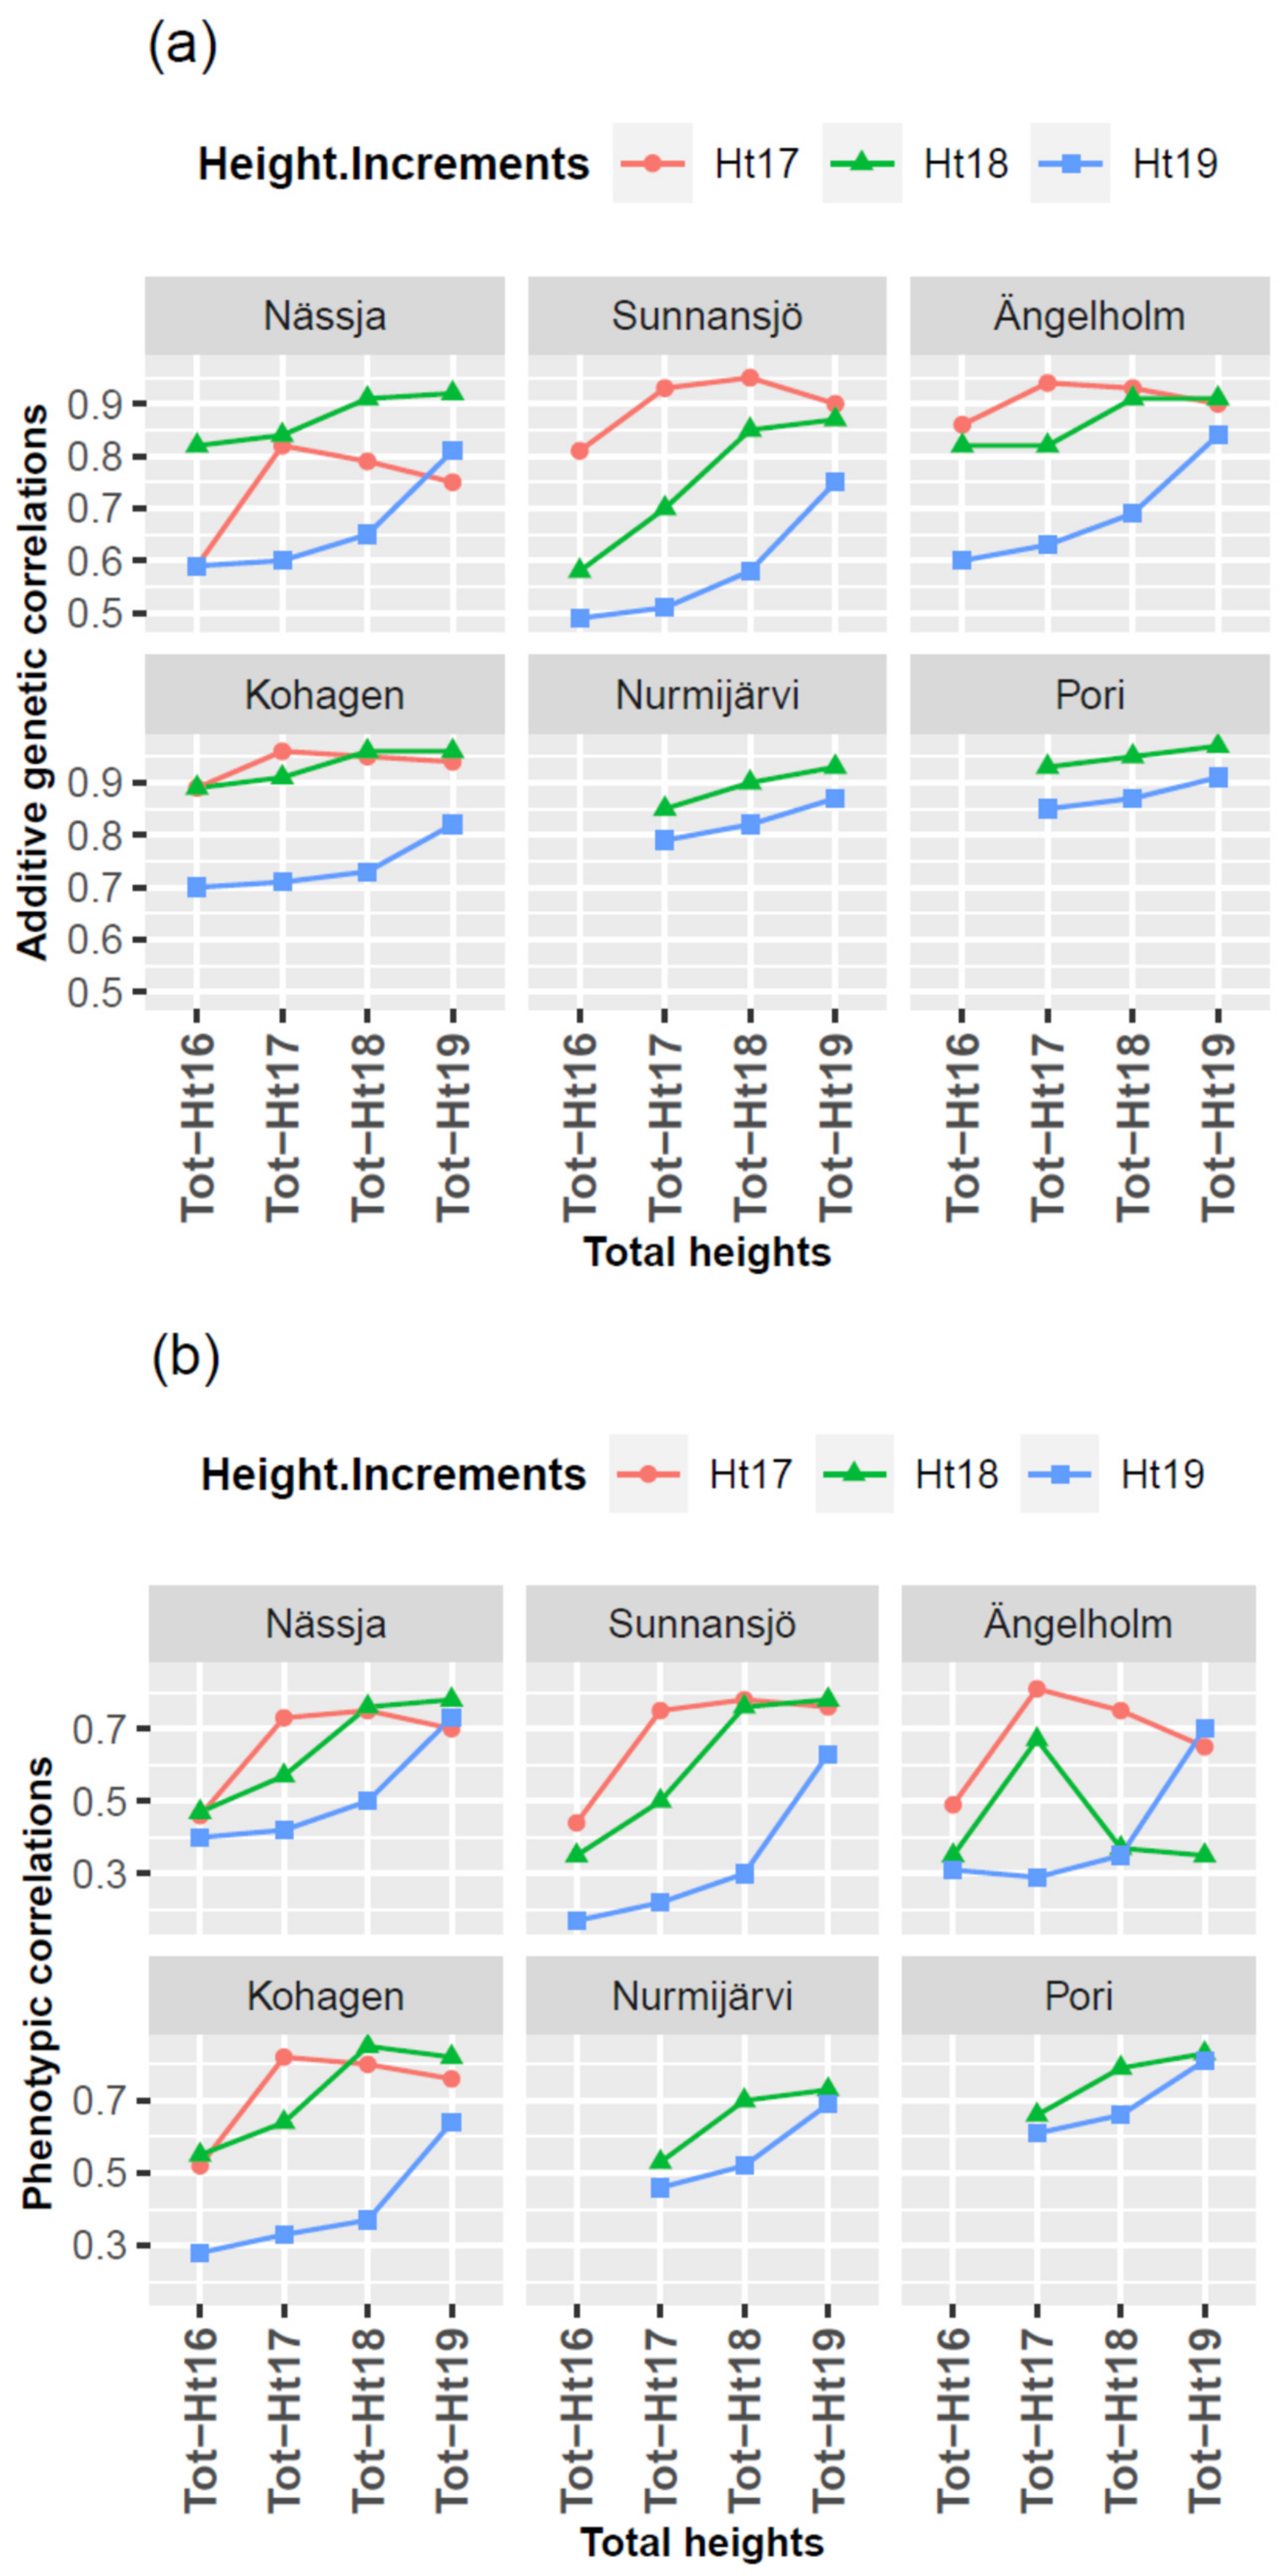
3.4. Genetic and Phenotypic Correlations

The additive genetic ( r A ) and phenotypic   ( r P ) correlations of the annual height increments (Ht17, Ht18, Ht19 in full-sib and Ht18, Ht19 in half-sib trials) with total-height traits are shown in Figure 4. In all of the trials, the lowest estimates of r A and r p were consistently found for Ht19 vs. total-height traits.
Among the full-sib trials, the lowest r A of Ht19 with total-height traits was obtained in Sunnansjö where r A of Ht19 with Tot-Ht16 was about 0.5 and increased to about 0.75 for its correlation with Tot-Ht19. Although the r A of Ht19 with Tot-Ht18 and Tot-Ht17 was similarly the lowest in the half-sib trials, the absolute values of the correlation estimates were generally higher than those obtained in the full-sib trials.

3.5. G × E and Type-B Genetic Correlations

The magnitude of the G × E interaction in the traits is presented in Table 4. In general, the type-B genetic correlation ( r b ) varied between zero and one with smaller values indicating a larger G × E interaction. The estimates of the type-B genetic correlations for total-height traits were moderate in all trials, ranging from 0.52 to 0.86. Slightly lower estimates were obtained for the corresponding annual height increments. The lowest estimate ( r b   = 0.23) was obtained for Ht18 in trial pair Ängelholm-Kohagen while the estimates were 0.71 in Nässja-Sunnansjö and 0.48 in Nurmijärvi-Pori.
Moreover, r b estimates for the final heights increased from Tot-Ht16 to Tot-Ht19 in Nässja-Sunnansjö while they decreased in Ängelholm-Kohagen. It was mostly in a similar range from Tot-Ht17 to Tot-Ht19 in the Finnish trials.

4. Discussion

4.1. Drought Index and Annual Height Increments

With the progression of climate change, extreme climate events such as drought and heat events are more likely to occur frequently. During the summer of 2018, the temperature was exceptionally high and precipitations were low in many parts of Europe. The results of our investigation signified a phenotypic and genetic sensitivity to drought stress of spruce trees during the growing season of 2018 as the height increment of trees was mostly similar in 2017 and 2018 but notably faster in 2019. We also observed that drought stress could be an underlying factor for a significant genotype by environment (G × E) interaction, causing rank changes of genotypes across trials.
In trial Sunnansjö, however, the height increment of 2018 was significantly higher than that of 2017 and only slightly smaller than in 2019, although this trial was exposed to drier weather during these three years than the parallel trial in Nässja (Figure 2). Although the Swedish trials were very similar in climatic and edaphic conditions (i.e., soil type, soil texture, soil depth), Sunnansjö was the only trial on a hillside slope. This might mean that the trees had access to more mobile water than the trees on the other trials [37]. This hypothesis was supported by another study that demonstrated that spruce stood on steeper slopes were associated with higher site indices [38]. Comparing the Finnish trials, Pori experienced a drier growing season in 2018 than in 2019 whereas the opposite was true for Nurmijärvi. Nevertheless, the height increments for these years were generally higher in Nurmijärvi, which was established on a field of a more fertile soil type than the Pori trial.
There are indeed various drought indices to examine the impact of water availability on tree growth. The time scale differences between the PDSI and the SPEI for drought monitoring have been the subject of investigations. It has been evidenced that the PDSI can capture mid- and long-term drought signals owing to the strong lagged autocorrelation whereas the SPEI can be qualified as a short- and long time scale drought-monitoring index [39]. Similarly, when considered for a one month time scale, closer growth-drought correlations were indicated for the SPI and the SPEI compared with the PDSI [40].
The findings of one investigation quantifying the growth response of nine different tree species across Europe to various drought indices revealed distinct species-specific, elevation- specific and bioclimatic-specific patterns [23]. For instance, for the same species, those stood at higher elevations were less drought sensitive compared with those at lower elevations. Additionally, of the different drought indices tested, the results revealed that the response to drought for Norway spruce in temperate climates was best captured by the long-term drought indices SPI and SPEI from March to September while in continental climates, a short-term drought during early growing seasons is the best representative [23].
In general, the growing season is relatively short in Finland and Sweden, starting in late May and ceasing in July, with the majority of growth occurring in June [16]. Moreover, in early spring, the soil is still frozen in a few areas; thus, in this study, we used the period from May to July to calculate the SPEI with a one month time scale.

4.2. Genetic Variance Components and Heritability Estimates

Our results demonstrated that there was a significant genetic variation in all studied growth traits in all sites except for h i 2 of Ht19 in Sunnansjö. The genetic parameter estimates for the height growth in the Norway spruce genetic tests established between 1992 and 2006 in Sweden were reviewed [41]. The results showed moderate narrow-sense and broad-sense heritability estimates ( h i 2   ¯   = 0.29 and H i 2   ¯ = 0.18, respectively) in the studied sites [41].
In general, the heritability estimates in this study were lower for the height increments compared with the accumulative final heights but still in a similar range with the recent heritability estimates reported for Norway spruce clonal trials in Sweden [33,42]. However, h i 2 and H i 2 were unexpectedly high for the drought year (Ht18) in Kohagen. The trees in Kohagen were visibly damaged by drought. It is probable that the genetic differences in drought tolerance indirectly affected the growth responses, inflating the additive genetic variance and resulting in more pronounced growth differences among genotypes. This signifies a high capacity and sufficient genetic variation among trees for significant shifts in response to drought stresses [43].
The lowest additive genetic and phenotypic correlations were obtained for correlations of the height increment in 2019 (Ht19) with total-height traits in all of the trials. This indicated that the carry-over effects of the 2018 drought stress might have negatively influenced the recovery of the trees in 2019. One possible explanation for this might be that the height and radial increment in most conifers is mainly predetermined during the year previous to the growth [44]. There was also an obvious structural reason; with the cessation of growth and bud set, the newly formed bud starts to form needle primordia for the next growing season whereafter it enters an endodormant state [45].

4.3. G × E and Type-B Genetic Correlations

The genotype by environment (G × E) interaction plays a significant role in the design of breeding programs and the resulting genetic gains. The interactions of genotypes with environments are more pronounced when there are large changes in climates or soils [46].
In Sweden, the patterns of the G × E interaction and their significance for Norway spruce breeding have been widely investigated. In almost all of these reports, frost damage was considered as the main driver of the G × E in southern and central Sweden [47,48,49]. The study by Berlin et al. (2014) reported a low to moderate G × E interaction with an average of 0.72 site-site type-B genetic correlation ( r b ) in 65 Norway spruce trials in southern Sweden while Karlsson and Högberg (1998) observed a value of 0.54 for the tree height in several clonal trials at the age of 11 [48].
The r b values obtained for the growth traits in our study were mostly in a similar range with those reported for the growth of Norway spruce in other investigations. However, the G × E was unusually high for the drought year in the southern Swedish trials (Ängelholm-Kohagen). Additionally, the correlations became weaker as trees became more mature in these trials whereas this was not observed for the trials in central Sweden. In general, the trial pairs investigated in this study shared mostly similar edaphic and climatic conditions based on the recorded data from 1961 to 2007 (Table 1) except that the mean annual precipitation was much lower in Kohagen compared with Ängelholm. Based on the observed SPEI results and also the documented drought damages in Kohagen, it was conceived that the drought of 2018 might be the main underlying factor to the cause of the high and undesirable G × E observed in these trial pairs.

5. Conclusions

This study aimed to evaluate the drought sensitivity of Norway spruce in terms of height increment of trees at early ages from a tree breeding perspective. Given the projected occurrence of more frequent and severe drought events as well as the high sensitivity of Norway spruce to drought, our results suggested that drought tolerance should be regarded as an important trait for successful regeneration and high productivity of this species. As such, a selection of drought-resistant genotypes, while having a good growth capacity, is of great importance for Norway spruce future breeding programs. Although our investigation gave an insight into an improved understanding of drought impacts, the long-term reaction of trees should be further tested using larger temporal and geographical scales.

Supplementary Materials

The following are available online at https://www.mdpi.com/article/10.3390/f12040498/s1. Figure S1. Schematic picture of one the Swedish trials. Table S1. Genetic parameters with standard errors in parenthesis for hight measurements in four full-sib clonal trials. Table S2. Genetic parameters with standard errors in parenthesis for hight measurements in two half-sib clonal trials.

Author Contributions

Conceptualization, M.B., A.H. and H.H.; methodology, H.H., M.B., J.L. and A.H.; software, H.H.; validation, M.B., M.H. and A.H.; formal analysis, H.H.; investigation, H.H.; data curation, A.H., M.B. and M.H.; writing—original draft preparation, H.H.; writing—review and editing, M.H., J.L., M.B., A.H. and K.K.; visualization, H.H. and J.L.; supervision, M.B., A.H., M.H. and K.K.; project administration, A.H.; funding acquisition, A.H. All authors have read and agreed to the published version of the manuscript.

Funding

This research was financially supported by Föreningen Skogsträdförädling, The Royal Swedish Academy of Agriculture and Forestry (KSLA) under the “Tandem Forest Values Programme” and the European Union Horizon 2020 research and innovation program under grant agreement No 773383 374 (B4EST project).

Informed Consent Statement

Not applicable for this study.

Data Availability Statement

MDPI Research Data Policies.

Acknowledgments

The authors thank research funding from Föreningen Skogsträdförädling, The Royal Swedish Academy of Agriculture and Forestry (KSLA) and the European Union Horizon 2020 (B4EST Project).

Conflicts of Interest

The authors declare no conflict of interest.

References

  1. Ryan, M.G. Tree responses to drought. Tree Physiol. 2011, 31, 237–239. [Google Scholar] [CrossRef] [Green Version]
  2. Lindner, M.; Maroschek, M.; Netherer, S.; Kremer, A.; Barbati, A.; Garcia-Gonzalo, J.; Seidl, R.; Delzon, S.; Corona, P.; Kolström, M.; et al. Climate change impacts, adaptive capacity, and vulnerability of European forest ecosystems. For. Ecol. Manag. 2010, 259, 698–709. [Google Scholar] [CrossRef]
  3. Allen, C.D.; Macalady, A.K.; Chenchouni, H.; Bachelet, D.; McDowell, N.; Vennetier, M.; Kitzberger, T.; Rigling, A.; Breshears, D.D.; Hogg, E.T.; et al. A global overview of drought and heat-induced tree mortality reveals emerging climate change risks for forests. For. Ecol. Manag. 2010, 259, 660–684. [Google Scholar] [CrossRef] [Green Version]
  4. Huang, M.; Wang, X.; Keenan, T.F.; Piao, S. Drought timing influences the legacy of tree growth recovery. Glob. Chang. Biol. 2018, 24, 3546–3559. [Google Scholar] [CrossRef] [PubMed] [Green Version]
  5. Bréda, N.; Huc, R.; Granier, A.; Dreyer, E. Temperate forest trees and stands under severe drought: A review of ecophysiological responses, adaptation processes and long-term consequences. Ann. For. Sci. 2006, 63, 625–644. [Google Scholar] [CrossRef] [Green Version]
  6. Moran, E.; Lauder, J.; Musser, C.; Stathos, A.; Shu, M. The genetics of drought tolerance in conifers. New Phytol. 2017, 216, 1034–1048. [Google Scholar] [CrossRef] [PubMed] [Green Version]
  7. Trujillo-Moya, C.; George, J.-P.; Fluch, S.; Geburek, T.; Grabner, M.; Karanitsch-Ackerl, S.; Konrad, H.; Mayer, K.; Sehr, E.M.; Wischnitzki, E.; et al. Drought sensitivity of Norway spruce at the species’ warmest fringe: Quantitative and molecular analysis reveals high genetic variation among and within provenances. G3 Genes Genomes Genet. 2018, 8, 1225–1245. [Google Scholar] [CrossRef] [Green Version]
  8. Peña-Gallardo, M.; Vicente-Serrano, S.M.; Camarero, J.J.; Gazol, A.; Sánchez-Salguero, R.; Domínguez-Castro, F.; El Kenawy, A.; Beguería-Portugés, S.; Gutiérrez, E.; De Luis, M. Drought sensitiveness on forest growth in peninsular Spain and the Balearic Islands. Forests 2018, 9, 524. [Google Scholar] [CrossRef] [Green Version]
  9. Hannrup, B.; Cahalan, C.; Chantre, G.; Grabner, M.; Karlsson, B.; Bayon, I.L.; Jones, G.L.; Müller, U.; Pereira, H.; Rodrigues, J.C. Genetic parameters of growth and wood quality traits in Picea abies. Scand. J. For. Res. 2004, 19, 14–29. [Google Scholar] [CrossRef]
  10. Cermák, P.; Kolář, T.; Žid, T.; Trnka, M.; Rybníček, M. Norway spruce responses to drought forcing in areas affected by forest decline. For. Syst. 2019, 28, 4. [Google Scholar]
  11. Van der Maaten-Theunissen, M.; Kahle, H.-P.; van der Maaten, E. Drought sensitivity of Norway spruce is higher than that of silver fir along an altitudinal gradient in southwestern Germany. Ann. For. Sci. 2013, 70, 185–193. [Google Scholar] [CrossRef] [Green Version]
  12. Rosner, S.; Gierlinger, N.; Klepsch, M.; Karlsson, B.; Evans, R.; Lundqvist, S.-O.; Světlík, J.; Børja, I.; Dalsgaard, L.; Andreassen, K. Hydraulic and mechanical dysfunction of Norway spruce sapwood due to extreme summer drought in Scandinavia. For. Ecol. Manag. 2018, 409, 527–540. [Google Scholar] [CrossRef]
  13. Rybníček, M.; Čermák, P.; Žid, T.; Kolář, T. Radial growth and health condition of Norway spruce (Picea abies (L.) Karst.) stands in relation to climate (Silesian Beskids, Czech Republic). Geochronometria 2010, 36, 9–16. [Google Scholar] [CrossRef] [Green Version]
  14. Nilsson, U.; Örlander, G. Effects of regeneration methods on drought damage to newly planted Norway spruce seedlings. Can. J. For. Res. 1995, 25, 790–802. [Google Scholar] [CrossRef]
  15. Solberg, S. Summer drought: A driver for crown condition and mortality of Norway spruce in Norway. For. Pathol. 2004, 34, 93–104. [Google Scholar] [CrossRef]
  16. Mäkinen, H.; Nöjd, P.; Mielikäinen, K. Climatic signal in annual growth variation in damaged and healthy stands of Norway spruce [Picea abies (L.) Karst.] in southern Finland. Trees 2001, 15, 177–185. [Google Scholar] [CrossRef]
  17. Sonesson, J.; Eriksson, G. Genetic variation in drought tolerance in Picea abies seedlings and its relationship to growth in controlled and field environments. Scand. J. For. Res. 2003, 18, 7–18. [Google Scholar] [CrossRef]
  18. Savolainen, O.A.; Hurme, P.K. Conifers from the cold. In Environmental Stress, Adaptation and Evolution; Springer: Berlin/Heidelberg, Germany, 1997; pp. 43–62. [Google Scholar]
  19. Zhou, L.; Chen, Z.; Lundqvist, S.-O.; Olsson, L.; Grahn, T.; Karlsson, B.; Wu, H.X.; García-Gil, M.R. Genetic analysis of wood quality traits in Norway spruce open-pollinated progenies and their parent plus trees at clonal archives and the evaluation of phenotypic selection of plus trees. Can. J. For. Res. 2019, 49, 810–818. [Google Scholar] [CrossRef]
  20. Chen, Z.-Q.; Gil, M.R.G.; Karlsson, B.; Lundqvist, S.-O.; Olsson, L.; Wu, H.X. Inheritance of growth and solid wood quality traits in a large Norway spruce population tested at two locations in southern Sweden. Tree Genet. Genomes 2014, 10, 1291–1303. [Google Scholar] [CrossRef]
  21. Yang, M.; Yan, D.; Yu, Y.; Yang, Z. SPEI-based spatiotemporal analysis of drought in Haihe River Basin from 1961 to 2010. Adv. Meteorol. 2016, 2016, 7658015. [Google Scholar] [CrossRef] [Green Version]
  22. Vicente-Serrano, S.M.; Beguería, S.; López-Moreno, J.I. A multiscalar drought index sensitive to global warming: The standardized precipitation evapotranspiration index. J. Clim. 2010, 23, 1696–1718. [Google Scholar] [CrossRef] [Green Version]
  23. Bhuyan, U.; Zang, C.; Menzel, A. Different responses of multispecies tree ring growth to various drought indices across Europe. Dendrochronologia 2017, 44, 1–8. [Google Scholar] [CrossRef]
  24. Li, B.; Zhou, W.; Zhao, Y.; Ju, Q.; Yu, Z.; Liang, Z.; Acharya, K. Using the SPEI to assess recent climate change in the Yarlung Zangbo River Basin, South Tibet. Water 2015, 7, 5474–5486. [Google Scholar] [CrossRef] [Green Version]
  25. Schuldt, B.; Buras, A.; Arend, M.; Vitasse, Y.; Beierkuhnlein, C.; Damm, A.; Gharun, M.; Grams, T.E.; Hauck, M.; Hajek, P.; et al. A first assessment of the impact of the extreme 2018 summer drought on Central European forests. Basic Appl. Ecol. 2020, 45, 86–103. [Google Scholar] [CrossRef]
  26. Wulff, S.; Roberge, C. Nationell Riktad Skogssadeinventering (NRS)—Inventering av Granbarkborreangrepp i Götaland och Svealand 2020; Institutionen för Skoglig Resurshushållning: Umeå, Sweden, 2021. [Google Scholar]
  27. Perttu, K.; Morén, A.-S. Regional Temperature and Radiation Indices and Their Adjustment to Horizontal and Inclined Forest Land; Faculty of Forestry, Swedish University of Agricultural Sciences: Uppsala, Sweden, 1994. [Google Scholar]
  28. Bärring, L.; Berlin, M.; Andersson Gull, B. Tailored climate indices for climate-proofing operational forestry applications in Sweden and Finland. Int. J. Climatol. 2017, 37, 123–142. [Google Scholar] [CrossRef] [Green Version]
  29. Jin, X.; Qiang, H.; Zhao, L.; Jiang, S.; Cui, N.; Cao, Y.; Feng, Y. SPEI-based analysis of spatio-temporal variation characteristics for annual and seasonal drought in the Zoige Wetland, Southwest China from 1961 to 2016. Theor. Appl. Climatol. 2020, 139, 711–725. [Google Scholar] [CrossRef]
  30. Team, R.C. A Language and Environment for Statistical Computing; R Foundation for Statistical Computing: Vienna, Austria, 2016; Available online: www.R-project.org/ (accessed on 19 October 2019).
  31. Vicente-Serrano, S.M.; Camarero, J.J.; Azorin-Molina, C. Diverse responses of forest growth to drought time-scales in the N orthern H emisphere. Glob. Ecol. Biogeogr. 2014, 23, 1019–1030. [Google Scholar] [CrossRef] [Green Version]
  32. Dutkowski, G.W.; Silva, J.C.E.; Gilmour, A.R.; Lopez, G.A. Spatial analysis methods for forest genetic trials. Can. J. For. Res. 2002, 32, 2201–2214. [Google Scholar] [CrossRef]
  33. Berlin, M.; Jansson, G.; Högberg, K.-A.; Helmersson, A. Analysis of non-additive genetic effects in Norway spruce. Tree Genet. Genomes 2019, 15, 42. [Google Scholar] [CrossRef]
  34. Burdon, R. Genetic correlation as a concept for studying genotype-environment interaction in forest tree breeding. Silvae Genet 1977, 26, 168–175. [Google Scholar]
  35. Gilmour, A.; Gogel, B.; Cullis, B.; Thompson, R. ASReml User Guide Release 4.0; VSN International Ltd.: Hemel Hempstead, UK, 2014. [Google Scholar]
  36. Malosetti, M.; Ribaut, J.-M.; van Eeuwijk, F.A. The statistical analysis of multi-environment data: Modeling genotype-by-environment interaction and its genetic basis. Front. Physiol. 2013, 4, 44. [Google Scholar] [CrossRef] [Green Version]
  37. Hägglund, B.; Lundmark, J.-E. Site Index Estimation by Means of Site Properties; Skogshögskolanc: Stockholm, Sweden, 1977. [Google Scholar]
  38. Sharma, R.P.; Brunner, A.; Eid, T. Site index prediction from site and climate variables for Norway spruce and Scots pine in Norway. Scand. J. For. Res. 2012, 27, 619–636. [Google Scholar] [CrossRef]
  39. Zhao, H.; Gao, G.; An, W.; Zou, X.; Li, H.; Hou, M. Timescale differences between SC-PDSI and SPEI for drought monitoring in China. Phys. Chem. Earthparts A/B/C 2015, 102, 48–58. [Google Scholar] [CrossRef]
  40. Vicente-Serrano, S.M.; Beguería, S.; Lorenzo-Lacruz, J.; Camarero, J.J.; López-Moreno, J.I.; Azorin-Molina, C.; Revuelto, J.; Morán-Tejeda, E.; Sanchez-Lorenzo, A. Performance of drought indices for ecological, agricultural, and hydrological applications. Earth Interact. 2012, 16, 1–27. [Google Scholar] [CrossRef] [Green Version]
  41. Kroon, J.; Ericsson, T.; Jansson, G.; Andersson, B. Patterns of genetic parameters for height in field genetic tests of Picea abies and Pinus sylvestris in Sweden. Tree Genet. Genomes 2011, 7, 1099–1111. [Google Scholar] [CrossRef]
  42. Chen, Z.-Q.; Hai, H.N.T.; Helmersson, A.; Liziniewicz, M.; Hallingbäck, H.R.; Fries, A.; Berlin, M.; Wu, H.X. Advantage of clonal deployment in Norway spruce (Picea abies (L.) H. Karst). Ann. For. Sci. 2020, 77, 1–15. [Google Scholar] [CrossRef] [Green Version]
  43. Richards, T.J.; Karacic, A.; Apuli, R.-P.; Weih, M.; Ingvarsson, P.K.; Rönnberg-Wästljung, A.C. Quantitative genetic architecture of adaptive phenology traits in the deciduous tree, Populus trichocarpa (Torr. and Gray). Heredity 2020, 125, 449–458. [Google Scholar] [CrossRef]
  44. Rubio-Cuadrado, Á.; Bravo-Oviedo, A.; Mutke, S.; Del Río, M. Climate effects on growth differ according to height and diameter along the stem in Pinus pinaster Ait. iForest-Biogeosci. For. 2018, 11, 237–242. [Google Scholar] [CrossRef]
  45. Gyllenstrand, N.; Clapham, D.; Källman, T.; Lagercrantz, U.; Richardt, S.; Lang, D.; Reski, R.; Frank, W.; Rensing, S.A. A Norway spruce FLOWERING LOCUS T homolog is implicated in control of growth rhythm in conifers. Plant Physiol. 2007, 144, 248–257. [Google Scholar] [CrossRef] [PubMed] [Green Version]
  46. White, T.L.; Adams, W.T.; Neale, D.B. Forest Genetics; CABI: Wallingford, UK, 2007. [Google Scholar]
  47. Chen, Z.-Q.; Karlsson, B.; Wu, H.X. Patterns of additive genotype-by-environment interaction in tree height of Norway spruce in southern and central Sweden. Tree Genet. Genomes 2017, 13, 25. [Google Scholar] [CrossRef] [Green Version]
  48. Karlsson, B.; Högberg, K. Genotypic parameters and clone x site interaction in clone tests of Norway spruce (Picea abies (L.) Karst.). For. Genet. 1998, 5, 21–30. [Google Scholar]
  49. Berlin, M.; Jansson, G.; Högberg, K.-A. Genotype by environment interaction in the southern Swedish breeding population of Picea abies using new climatic indices. Scand. J. For. Res. 2014, 30, 112–121. [Google Scholar] [CrossRef]
Figure 1. Location of the trials.
Forests 12 00498 g001
Figure 2. The Standardized Precipitation-Evapotranspiration Index (SPEI) based on a one-month time scale (SPEI1 May to July) for each pair of trials. The positive and negative SPEI1 values indicate wet and dry periods, respectively. Trials within the same breeding zone are presented in one figure.
Forests 12 00498 g002
Figure 3. Boxplots of the annual height increment of the years 2017, 2018 and 2019 (Ht17, Ht18, Ht19) in six full-sib and half-sib clonal trials of Norway spruce in Sweden and Finland.
Forests 12 00498 g003
Figure 4. Estimated additive genetic (a) and phenotypic (b) correlation of three years of height increment measurements with total heights in six full-sib and half-sib trials.
Forests 12 00498 g004
Table 1. Details for the six clonal trials in Sweden and Finland.
DetailsSwedish Trials Finnish Trials
TrialNässjaSunnansjöÄngelholmKohagenNurmijärviPori
Latitude (N) 60.2760.1756.3557.6260.5061.65
Longitude (E)16.7914.9713.0215.4724.7121.73
Altitude (m)8117517016510020
Soil typePodzol, morainPodzol, sandy morainPodzol, morainPodzol, morainClayey fine siltFine sand
a Tsum (°C) 1337.31216.71414.61407.71298.31264.4
b MAP (mm)648.3757.21189.7643.4579.7538.2
No. of clones21212120260026011062931
No. of families575784859696
Average No. of ramets/clone3.993.953.313.325.997.98
Average No. of clones/family37.237.230.930.61010
Type of materialFull-sibFull-sibFull-sibFull-sibHalf-sibHalf-sib
a Temperature sum (calculated as degree-days with 5 °C as threshold [27]). b Mean annual precipitation. These variables were obtained based on climate indices for operational forestry in Sweden and Finland from 1961–2007 [28].
Table 2. Genetic parameters with standard errors in parenthesis for height measurements in four full-sib clonal trials.
Traits σ c 2 σ A 2 h i 2 H i 2
Nässja
Ht179.75 (2.70)16.90 (2.10)0.10 (0.03)0.26 (0.02)
Ht184.4 (3.30)20.60 (2.40)0.04 (0.03)0.23 (0.01)
Ht1920.2 (5.50)18.20 (3.90)0.10 (0.03)0.20 (0.02)
Tot-Ht1622.76 (11.30)78.42 (8.40)0.06 (0.03)0.26 (0.02)
Tot-Ht1750.3 (21.50)147.55 (15.40)0.07 (0.03)0.29 (0.02)
Tot-Ht1877.51 (38.40)252.28 (26.30)0.07 (0.03)0.30 (0.02)
Tot-Ht19136.9 (65.50)370.30 (43.20)0.07 (0.03)0.29 (0.02)
Sunnansjö
Ht178.3 (5.60)20.90 (3.40)0.05 (0.04)0.22 (0.02)
Ht1815.0 (6.60)28.73 (4.40)0.07 (0.03)0.20 (0.01)
Ht19* 0.0043.4 (3.30)* 0.000.20 (0.01)
Tot-Ht1626.50 (12.50)75.60 (8.80)0.06 (0.03)0.23 (0.01)
Tot-Ht1757.05 (30.0)152.00 (18.90)0.07 (0.03)0.27 (0.02)
Tot-Ht18102.10 (55.50)270.90 (34.50)0.07 (0.04)0.27 (0.02)
Tot-Ht19185.20 (87.70)462.80 (55.50)0.07 (0.03)0.27 (0.01)
Ängelholm
Ht1712.73 (4.48)18.87 (2.89)0.09 (0.03)0.32 (0.02)
Ht1820.15 (5.29)18.52 (3.21)0.15 (0.04)0.29 (0.02)
Ht1936.89 (11.55)58.79 (7.25)0.12 (0.04)0.23 (0.01)
Tot-Ht1661.95 (15.68)31.32 (8.72)0.21 (0.05)0.33 (0.02)
Tot-Ht17123.73 (34.2)88.27 (19.14)0.19 (0.05)0.35 (0.02)
Tot-Ht18236.33 (63.0)171.3 (34.67)0.23 (0.05)0.42(0.02)
Tot-Ht19400.54 (112.19)389.02 (62.04)0.23 (0.06)0.49 (0.02)
Kohagen
Ht1722.46 (7.20)21.45 (4.51)0.10 (0.03)0.22 (0.02)
Ht18110.39 (23.39)22.52 (12.65)0.29 (0.05)0.35 (0.02)
Ht1936.75 (10.59)46.55 (7.06)0.10 (0.03)0.24 (0.02)
Tot-Ht16131.85 (31.24)19.43 (16.61)0.29 (0.06)0.34 (0.02)
Tot-Ht17283.47 (72.68)78.56 (38.70)0.27 (0.06)0.37 (0.02)
Tot-Ht18729.72 (168.50)159.03 (89.30)0.32 (0.06)0.41 (0.02)
Tot-Ht191040.83(241.49)344.57 (129.05)0.31 (0.06)0.43 (0.02)
* Standard errors for parameter estimates at zero were not available due to ASReml parameter restrictions.
Table 3. Genetic parameters with standard errors in parenthesis for height measurements in two half-sib clonal trials.
Traits σ A 2 σ C 2 h i 2 H i 2
Nurmijärvi
Ht1848.57 (11.01)20.12 (7.00)0.17 (0.04)0.24 (0.02)
Ht1966.78 (13.46)1.39 (7.75)0.21 (0.04)0.21 (0.02)
Tot-Ht17815.95 (177.58)563.00 (111.04)0.26 (0.05)0.44 (0.02)
Tot-Ht181197.30 (257.50)763.46 (159.40)0.27 (0.05)0.44 (0.02)
Tot-Ht191796.11 (378.12)951.01 (229.16)0.28 (0.05)0.43 (0.02)
Pori
Ht1842.11 (10.85)23.80 (7.34)0.13 (0.03)0.20 (0.02)
Ht1976.19 (17.35)23.24 (10.80)0.18 (0.04)0.24 (0.02)
Tot-Ht17642.20 (166.80)652.23 (113.40)0.18 (0.04)0.36 (0.02)
Tot-Ht18983.60 (252.20)943.90 (170.10)0.18 (0.04)0.36 (0.02)
Tot-Ht191634.96 (434.83)2047.83 (303.38)0.17 (0.04)0.39 (0.02)
Table 4. Estimated type-B of additive genetic correlations ( r b ) with standard errors in parenthesis, estimated additive genetic variance ( σ G 2 ) and residual variance ( σ ε 2 ) (which includes the true G × E and error) for height increments and heights in four full-sib and two half-sib clonal trials.
TraitTrial Pairs
Nässja-SunnansjöÄngelholm-KohagenNurmijärvi-Pori
r b σ G 2 , σ ε 2 r b σ G 2 , σ ε 2 r b σ G 2 , σ ε 2
Ht170.69 (0.11)9.7, 4.320.59 (0.11)13.6, 9.4--
Ht180.71 (0.11)11.3, 4.60.23 (0.13)14.6, 54.20.48 (0.11)22.4, 23.8
Ht190.79 (0.09)16.5, 4.30.35 (0.15)15.4, 28.70.44 (0.10)25.8, 35.7
Tot-Ht160.72 (0.11)26.3, 10.10.70 (0.08)79.7, 33.8--
Tot-Ht170.78 (0.09)65.4, 18.40.67 (0.08)168.9, 83.30.66 (0.09)506, 256.10
Tot-Ht180.82 (0.08)127.2, 27.70.54 (0.10)296.5, 262.70.63 (0.10)726.8, 421.1
Tot-Ht190.86 (0.06)212.1, 35.80.52 (0.62)437.3, 404.50.62 (0.10)1099.2, 690
Publisher’s Note: MDPI stays neutral with regard to jurisdictional claims in published maps and institutional affiliations.

